Embed Size (px)
Citation preview
1
Transit Efficiency & Effectiveness:
Is There Another Way to Skin the Cat?
Commission WorkshopSteve Heminger
May 25, 2006

2
Why should MTC care?

3
Four Areas to Consider
1. Performance Standards
2. Service Rationalization
3. Consolidation
4. Funding
4
1.Performance Standards:Is a Carrot Just a Stick Painted Orange?

5
Carrots1.Incentive-based funding
allocations
2.Reward operators that meet certain performance thresholds with regional discretionary funds
3.Transit example: FTA capital funds (10% based on ridership)
4.Other example: Housing Incentive Program (HIP)
6
Sticks1.Phase out exceptions from TDA
20% and AB 1107 33% fare box recovery standards
2.Impose new, higher standards on all operators with regular reporting and funding at stake
3.Transit example: RM1 standard for the Harbor Bay Ferry
4.Other example: Transit-Oriented Development (TOD) Policy

7
Risks
1.Carrots: concerns about favoritism, self-fulfilling prophecies
2.Sticks: operators fail to meet standards; cycle of extensions and exceptions begins

8
2.Service Rationalization: Can there be too much of a good thing?

9
Bay Area Discount Fare Policies
Transit OperatorSenior/
Disabled Youth Child
AC Transit 50% 50% (5-17 yrs.)
4 and under free (limit 2)
BART 75% 75% (5-12 yrs.)
4 and under free
Caltrain 50% 50% (5-11 yrs.)
4 and under free (limit 1)
County Connection 66% Same as adult Under 6 free
Golden Gate Transit 50% 25% (6-18 yrs.)
5 and under free (limit 2)
SamTrans 52% 40% (5-17 yrs.)
4 and under free (limit 1)
San Francisco Muni 72% 72% (5-17 yrs.)
Under 5 free
Santa Clara VTA 57% 14% (5-17 yrs.)
Under 5 free
WestCAT 50% Same as adult Under 6 free (limit 2)

10
Overlapping Routes & Services
Examples:
• Transbay (AC, BART, ferries)
• Peninsula (BART, Caltrain, SamTrans)
• East Bay Suburban
• Marin/Sonoma

11
Possible New Directions
1. Fare Integration Study (RM 2)
2. Route Duplication Analysis
3. Consolidated Call Center (Real 511 Operators)
4. Consolidated Procurement: vehicles, fuel, etc.

12
Risks1. Redundancy has its advantages
2. Rider complaints (every route has a customer)
3. Expansion into areas beyond MTC expertise (e.g., procurement)
4. Potential transit employee impacts

13
3.Consolidation: Less is More?

14
Types of Consolidation
1.Functional – see prior item
2.Geographic – Napa example; next stop Solano & Sonoma?
3.Modal – RM2 Regional Rail Plan: Caltrain, Capitols, ACE, Dumbarton Rail
4.Service Area – BART (trunk line) and AC Transit (feeder)

15
Cost ComparisonCost Comparison
Cost/RVH RVHTotal Cost/
Separate RatesTotal Cost @ CCCTA Rates Added Costs
CCCTA $ 79.72 284,000 $ 22,640,480 $ 22,640,480 -
LAVTA $ 75.94 123,000 $ 9,340,620 $ 9,805,560 $464,940
Combined 407,000 $ 31,981,100 $ 32,446,040 $ 464,940
Source:FY2003/04 figures; Statistical Summary of Bay Area Transit Operators
County Connection/LAVTA Consolidation
Potential Savings:•CCCTA access to maintenance facilities in LAVTA service
area could reduce deadhead costs up to $180,000/year.
•Service costs could be reduced with changes in route structure/service rationalization under single operation, but could be offset by labor agreement provisions related to service changes.
•Administration costs could be reduced by eliminating some duplication, but could be offset by costs associated with managing a larger transit system.

16
Other Benefits1.Streamline administration &
overhead
2.More rational service planning & resource allocation
3.Improved hub connectivity (external connections become internal transfers)
4.Less costly regional coordination efforts

17
Risks
1. Political friction with local transit boards and legislative patrons
2. Potential for higher labor costs
3. Increased employee leverage for work stoppages

18
4. Funding: STA Rides to the Rescue?

19
STA Background and History
Proposition 111 approved in 1990• Shifted the % shares of statewide STA between a
“revenue based” formula and a “population based” formula
• Revenue-based and Population-based funds were distributed 30%/70% -- Prop. 111 changed to 50%/50% statewide
• Due to significant transit ridership and dedicated local support to transit, the Bay Area receives a much larger amount of STA revenue-based funds than the region’s share of statewide population.
• Consequently, Prop. 111 resulted in a 51% increase in combined STA funds to the Bay Area.

20
STA: Bay Area’s Share over TimeBefore and After Prop. 111
Population-Based $9.2 million to $8.0 million: Decreased 13%Revenue-Based $11.2 million to $22.8 million: Increased
104%
Combined Change: Increased 51%
Revenue-Based Funds
-
10
20
30
40
50
Past Prop. 111
$ i
n M
illi
on
s
Population-Based Funds
-
10
20
30
40
50
Past Prop. 111
$ i
n M
illi
on
s
StatewideBay Area
StatewideBay Area

21
STA Policy in ResponseTo address the change in state law, MTC
“shared” its population based funds with the small operators, with the adoption of Resolution No. 2310 in 1991. Funds distributed as follows:Northern countiesSmall operators and VallejoADA paratransitBalance goes to MTC Regional Coordination
Program
Original intent was to provide small operators chance to grow, since Prop. 111 created big bump for larger operators

22
Small Operators Growth – At a Glance
Small Operators FY 1992 Budget
FY 2006 Budget
Average Annual Growth
Carryover as % of FY 2006 Budget
CCCTA 14,906,900 27,252,479 6% 12%Tri-Delta 1,941,800 15,740,322 51% 56%LAVTA 3,831,100 11,112,373 14% 8%Union City 1,167,000 2,936,016 11% 118%WestCAT 931,300 6,859,000 45% 39%Vallejo 3,536,000 11,158,661 15% 5%Other Operators 12,171,771 40,763,043 17% N/ ATotal 38,485,871 75,058,851 7% N/ A
• Assumed feeder service from BART and expanded into express bus operations
• Strong overall growth in operating budgets due to growth in economy and gas prices (sources of TDA/STA funds)
• Considerable carry-over balances in TDA and STA for some operators
23
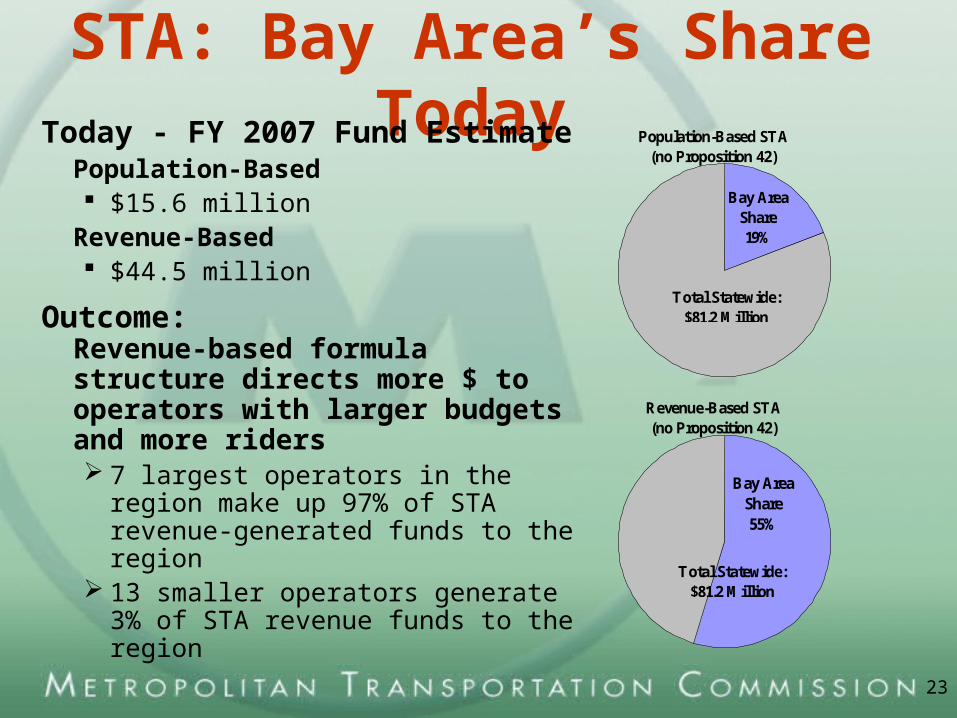
STA: Bay Area’s Share TodayToday - FY 2007 Fund Estimate
Population-Based $15.6 million
Revenue-Based $44.5 million
Outcome:Revenue-based formula structure directs more $ to operators with larger budgets and more riders 7 largest operators in the region
make up 97% of STA revenue-generated funds to the region
13 smaller operators generate 3% of STA revenue funds to the region
Revenue-Based STA (no Proposition 42)
Bay Area Share55%
Total Statewide: $81.2 Million
Population-Based STA (no Proposition 42)
Bay Area Share19%
Total Statewide: $81.2 Million

24
STA Policy – Stay the Course for Base
Consideration given to changed policy for base STA Population-Based funds:• Simplifying process• More flexibility: consolidate categories• Standardizing growth over time to CPI• Providing additional increment of funding for
transit coordination/consolidation efforts
Negative feedback from operators on any change, especially CPI growth standard
Staff has withdrawn proposal

25
STA Policy – Proposition 42 Increment
• Proposition 42 dedicated the sales tax on gasoline for transportation purposes.
• It generated new revenue for the STA program statewide, including $280 million in population-based funds for Bay Area over 25 years.
• Commission responded to this new revenue by adopting a different policy for the Prop. 42 increment in Transportation 2030.
• $104 million goes to build/operate TransLink® program and remaining $176 million is dedicated to Lifeline Program.

26
STA Policy –
Infrastructure Bond
(Revenue and Population Factors provided by State Controller for FY07 Fund Estimate - subject to change)
Apportionment JurisdictionsRevenueEstimate
Alameda CMA - Corresponding to ACE 1,777,814 Benicia 165,343 Caltrain 40,427,243 CCCTA 5,724,703 Dixon 40,059 ECCTA 2,678,815 Fairfield 692,075 GGBHTD 40,042,443 Healdsburg 11,092 LAVTA 1,735,640 NCPTA 424,896 SamTrans 47,285,569 Santa Rosa 1,030,716 Sonoma County Transit 1,093,614 Union City 432,549 Vallejo 5,215,385 VTA 144,195,873 VTA - Corresponding to ACE 2,427,299 WestCAT 3,022,757 SUBTOTAL 298,423,885 AC Transit 106,897,001 BART 245,774,375 Muni 336,026,922 SUBTOTAL 688,698,298 TOTAL - REVENUE-BASED 987,122,183 TOTAL - POPULATION-BASED 347,017,407
GRAND TOTAL - STA for MTC Region 1,334,139,591
Bay Area Share of $3.6 Billion Bond Funding
Potential infusion of STA capital revenue:
• $987 million in Revenue-Based funds
• $347 million in Population-Based funds
• Capital onlyCurrent policy does not
address I-Bond generated funds

27
Potential Options for Infrastructure Bond
STA funding ($347 million region-wide)Augment Existing Programs
1. Lifeline- increase Transportation 2030 commitments
• Operations (swap required for operating costs)
• Capital
2. Transit Capital shortfall• AB 664 federal match supplement
3. Resolution 3434: regional funding augmentation for transit extensions
4. TOD/TLC capital or planning funds
5. Regional Express Bus augmentation• Supporting capital facilities
28
Potential Options for Infrastructure Bond
STA funding ($347 million region-wide)New Initiatives
1. Transit consolidation incentives• Operations costs associated with change —
e.g. 13(c) labor agreements (swap required)
• Capital reward
2. Start-up costs for integrated transit fare (swap required)
3. Transit Air Quality initiatives• Zero emission buses
4. Reserve for emergency capital needs (earthquake, service interruptions, etc.)