Embed Size (px)
Citation preview

1
Toward a Predictive Model of Hot Spring Water from Modern and Ancient Travertine1
Depositional Facies2
John Veysey II1, Thomas J. Schickel2, Bruce W. Fouke2, Mike Kandianis2, Roy3
Johnson2 and Nigel Goldenfeld14
1: University of Illinois Department of Physics5
2: University of Illinois Department of Geology6
ABSTRACT7
Over a period of seven years we have collected an extensive data set of the physical,8
chemical, and microbiological attributes of two hot springs located in the Mammoth9
Hot Springs complex of Yellowstone National Park. We report a strong correlation10
between travertine depositional facies and the temperature, pH, and flux of hot spring11
water. Because advection dominates in these hot spring drainage systems, this12
correlation allows identification of controlling processes on a macroscopic scale. This13
provides a basis for the use of facies models to reconstruct modern and ancient14
carbonate aqueous environments. Within the context of the travertine facies, we15
construct a model to define the primary flow path, quantify variability between and16
within springs, and explain two previously reported trends in microbial community17
diversity.18
Key Words:19
Yellowstone National Park20
Travertine Facies21
Calcium carbonate hot springs22

2
Microbial community diversity23
Fluid transport modeling24

3
INTRODUCTION25
The concept of sedimentary depositional facies serves as a fundamental means26
for reconstructing aqueous paleoenvironments from the geological record (Flügel 2004;27
Wilson 1975). However this basic facies concept is broadly defined, contains many28
assumptions about the physics, chemistry, and biology of the environment, and spans29
multiple temporal and spatial scales. The classic definition of facies is based solely on30
specific characteristics of a body of sedimentary rock (Gressly 1838; Reading 1996).31
This original definition has been broadened and is now commonly used to describe the32
environmental processes believed to have formed the sedimentary deposit (Walker33
1984). However, this secondary, interpretive sense of the word facies implicitly34
assumes knowledge of specific environmental conditions at the time of deposition. Yet35
despite the fundamental role of these assumptions, few studies have quantitatively36
examined the aqueous characteristics of modern depositional environments within a37
classic facies context. In this paper, we approach this problem by studying terrestrial hot38
springs, where deposition is so rapid that the connection between the modern facies and39
the aqueous environment can be readily made.40
Most previous studies have included a combination of spring water chemistry,41
calcium carbonate geochemistry (Amundson and Kelly 1987; Folk et al. 1985; Ford and42
Pedley 1996; Friedman 1970; Herman and Lorah 1988; Lu et al. 2000; Pentecost 1990;43
Suarez 1983; Zhang et al. 2001), and controlled lab experiments that quantify44
precipitation dynamics (Busenberg and Plummer 1986; Dreybrodt et al. 1992; Kanakis45
and Dalas 2000; Liu and Dreybrodt 1997; Spanos and Koutsoukos 1998; Usdowski et46

4
al. 1979; Van Cappellen et al. 1993). However, these investigations have generally not47
simultaneously studied modern spring water, microbial communities, and solid CaCO348
in a natural environment. Therefore, the results of these studies are not adequate for49
comparing CaCO3 precipitated in different hot springs (travertine) or reconstructing50
paleoenvironments from ancient travertine.51
In order to justify the environmental assumptions implicit in carbonate facies52
models, our research at Mammoth Hot Springs has analyzed the depositional53
environment within the context of a five-component facies model (Fouke et al. 2000).54
We term these components the vent, apron channel, pond, proximal slope, and distal55
slope facies. These five facies are not specific to Yellowstone hot springs; they have56
been seen throughout the world (e.g., Rapolano Terme, in Tuscany, Italy (Fouke et al.57
2001). In keeping with the original geological definition of facies (Reading 1996), our58
model is based solely on the shape, structure, and chemistry of carbonate deposits on59
the floor of the spring drainage system (Fouke et al. 2000).60
Each facies includes unique travertine features on all length scales. For example,61
on the scale of microns, the apron channel facies is comprised of aragonite needles62
radiating from the outer walls of filamentous bacteria. But on the scale of centimeters to63
meters, this facies is a 1-meter wide channel floored by streamer pavements (Fouke et64
al. 2003; Fouke et al. 2000). Because different processes control carbonate precipitation65
at each scale, we have analyzed the physical, chemical, and microbiological attributes66
of the depositional environment within the following spatial hierarchy: (1)67
“microscopic” on the scale of microns; (2) “mesoscopic” on the scale of millimeters to68

5
centimeters; (3) “macroscopic” on a scale of meters to 10s of meters; and, (4) “system69
level” on the scale larger than 10s of meters. Each facies which we have defined70
incorporates the first 3 levels of spatial description, whereas the systems level scale71
includes all five facies.72
Our previous investigations have examined microbial community structure and73
metabolic activities on length scales ranging from microns to 10s of meters (Fouke et al.74
2003; Fouke et al. 2000). In addition, petrography has identified unique travertine75
features over the same length scales. Although aqueous and isotopic chemistry have76
suggested that CO2 degassing is the dominant control on systems-level spring water77
evolution (Fouke et al. 2000; Fouke et al. 2001), petrography has demonstrated that78
microscopic processes can be expressed on a macroscopic scale. For example, in the79
apron channel facies, aragonite needle crystals encrust filamentous Aquificales bacteria80
(Fouke et al. 2003; Fouke et al. 2000), resulting in millimeter-wide travertine streamers81
that grow to meters in length. These travertine streamers aggregate to create the unique82
pavement which floors the entire apron channel.83
In this paper we examine aqueous chemistry on the macroscopic scale and84
demonstrate that pH, temperature, and flux are sufficient to differentiate macroscopic85
patterns in calcium carbonate crystallization. We also define the concept of a primary86
flow path as means of connecting the macroscopic aqueous environment to smaller87
length scales. We quantify fluctuations in spring water pH, temperature, and flux, and88
demonstrate that these parameters are strongly correlated with the underlying89
depositional facies. Finally, we use our observations to explain two previously observed90

6
trends in microbial diversity and community structure (Bonheyo et al. 2006; Fouke et91
al. 2003). Our new results rigorously justify using facies models to characterize92
depositional environments, and demonstrate that they may be used to reconstruct the93
macroscopic chemical and physical properties of modern and ancient aqueous94
environments.95
GEOLOGIC SETTING96
Mammoth Hot Springs, which lies on the northern flank of the Yellowstone97
caldera, contains a succession of travertine deposits that range from 0 to approximately98
8,000 years old that are 73 m in thickness and cover more than 4 km2 (Allen and Day99
1935; Bargar 1978; Sturchio et al. 1992; Sturchio et al. 1994; White et al. 1975). The100
springs expel Ca-Na-HCO3-SO4 type hot waters derived from a subsurface reservoir at101
temperatures of greater than 100oC (Kharaka et al. 1991; Sorey 1991). Angel Terrace,102
near the top of the Mammoth complex, contains several active small springs. We have103
focused on two of these, AT-1 and AT-3, which are shown in Figure 1. The hydrologic104
system is dynamic, with multiple vents appearing, sealing, and reopening on Angel105
Terrace at a frequency of months to tens of years (Bargar 1978; Sorey 1991).106
CHARACTERIZATION OF SPRING WATER107
Correlation of the solid-phase travertine facies with the spring water has108
required quantification of physical and chemical aqueous parameters within a complex,109
heterogeneous natural environment that exhibits large spatial variations and temporal110
fluctuations. Over a period of 7 years, our research group has collected measurements,111

7
summarized in Table 1, of the physical, chemical, and biological properties of 2 hot112
springs (AT-1 and AT-3) at Angel Terrace.113
The springs were surveyed using a Brunton compass, a 30 m steel tape measure,114
and a Garmin Model 12 GPS unit. The locations of all sample sites were determined115
with respect to the vent. During each trip, samples were collected along transects,116
defined as groups of measurements taken at nearly the same time at locations beginning117
with the vent and proceeding downstream through the drainage system. All118
measurements were taken in triplicate; the mean is taken as our best estimate of the true119
value, and the standard deviation quantifies measurement accuracy.120
343 pH measurements were taken in situ, using three types of temperature121
correcting hand held probes: a Hach sensION 156 meter; an Orion Model 290A probe;122
and an Oaktron Waterproof Series 300 meter. Different meters were needed because the123
spring environment rapidly degrades and destroys probes. The meters were calibrated124
before, during, and after each transect using standard pH buffer solutions (4.0, 7.0, and125
10.0) with an accuracy of ±0.01 pH at 25oC. pH measurements were complicated126
because of the rapid deposition of CaCO3 on the probe’s electrode. In order to avoid127
instrument drift and slow convergence to a steady measurement, the probes were128
regularly steeped in a 0.1M HCl solution, rinsed in de-ionized water, and then129
recalibrated.130
Measurements of water temperature were taken at the same times and locations as pH131
measurements, using the same probes. Temperature was also collected every 30 seconds132
in situ using two Hobo Temperature Data loggers (Model H20-001).133

8
Total flux in spring AT-3 was determined at the vent source using a propeller134
based current meter, USGS Pygmy Meter Model 6205, and by measuring the area135
through which current was flowing. We obtained an independent measure of flux on the136
January 2005 trip (Table 1) using time of flight techniques inside a channel which had a137
fixed cross sectional area. This method records the length of time over which small,138
floating travertine flakes need to travel a given distance. The pygmy meter was also139
used to characterize typical flow velocities in the spring system and, where possible,140
Pitot tubes were used to validate these measurements.141
DEFINITION OF THE PRIMARY FLOW PATH142
To connect macroscopic processes to those which control precipitation at a143
microscopic scale, we must follow the evolution of spring water as it progresses along a144
single flow path. A flow path is the set of points traversed by a packet of water as it145
moves from the vent to the distal slope. In a hot spring, unlike in a stream or river,146
water spreads out over a broad area; streams divide and recombine. The physical and147
chemical properties of water at a given point can depend in a complicated way on any148
number of upstream points, each of which could have different physical and chemical149
properties.150
This problem can be resolved by defining the primary flow path. Given a151
contiguous area covered by spring water, the primary flow path is the set of points at a152
given distance from the vent which are traversed by the largest volume of water. Where153
a large percentage of the spring water follows along a single trajectory, the chemical154
and physical properties at a point are overwhelmingly related to those of its upstream155

9
neighbor. This idea can be extended, and secondary or tertiary flow paths can be156
defined in regions of the spring which are disconnected by dry areas. This definition157
does not uniquely define a flow path in the sense of a streamline. When water spreads158
out evenly across an area, the primary flow path defined here can include a set of159
equivalent points.160
While the primary flow path can sometimes be identified by visual inspection,161
this is not always the case, particularly in thin sheet flow further away from the vent. In162
this situation the primary flow path locally follows the trajectory along which163
temperature decreases most slowly as a function of distance.164
In most carbonate hot springs there is only a single vent, and the temperature of165
spring water monotonically decreases after it leaves the vent. Until it equilibrates with166
the atmosphere, the temperature of a packet of water is only a function of the length of167
time since it emerged from the vent. If T
denotes temperature and t
denotes time, then168()Tft=
. Consider the contour of all points which are the same distance, rΔr
, from the169
last identified point on the flow path, which we denote orr
. If we are looking nearby,170
rΔr must be small, and all these points will have the same water depth, H . In most of171
our system, this is a good approximation even for non-infinitesimalrΔr
. If ()vrr
is the172
local velocity, and srΔ a small displacement along the equidistant contour, then flux173
)( 0 rrQ rrΔ+ at each of these points may be estimated as follows:174
trrrvrrvsHrrQΔ
Δ≈Δ+∝Δ+Δ=Δ+
rrrrrrrr )()()( 000 (1)175
10
Here tΔ denotes the time it takes a packet of water to go from 0rr to rr rr
Δ+0 .176
Because the points being considered are equidistant, t
rrQΔ
∝Δ+1)( 0
rr . ()Tft=
. If177
rΔr is sufficiently small,
tΔ must also be small, and by expanding )(tf for small
tΔ,178
we can writetTΔ∝Δ
. This implies that:1791()oQrrT+Δ∝Δrr
(2) Hence ()oQrr+Δrr
will be maximized where180
TΔ is minimized. The next point on the primary flow path will be the spot among these181
equidistant points with the smallestTΔ
, or equivalently the spot with the highest182
temperature.183
Thus we have shown that the primary flow path locally follows the trajectory184
along which temperature decreases most slowly as a function of distance. This185
theoretical discussion was applied to the data collected at spring AT-3 in 2004, and the186
primary flow path was determined by looking at the average temperatures at the 24187
sample locations. The results in Figure 2 show that the points which comprise the188
primary flow path minimizeddTr
, as we step from point to point. It locally minimizes the189
slope of the dotted line in Figure 4.Thus we have shown that the primary flow path190
locally follows the trajectory along which temperature decreases most slowly as a191
function of distance. This analysis provides a useful recipe for analyzing aqueous192
measurements and for organizing experiments at hot springs. If one proceeds193
downstream with a meter stick and a thermometer, and draws arcs with the meter stick,194
the next point in the flow path will be the point along the arc with the highest195

11
temperature. When combined with standard qualitative observations, this approach196
allows sampling strategies which account for mixed flow paths, regardless of variations197
in water depth, velocity, or changes in underlying topography.198
199
VARIABILITY AND FLUCTUATIONS IN HOT SPRING WATER200
Table 2 compares the ranges of observed spring water temperatures and pH, as a201
function of facies, for multiple hot springs and times. There is consistent overlap202
between measurements from the same facies at different springs (AT1 and AT3), but203
there are also large variations within each facies. Although this variability does not204
obscure the overall down flow trends, identifying meaningful differences that exist205
between or within hot springs requires first quantifying the macroscopic fluctuations206
and variations that occur within a single spring.207
Three kinds of variability are relevant to carbonate precipitation. First, there are208
temporal fluctuations on the time scale of our measurements (e.g. 10’s of seconds). In209
our error model, these fluctuations are treated as measurement errors. Second, there are210
temporal fluctuations on the time scale of days, such as changes in spring discharge.211
These are relevant for comparing different measurements, but not for understanding212
travertine deposits thicker than a few millimeters. Finally, there are spatial variations on213
macroscopic scale. There are also spatial differences on both the microscopic and214
systems-level scale which are not relevant to the scope of this discussion.215
Figure 3 shows these three kinds of variability for both temperature and pH as a216
function of facies. We quantified temporal fluctuations by considering the ensemble of217

12
measurements at a given point in space (taken over a period of three days), calculating218
the standard deviation of that ensemble, and then averaging those deviations over each219
facies. We quantified spatial variations by grouping all measurements collected within a220
facies at a given time, and then calculating the standard deviation of that ensemble. This221
was repeated for measurements taken at different times, and the results were averaged222
over each facies.223
While the measurement errors are small (approximately 0.03 pH units and 1oC),224
there are significant temporal fluctuations and spatial variations. These differences are225
not driven by large changes in the source water, as the vent exhibits the smallest226
changes. Both fluctuations and variations result from the interplay of myriad smaller227
factors that include: changes in the flow patterns upstream from a point; diurnal228
insolation; changes in total spring flux; and atmospheric conditions, particularly wind.229
We observed wind driving water over the pond lips, dramatically changing the pH and230
temperature of downstream points, particularly in areas of low flux.231
During a period of three days a HOBO temperature data logger in the proximal232
slope recorded a maximum change of 9oC, with a standard deviation of 2oC. These233
measurements exhibit a clear diurnal signal, driven by differences in daytime and234
nighttime air temperatures as large as 20oC. The fluctuations seen in the HOBO data are235
consistent with the results shown in Figure 3.236
Total spring flux was considerably more difficult to measure than either237
temperature or pH. In June 2004, using a pygmy current meter, we estimated Spring238
AT-3 discharge at 59 L/s. In January 2005, using time of flight techniques, we239

13
measured 12 L/s. Both measurements are accurate to within 10%. These numbers240
indicate significant variation in total spring flux, which will result in changes in241
downstream aqueous chemistry, temperature, and flux -- even if the source water242
remains otherwise unchanged. Our flux measurements do not agree with the report of243
(Sorey 1991), who reported the total discharge of all hot springs in the Mammoth244
complex as 59.1±3 L/s. . Sorey’s result was based on the assumption that approximately245
10% of the total groundwater erupts through hot springs. This assumption may be246
incorrect, but the observed large variations in flux make it difficult to confidently247
estimate total discharge.248
Figure 3 shows a noteworthy trend in spatial variability. The largest heterogeneities in249
temperature and pH are seen in the pond facies, and the most homogeneous regions are250
the vent and distal slope facies. This occurs because the spring system is essentially251
held fixed at the beginning and the end of the primary flow path. At the vent, pH and252
temperature are held constant by the steady influx of homogeneous source water, which253
has relatively constant temperature and chemistry (Table 2). In the distal slope, CO2254
fugacity asymptotically nears what would be expected for spring water in equilibrium255
with both the atmosphere and solid CaCO3 in the substrate. This largely determines pH256
and temperature in the distal slope. The temporal fluctuations in temperature mirror the257
trend seen in spatial variations.258
Significantly, this trend in spatial variability could explain why the greatest259
bacterial diversity is seen in the pond facies (Bonheyo et al. 2006; Fouke et al. 2003).260
Our results show that the pond facies offers the broadest array of mesoscopic261

14
physiochemical conditions. As a result, it can support the greatest microbial diversity262
(Brock et al. 1999). Conversely, the most homogeneous environments, at the beginning263
and end of the primary flow path, have been shown to support the least diverse bacterial264
communities (Bonheyo et al. 2006).265
266
RELATING THE ROCK RECORD TO THE DEPOSITIONAL ENVIRONMENT267
Despite large variations and fluctuations in the aqueous environment, we see268
statistically significant correlations between physical and chemical attributes of spring269
water and underlying depositional facies. These correlations exist because macroscopic270
CaCO3 mineral precipitation occurs on time scales of days to months, and the rock271
record inherently averages out more rapid fluctuations in the aqueous environment.272
Figure 4 shows the distribution of all pH and temperature measurements273
arranged by facies. It illustrates that the vent, apron channel, and distal slope facies can274
be identified by considering pH and temperature jointly, implying that these facies are275
associated with distinct depositional environments. The transition from the vent to the276
apron channel facies is associated with the pH increasing beyond 6.6 while temperature277
is relatively unchanged. This suggests that this transition is controlled by CO2278
exsolution and the onset of carbonate precipitation.279
The pond and proximal slope facies cannot be differentiated from each other on280
the basis of spring water temperature and pH. While petrography documents some281
similarity on a microscopic level (Fouke et al. 2003; Fouke et al. 2000), clear282
distinctions (such as travertine dams and a terraced architecture) emerge on a283

15
macroscopic level. We therefore considered additional physical parameters to284
understand how the same spring water can give rise to two distinct aggregate285
morphologies. These two facies are differentiated by average fluid velocity.286
Velocities in these thin sheet flows are difficult to measure, particularly because287
techniques like particle image velocimetry could negatively impact the natural hot288
spring environment. We have used several independent techniques, including the289
pygmy current meter, Pitot tubes, and time of flight measurements. We observed290
velocities less than 20 cm/s in the pond, but over 35 cm/s in the proximal slope. The291
average velocities in these facies are a function of slope, total flux, fluid depth, and292
facies area. Using our measurements of area, depth, and total flux, we calculate293
velocities consistent with these experimental findings. These results imply that, if294
other factors remain unchanged, ponds will form in flatter areas with lower flux and the295
proximal slope facies will form on steeper underlying topographies with higher flux.296
This is consistent with qualitative observations at the springs AT-1 and AT-3, and also297
agrees with computational models of these hot spring systems (Goldenfeld et al. 2006).298
As the spring landscape evolves, both flux and slope change as a result of travertine299
deposition. This can result in a steep proximal slope ultimately becoming terraced300
ponds.301
These results imply that, if other factors remain unchanged, ponds will form in302
flatter areas with lower flux and the proximal slope facies will form on steeper303
underlying topographies with higher flux. This is consistent with qualitative304

16
observations at the springs AT-1 and AT-3, and also agrees with computational models305
of these hot spring systems (Goldenfeld et al. 2006).306
The observed macroscopic partitions in spring water explain previous307
observations (Bonheyo et al. 2006; Fouke et al. 2003) which showed that microbial308
communities are also partitioned according to facies. Because different microorganisms309
thrive in different niches, microbial community structure must be correlated with the310
partitions seen in the aqueous environment.311
312
RECONSTRUCTING MODERN AND ANCIENT ENVIRONMENTS313
314
The strong correlations between travertine facies and the macroscopic physical315
and chemical parameters of the depositional environment allow each facies to be316
uniquely identified solely by pH, temperature, and flow velocity. While fluctuations and317
variations complicate comparisons between springs, we have shown that when viewed318
statistically (Figure 4), measurements taken from the same facies in different springs are319
equivalent, as long as the facies have had sufficient time to establish themselves since320
the last major change in vent location or fluxOur qualitative observations at spring AT-321
2 suggest that facies need a few to establish themselves.322
When combined with previous work (Bonheyo et al. 2006; Fouke et al. 2003;323
Fouke et al. 2000), these results demonstrate that these travertine depositing hot springs324
exhibit the same macroscopic partitions chemically, physically, petrographically, and325
microbially. The only other study which reports hot spring temperature and pH in the326

17
context of aggregate morphology (Chafetz and Lawerance 1994) is consistent with the327
partitions shown in Figure 4. Note that cooler carbonate springs which have328
significantly different source water temperature will not develop the same five facies,329
and are therefore not comparable.330
This simple linkage is a powerful predictive tool, implying that the facies model,331
which inherently averages fluctuations and variations, can be directly used for332
paleoenvironmental reconstructions. Our results also put precise quantitative bounds on333
the temperature and pH of the spring water from which ancient travertine facies334
originally precipitated. As an example, Folk and Chafetz (Folk et al. 1985) documented335
streamers in Pleistocene travertine, primary crystallization features which were336
preserved despite subsequent post-depositional physical and chemical alterations337
(diagenesis, Bathurst 1975)Their description suggests that these deposits were formed338
in the apron channel facies. Utilizing Figure 4, we conclude that these deposits339
precipitated from spring waters with a pH of 6.75 ± 0.13 and a temperature of 65.5 ± 3.7340
oC.341
342
343
CONCLUSIONS344
345
During six trips spanning seven years, we collected a large, comprehensive set346
of measurements which characterize the spring water, travertine, and microbial ecology347
at two carbonate hot springs in Yellowstone National Park. Although the aqueous348

18
environment of these springs exhibits large spatial variations and temporal fluctuations349
on the macroscopic scale, we have shown that pH, temperature, and flux are sufficient350
to tie the spring water to the underlying depositional facies. The observed strong351
correlations between travertine facies and the spring water remove any assumptions352
about the aqueous environment during deposition. This validates the facies concept as a353
macroscopic framework for comparing modern hot springs. These results allow us to354
put more accurate quantitative bounds on paleoenvironmental reconstructions from355
ancient travertine. A subsequent paper will address in detail how microscopic aqueous356
chemistry and the kinetics of travertine nucleation and crystallization give rise to the357
correlations documented here. In this sense, the present study is a necessary first step358
toward a fundamental predictive model of travertine precipitation in hot springs.359
360

19
ACKNOWLEDGEMENTS361
This work was supported by research awards from the NSF Biocomplexity in the362
Environment Program (EAR 0221743), the ACS PRF Starter Grant Program (34549-363
G2), and the UIUC Critical Research Initiative. The conclusions of this study are those364
of the authors, and do not necessarily reflect those of the funding agencies. Thanks to G.365
Bonheyo, D. Fike, B. Sansenbacher, H. Garcia Martin, K. Hutchings for assistance with366
data collection. We also thank A. Murray, A. Kameda, and B. Carter for field work,367
helpful comments and HOBO temperature data. We are indebted to the National Park368
Service, particularly B. Suderman, H. Hessler, and C. Hendrix, for their support,369
assistance, passion, and ongoing preservation of Yellowstone hot springs.370

20
FIGURES371
372
Figure 1. Spring AT-1 and AT-3 showing vent and general direction of spring water373
flow.374

21
375
Figure 2. pH and temperature values observed at Spring AT-3 during 2004. Each point376
represents the average of 5 triplicate measurements at each of 24 sample locations,377
taken over a period of 3 days.378
379
22
380
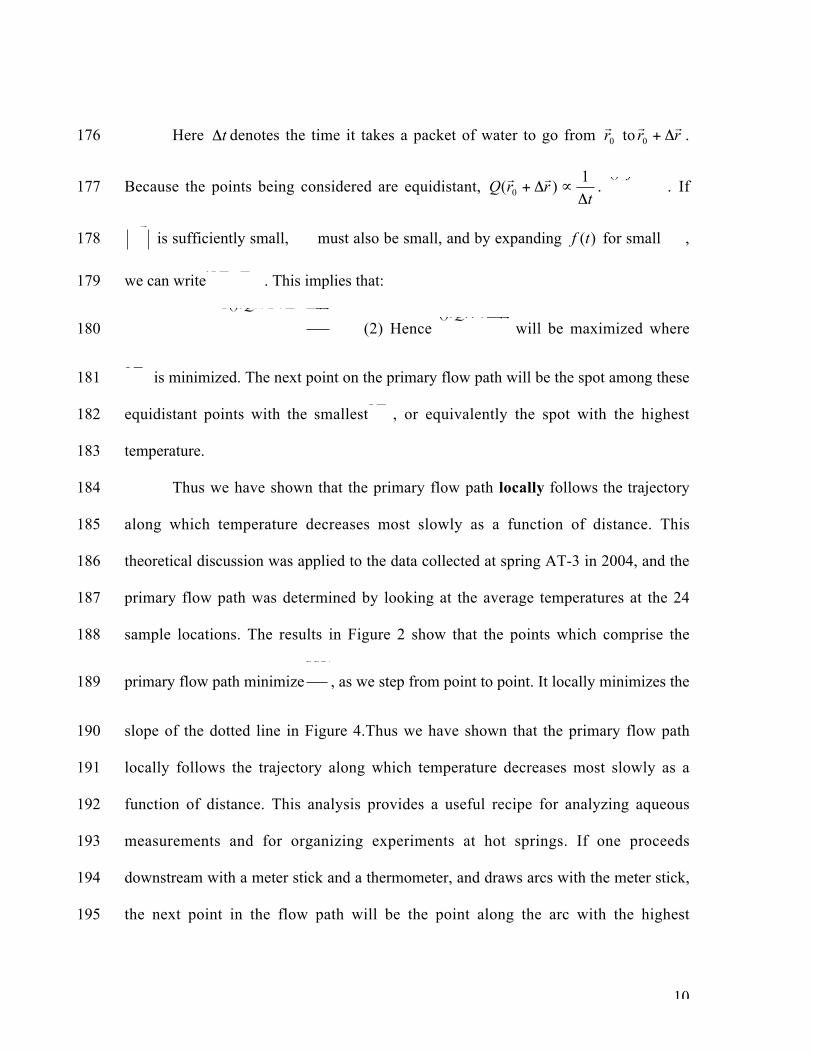
Figure 3. The three kinds of variability relevant to understanding travertine deposition381
in comparing hot springs, organized by facies. V--vent facies. AC--apron channel.382
P—pond. PS--proximal slope. DS--distal slope.383

23
384
385
Figure 4. The distribution of 343 triplicate pH and temperature measurements taken386
from Springs AT-1 and AT-3 at different times. The black symbols show the facies387
averages, with the error bars denoting 1 standard deviation.388

24
Tables389
TABLE 1: Compilation of previous studies of Angel Terrace Hot Spring
Year Spring T/pH FluxSolid
Chemistry
Aqueous
Chemistry
Isotope
Analysis
Precipitation
Collection
Microbiology
Samples
2005 AT-3 Χ Χ Χ Χ Χ Χ
2004 AT-3 Χ Χ Χ Χ Χ Χ Χ
2003 AT-3 Χ Χ Χ
2002 AT-1 Χ Χ Χ
1999 AT-1 Χ Χ Χ Χ Χ Χ
1998 AT-1 Χ Χ Χ Χ Χ Χ
Samples
Collected6 343 2 90 48 71 850 64
390
Table 1. A compilation of previous studies by our group at springs AT-1 and AT-3391
during a 7-year period from 1998–2005. Each ‘Χ’ represents a sample or suite of392
samples collected during field activities for each of the parameters listed at the top of393
each column. The last row details the total number of collected samples or394
measurements of each parameter. A triplicate measurement is reported here as a single395
sample.396

25
397Table 2: Comparative temperature and pH ranges for each facies for previous studies
Year Location Value VentApron
ChannelPond Proximal Slope Distal Slope
2005 AT-3T (oC)
pH
69.6
6.29
64.1
6.62N/A
47.2
7.76
34.1
8.14
2004 AT-3T (oC)
pH
68.0 - 72.2
6.21 – 6.57
60.5 – 68.6
6.59 – 7.26
35.6 – 61.7
6.84 – 8.04
50.6 – 56.4
6.99 – 7.77
34.2 – 39.4
7.32 – 8.07
2003 AT-3T (oC)
pH
71.2
6.58-6.61
61.6 - 69.3
6.60 - 7.05
56.1 - 61.5
6.94 - 7.01
41.3 – 65.2
7.04 - 8.01
28.4 - 44.0
7.75 - 8.14
2002 AT-1T (oC)
pH
67.9 - 69.3
6.59 – 6.76
60.5 – 64.0
7.00 – 7.26
59.9 – 60.3
7.29 - 7.30
46.7 – 50.8
7.95 – 8.05
24.0
8.12
1999 AT-1T (oC)
pH
72.0 – 72.2
6.31 - 6.32
70.1 - 70.3
6.46 - 6.52
46.8 - 55.3
7.42 - 7.62
39.0 - 39.8
7.73 - 7.77
37.1 - 37.5
7.90 - 7.92
1998 AT-1T (oC)
pH
73.2
6.00N/A
45.3
7.43
54.2
7.40
30.2
8.00
398
Table 2. Temperature and pH ranges for each of the previous studies for springs AT-1399
and AT-3. Studies are organized by year and facies. Temperature (oC) is listed on top400
of pH in each row.401

26
REFERENCES CITED402
ALLEN, E.T., and DAY, A.L., 1935, Hot Springs of the Yellowstone National Park, v.403Publication Number 466, Carnegie Institution of Washington, 525 p.404
AMUNDSON, R., and KELLY, E., 1987, The chemistry and mineralogy of a CO2-rich405travertine depositing spring in the California Coast Range: Geochimica et406Cosmochimica Acta, v. 51, p. 2883-2890.407
BARGAR, K.E., 1978, Geology and thermal history of Mammoth Hot Springs,408Yellowstone National Park, Wyoming, United States Geological Survey409Bulletin, p. 1-54.410
BATHURST, R.G.C., 1975, Carbonate Sediments and their Diagenesis: Developments in411Sedimentology, v. 12: Amsterdam, Elsevier, 658 p.412
BONHEYO, G.T., GARÇÍA MARTÍN, H., VEYSEY II, J., FRIAS-LOPEZ, J., GOLDENFELD, N.,413and FOUKE, B.W., 2006, Statisitcal Evaluation of Bacterial 16S rRNA Gene414Sequences in Relation to Travertine Mineral Precipitation and Water Chemistry415at Mammoth Hot Springs, Yellowstone National Park, USA: Submitted to416Environmental Microbiology.417
BROCK, T.D., MADIGAN, M.T., MARTINKO, J.M., and PARKER, J., 1999, Biology of418Microorganisms, Prentice Hall, 991 p.419
BUSENBERG, E., and PLUMMER, L.N., 1986, A comparative study of the dissolution and420crystal growth kinetics of calcite and aragonite, in Mumpton, F.A., ed., USGS421Bulletin 1578, p. 139-168.422
CHAFETZ, H.S., and LAWERANCE, J.R., 1994, Stable isotope variability within modern423travertines: Geographie Physique et Quaternaire, v. 48, p. 257-273.424
DREYBRODT, W., BUHMAN, D., MICHAELIS, J., and USDOWSKI, E., 1992, Geochemically425controlled calcite precipitation by CO2 outgassing: Field measurements of426precipitation rates in comparison to theoretical predictions: Chemical Geology,427v. 97, p. 285-294.428
FLÜGEL, E., 2004, Microfacies of Carbonate Rocks: Analysis, Interpretation, and429Application: Berlin, New York, Springer, 976 p.430
FOLK, R.L., CHAFETZ, H.S., and TIEZZI, P.A., 1985, Bizarre forms of depositional and431diagenetic calcite in hot-spring travertines, central Italy, p. 349-369.432
FORD, T.D., and PEDLEY, H.M., 1996, A review of tufa and travertine deposits of the433world: Earth-Science Reviews, v. 41, p. 117-175.434
FOUKE, B.W., BONHEYO, G.T., SANZENBACHER, B., FRIAS-LOPEZ, J., and VEYSEY, J.,4352003, Partitioning of bacterial communities between travertine depositional436facies at Mammoth Hot Springs, Yellowstone National Park, USA: Canadian437Journal of Earth Science, v. 40, p. 1531-1548.438
FOUKE, B.W., FARMER, J.D., DES MARAIS, D.J., PRATT, L., STURCHIO, N.C., BURNS,439P.C., and DISCIPULO, M.K., 2000, Depositional facies and aqueous-solid440geochemistry of travertine-depositing hot springs (Angel Terrace, Mammoth441Hot Springs, Yellowstone National Park, USA): Journal of Sedimentary442Research, v. 70, p. 265-285.443

27
FOUKE, B.W., FARMER, J.D., DES MARAIS, D.J., PRATT, L., STURCHIO, N.C., BURNS,444P.C., and DISCIPULO, M.K., 2001, REPLY-Depositional facies and aqueous-445solid geochemistry of travertine-depositing hot springs (Angel Terrace,446Mammoth Hot Springs, Yellowstone National Park, USA): Journal of447Sedimentary Research, v. 71, p. 497-500.448
FRIEDMAN, I., 1970, Some investigations of the deposition of travertine from hot449springs: I. The isotope chemistry of a travertine-depositing spring: Geochimica450et Cosmochimica Acta, v. 34, p. 1303-1315.451
GOLDENFELD, N., CHAN, P.Y., and VEYSEY, J., 2006, Dynamics of precipitation pattern452formation at geothermal hot springs: Physical Review Letters, v. 96.453
GRESSLY, A., 1838, Observations geologiques sur le Jura Solerois: Nouv. Mem. Soc.454Helv. Sci. Natur., v. 2, p. 1-349.455
HERMAN, J.S., and LORAH, M.M., 1988, Calcite precipitation rates in the field:456Measurement and prediction for a travertine-depositing spring: Geochimica et457Cosmochimica Acta, v. 52, p. 2347-2355.458
KANAKIS, J., and DALAS, E., 2000, The crystallization of vaterite on Fibrin: Journal of459Crystal Growth, v. 219, p. 277-282.460
KHARAKA, Y.K., MARINER, R.H., BULLEN, T.D., KENNEDY, B.M., and STURCHIO, N.C.,4611991, Geochemical investigations of hydraulic connections between Corwin462Springs Known Geothermal Area and adjacent parts of Yellowstone National463Park, in Sorey, M., ed., Effects of Potential Geothermal Development in the464Corwin Springs Known Geothermal Resources Area, Montana, on the Thermal465Features of Yellowstone National Park, U.S. Geological Survey, p. F1-F38.466
LIU, Z.H., and DREYBRODT, W., 1997, Dissolution kinetics of calcium carbonate467minerals in H2O-CO2 solutions in turbulent flow: The role of the diffusion468boundary layer and the slow reaction H2O+CO2 reversible arrow H++HCO3:469Geochimica Et Cosmochimica Acta, v. 61, p. 2879-2889.470
LU, G., ZHENG, C., DONAHOE, R.J., and LYONS, W.B., 2000, Controlling processes in a471CaCO3 precipitating stream in Huanlong Natural Science District, Sichuan,472China: Journal of Hydrology, v. 230, p. 34-54.473
PENTECOST, A., 1990, The formation of travertine shrubs: Mammoth Hot Springs,474Wyoming: Geological Magazine, v. 127, p. 159-168.475
READING, H.G., 1996, Sedimentary Environments: processes, Facies and Stratigraphy:476London, England, Blackwell Science Ltd., 688 p.477
SOREY, M.L., 1991, Effects of potential geothermal development in the Corwin Springs478known geothermal resources area, Montana, on the thermal features of479Yellowstone National Park: Menlo Park, CA, United States Geological Survey.480
SPANOS, N., and KOUTSOUKOS, P.G., 1998, Kinetics of Precipitation of Calcium481Carbonate in Alkaline pH at Constant Supersaturarion. Spontaneous and Seeded482Growth: Journal of Physical Chemistry, v. 102, p. 6679-6684.483
STURCHIO, N.C., MURRELL, M.T., PIERCE, K.L., and SOREY, M.L., 1992, Yellowstone484Travertines: U-series Ages and Isotope Ratios (C, O, Sr, U), in Kharaka, and485Maest, eds., Water-Rock Interaction: Rotterdam, Balkema, p. 1427-1430.486

28
STURCHIO, N.C., PIERCE, K.L., MURRELL, M.T., and SOREY, M.L., 1994, Uranium-487series ages of travertines and timing of the last glaciation in the northern488Yellowstone area, Wyoming-Montana: Quaternary Research, v. 41, p. 265-277.489
SUAREZ, D.L., 1983, Determination of calcite precipitation rates in irrigated arid land490soils: Abstracts with Programs - Geological Society of America, v. 15, p. 701.491
USDOWSKI, E., HOEFS, J., and MENSCHEL, G., 1979, Relationship between δ13C and492δ18O fractionation and changes in major element composition in a recent calcite-493depositing spring - a model of chemical variations with inorganic CaCO3494precipitation: Earth and Planetary Science Letters, v. 42, p. 267-276.495
VAN CAPPELLEN, P., CHARLET, L., STUMM, W., and WERSIN, P., 1993, A Surface496Complexation Model of the Carbonate Mineral-Aqueous Solution Interface:497Geochimica Et Cosmochimica Acta, v. 57, p. 3505-3518.498
WALKER, R.G., 1984, Facies Models: St. Johns, Newfoundland, Geological Association499of Canada, 317 p.500
WHITE, D.E., FOURNIER, R.O., MUFFLER, L.P.J., and TRUESDELL, A.H., 1975, Physical501results of research drilling in thermal areas of Yellowstone National Park,502Wyoming: Menlo Park, California, United States Geological Survey.503
WILSON, J.L., 1975, Carbonate Facies in Geologic History: New York, Springer-Verlag,504472 p.505
ZHANG, D.D., ZHANG, Y.J., ZHU, A., and CHENG, X., 2001, Physical mechanisms of506river waterfall tufa (travertine) formation: Journal of Sedimentary Research, v.50771, p. 205-216.508
509