Embed Size (px)
Citation preview
THE TOWERS OF LEARNINGPERFORMANCE,
PERIL AND PROMISE OF HIGHER EDUCATION IN
SRI LANKA
July 2009
The World BankHuman Development Unit
South Asia Region
©2009 The International Bank for Reconstruction and Development/ The World Bank1818 H Street NW Washington DC 20433 USATelephone: 202-473-1000E-mail: [email protected]: www.worldbank.org
Published byThe World Bank Colombo Office73/5 Galle RoadColombo 03 Sri LankaE-mail: [email protected]: www.worldbank.org/lk
This volume is a product of the staff of the International Bank for Reconstruction and Development / The WorldBank. The findings, interpretations, and conclusions expressed in this paper do not necessarily reflect the viewsof the Executive Directors of The World Bank or the governments they represent.
The World Bank does not guarantee the accuracy of the data included in this work. The boundaries, colors,denominations, and other information shown on any map in this work do not imply any judgement on the part ofThe World Bank concerning the legal status of any territory or the endorsement or acceptance of such boundaries.
Rights and Permissions
The material in this publication is copyrighted. Copying and/or transmitting portions or all of this work withoutpermission may be a violation of applicable law. The International Bank for Reconstruction and Development/The World Bank encourages dissemination of its work and will normally grant permission to reproduce portionsof the work promptly.
For permission to photocopy or reprint any part of this work, please send a request with complete information tothe Copyright Clearance Center Inc. 222 Rosewood Drive Danvers MA 01923 USATelephone: 978-750-8400, Fax: 978-750-4470, www.copyright.com
All other queries on rights and licenses, including subsidiary rights, should be addressed to theOffice of the Publisher,The World Bank 1818 H Street NW Washington DC 20433 USAFax: 202-522-2422, E-mail: [email protected]
Cover: Students of the University of Peradeniya, Sri Lanka. © Cover Photograph by Benoit Millot
ISBN : 978-955-8908-35-8
Designed & Produced byAri Investments Limited19 St. Joseph RoadNugegoda Sri Lanka
ii
TABLE OF CONTENTS
Executive Summary - English . . . . . . . . . . . . . . . . . . . . . . . . . . . . . . . . . . . . . . | E1- Sinhala . . . . . . . . . . . . . . . . . . . . . . . . . . . . . . . . . . . . . . | S1- Tamil . . . . . . . . . . . . . . . . . . . . . . . . . . . . . . . . . . . . . . . . | T1
Chapter 1: The Higher Education Sector in Sri Lanka . . . . . . . . . . . . . . . . . . . . . . . . . . . . . . . | 1Introduction . . . . . . . . . . . . . . . . . . . . . . . . . . . . . . . . . . . . . . . . . . . . . . . . . . . . . . . . . . . | 1
The Economic and Sector Context . . . . . . . . . . . . . . . . . . . . . . . . . . . . . . . . . . . . . . . . . | 1The Structure of the Higher Education Sector . . . . . . . . . . . . . . . . . . . . . . . . . . . . . . . . . . | 2The Composition of Higher Education Enrollment . . . . . . . . . . . . . . . . . . . . . . . . . . . . . . . | 4Higher Education in Sri Lanka in International Context . . . . . . . . . . . . . . . . . . . . . . . . . . . . | 4Public Investment in Higher Education . . . . . . . . . . . . . . . . . . . . . . . . . . . . . . . . . . . . . . | 7Future Challenges for the Higher Education Sector . . . . . . . . . . . . . . . . . . . . . . . . . . . . . . | 7Government’s Response to Address the Challenges . . . . . . . . . . . . . . . . . . . . . . . . . . . . . | 10The Contribution of the World Bank Higher Education Report . . . . . . . . . . . . . . . . . . . . . . . | 10
Chapter 2: Access to, And Coverage of, Higher Education . . . . . . . . . . . . . . . . . . . . . . . . . . | 11Introduction . . . . . . . . . . . . . . . . . . . . . . . . . . . . . . . . . . . . . . . . . . . . . . . . . . . . . . . . . . . | 11A Global View . . . . . . . . . . . . . . . . . . . . . . . . . . . . . . . . . . . . . . . . . . . . . . . . . . . . . . . . | 11The Composition of the Higher Education Sector . . . . . . . . . . . . . . . . . . . . . . . . . . . . . . . . . . | 13Student Distribution . . . . . . . . . . . . . . . . . . . . . . . . . . . . . . . . . . . . . . . . . . . . . . . . . . . . . . | 24The Way Forward: Strategic Options for the Future. . . . . . . . . . . . . . . . . . . . . . . . . . . . . . . . . | 26
Chapter 3: Enhancing Higher Education Quality . . . . . . . . . . . . . . . . . . . . . . . . . . . . . . . . . . | 29Introduction . . . . . . . . . . . . . . . . . . . . . . . . . . . . . . . . . . . . . . . . . . . . . . . . . . . . . . . . . . . | 29The Multi-Dimensional Nature of Higher Education Quality . . . . . . . . . . . . . . . . . . . . . . . . . . . | 29
The Importance of Curriculum Relevance . . . . . . . . . . . . . . . . . . . . . . . . . . . . . . . . . . . . | 31The Central Role of Skilled and Experienced Staff . . . . . . . . . . . . . . . . . . . . . . . . . . . . . . | 32Improving Learning and Teaching Methods . . . . . . . . . . . . . . . . . . . . . . . . . . . . . . . . . . . | 35Quality Assurance and Enhancement Processes . . . . . . . . . . . . . . . . . . . . . . . . . . . . . . . . | 39Facilities and Infrastructure on Campus . . . . . . . . . . . . . . . . . . . . . . . . . . . . . . . . . . . . . . | 40Student Learning Assessments . . . . . . . . . . . . . . . . . . . . . . . . . . . . . . . . . . . . . . . . . . . . | 41
Quality in External Degree Programs . . . . . . . . . . . . . . . . . . . . . . . . . . . . . . . . . . . . . . . . . . | 42Academic Standards . . . . . . . . . . . . . . . . . . . . . . . . . . . . . . . . . . . . . . . . . . . . . . . . . | 42Academic Support . . . . . . . . . . . . . . . . . . . . . . . . . . . . . . . . . . . . . . . . . . . . . . . . . . . | 44
Quality in the SLIATE Institutes . . . . . . . . . . . . . . . . . . . . . . . . . . . . . . . . . . . . . . . . . . . . . . . | 45The Occupational Relevance of the Alternative Higher Education Sector Programs . . . . . . . . . | 45Options for Development . . . . . . . . . . . . . . . . . . . . . . . . . . . . . . . . . . . . . . . . . . . . . . . | 45
The Institutional Culture: A Student-Centered Learning Environment . . . . . . . . . . . . . . . . . . . . . . . | 46The Way Forward: Options for Development . . . . . . . . . . . . . . . . . . . . . . . . . . . . . . . . . | 46
Quality in Private Higher Education . . . . . . . . . . . . . . . . . . . . . . . . . . . . . . . . . . . . . . . . . . . | 47
iii
iv
Structures, Systems and Processes for Ensuring Quality . . . . . . . . . . . . . . . . . . . . . . . . . . . . . . | 49The Present System . . . . . . . . . . . . . . . . . . . . . . . . . . . . . . . . . . . . . . . . . . . . . . . . . . . | 49Options for Development . . . . . . . . . . . . . . . . . . . . . . . . . . . . . . . . . . . . . . . . . . . . . . . | 50The Way Forward . . . . . . . . . . . . . . . . . . . . . . . . . . . . . . . . . . . . . . . . . . . . . . . . . . . | 52
Chapter 4: Governance of the Higher Education System . . . . . . . . . . . . . . . . . . . . . . . . . . . . | 53Introduction . . . . . . . . . . . . . . . . . . . . . . . . . . . . . . . . . . . . . . . . . . . . . . . . . . . . . . . . . . . | 53
The Structure and Legal Framework of the System . . . . . . . . . . . . . . . . . . . . . . . . . . . . . . | 53Governance of the Public Higher Education Sector . . . . . . . . . . . . . . . . . . . . . . . . . . . . . . . . | 56
The Current Position . . . . . . . . . . . . . . . . . . . . . . . . . . . . . . . . . . . . . . . . . . . . . . . . . . | 56Global Developments in Higher Education Governance and Options for Sri Lanka . . . . . . . . | 56
Balancing Autonomy and Accountability . . . . . . . . . . . . . . . . . . . . . . . . . . . . . . . . . . . . . . . | 58The University Sector . . . . . . . . . . . . . . . . . . . . . . . . . . . . . . . . . . . . . . . . . . . . . . . . . . | 58The Main Challenges . . . . . . . . . . . . . . . . . . . . . . . . . . . . . . . . . . . . . . . . . . . . . . . . . | 59SLIATE . . . . . . . . . . . . . . . . . . . . . . . . . . . . . . . . . . . . . . . . . . . . . . . . . . . . . . . . . . . | 62
Governance within Institutions . . . . . . . . . . . . . . . . . . . . . . . . . . . . . . . . . . . . . . . . . . . . . . . | 62Options for Development . . . . . . . . . . . . . . . . . . . . . . . . . . . . . . . . . . . . . . . . . . . . . . . | 63
Governance of the Private Sector . . . . . . . . . . . . . . . . . . . . . . . . . . . . . . . . . . . . . . . . . . . . | 63The Way Forward . . . . . . . . . . . . . . . . . . . . . . . . . . . . . . . . . . . . . . . . . . . . . . . . . . . | 66
Chapter 5: The Economic and Social Relevance of Higher Education . . . . . . . . . . . . . . . . . . . . | 67Introduction . . . . . . . . . . . . . . . . . . . . . . . . . . . . . . . . . . . . . . . . . . . . . . . . . . . . . . . . . . . | 67Structural Changes in the National Economy . . . . . . . . . . . . . . . . . . . . . . . . . . . . . . . . . . . . . | 67Developments in the Labor Market . . . . . . . . . . . . . . . . . . . . . . . . . . . . . . . . . . . . . . . . . . . | 69
The Employment Situation in Sri Lanka . . . . . . . . . . . . . . . . . . . . . . . . . . . . . . . . . . . . . . | 69The International Job Market . . . . . . . . . . . . . . . . . . . . . . . . . . . . . . . . . . . . . . . . . . . . . | 71The University-job Market Transition: Graduate Employment . . . . . . . . . . . . . . . . . . . . . . . . | 72The Employers’ Perspective . . . . . . . . . . . . . . . . . . . . . . . . . . . . . . . . . . . . . . . . . . . . . | 73University-Industry Linkages . . . . . . . . . . . . . . . . . . . . . . . . . . . . . . . . . . . . . . . . . . . . . . | 75
Economic and Social Benefits of Investment in Higher Education . . . . . . . . . . . . . . . . . . . . . . . | 76Higher Education, Earnings and Rates of Return to Investment in Human Capital . . . . . . . . . . | 76Education, Poverty and Inequality . . . . . . . . . . . . . . . . . . . . . . . . . . . . . . . . . . . . . . . . . | 78
The Way Forward . . . . . . . . . . . . . . . . . . . . . . . . . . . . . . . . . . . . . . . . . . . . . . . . . . . . . . | 80
Chapter 6: Planning and Financing Higher Education - Scenarios and Trade-Offs . . . . . . . . . . . . | 83Introduction . . . . . . . . . . . . . . . . . . . . . . . . . . . . . . . . . . . . . . . . . . . . . . . . . . . . . . . . . . . | 83Expenditure on Higher Education . . . . . . . . . . . . . . . . . . . . . . . . . . . . . . . . . . . . . . . . . . . . | 83Enrollment Projections as a Basis for Analyzing Funding Requirements . . . . . . . . . . . . . . . . . . . . | 85Base Run and Alternative Scenarios . . . . . . . . . . . . . . . . . . . . . . . . . . . . . . . . . . . . . . . . . . . | 85
Scenario 1: Increase Access and Improve Relevance . . . . . . . . . . . . . . . . . . . . . . . . . . . . | 88Scenario 2: Scenario 1 and Quality Improvement . . . . . . . . . . . . . . . . . . . . . . . . . . . . . . | 89Scenario 3: Improve Internal Efficiency of the Universities . . . . . . . . . . . . . . . . . . . . . . . . . | 91Scenario 4: Reducing Ratio of Non-Teaching to Teaching Staff . . . . . . . . . . . . . . . . . . . . . . | 92
Possible Impact of the Economic Crisis . . . . . . . . . . . . . . . . . . . . . . . . . . . . . . . . . . . . . . . . . | 94International Approaches to Funding Higher Education . . . . . . . . . . . . . . . . . . . . . . . . . . . . . . | 96The Way Forward . . . . . . . . . . . . . . . . . . . . . . . . . . . . . . . . . . . . . . . . . . . . . . . . . . . . . . | 98
Chapter 7: Higher Education Development -Accelerating Progress . . . . . . . . . . . . . . . . . . . . . . | 101
References . . . . . . . . . . . . . . . . . . . . . . . . . . . . . . . . . . . . . . . . . . . . . . . . . . . . . . . . . . . | 105
Figures (in text)Figure 1.1: The Structure of the Higher Education Sector . . . . . . . . . . . . . . . . . . . . . . . . . . . . | 3Figure 1.2: Higher Education Enrollment in Relation to GDP Per Capita of Middle Income and
Low Income Countries . . . . . . . . . . . . . . . . . . . . . . . . . . . . . . . . . . . . . . . . . . . | 5Figure 1.3: Knowledge Economy - Sri Lanka, Malaysia, Lower MICs . . . . . . . . . . . . . . . . . . . . | 6Figure 2.1: Higher Education Enrollment Shares by Type of Higher Education . . . . . . . . . . . . . . | 14Figure 2.2: Undergraduate Admissions, 1981-2006 . . . . . . . . . . . . . . . . . . . . . . . . . . . . . . | 19Figure 2.3: SLIATE: New Registrations, 2005/2006 . . . . . . . . . . . . . . . . . . . . . . . . . . . . . . | 21Figure 2.4: Percentage of Women by Area of Study, 2006 . . . . . . . . . . . . . . . . . . . . . . . . . . | 25Figure 2.5: Higher Education Enrollments by Socio-Economic Groups . . . . . . . . . . . . . . . . . . . | 26Figure 3.1: Quality – A Conceptual Framework . . . . . . . . . . . . . . . . . . . . . . . . . . . . . . . . . . | 30Figure 4.1: A Typology of Higher Education . . . . . . . . . . . . . . . . . . . . . . . . . . . . . . . . . . . . | 53Figure 5.1: Growth Performance, 2000 - 2008* . . . . . . . . . . . . . . . . . . . . . . . . . . . . . . . . | 68Figure 5.2: Ranking of Personality Attributes . . . . . . . . . . . . . . . . . . . . . . . . . . . . . . . . . . . . | 74Figure 5.3: The Impact of Education on Earnings, Male Workers . . . . . . . . . . . . . . . . . . . . . . | 75Figure 5.4: The Impact of Education on Earning, Female Workers, 2002 . . . . . . . . . . . . . . . . . | 76Figure 5.5: Poverty Incidence by Education Level of Household Head, 2002 . . . . . . . . . . . . . . | 77Figure 5.6: Lorenz Curves of the Benefits of Public Education Expenditure . . . . . . . . . . . . . . . . . | 78Figure 6.1: Education and University Expenditures as a share of GDP and Total Government
Expenditures, 1995 – 2006 (%) . . . . . . . . . . . . . . . . . . . . . . . . . . . . . . . . . . . . | 85Figure 6.2: Enrollment Projections for Public Higher Education Institutions (2007 – 2017) [Base Run] | 87Figure 6.3: MOHE Projected Recurrent and Capital Budget – 2008 to 2017 (LKR mil) [Base Run] | 87Figure 6.4: Enrollments by Area of Study – 2007 and 2017 (%) [Actual, Base Run and Scenario 1] | 88Figure 6.5: Enrollment Projections for Public Higher Education (2009 – 2017, thousands) . . . . . | 89Figure 6.6: Relative Costs for Base Run and Scenarios 1 & 2 (LKR billion) . . . . . . . . . . . . . . . . | 90Figure 6.7: Relative Costs for Base Run and Scenarios 1 & 2 and 3 (LKR billion) . . . . . . . . . . . . | 92Figure 6.8: Relative Costs for Base Run and Scenarios 1 & 2 and 3 & 4 (LKR billion) . . . . . . . . . | 93
Tables (in text)Table 1.1: Time Trend of Gross Higher Education Enrollment 1990/91-2007 (percent). . . . . . . | 4Table 1.2: Higher Education Enrollment by Type of Institution and Mode of Delivery 2006/2007 | 5Table 1.3: Global Competitiveness Index Ranking (2007/08 and 2008/09) . . . . . . . . . . . . . | 7Table 1.4: Investment in Education and Higher Education in International Context . . . . . . . . . . . | 8Table 2.1: Higher Education Enrollments in Selected Countries . . . . . . . . . . . . . . . . . . . . . . . | 12Table 2.2: Intakes and Enrollments in Undergraduate Higher Education (2000/2006) . . . . . . . | 13Table 2.3: Expansion of Enrollments in Conventional Undergraduate Programs (Universities) . . . . | 14Table 2.4: Enrollments in Conventional Undergraduate Programs (Public Universities) . . . . . . . . . | 15Table 2.5: Public Universities Student distribution by disciplines (2006) . . . . . . . . . . . . . . . . . . | 16Table 2.6: Distribution of new intakes in public universities by disciplines (2005/06) . . . . . . . . | 17Table 2.7: Distribution of graduates and intakes, GER and GDP p.c. for selected countries (2006) | 18Table 2.8: Intake by Disciplines (2001/2006) . . . . . . . . . . . . . . . . . . . . . . . . . . . . . . . . . . | 18Table 2.9: External Degree Programs: Enrollment and graduation (2001-07) . . . . . . . . . . . . . . | 20Table 2.10: Private HE Enrollments and HEIs as a Share of Total Enrollments, Various Years . . . . . | 23Table 2.11: Number of Sri Lankans Studying Abroad, 2001-2005 . . . . . . . . . . . . . . . . . . . . . | 24Table 2.12: Share of Female Enrollments by Level of Education . . . . . . . . . . . . . . . . . . . . . . . . | 24Table 2.13: Gender Parity Index in Secondary and Tertiary Education in Selected Countries (2004) | 25 Table 3.1: Profile of Academic Staff, 2007 . . . . . . . . . . . . . . . . . . . . . . . . . . . . . . . . . . . . | 33Table 3.2: Modes of Teaching used by Institutions Teaching External Degree Students . . . . . . . . | 43
v
Table 3.3: External Degree Student Responses on Lecture and Tutorial Hours (per week) . . . . . . . | 43Table 3.4: Recognized Degrees of Private Institutes under s. 25A of the Universities Act No: 1978 | 47Table 4.1: Tripartite System of Tertiary Education in Selected OECD Countries . . . . . . . . . . . . . | 54Table 4.2: Some Possible National Performance Indicators and Targets . . . . . . . . . . . . . . . . . . | 57Table 5.1: Projected Population, 2001- 2031 (million) . . . . . . . . . . . . . . . . . . . . . . . . . . . . . | 67Table 5.2: Sector-wise Distribution of GDP and Employment, 1963 – 2007 (%) . . . . . . . . . . . . | 69Table 5.3: Employment Structure by Major Occupational Groups, 2000 – 2008 (%) . . . . . . . . | 70Table 5.4: Utilization of Foreign Employment Opportunities versus Total . . . . . . . . . . . . . . . . . . | 71Table 5.5: Rates of Return to Schooling by Education Level and Gender, Selected South Asian Countries | 77Table 5.6: Gini Coefficients of Public Education Expenditure by Level of Education . . . . . . . . . . | 79Table 6.1: The Higher Education Budget, 2007-2011 (LKR million) . . . . . . . . . . . . . . . . . . . . | 83Table 6.2: HE Expenditure in Sri Lanka in Relation to Selected Comparator Countries . . . . . . . . | 84Table 6.3: HE Enrollment in Selected Years (Base Run) . . . . . . . . . . . . . . . . . . . . . . . . . . . . . | 86Table 6.4: Cost Implications of Scenario 1 and Scenario 2 (LKR billion) . . . . . . . . . . . . . . . . . | 89Table 6.5: Ratio of HE Budget to Sector Budget and GDP . . . . . . . . . . . . . . . . . . . . . . . . . . | 91Table 6.6: Relative Costs and Savings for Base Run and Scenarios (LKR billion) . . . . . . . . . . . . | 93Table 6.7: Ratio of Higher Education Budget to GDP and Government Budget in
Different Scenarios (high growth) . . . . . . . . . . . . . . . . . . . . . . . . . . . . . . . . . . . . | 94Table 6.8: Ratio of Higher Education Budget to GDP and Government Budget in
Different Scenarios (low growth) . . . . . . . . . . . . . . . . . . . . . . . . . . . . . . . . . . . . | 95
Boxes (in text)Box 3.1: The Enterprise in Higher Education Initiative, U.K. . . . . . . . . . . . . . . . . . . . . . . . . . | 31Box 3.2: Australian Learning and Teaching Council . . . . . . . . . . . . . . . . . . . . . . . . . . . . . . | 34Box 3.3: Academic Funds Examples from UK. . . . . . . . . . . . . . . . . . . . . . . . . . . . . . . . . . | 36Box 3.4: BIT Bachelor of Information Technology- University of Colombo . . . . . . . . . . . . . . . . | 44Box 3.5: International Examples of Private Accreditation/QA Arrangements . . . . . . . . . . . . . . | 49Box 3.6: Federación Mexicana de Instituciones Particulares de Educación Superior . . . . . . . . | 50Box 3.7: Some International Models of Quality Assurance . . . . . . . . . . . . . . . . . . . . . . . . . | 51Box 4.1: Ministry of Higher Education Malaysia . . . . . . . . . . . . . . . . . . . . . . . . . . . . . . . . | 57Box 4.2: Private Higher Education in Russia . . . . . . . . . . . . . . . . . . . . . . . . . . . . . . . . . . . | 64Box 4.3: Private Higher Education in China . . . . . . . . . . . . . . . . . . . . . . . . . . . . . . . . . . . | 65Box 5.1: University Industry Linkages at the University of Moratuwa (UoM) . . . . . . . . . . . . . . . | 75
vi
AACB Association to AdvanceCollegiate Schools of Business
APIIT Asia Pacific Institute forInformation Technology
ATI Advanced Technological InstituteAUQA Australian Universities Quality
AgencyBoISL Board of Investment of Sri LankaCHEA Council for Higher Education
AccreditationCHEBA Consortium for Higher Education
Benchmarking AnalysisCOPAES Consejo Para la Acreditación de
la Educación SuperiorDCS Department of Census and
StatisticsEDP External Degree ProgramESDFP Education Sector Development
Framework and ProgramESDP Education Sector Development
ProjectFDTL Fund for the Development of
Teaching and LearningFIMPES Federación Mexicana de
Instituciones Particulares deEducación Superior
GEC A/L General Certificate of Education(Advance Level)
GER Gross Enrollment RateGoSL Government of Sri LankaHEI Higher Education InstitutionHEMIS Higher Education Information
Management SystemsHEQC Higher Education Qualification
Management SystemICDL International Computer Driving
License
INQAAHE International Network for QualityAssurance Agencies in HigherEducation
IRQUE Improving Relevance and Qualityof Undergraduate EducationProject
IT Information TechnologyJISC Joint Information Services
CommitteeKEI Knowledge Economy IndexKPI Key Performance IndicatorLKR Sri Lankan RupeeMFP Ministry of Finance and PlanningMHE Ministry of Higher EducationMIC Middle Income CountryMQA Malaysian Qualifications AgencyNDP National Planning DepartmentNEC National Education CommissionODL Open and Distance LearningOUSL Open University of Sri LankaQAA Quality Assurance AgencyQAAC Quality Assurance and
Accreditation CouncilSDC Staff Development CenterSEDA Staff and Educational
Development AssociationSLAIHEE Sri Lankan Association for the
Improvement of Higher EducationEffectiveness
SLEAS Sri Lanka Education AdministrativeService
SLIATE Sri Lanka Institute for AdvancedTechnological Education
TQEF Teaching Quality EnhancementFund
UGC University Grants CommissionU-HEMIS University-Higher Education
Management Information System
vii
ABBREVIATIONS
viii
Vice PresidentIsabel Guerrero
Country DirectorNaoko Ishii
Sector DirectorMichael Rutkowski
Sector ManagerAmit Dar
Co-Team LeaderHarsha Aturupane
Co-Team LeaderBenoit Millot
TEAM MEMBERSThis report was written by a team consisting of co-Team Leaders HarshaAturupane (Senior Economist, SASHD) and Benoit Millot (Lead EducationSpecialist, SASHD), team members Lianqin Wang (Senior EducationSpecialist, MNSHD) and consultants Mohammed Allak, Sunil Chandrasiri,John Fielden, Sam Mikhail, Norman Laroque, Ralph Rawlinson and UpulSonnadara. The peer reviewers were Chris Thomas (Sector Manager HumanDevelopment, AFTH1), Kurt Larsen (Senior Education Specialist, WBIHD).Prof. Narada Warnasuriya, former Chairman, Committee of Vice-Chancellors and Deans (Sri Lanka) also provided peer review comments atthe concept stage of the report.
The team acknowledges with sincere gratitude the assistance of several World Bank colleagues andGovernment of Sri Lanka counterparts in the preparation of this report. In particular, Naoko Ishii(Country Director), Michal Rutkowski (Sector Director), Amit Dar (Education Sector Manager), and thethree peer reviewers. In addition, several officials and institutions in the Government of Sri Lankaassisted the preparation of this report. In particular, the Minister of Higher Education; the Secretary,Additional Secretary and staff of the Ministry of Higher Education; the Chairman, Vice-Chairman,members and staff of the University Grants Commission; the Minister, Secretary, Additional Secretariesand staff of the Ministry of Education; the Secretary and staff of the Ministry of Finance and Planning;the Department of Census and Statistics; the Vice-Chancellors of the Universities, the Director-Generaland staff of the Sri Lanka Institute of Advanced Technological Education; and numerous academics,researchers, representatives of the private sector, and students, who were consulted during thepreparation of this report.
ix
ACKNOWLEDGEMENTS

E 1
EXECUTIVE SUMMARY
Sri Lanka is poised on the crest of two great waves of opportunity. The first wave can transform thenation from a low-income country to a middle-income country. The second wave can transform thenation from a country in conflict to a country at peace.
The higher education sector can and must lead Sri Lanka successfully over the crests of these two wavesof golden opportunity. Higher education institutions should drive and accelerate the country’s ascent tomiddle-income (MIC) status. Also, the higher education system should inspire the country’s values, ethicsand social institutions so that Sri Lanka becomes celebrated as an enlightened and peaceful multi-ethnic,multi-religious and multi-cultural society.
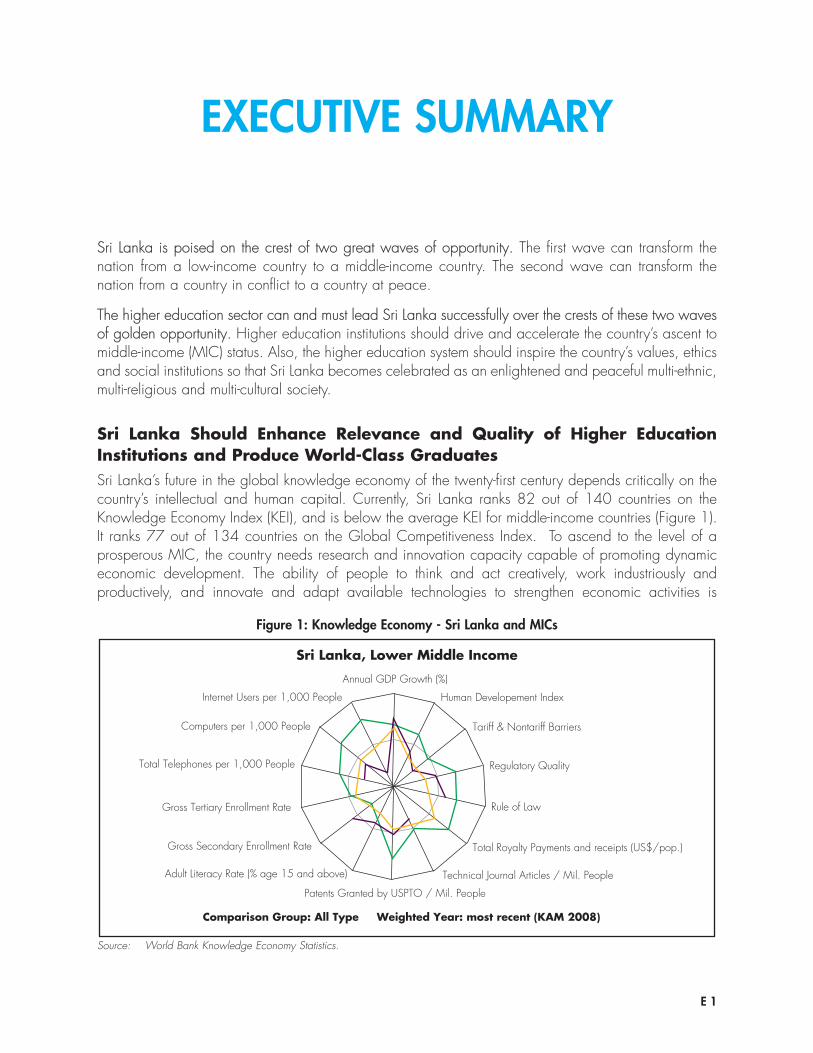
Sri Lanka Should Enhance Relevance and Quality of Higher EducationInstitutions and Produce World-Class GraduatesSri Lanka’s future in the global knowledge economy of the twenty-first century depends critically on thecountry’s intellectual and human capital. Currently, Sri Lanka ranks 82 out of 140 countries on theKnowledge Economy Index (KEI), and is below the average KEI for middle-income countries (Figure 1).It ranks 77 out of 134 countries on the Global Competitiveness Index. To ascend to the level of aprosperous MIC, the country needs research and innovation capacity capable of promoting dynamiceconomic development. The ability of people to think and act creatively, work industriously andproductively, and innovate and adapt available technologies to strengthen economic activities is
Figure 1: Knowledge Economy - Sri Lanka and MICs
Sri Lanka, Lower Middle Income
Comparison Group: All Type Weighted Year: most recent (KAM 2008)
Annual GDP Growth (%)
Internet Users per 1,000 People
Computers per 1,000 People
Total Telephones per 1,000 People
Gross Tertiary Enrollment Rate
Gross Secondary Enrollment Rate
Adult Literacy Rate (% age 15 and above)
Patents Granted by USPTO / Mil. People
Technical Journal Articles / Mil. People
Total Royalty Payments and receipts (US$/pop.)
Rule of Law
Regulatory Quality
Tariff & Nontariff Barriers
Human Developement Index
Source: World Bank Knowledge Economy Statistics.
cardinally important to achieve this objective. In this context, Sri Lanka needs a higher education systemthat can produce skilled, hard-working and enterprising graduates.
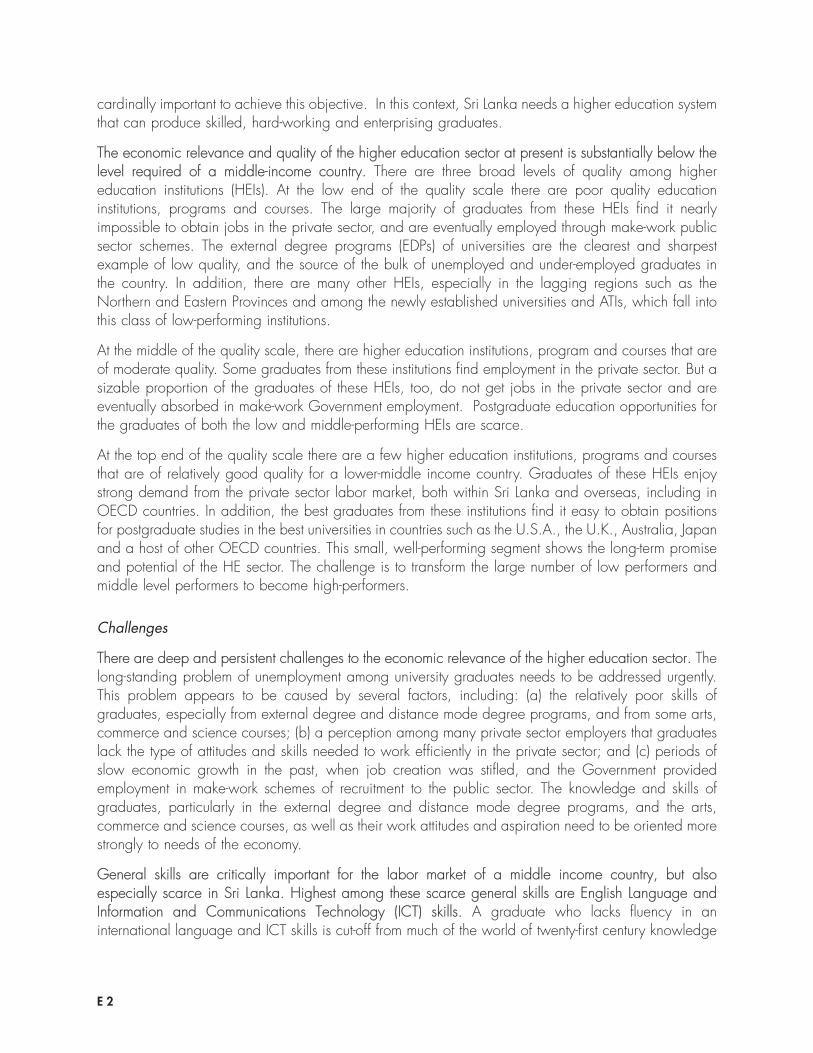
The economic relevance and quality of the higher education sector at present is substantially below thelevel required of a middle-income country. There are three broad levels of quality among highereducation institutions (HEIs). At the low end of the quality scale there are poor quality educationinstitutions, programs and courses. The large majority of graduates from these HEIs find it nearlyimpossible to obtain jobs in the private sector, and are eventually employed through make-work publicsector schemes. The external degree programs (EDPs) of universities are the clearest and sharpestexample of low quality, and the source of the bulk of unemployed and under-employed graduates inthe country. In addition, there are many other HEIs, especially in the lagging regions such as theNorthern and Eastern Provinces and among the newly established universities and ATIs, which fall intothis class of low-performing institutions.
At the middle of the quality scale, there are higher education institutions, program and courses that areof moderate quality. Some graduates from these institutions find employment in the private sector. But asizable proportion of the graduates of these HEIs, too, do not get jobs in the private sector and areeventually absorbed in make-work Government employment. Postgraduate education opportunities forthe graduates of both the low and middle-performing HEIs are scarce.
At the top end of the quality scale there are a few higher education institutions, programs and coursesthat are of relatively good quality for a lower-middle income country. Graduates of these HEIs enjoystrong demand from the private sector labor market, both within Sri Lanka and overseas, including inOECD countries. In addition, the best graduates from these institutions find it easy to obtain positionsfor postgraduate studies in the best universities in countries such as the U.S.A., the U.K., Australia, Japanand a host of other OECD countries. This small, well-performing segment shows the long-term promiseand potential of the HE sector. The challenge is to transform the large number of low performers andmiddle level performers to become high-performers.
Challenges
There are deep and persistent challenges to the economic relevance of the higher education sector. Thelong-standing problem of unemployment among university graduates needs to be addressed urgently.This problem appears to be caused by several factors, including: (a) the relatively poor skills ofgraduates, especially from external degree and distance mode degree programs, and from some arts,commerce and science courses; (b) a perception among many private sector employers that graduateslack the type of attitudes and skills needed to work efficiently in the private sector; and (c) periods ofslow economic growth in the past, when job creation was stifled, and the Government providedemployment in make-work schemes of recruitment to the public sector. The knowledge and skills ofgraduates, particularly in the external degree and distance mode degree programs, and the arts,commerce and science courses, as well as their work attitudes and aspiration need to be oriented morestrongly to needs of the economy.
General skills are critically important for the labor market of a middle income country, but alsoespecially scarce in Sri Lanka. Highest among these scarce general skills are English Language andInformation and Communications Technology (ICT) skills. A graduate who lacks fluency in aninternational language and ICT skills is cut-off from much of the world of twenty-first century knowledge
E 2
E 3
and information. And his or her productivity and performance at work would fall well below the levelrequired by reputed private sector firms from their managerial staff and technical specialists. The Englishlanguage skills of a large proportion of graduates are well below the threshold expected by privatesector firms. And access to ICT facilities and e-learning resources and e-teaching material in highereducation institutions is totally inadequate for a middle-income economy.
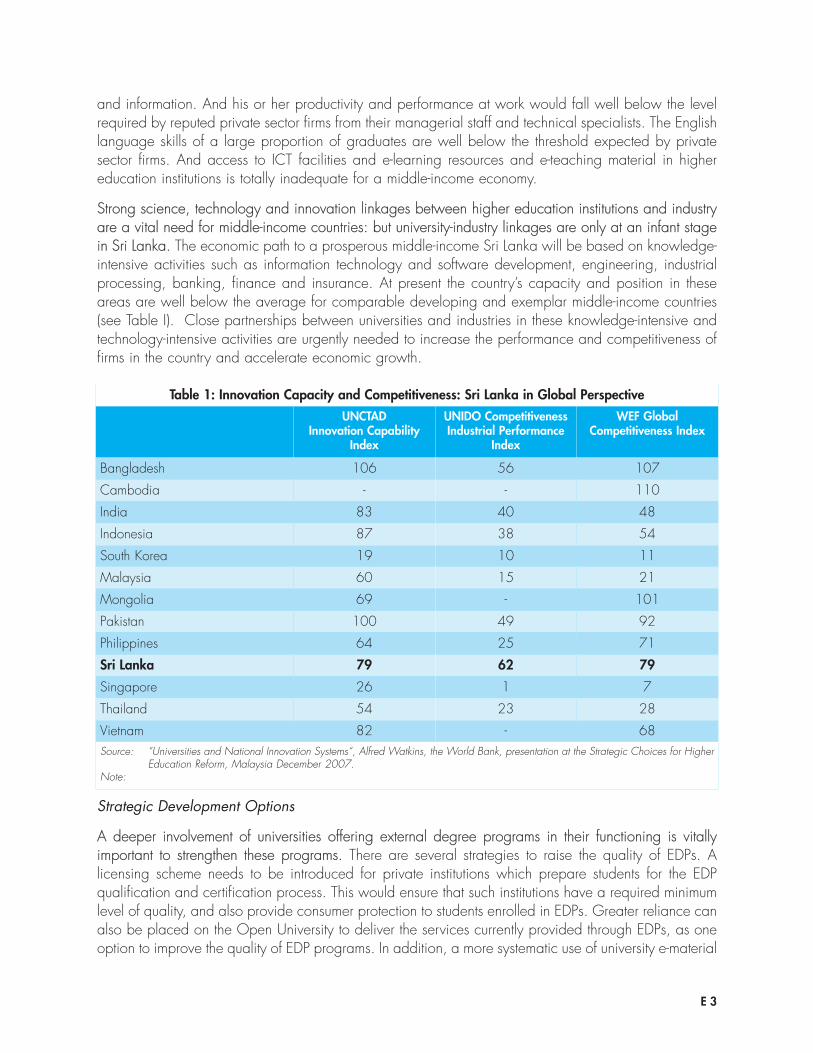
Strong science, technology and innovation linkages between higher education institutions and industryare a vital need for middle-income countries: but university-industry linkages are only at an infant stagein Sri Lanka. The economic path to a prosperous middle-income Sri Lanka will be based on knowledge-intensive activities such as information technology and software development, engineering, industrialprocessing, banking, finance and insurance. At present the country’s capacity and position in theseareas are well below the average for comparable developing and exemplar middle-income countries(see Table I). Close partnerships between universities and industries in these knowledge-intensive andtechnology-intensive activities are urgently needed to increase the performance and competitiveness offirms in the country and accelerate economic growth.
Table 1: Innovation Capacity and Competitiveness: Sri Lanka in Global Perspective
UNCTADInnovation Capability
Index
UNIDO CompetitivenessIndustrial Performance
Index
WEF GlobalCompetitiveness Index
Bangladesh 106 56 107
Cambodia - - 110
India 83 40 48
Indonesia 87 38 54
South Korea 19 10 11
Malaysia 60 15 21
Mongolia 69 - 101
Pakistan 100 49 92
Philippines 64 25 71
Sri Lanka 79 62 79
Singapore 26 1 7
Thailand 54 23 28
Vietnam 82 - 68Source: “Universities and National Innovation Systems“, Alfred Watkins, the World Bank, presentation at the Strategic Choices for Higher
Education Reform, Malaysia December 2007. Note:
Strategic Development Options
A deeper involvement of universities offering external degree programs in their functioning is vitallyimportant to strengthen these programs. There are several strategies to raise the quality of EDPs. Alicensing scheme needs to be introduced for private institutions which prepare students for the EDPqualification and certification process. This would ensure that such institutions have a required minimumlevel of quality, and also provide consumer protection to students enrolled in EDPs. Greater reliance canalso be placed on the Open University to deliver the services currently provided through EDPs, as oneoption to improve the quality of EDP programs. In addition, a more systematic use of university e-material
E 4
will be a rational approach to improve the quality of these EDPs. In this context, the School ofComputing of the University of Colombo provides a good example for other universities.
Developing the English language and ICT skills of students would dramatically improve theiremployment prospects and productivity at work. This initiative is especially needed for the arts,humanities, commerce and social science students, as a key weakness of these graduates, accordingto employers is their low stock of English language and ICT skills. The universities and faculties that offerarts, humanities, commerce and social science degrees should target additional resources, includingICT equipment and staff-student contact time, and develop quality processes, such as student supportfor the acquisition of language skills, to improve the English language and ICT skills of their students.This is a strategic initiative that would generate clear, multiple benefits. It would be popular amongstudents, have a high impact on their future performance in the world of work, and contribute positivelyto the quality of the country’s future labor force. The existence of a population fluent in English and ICTwould also help attract foreign firms to locate operations in the country.
Developing soft-skills as a part of degree programs would considerably enhance the employability ofgraduates. The degree programs of universities have focused mainly on the subject content andtechnical skills of students. Employers, however, require attitudes and skills such as initiative, trainability,flexibility, team-orientation, communication, positive work attitudes and discipline. Developing suchattitudes and skills among students, would strongly enhance the employability of graduates.
Expanding internship programs to provide work experience to students would strengthen the relevanceof higher education programs. Such internship programs have dual sets of benefits. On the side ofindustry, they enable employers to inculcate, train and assess students for their industrial needs duringin-plant training. This builds specific human capital and reduces search and sorting costs. On the sideof students it provides an opportunity to learn the skills and culture of private sector work places, andenables the development of attitudinal and technical skills for private sector employment.
Increasing private-sector partnerships in career guidance programs could make these programs morerelevant. University career guidance programs would be enriched by increased participation ofrepresentatives from the private sector. These representatives would be able to communicate in advancethe type of opportunities likely to arise in the private sector, as well as the skills that students need tobenefit from such opportunities. Students would then be able to make choices, such as the types ofcourses to offer, with such opportunities and skills in mind.
Promoting industry-university linkages in science, technology, and research and development is ofcardinal importance for Sri Lanka to be a high-performing middle income country. Sri Lanka’s economicadvancement as a MIC will depend critically on the acquisition, operation and use of technologies atincreasing levels of complexity, quality and productivity, as well as the generation of a continuousstream of improvements and innovations. The research skills and capacity of universities can uniquelysupport firms in technology acquisition, utilization and adaptation, as well as in innovation andknowledge creation. The promotion of such industry-university linkages in science, technology, andresearch and development would be greatly assisted through the development of professionallymanaged university business centers, technology commercialization offices and technology brokerprograms.
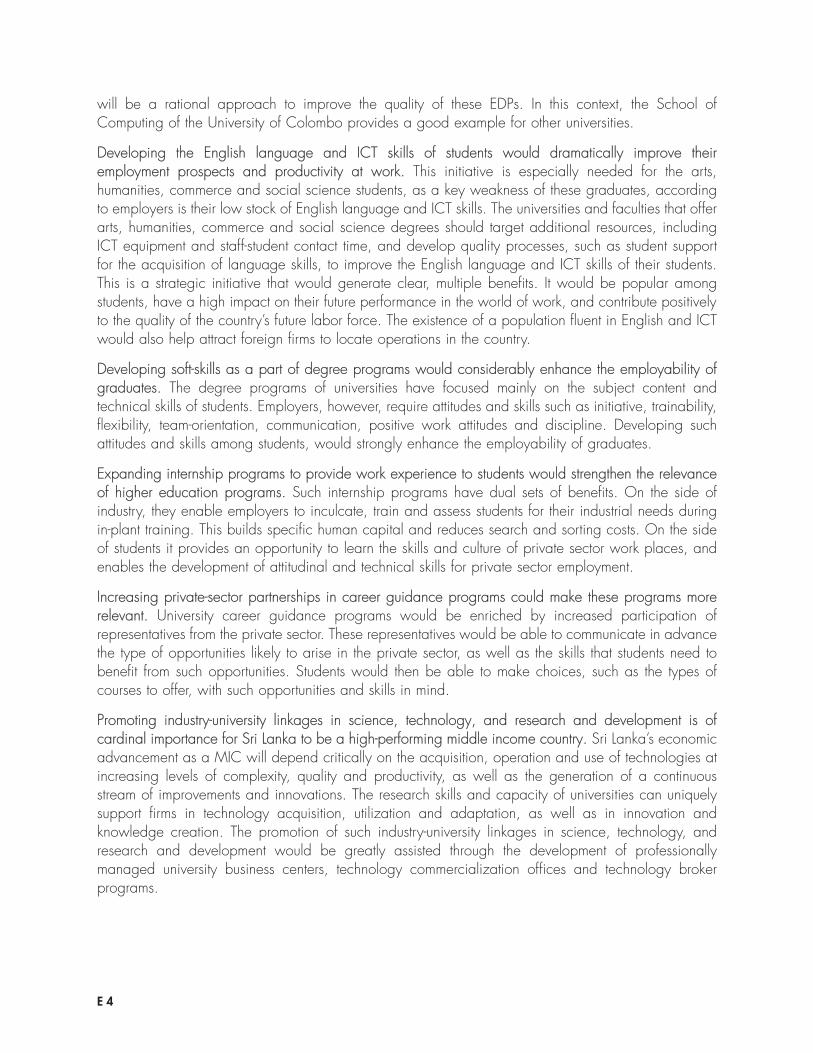
Governance is one of the most complex areas in the world-wide landscape of higher educationsystems. This is due to the rich variety and diversity of higher education institutions, with their horizontaland vertical linkages and relationships (Figure 2). Sri Lanka’s higher education sector has many of theinstitutions of this typology, but the overall sector needs greater coherence and internal consistency. Themain debate on higher education governance is the degree of autonomy that individual institutionsshould enjoy, and the systems of accountability and responsibility that should accompany this autonomy.The general global trend favors greater autonomy, which is seen as conducive to better performance.
The institutional structure of the higher education sector in Sri Lanka is poised between a centralized,top-down model and a decentralized model where higher education institutions are both largelyautonomous and empowered. The degree of autonomy and accountability varies considerably withinthe higher education sector. The SLIATE system is a highly centralized top-down model. The publicuniversities enjoy greater autonomy than the SLIATE institutions, especially in relation to the recruitmentof academic staff, curriculum development, and teaching and research activities. However, many otheraspects of public universities that are autonomous in developed and middle-income countries arecentralized in Sri Lanka. The private higher education sector operates mainly under institutionalmandates for the non-profit institutions and under market forces for the for-profit institutions, and is almostfully autonomous from the State.
Challenges
Pathways and mobility between across different types and levels of higher education are very limited.The Sri Lankan higher education sector has a wide and diverse range of institutions, on the lines of thetypology presented in Figure 1, and can be seen as transitioning from a binary system to a tri-partitesystem. However, clear learning pathways providing access to - and mobility and progression within -education, training and career paths, are extremely scarce. Given that modern thinking has shifted from
E 5
Figure 2: A Typology of Higher Education
Universities Alternative Institutions
The Binary SystemDevelopment of the Alternative Sector of Higher Education(1960 - 1985)
Tier IElite
Research Universities
Tier IIUniversities &
Degree GrantingInstitutions
Tier IIIShort Cycle
Institutions
The Tri - Partite SystemDevelopment of Hybrid Tier II Institutions (1985 - 2008)
The Alternative Sector of Higher Education
The University Sector of Higher Education
The University Sector of Higher Education
The Alternative Sector of Higher Education
Source: Grubb, W.N. (2003), The Roles of Tertiary Colleges and Institutes: Trade-offs in Restructuring Postsecondary Education, Paris.
The Governance Framework for Higher Education Needs to be ofInternational Standard
education for employment – developing the ability to do a specific job - to education for employability– developing the ability to adapt acquired skills to new working environments, the lack of suchpathways hinders the development of an adaptable and technically skilled workforce.
Consultations with academics and university staff suggest that excessive central control can, in manycases, constrain performance. The Ministry of Higher Education (MHE) and the University GrantsCommission (UGC) are faced with an unnecessary administrative workload due to the number ofoperational decisions that need to be taken, and this in turn limits their time and attention for high-levelpolicy matters. Entrepreneurialism and initiative are reduced in universities because of central controlsand the need to obtain approvals. Delays can also accumulate while the central institutions makedecisions. And, as a result of the long administrative chains caused by the centralized elements of thesystem, personal authority and informal relationships can play a role, hindering procedural efficiency.
The governance of universities is based on the classical Commonwealth model, but misses some of themodern developments that currently characterized this model. For instance, unlike in the more advancedhigher education systems in the Commonwealth, such as the U.K., Australia, and Canada, there is nonormative funding system for public universities; instead recurrent funding among individual universitiesin Sri Lanka is largely based on historical levels, and capital funding is based mainly on negotiationsbetween individual institutions, the MHE/UGC and the Ministry of Finance and Planning (MFP). Theinstitutional structure of higher education institutions is characterized by a greater degree of interventionby central authorities than is common in more advanced higher education systems. In consequence, thecurrent management and administrative capacity of universities are comparatively under-developed.This is especially the case with the newer, more recently established universities and the universities inthe lagging regions, especially the Northern and Eastern Provinces.
Quality assurance mechanisms have narrow coverage, and should be considerably broadened. Thecountry lacks quality assurance mechanisms for the alternative higher education sector, the privatehigher education sector, and the external degree programs. Within the public universities, qualityassurance mechanisms are only just commencing for postgraduate education programs, and will requiresubstantial future development. At the undergraduate level quality assurance processes have beenintroduced during the recent past, but these now need to be developed and strengthened to becomean integral part of the university system.
Strategic Development Options
There are a variety of initiatives and reforms to modernize the governance of the higher educationsector.
The development of a National Qualification Framework is a high priority to strengthen the governanceframework of the higher education sector. This framework should cover the universities, the alternativehigher education institutions, and the distance mode and external degree programs (see Box 1 for someinternational examples of national qualification frameworks). It would establish pathways for access andmobility within the various different types of institutions. It would also link the higher education sector tothe career paths of individuals, so that individuals could move flexibly between the higher educationsector and their work lives, depending on their needs for skill acquisition and vertical and horizontaljob mobility.
E 6
The tightly centralized SLIATE structure needs to be lightened, with greater empowerment of theAdvanced Technological Institutes (ATIs). In particular, the ATIs should have more autonomy andresponsibility for academic activities such as curriculum development, and assessment andexaminations. The head office of SLIATE should evolve into a higher-level body for planning, monitoring,analysis and policy development. Such changes in the head office of SLIATE and the ATIs must bepreceded and accompanied by staff development, organizational strengthening and capacity buildingto enable these agencies to play their new roles effectively.
The quality improvement of the SLIATE institutions is a high priority. The alternative higher educationsector has received less policy attention than the university sector, and is comparatively under-developed. Considerable institutional development is needed in the future to strengthen SLIATE. At thecentral level, an academic staff leadership institute should be set up for SLIATE with a mandate tosupport teaching staff with learning innovations and work-based teaching and assessmentmethodologies. The private sector should also be involved in the design of curricula, and examinationsand assessment methods. In this context, Program Advisory Committees, with representation from theprivate sector and employers federations, would be extremely useful to support SLIATE institutions tobetter serve labor market needs.
Greater devolution of powers to universities can be considered in several areas. These include thepromotion of academic staff; the determination of academic salary levels, especially in shortagesubjects; the recruitment of non-academic staff; the development of new academic courses; the creationof new academic positions within a standard budget; and decisions regarding the governance structureof the institutions. For devolution to be effective, first it would be necessary to establish clearaccountability mechanisms. Second, the managerial capacity of the university leadership and
E 7
Box 1: International Examples of National Qualification Frameworks
The Australian Qualification Framework (AQF)
The AQF has the following objectives.
Bringing together the qualifications issued by the higher education and vocational education and trainingsystems into a single comprehensive system of titles and standards.
Supporting flexible education and training pathways between sectors and lifelong learning.
Encouraging parity of esteem between academic and training qualifications.
Supporting the diversity of purposes of providers in the education and training sectors.
Encouraging cross-sector partnerships.
Underpinning national policies on quality assurance, articulation and credit transfer.
The Irish National Framework of Qualifications (INFQ)
The INFQ is a structure of ten levels ranging from basic certificates to doctoral awards.
Levels are defined by “level indicators“ which are broad descriptions of learning outcomes.
“Award types“ are defined based on the level indicators, as classes of named awards sharing common featuresand levels.
The INFQ is not credit-based. However, a credit arrangement is being developed to take into consideration theEuropean Credit Transfer System (ECTS) and the European Credit for Vocational Education and Training(ECVET).
administration needs to be built up if universities are to be endowed with greater responsibility andaccountability.
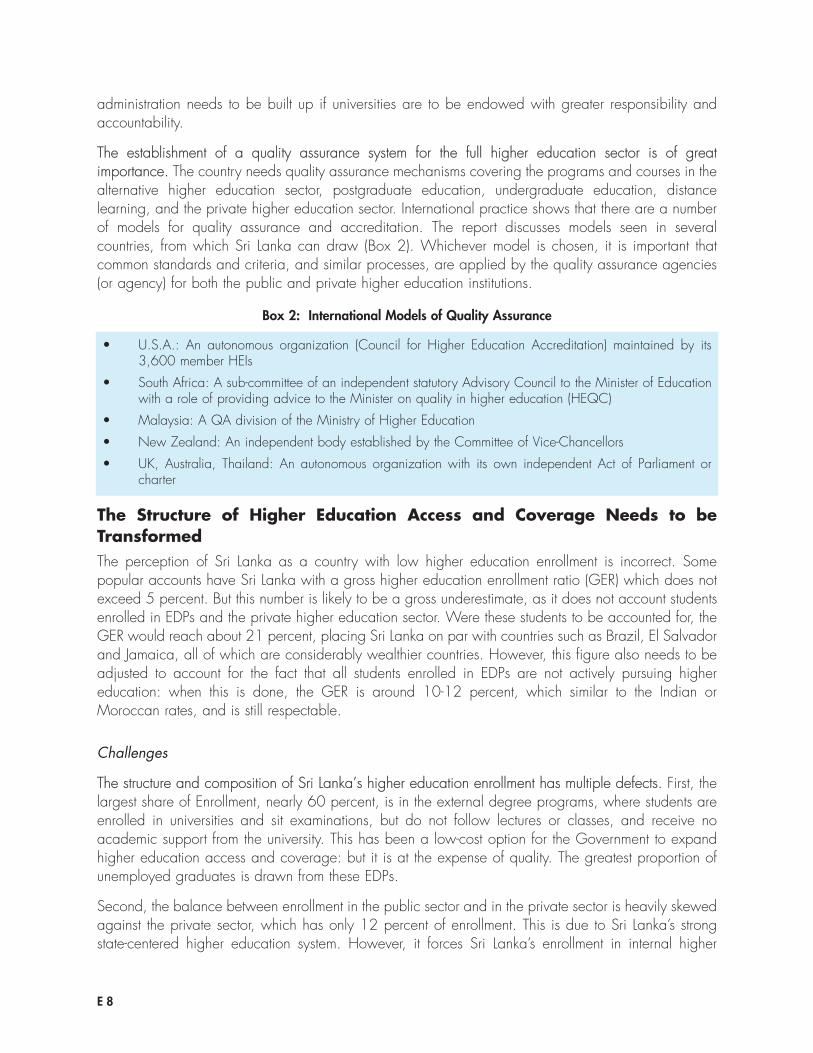
The establishment of a quality assurance system for the full higher education sector is of greatimportance. The country needs quality assurance mechanisms covering the programs and courses in thealternative higher education sector, postgraduate education, undergraduate education, distancelearning, and the private higher education sector. International practice shows that there are a numberof models for quality assurance and accreditation. The report discusses models seen in severalcountries, from which Sri Lanka can draw (Box 2). Whichever model is chosen, it is important thatcommon standards and criteria, and similar processes, are applied by the quality assurance agencies(or agency) for both the public and private higher education institutions.
E 8
Box 2: International Models of Quality Assurance
• U.S.A.: An autonomous organization (Council for Higher Education Accreditation) maintained by its3,600 member HEIs
• South Africa: A sub-committee of an independent statutory Advisory Council to the Minister of Educationwith a role of providing advice to the Minister on quality in higher education (HEQC)
• Malaysia: A QA division of the Ministry of Higher Education
• New Zealand: An independent body established by the Committee of Vice-Chancellors
• UK, Australia, Thailand: An autonomous organization with its own independent Act of Parliament orcharter
The Structure of Higher Education Access and Coverage Needs to beTransformedThe perception of Sri Lanka as a country with low higher education enrollment is incorrect. Somepopular accounts have Sri Lanka with a gross higher education enrollment ratio (GER) which does notexceed 5 percent. But this number is likely to be a gross underestimate, as it does not account studentsenrolled in EDPs and the private higher education sector. Were these students to be accounted for, theGER would reach about 21 percent, placing Sri Lanka on par with countries such as Brazil, El Salvadorand Jamaica, all of which are considerably wealthier countries. However, this figure also needs to beadjusted to account for the fact that all students enrolled in EDPs are not actively pursuing highereducation: when this is done, the GER is around 10-12 percent, which similar to the Indian orMoroccan rates, and is still respectable.
Challenges
The structure and composition of Sri Lanka’s higher education enrollment has multiple defects. First, thelargest share of Enrollment, nearly 60 percent, is in the external degree programs, where students areenrolled in universities and sit examinations, but do not follow lectures or classes, and receive noacademic support from the university. This has been a low-cost option for the Government to expandhigher education access and coverage: but it is at the expense of quality. The greatest proportion ofunemployed graduates is drawn from these EDPs.
Second, the balance between enrollment in the public sector and in the private sector is heavily skewedagainst the private sector, which has only 12 percent of enrollment. This is due to Sri Lanka’s strongstate-centered higher education system. However, it forces Sri Lanka’s enrollment in internal higher
education programs to be lowered to only about 40 percent of all enrollment, with the balance 60percent in EDPs. This, as discussed above, lowers the overall quality of the sector. And it prevents SriLanka from exploiting the potential of the private sector to contribute to the expansion of highereducation access and coverage.
Third, Enrollment in employment-oriented alternative higher education institutions in the public sector issmall. This is an important and growing sub-sector of the global higher education landscape. Yet, thepotential of this very important sub-sector is under-utilized in Sri Lanka. Enrollments in SLIATE remainmarginal, only 3 percent of total higher education enrollment.
Fourth, the composition of students in the conventional degree programs of the universities is stilldominated by disciplines such as the liberal arts, management, commerce and law, with under-representation of scientific and technical fields. A middle-income country, if it is to grow fast, needs ahigher proportion of skilled and competent science and technical graduates.
Strategic Development Options
As the country develops, the demand for higher education will rise, and Sri Lanka will need to find waysof expanding the supply of places in the higher education system. This will provide an excellentopportunity to strengthen the structure and composition of the higher education sector. There are severalpolicy initiatives available to the Government to achieve this objective.
Enrollment in job-oriented alternative higher education programs, such as the courses offered by SLIATE,should be expanded over time. The alternative higher education sector courses are directly job-oriented,and fit a key market niche. Also, these institutions are usually more flexible and can respond to changinglabor market needs faster than conventional universities. They also have a lower unit cost thanuniversities, so that enrollment expansion will be less costly for the Government.
The share of enrollment in internal degree of programs of higher education institutions must increase,and enrollment in the poor quality external degree programs needs to decrease over time. Enrollmentin external degree programs need to be carefully controlled, with stringent entry and progress criteria,which are tied to the ability of the universities to provide a good quality education for the EDPs. Andas internal degree programs expand these should partially substitute for the positions in EDPs. Inaddition, the expansion of enrollment in the SLIATE ATIs will also enable substitution of EDPs in favor ofthe ATIs.
The private higher education sector needs to be encouraged to grow and expand. Countries aroundthe world, including former communist countries in Asia and Eastern Europe, as well as many SouthAsia countries such as India, Pakistan and Bangladesh, encourage and foster the growth of the privatesector to increase access and coverage of higher education (Box 3). Private HEIs mainly offeremployment-oriented programs and courses, and graduates obtain jobs with relative ease. Theexpansion of the private higher education sector also does not cost the Government much, as these areself-financing institutions.
E 9
Within the university sector, the share of enrollment in employment-oriented science and technologyprograms must rise. The space for higher enrollment and growth within the university sector is mainly inthe newly established regional universities. The expansion of enrollment in these institutions should bein directly job-oriented programs, linked to the evolving economic needs of Sri Lanka as a middle-income country. These are mainly likely to be in the scientific and technology oriented disciplines, ashas been the case in countries such as Malaysia, South Korea, Thailand, Brazil, Chile and Argentina.
A key prerequisite for the formulation of policy options to expand higher education access andcoverage is to establish a sound higher education management information system (HEMIS). Withouta solid HEMIS planning and monitoring the system is not possible. The Ministry of Higher Education(MHE) and the University Grants Commission (UGC) are establishing a HEMIS which covers theuniversities. Over time, the MHE should expand the HEMIS to include SLIATE and the private highereducation sector.
A New Paradigm is Needed for Planning and Financing Higher Education The development of the higher education sector, across all its dimensions of access and coverage,quality, governance and relevance, will require substantial resources. The resource envelope availablewill determine which options for development are feasible. In consequence, it is important to mobilizeresources for the development strategy, as well as to ensure that the resources available are efficientlyutilized.
Challenges
Sri Lanka under-invests in higher education in comparison to middle-income countries and otherdeveloping countries. The country spends a substantially smaller portion of its national wealth, and aneven smaller proportion of its total public budget, on education than its comparators (Figure 3). South
E 10
Box 3: Private Higher Education in Russia and China
Russia: The first private HEIs appeared as a result of the 1992 Russian Federation Law on Education. While itshares many features of private sectors of higher education worldwide, Russian private HE has its unique traits:considerable public involvement in the creation of the HEIs and continued association of private institutions withvarious state-supported organizations and public resources. As of 2005, there were 413 private institutionscompared to 655 public institutions. Private higher education accounts for approximately 15 percent of allhigher education enrollments. The primary characteristics of private universities are: market based academicprogram offerings and other fields that do not require much investment in equipment and research infrastructure,flexibility in curriculum, lower admission requirements, limited research focus and dependence on tuition forfinancing.
China: The People’s Republic of China did not allow private higher education until the 1980’s. The first privateHEI appeared in 1978, but the major surge began in the 1980’s. By 2000 more than 1200 private institutionsexisted. In 2003, the Law for the Promotion of Private Education authorized the establishment of privateuniversities. The total number of accredited private institutions, defined as being recognized by the Ministryof Education to grant associate or/and bachelor degrees, has jumped from 43 in 2000 to 278 in 2006.Today private HEIs account for 10 percent of China's higher education enrollments. The primary reason for theState to allow private education was because the state could not fund adequate expansion in the public sector.In 1997 the Government issued the first regulations concerning private education, which reaffirmed privateeducation’s nonprofit nature. Now the Government actively promotes private higher education and grantsconcessions and incentives to private HEIs.
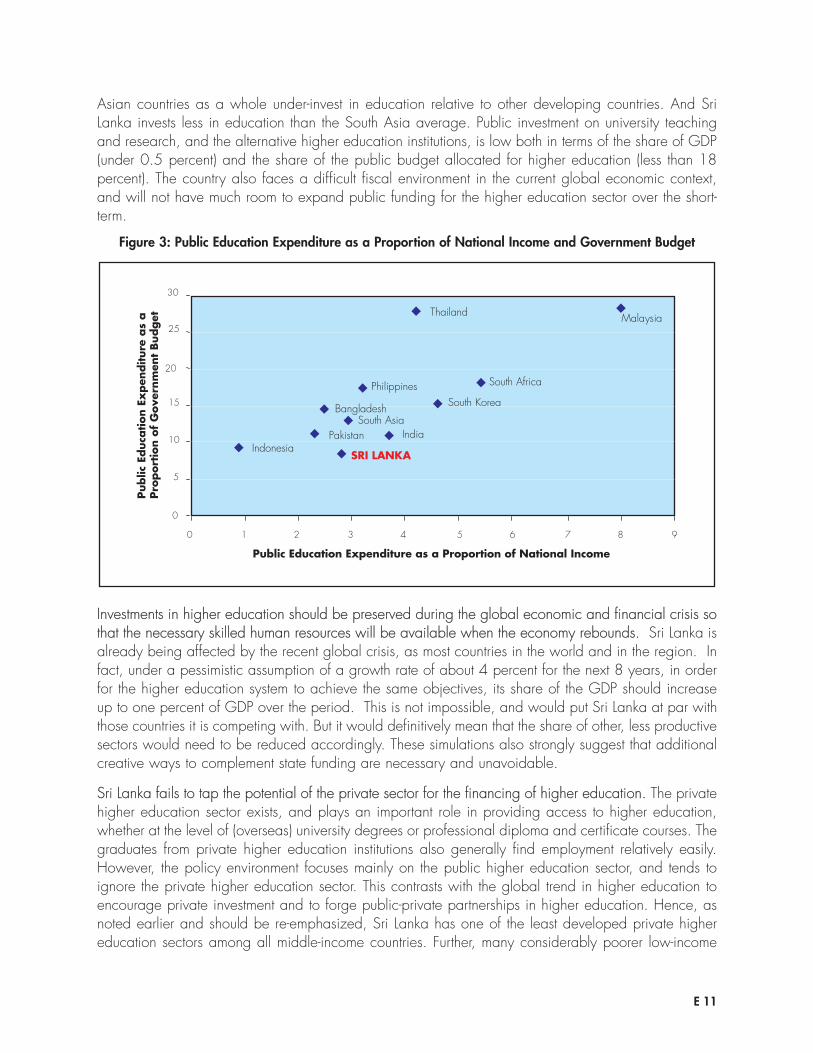
Asian countries as a whole under-invest in education relative to other developing countries. And SriLanka invests less in education than the South Asia average. Public investment on university teachingand research, and the alternative higher education institutions, is low both in terms of the share of GDP(under 0.5 percent) and the share of the public budget allocated for higher education (less than 18percent). The country also faces a difficult fiscal environment in the current global economic context,and will not have much room to expand public funding for the higher education sector over the short-term.
E 11
Investments in higher education should be preserved during the global economic and financial crisis sothat the necessary skilled human resources will be available when the economy rebounds. Sri Lanka isalready being affected by the recent global crisis, as most countries in the world and in the region. Infact, under a pessimistic assumption of a growth rate of about 4 percent for the next 8 years, in orderfor the higher education system to achieve the same objectives, its share of the GDP should increaseup to one percent of GDP over the period. This is not impossible, and would put Sri Lanka at par withthose countries it is competing with. But it would definitively mean that the share of other, less productivesectors would need to be reduced accordingly. These simulations also strongly suggest that additionalcreative ways to complement state funding are necessary and unavoidable.
Sri Lanka fails to tap the potential of the private sector for the financing of higher education. The privatehigher education sector exists, and plays an important role in providing access to higher education,whether at the level of (overseas) university degrees or professional diploma and certificate courses. Thegraduates from private higher education institutions also generally find employment relatively easily.However, the policy environment focuses mainly on the public higher education sector, and tends toignore the private higher education sector. This contrasts with the global trend in higher education toencourage private investment and to forge public-private partnerships in higher education. Hence, asnoted earlier and should be re-emphasized, Sri Lanka has one of the least developed private highereducation sectors among all middle-income countries. Further, many considerably poorer low-income
Figure 3: Public Education Expenditure as a Proportion of National Income and Government Budget
0
5
10
15
20
25
30
Public Education Expenditure as a Proportion of National Income
Philippines
SRI LANKA
Thailand Malaysia
Indonesia
South Africa
South KoreaBangladesh
IndiaPakistan
0 1 2 3 4 5 6 7 8 9
Public
Educa
tion E
xpen
diture
as
aPro
port
ion o
f G
ove
rnm
ent
Budget
South Asia
countries, including India, Pakistan and Bangladesh, outperform Sri Lanka in attracting private sectorinvestment to higher education.
Strategic Development Options
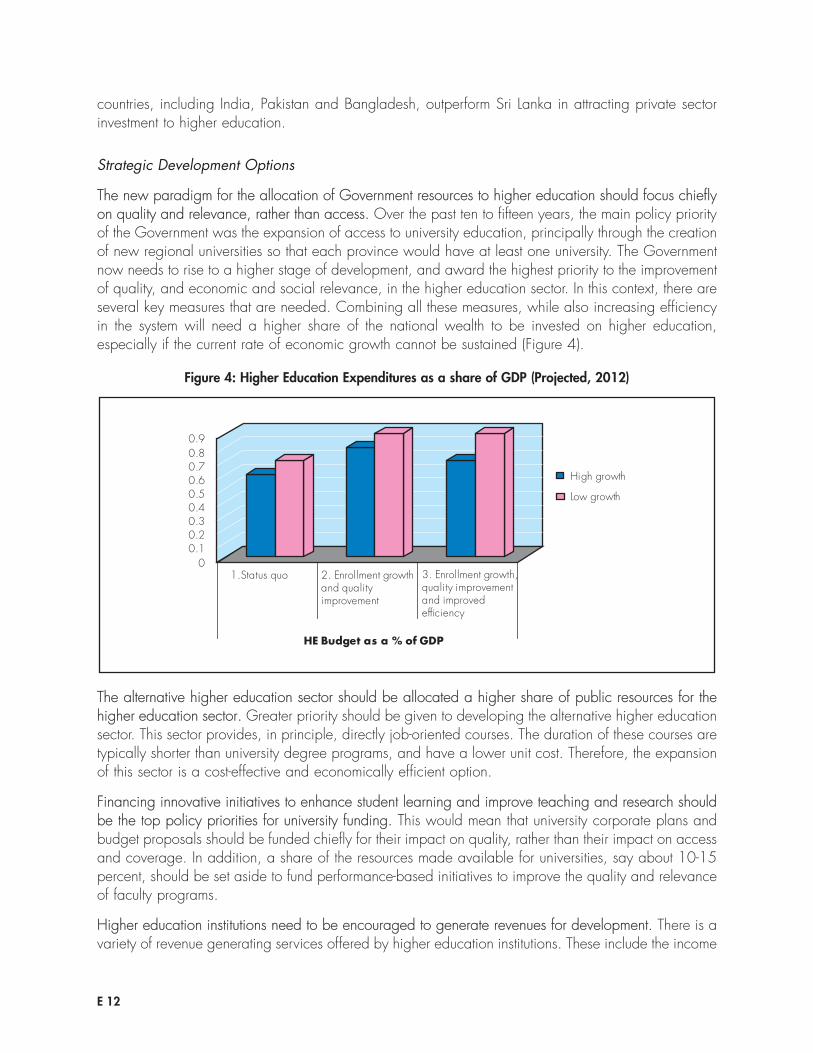
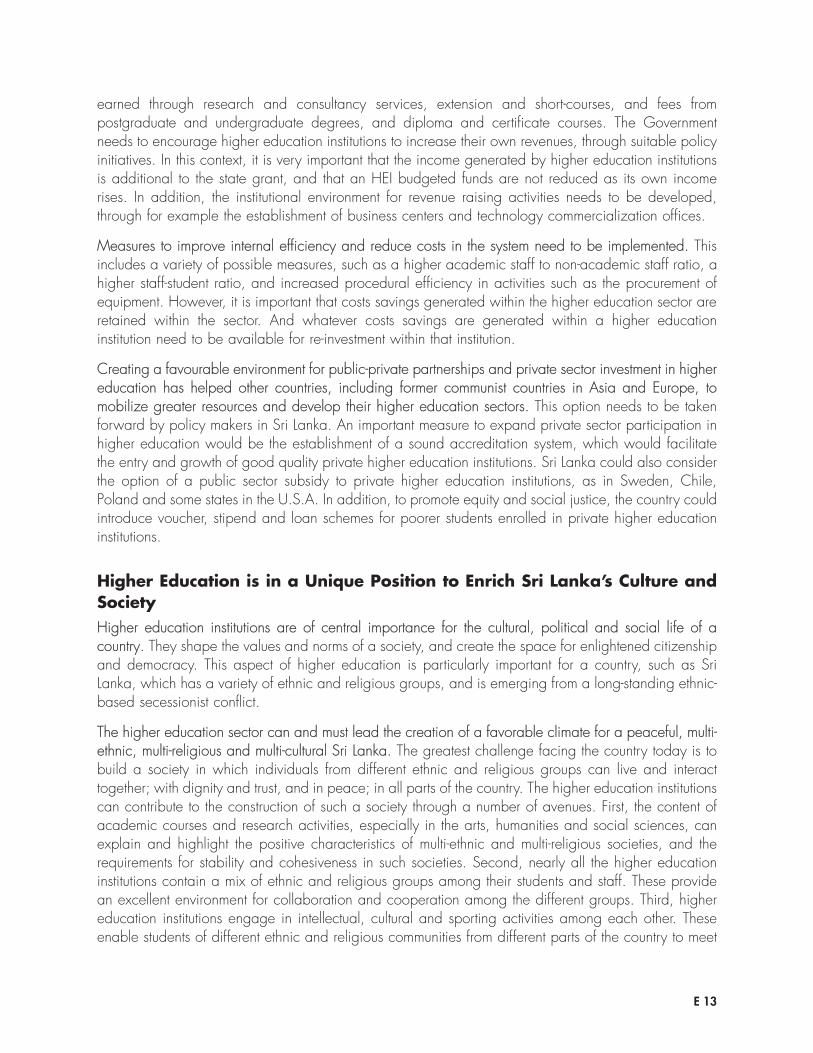
The new paradigm for the allocation of Government resources to higher education should focus chieflyon quality and relevance, rather than access. Over the past ten to fifteen years, the main policy priorityof the Government was the expansion of access to university education, principally through the creationof new regional universities so that each province would have at least one university. The Governmentnow needs to rise to a higher stage of development, and award the highest priority to the improvementof quality, and economic and social relevance, in the higher education sector. In this context, there areseveral key measures that are needed. Combining all these measures, while also increasing efficiencyin the system will need a higher share of the national wealth to be invested on higher education,especially if the current rate of economic growth cannot be sustained (Figure 4).
E 12
The alternative higher education sector should be allocated a higher share of public resources for thehigher education sector. Greater priority should be given to developing the alternative higher educationsector. This sector provides, in principle, directly job-oriented courses. The duration of these courses aretypically shorter than university degree programs, and have a lower unit cost. Therefore, the expansionof this sector is a cost-effective and economically efficient option.
Financing innovative initiatives to enhance student learning and improve teaching and research shouldbe the top policy priorities for university funding. This would mean that university corporate plans andbudget proposals should be funded chiefly for their impact on quality, rather than their impact on accessand coverage. In addition, a share of the resources made available for universities, say about 10-15percent, should be set aside to fund performance-based initiatives to improve the quality and relevanceof faculty programs.
Higher education institutions need to be encouraged to generate revenues for development. There is avariety of revenue generating services offered by higher education institutions. These include the income
Figure 4: Higher Education Expenditures as a share of GDP (Projected, 2012)
HE Budget as a % of GDP
00.10.20.30.40.50.60.70.80.9
1.Status quo 2. Enrollment growthand qualityimprovement
3. Enrollment growth,quality improvementand improvedefficiency
High growth
Low growth
earned through research and consultancy services, extension and short-courses, and fees frompostgraduate and undergraduate degrees, and diploma and certificate courses. The Governmentneeds to encourage higher education institutions to increase their own revenues, through suitable policyinitiatives. In this context, it is very important that the income generated by higher education institutionsis additional to the state grant, and that an HEI budgeted funds are not reduced as its own incomerises. In addition, the institutional environment for revenue raising activities needs to be developed,through for example the establishment of business centers and technology commercialization offices.
Measures to improve internal efficiency and reduce costs in the system need to be implemented. Thisincludes a variety of possible measures, such as a higher academic staff to non-academic staff ratio, ahigher staff-student ratio, and increased procedural efficiency in activities such as the procurement ofequipment. However, it is important that costs savings generated within the higher education sector areretained within the sector. And whatever costs savings are generated within a higher educationinstitution need to be available for re-investment within that institution.
Creating a favourable environment for public-private partnerships and private sector investment in highereducation has helped other countries, including former communist countries in Asia and Europe, tomobilize greater resources and develop their higher education sectors. This option needs to be takenforward by policy makers in Sri Lanka. An important measure to expand private sector participation inhigher education would be the establishment of a sound accreditation system, which would facilitatethe entry and growth of good quality private higher education institutions. Sri Lanka could also considerthe option of a public sector subsidy to private higher education institutions, as in Sweden, Chile,Poland and some states in the U.S.A. In addition, to promote equity and social justice, the country couldintroduce voucher, stipend and loan schemes for poorer students enrolled in private higher educationinstitutions.
Higher Education is in a Unique Position to Enrich Sri Lanka’s Culture andSocietyHigher education institutions are of central importance for the cultural, political and social life of acountry. They shape the values and norms of a society, and create the space for enlightened citizenshipand democracy. This aspect of higher education is particularly important for a country, such as SriLanka, which has a variety of ethnic and religious groups, and is emerging from a long-standing ethnic-based secessionist conflict.
The higher education sector can and must lead the creation of a favorable climate for a peaceful, multi-ethnic, multi-religious and multi-cultural Sri Lanka. The greatest challenge facing the country today is tobuild a society in which individuals from different ethnic and religious groups can live and interacttogether; with dignity and trust, and in peace; in all parts of the country. The higher education institutionscan contribute to the construction of such a society through a number of avenues. First, the content ofacademic courses and research activities, especially in the arts, humanities and social sciences, canexplain and highlight the positive characteristics of multi-ethnic and multi-religious societies, and therequirements for stability and cohesiveness in such societies. Second, nearly all the higher educationinstitutions contain a mix of ethnic and religious groups among their students and staff. These providean excellent environment for collaboration and cooperation among the different groups. Third, highereducation institutions engage in intellectual, cultural and sporting activities among each other. Theseenable students of different ethnic and religious communities from different parts of the country to meet
E 13
and interact together. Fourth, higher education institutions provide a climate for collaborative researchamong academics of different ethnic and religious groups.
The higher education sector should be at the forefront in the creation and promotion of the enlightenedcitizens needed for a democratic country. A long period of armed conflict, as in Sri Lanka, erodes thenorms and attitudes required for a well-functioning civil administration and political democracy. Thehigher education institutions, through their teaching and research, need to enhance and strengthen thevalues and norms, such as pluralism, social tolerance, respect for diversity, and reasoned debate, thatare at the heart of political democracy.
Leading Change and Accelerating DevelopmentThe development of the higher education sector will be of immense benefit and value to Sri Lanka. Itwill also be a complex and challenging process, and require visionary leadership from politicalauthorities and policy makers, and ownership and long-term commitment from the higher educationcommunity.
Higher education development requires sustained, long-term commitment from political authorities. Inparticular, innovative initiatives in governance can be difficult, as these often involve devolving powerand authority from central levels of Government to individual institutions, such as the universities andadvanced technological institutions. In addition, modern innovations in university financing, such asintroducing revenue systems that range broader than tax financing, and introducing performance basedfunding as an incentive and reward, can be controversial as it pushes some traditional-mindedindividuals out of their comfort zone. Hence, such policy initiatives need visionary and sustainedleadership from the highest levels of the political system.
The higher education development strategy in Sri Lanka should be broadly communicated, especiallyamong the academic community, and widespread ownership generated. The individual academic staffmembers are of central importance to the delivery of good quality higher education services. Therefore,the ownership and commitment of academics is a necessary condition for the successful developmentof a higher education strategy. The Ministry of Higher Education, the NEC and the UGC need tocommunicate the scope, objective and rationale for the higher education development program to theacademic community. The choice of strategies to implement, and their ordering and sequencing, willneed to be accomplished with the participation, ownership and commitment of the academiccommunity.
The higher education institutions in lagging regions, such as the Northern, Eastern and other outlyingProvinces, require special and priority policy attention. The higher education development strategy hasto be differentiated according to the level of development of the various higher education institutions.The older, well-established higher education institutions in the neighborhood of cities such as Colombo,Kandy and Matara are at a more advanced stage of development. As a result, they can undertakeambitious development initiatives. In contrast, the higher education institutions located in laggingregions, such as the Northern, Eastern and other distant provinces, are relatively under-developed, withless qualified staff, poorer facilities, and academic and managerial systems and processes that are stillbeing established. These higher education institutions need greater policy attention and strategicfinancing.
E 14
The media needs to be allies in the process of implementation of the higher education developmentstrategy. The popular media plays a vital role in providing information and shaping the perceptions ofthe general public. It is important that the achievements of the higher education system, its futurechallenges, and the strategies adopted to address these challenges, are communicated to andunderstood by the media. This, in turn, will enable the leaders of change and development tocommunicate to the general public their vision of the future of the higher education system, and theirstrategy to achieve that vision. The support and understanding of the public will be of great importanceto generate long-term political interest and commitment to the higher education development strategy.
The higher education community contains the cream of the country’s intelligentsia, and has uniquepotential to contribute to the economic and human development of the country. However, this is apotential that has been substantially under-utilized in the past, partly due to the various constraints facedby the sector, and partly due to the weaknesses within the sector. The academic community of thecountry needs to lead, participate in and support the process of higher education development. Thisprocess of development will have to be at multiple levels, including the level of the entire sector, thelevel of individual institutions within the sector, and the level of individual programs and courses withininstitutions. The higher education community operates at each of these levels, and can and shouldgenerate and sustain development in each sphere, and of course, over all spheres.
Key Development InitiativesThis paper has laid out a number of key development measures and initiatives that would enable SriLanka to keep abreast of the tide of modern higher education strategy and development. These includepolicies and initiatives to improve the quality of the higher education system and make it moreresponsive to the needs of the labor market. The agenda is comprehensive and all these policies andinitiatives cannot be implemented immediately. Given this, the report presents below some of the criticalinitiatives and measures that need to be undertaken in the medium-term (first phase) followed by othersthat need to be implemented over the long-term. However the initial work required to undertake reformsover both the medium-term and long-term should commence immediately. All the measures proposedbelow are discussed in more detail in the main body of the paper.
E 15
E 16
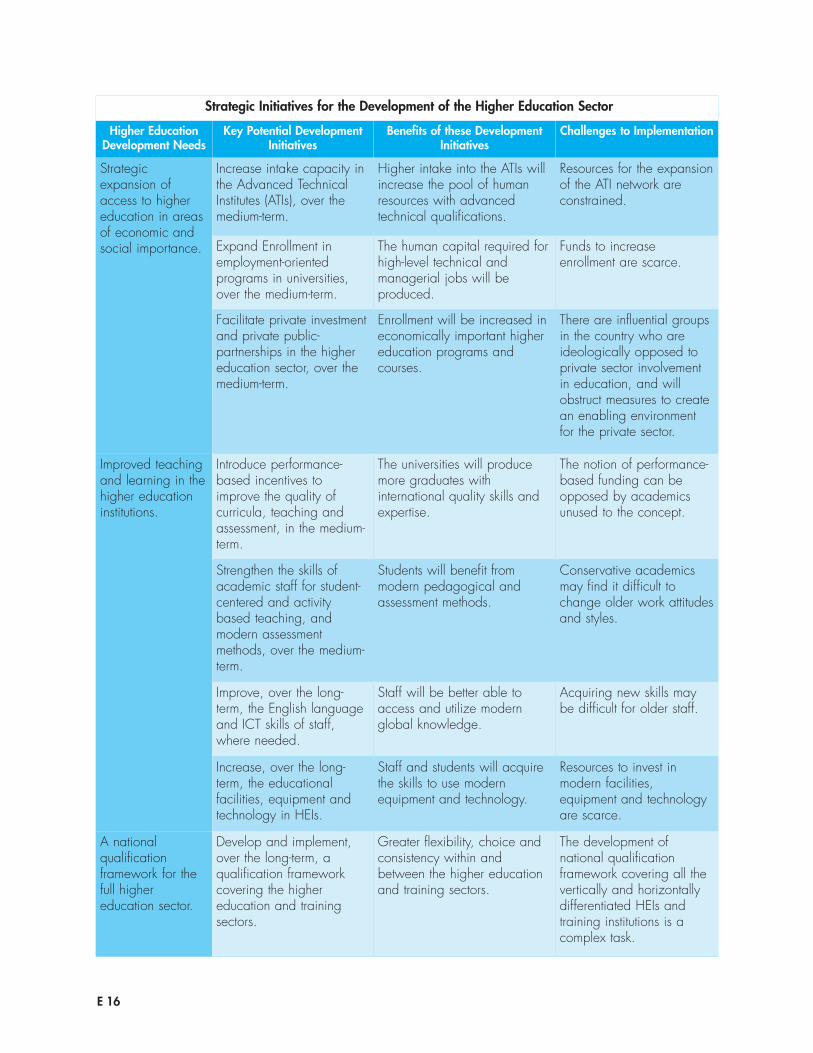
Strategic Initiatives for the Development of the Higher Education Sector
Higher EducationDevelopment Needs
Key Potential DevelopmentInitiatives
Benefits of these DevelopmentInitiatives
Challenges to Implementation
Strategicexpansion ofaccess to highereducation in areasof economic andsocial importance.
Increase intake capacity inthe Advanced TechnicalInstitutes (ATIs), over themedium-term.
Higher intake into the ATIs willincrease the pool of humanresources with advancedtechnical qualifications.
Resources for the expansionof the ATI network areconstrained.
Expand Enrollment inemployment-orientedprograms in universities,over the medium-term.
The human capital required forhigh-level technical andmanagerial jobs will beproduced.
Funds to increaseenrollment are scarce.
Facilitate private investmentand private public-partnerships in the highereducation sector, over themedium-term.
Enrollment will be increased ineconomically important highereducation programs andcourses.
There are influential groupsin the country who areideologically opposed toprivate sector involvementin education, and willobstruct measures to createan enabling environmentfor the private sector.
Improved teachingand learning in thehigher educationinstitutions.
Introduce performance-based incentives toimprove the quality ofcurricula, teaching andassessment, in the medium-term.
The universities will producemore graduates withinternational quality skills andexpertise.
The notion of performance-based funding can beopposed by academicsunused to the concept.
Strengthen the skills ofacademic staff for student-centered and activitybased teaching, andmodern assessmentmethods, over the medium-term.
Students will benefit frommodern pedagogical andassessment methods.
Conservative academicsmay find it difficult tochange older work attitudesand styles.
Improve, over the long-term, the English languageand ICT skills of staff,where needed.
Staff will be better able toaccess and utilize modernglobal knowledge.
Acquiring new skills maybe difficult for older staff.
Increase, over the long-term, the educationalfacilities, equipment andtechnology in HEIs.
Staff and students will acquirethe skills to use modernequipment and technology.
Resources to invest inmodern facilities,equipment and technologyare scarce.
A nationalqualificationframework for thefull highereducation sector.
Develop and implement,over the long-term, aqualification frameworkcovering the highereducation and trainingsectors.
Greater flexibility, choice andconsistency within andbetween the higher educationand training sectors.
The development ofnational qualificationframework covering all thevertically and horizontallydifferentiated HEIs andtraining institutions is acomplex task.
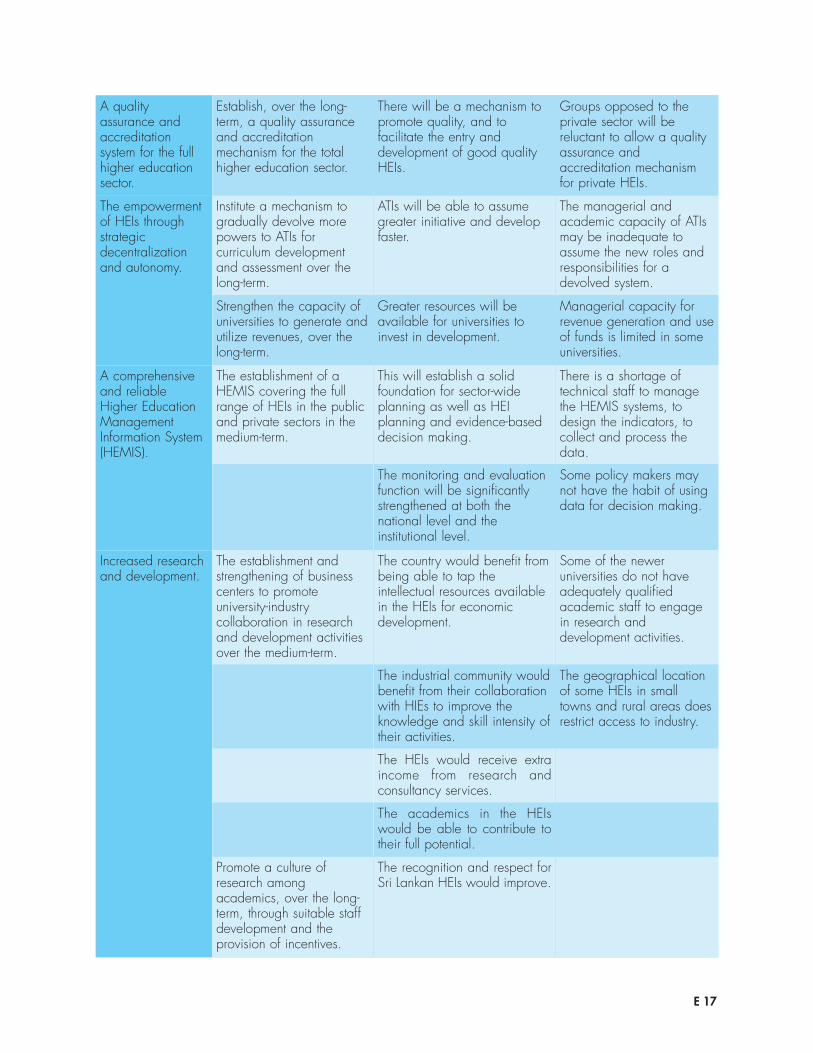
E 17
A qualityassurance andaccreditationsystem for the fullhigher educationsector.
Establish, over the long-term, a quality assuranceand accreditationmechanism for the totalhigher education sector.
There will be a mechanism topromote quality, and tofacilitate the entry anddevelopment of good qualityHEIs.
Groups opposed to theprivate sector will bereluctant to allow a qualityassurance andaccreditation mechanismfor private HEIs.
The empowermentof HEIs throughstrategicdecentralizationand autonomy.
Institute a mechanism togradually devolve morepowers to ATIs forcurriculum developmentand assessment over thelong-term.
ATIs will be able to assumegreater initiative and developfaster.
The managerial andacademic capacity of ATIsmay be inadequate toassume the new roles andresponsibilities for adevolved system.
Strengthen the capacity ofuniversities to generate andutilize revenues, over thelong-term.
Greater resources will beavailable for universities toinvest in development.
Managerial capacity forrevenue generation and useof funds is limited in someuniversities.
A comprehensiveand reliableHigher EducationManagementInformation System(HEMIS).
The establishment of aHEMIS covering the fullrange of HEIs in the publicand private sectors in themedium-term.
This will establish a solidfoundation for sector-wideplanning as well as HEIplanning and evidence-baseddecision making.
There is a shortage oftechnical staff to managethe HEMIS systems, todesign the indicators, tocollect and process thedata.
The monitoring and evaluationfunction will be significantlystrengthened at both thenational level and theinstitutional level.
Some policy makers maynot have the habit of usingdata for decision making.
Increased researchand development.
The establishment andstrengthening of businesscenters to promoteuniversity-industrycollaboration in researchand development activitiesover the medium-term.
The country would benefit frombeing able to tap theintellectual resources availablein the HEIs for economicdevelopment.
Some of the neweruniversities do not haveadequately qualifiedacademic staff to engagein research anddevelopment activities.
The industrial community wouldbenefit from their collaborationwith HIEs to improve theknowledge and skill intensity oftheir activities.
The geographical locationof some HEIs in smalltowns and rural areas doesrestrict access to industry.
The HEIs would receive extraincome from research andconsultancy services.
The academics in the HEIswould be able to contribute totheir full potential.
Promote a culture ofresearch amongacademics, over the long-term, through suitable staffdevelopment and theprovision of incentives.
The recognition and respect forSri Lankan HEIs would improve.
E 18
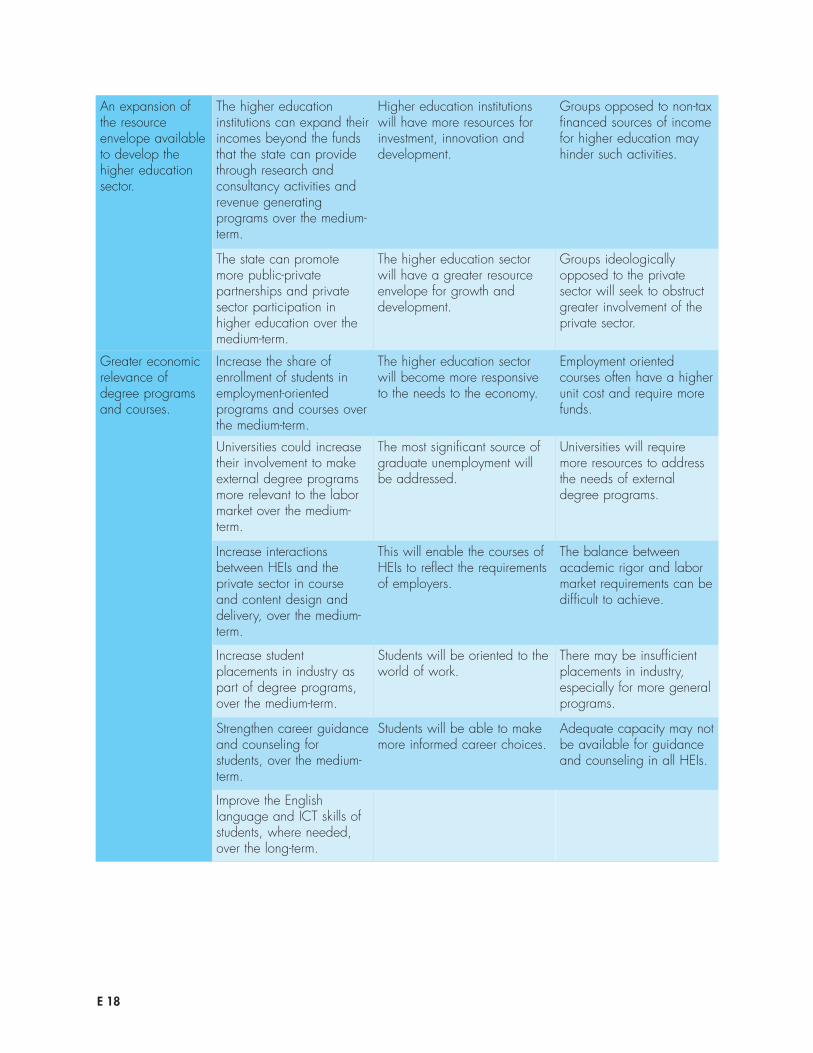
An expansion ofthe resourceenvelope availableto develop thehigher educationsector.
The higher educationinstitutions can expand theirincomes beyond the fundsthat the state can providethrough research andconsultancy activities andrevenue generatingprograms over the medium-term.
Higher education institutionswill have more resources forinvestment, innovation anddevelopment.
Groups opposed to non-taxfinanced sources of incomefor higher education mayhinder such activities.
The state can promotemore public-privatepartnerships and privatesector participation inhigher education over themedium-term.
The higher education sectorwill have a greater resourceenvelope for growth anddevelopment.
Groups ideologicallyopposed to the privatesector will seek to obstructgreater involvement of theprivate sector.
Greater economicrelevance ofdegree programsand courses.
Increase the share ofenrollment of students inemployment-orientedprograms and courses overthe medium-term.
The higher education sectorwill become more responsiveto the needs to the economy.
Employment orientedcourses often have a higherunit cost and require morefunds.
Universities could increasetheir involvement to makeexternal degree programsmore relevant to the labormarket over the medium-term.
The most significant source ofgraduate unemployment willbe addressed.
Universities will requiremore resources to addressthe needs of externaldegree programs.
Increase interactionsbetween HEIs and theprivate sector in courseand content design anddelivery, over the medium-term.
This will enable the courses ofHEIs to reflect the requirementsof employers.
The balance betweenacademic rigor and labormarket requirements can bedifficult to achieve.
Increase studentplacements in industry aspart of degree programs,over the medium-term.
Students will be oriented to theworld of work.
There may be insufficientplacements in industry,especially for more generalprograms.
Strengthen career guidanceand counseling forstudents, over the medium-term.
Students will be able to makemore informed career choices.
Adequate capacity may notbe available for guidanceand counseling in all HEIs.
Improve the Englishlanguage and ICT skills ofstudents, where needed,over the long-term.
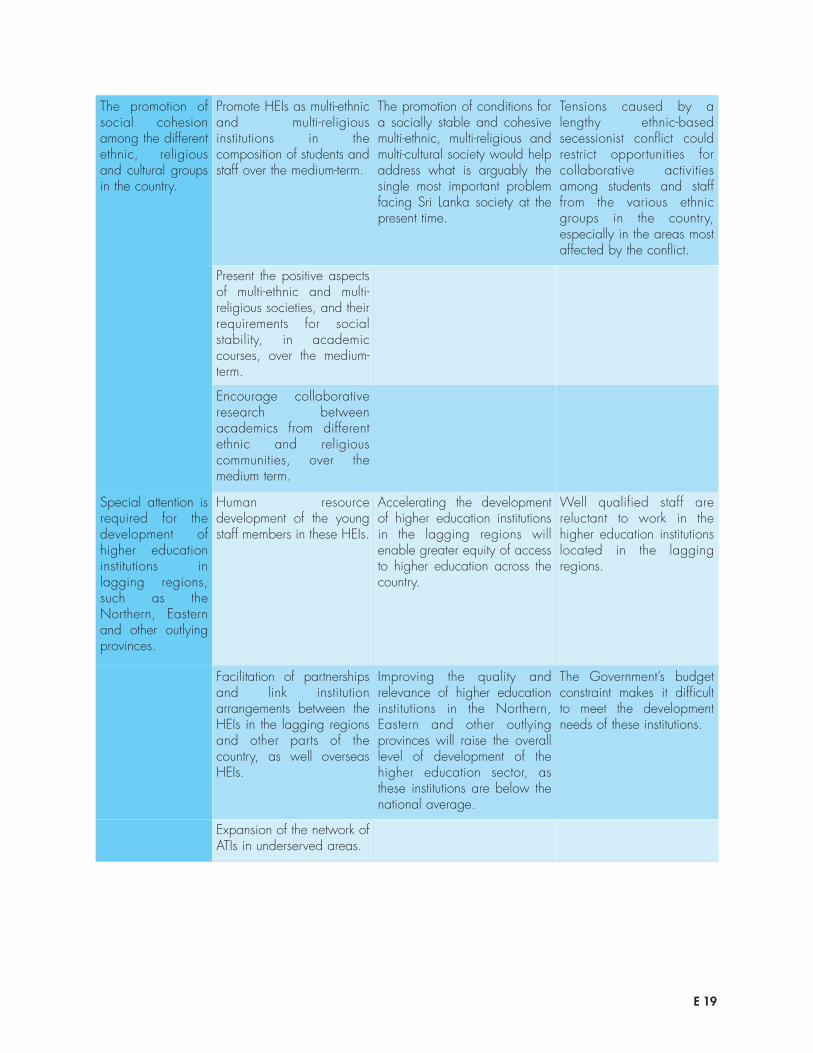
E 19
The promotion ofsocial cohesionamong the differentethnic, religiousand cultural groupsin the country.
Promote HEIs as multi-ethnicand multi-religiousinstitutions in thecomposition of students andstaff over the medium-term.
The promotion of conditions fora socially stable and cohesivemulti-ethnic, multi-religious andmulti-cultural society would helpaddress what is arguably thesingle most important problemfacing Sri Lanka society at thepresent time.
Tensions caused by alengthy ethnic-basedsecessionist conflict couldrestrict opportunities forcollaborative activitiesamong students and stafffrom the various ethnicgroups in the country,especially in the areas mostaffected by the conflict.
Present the positive aspectsof multi-ethnic and multi-religious societies, and theirrequirements for socialstability, in academiccourses, over the medium-term.
Encourage collaborativeresearch betweenacademics from differentethnic and religiouscommunities, over themedium term.
Special attention isrequired for thedevelopment ofhigher educationinstitutions inlagging regions,such as theNorthern, Easternand other outlyingprovinces.
Human resourcedevelopment of the youngstaff members in these HEIs.
Accelerating the developmentof higher education institutionsin the lagging regions willenable greater equity of accessto higher education across thecountry.
Well qualified staff arereluctant to work in thehigher education institutionslocated in the laggingregions.
Facilitation of partnershipsand link institutionarrangements between theHEIs in the lagging regionsand other parts of thecountry, as well overseasHEIs.
Improving the quality andrelevance of higher educationinstitutions in the Northern,Eastern and other outlyingprovinces will raise the overalllevel of development of thehigher education sector, asthese institutions are below thenational average.
The Government’s budgetconstraint makes it difficultto meet the developmentneeds of these institutions.
Expansion of the network ofATIs in underserved areas.

1
Chapter OneTHE HIGHER EDUCATIONSECTOR IN SRI LANKA
Introduction1.1 Sri Lanka is poised on the crest of two great waves of opportunity. One wave can transform thenation from a low-income country to a middle-income country. The second wave can transform thenation from a country in conflict to a country at peace.
1.2 The higher education sector can and must lead Sri Lanka successfully over the crests of these twowaves of golden opportunity. Higher education institutions should drive and accelerate the country’sascent to middle-income (MIC) status. Also, the higher education system should inspire the country’svalues, ethics and social institutions so that Sri Lanka becomes celebrated as an enlightened andpeaceful multi-ethnic, multi-religious and multi-cultural society.
The Economic and Sector Context1.3 Sri Lanka’s future in the global knowledge economy of the twenty-first century depends criticallyon the country’s intellectual and human capital. The ability of people to think and act creatively, workindustriously and productively, and innovate and adapt available technologies to strengthen economicactivities is cardinally important in the modern world. In this context, Sri Lanka needs a higher educationsystem that can produce skilled, hard-working and enterprising graduates. Also, the country needsresearch and innovation capacity capable of promoting dynamic economic development.
1.4 The economy has been expanding relatively strongly in the recent past, with an average annualgrowth rate in excess of six percent during the five year period 2004-2008.1 The composition of thenational economy has been changing over time in favor of services and industry. The share of theservice sector in GDP has increased from 48 percent in 1990 to 60 percent in 2007. The share ofindustry has risen slightly from 26 percent to 28 percent over the same period, while the share ofagriculture has fallen from 26 percent in 1990 to 12 percent in 2007. Around 42 percent of the laborforce is employed in the service sector, with a further 27 percent employed in the industrial sector and31 percent employed in the agriculture sector. Incomes and living standards are normally higher amongindividuals engaged in service or industrial sector activity. Conversely, poverty and deprivation levelsare higher among individuals working in agriculture.
1 Sri Lanka has been affected adversely by the global downturn in 2009. However, past experience suggests that growthwould be reasonably strong again when the global economy recovers.
1.5 The Government’s policy for national development seeks to promote equitable, broad-basedeconomic growth through the expansion of infrastructure, rural development and investment in humancapital. Priority areas for growth include agriculture, and services such as banking, finance andinsurance, telecommunications, and ICT and software development. All of the priority service areasrequire well-educated professionals, technical staff and managers. The country faces a challengingmacroeconomic and external economic environment, with the downturn in the global economy.However, notwithstanding the negative impact of the current global economic crisis, the prospects foreconomic development over the long-term are better, especially through the promotion of policiesfavorable to private-sector led growth. The economic performance of the country has also beenweakened over the past twenty-five years due to a secessionist conflict in the Northern and EasternProvinces. The Government’s stated policy is to award priority policy attention the development of thesetwo provinces, combined with political reforms to meet the social and economic aspirations of thepeople living in these areas.
1.6 Policy makers are aware of the key importance of education for long-term economic and humandevelopment. The country is implementing an Education Sector Development Framework and Program(ESDFP) to address the long-term challenges of equitable access, quality, efficiency and goodgovernance in basic and secondary education. Higher education is also an area of intense publicinterest. The Government, under the leadership of the National Education Commission (NEC), and inpartnership with the Ministry of Higher Education (MHE), the Ministry of Finance and Planning (MFP),the University Grants Commission (UGC) and other stakeholders in the higher education system, suchas academics, researchers and development partners, is developing a policy framework for HigherEducation.
The Structure of the Higher Education Sector1.7 The higher education sector has a high degree of horizontal and vertical differentiation, with awide and varied range of institutions. There are both public sector and private sector higher educationinstitutions (Figure 1.1). The public sector consists of universities, research and postgraduate institutes,and advanced technical institutes. The research and postgraduate institutes are normally specializedinstitutions. The universities deliver both undergraduate and postgraduate degree programs. Thepostgraduate degrees range from diplomas to masters degrees to PhDs. The undergraduate degreesare normally three or four year programs, except the medical degree which takes five years. Bothconventional degree programs and distance mode degree programs are available in the universities.The advanced technical institutes provide employment-oriented courses at diploma and higher nationaldiploma level. These typically range between 2-3 years.
1.8 The private sector consists of both degree awarding institutions and providers of alternative highereducation qualifications, such as professional certificates and diplomas. The private degree awardinginstitutions usually offer the degrees of overseas universities, from a diverse range of countries, includingthe U.S.A., the U.K., Australia, Singapore and China. The institutions that prepare students forprofessional certificates and diplomas often provide training for foreign professional qualifications,particularly in fields such as accounting, IT and marketing. The countries whose professionalqualifications are most in demand include the U.K. and Australia.
1.9 In addition, more and more students travel overseas for their higher education studies. Again, therange of countries in which students seek higher education is broad and varied, and covers countriesas diverse as the U.S.A., U.K., Japan, Canada, Germany, Australia, New Zealand, Russia, Malaysia,
2
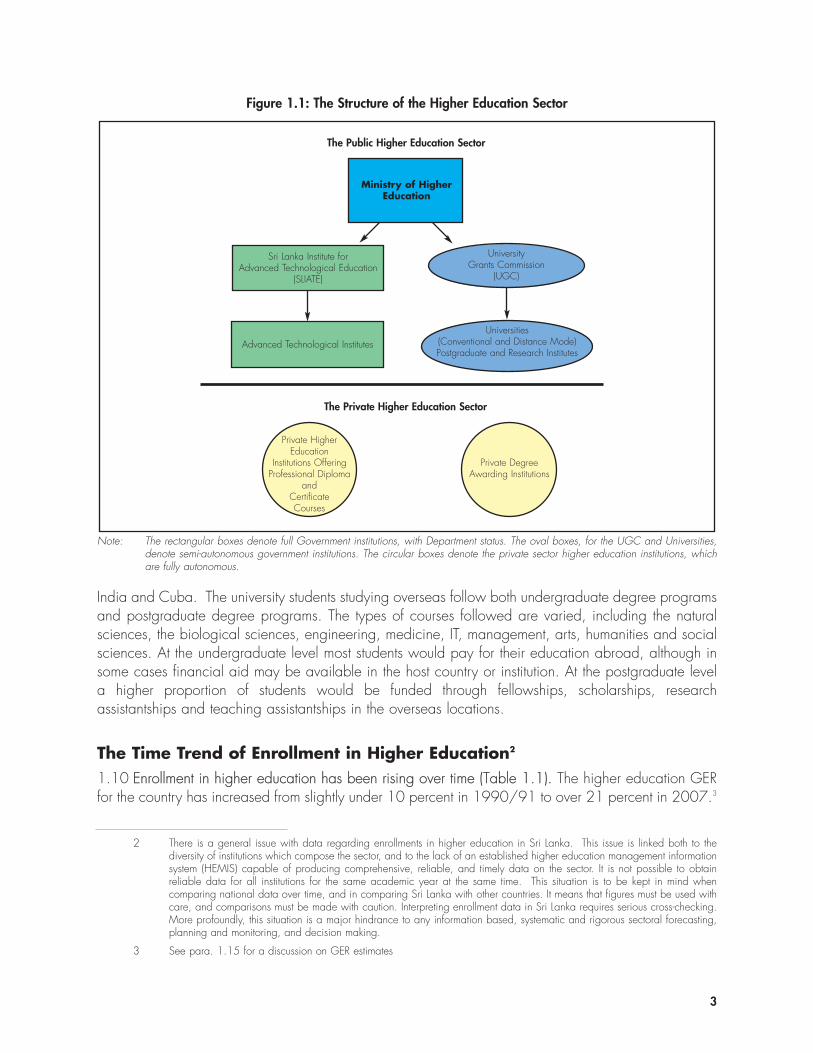
India and Cuba. The university students studying overseas follow both undergraduate degree programsand postgraduate degree programs. The types of courses followed are varied, including the naturalsciences, the biological sciences, engineering, medicine, IT, management, arts, humanities and socialsciences. At the undergraduate level most students would pay for their education abroad, although insome cases financial aid may be available in the host country or institution. At the postgraduate levela higher proportion of students would be funded through fellowships, scholarships, researchassistantships and teaching assistantships in the overseas locations.
The Time Trend of Enrollment in Higher Education2
1.10 Enrollment in higher education has been rising over time (Table 1.1). The higher education GERfor the country has increased from slightly under 10 percent in 1990/91 to over 21 percent in 2007.3
3
Figure 1.1: The Structure of the Higher Education Sector
Note: The rectangular boxes denote full Government institutions, with Department status. The oval boxes, for the UGC and Universities,denote semi-autonomous government institutions. The circular boxes denote the private sector higher education institutions, whichare fully autonomous.
2 There is a general issue with data regarding enrollments in higher education in Sri Lanka. This issue is linked both to thediversity of institutions which compose the sector, and to the lack of an established higher education management informationsystem (HEMIS) capable of producing comprehensive, reliable, and timely data on the sector. It is not possible to obtainreliable data for all institutions for the same academic year at the same time. This situation is to be kept in mind whencomparing national data over time, and in comparing Sri Lanka with other countries. It means that figures must be used withcare, and comparisons must be made with caution. Interpreting enrollment data in Sri Lanka requires serious cross-checking.More profoundly, this situation is a major hindrance to any information based, systematic and rigorous sectoral forecasting,planning and monitoring, and decision making.
3 See para. 1.15 for a discussion on GER estimates
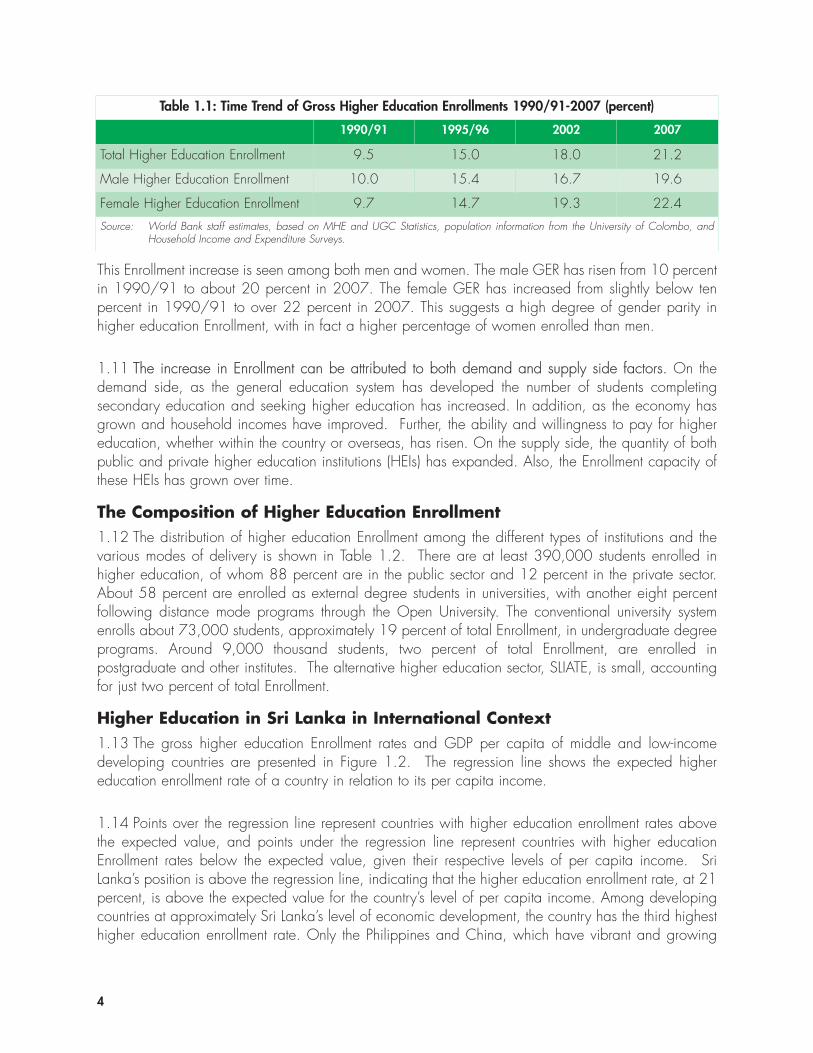
4
Table 1.1: Time Trend of Gross Higher Education Enrollments 1990/91-2007 (percent)
1990/91 1995/96 2002 2007
Total Higher Education Enrollment 9.5 15.0 18.0 21.2
Male Higher Education Enrollment 10.0 15.4 16.7 19.6
Female Higher Education Enrollment 9.7 14.7 19.3 22.4
Source: World Bank staff estimates, based on MHE and UGC Statistics, population information from the University of Colombo, andHousehold Income and Expenditure Surveys.
This Enrollment increase is seen among both men and women. The male GER has risen from 10 percentin 1990/91 to about 20 percent in 2007. The female GER has increased from slightly below tenpercent in 1990/91 to over 22 percent in 2007. This suggests a high degree of gender parity inhigher education Enrollment, with in fact a higher percentage of women enrolled than men.
1.11 The increase in Enrollment can be attributed to both demand and supply side factors. On thedemand side, as the general education system has developed the number of students completingsecondary education and seeking higher education has increased. In addition, as the economy hasgrown and household incomes have improved. Further, the ability and willingness to pay for highereducation, whether within the country or overseas, has risen. On the supply side, the quantity of bothpublic and private higher education institutions (HEIs) has expanded. Also, the Enrollment capacity ofthese HEIs has grown over time.
The Composition of Higher Education Enrollment1.12 The distribution of higher education Enrollment among the different types of institutions and thevarious modes of delivery is shown in Table 1.2. There are at least 390,000 students enrolled inhigher education, of whom 88 percent are in the public sector and 12 percent in the private sector.About 58 percent are enrolled as external degree students in universities, with another eight percentfollowing distance mode programs through the Open University. The conventional university systemenrolls about 73,000 students, approximately 19 percent of total Enrollment, in undergraduate degreeprograms. Around 9,000 thousand students, two percent of total Enrollment, are enrolled inpostgraduate and other institutes. The alternative higher education sector, SLIATE, is small, accountingfor just two percent of total Enrollment.
Higher Education in Sri Lanka in International Context1.13 The gross higher education Enrollment rates and GDP per capita of middle and low-incomedeveloping countries are presented in Figure 1.2. The regression line shows the expected highereducation enrollment rate of a country in relation to its per capita income.
1.14 Points over the regression line represent countries with higher education enrollment rates abovethe expected value, and points under the regression line represent countries with higher educationEnrollment rates below the expected value, given their respective levels of per capita income. SriLanka’s position is above the regression line, indicating that the higher education enrollment rate, at 21percent, is above the expected value for the country’s level of per capita income. Among developingcountries at approximately Sri Lanka’s level of economic development, the country has the third highesthigher education enrollment rate. Only the Philippines and China, which have vibrant and growing
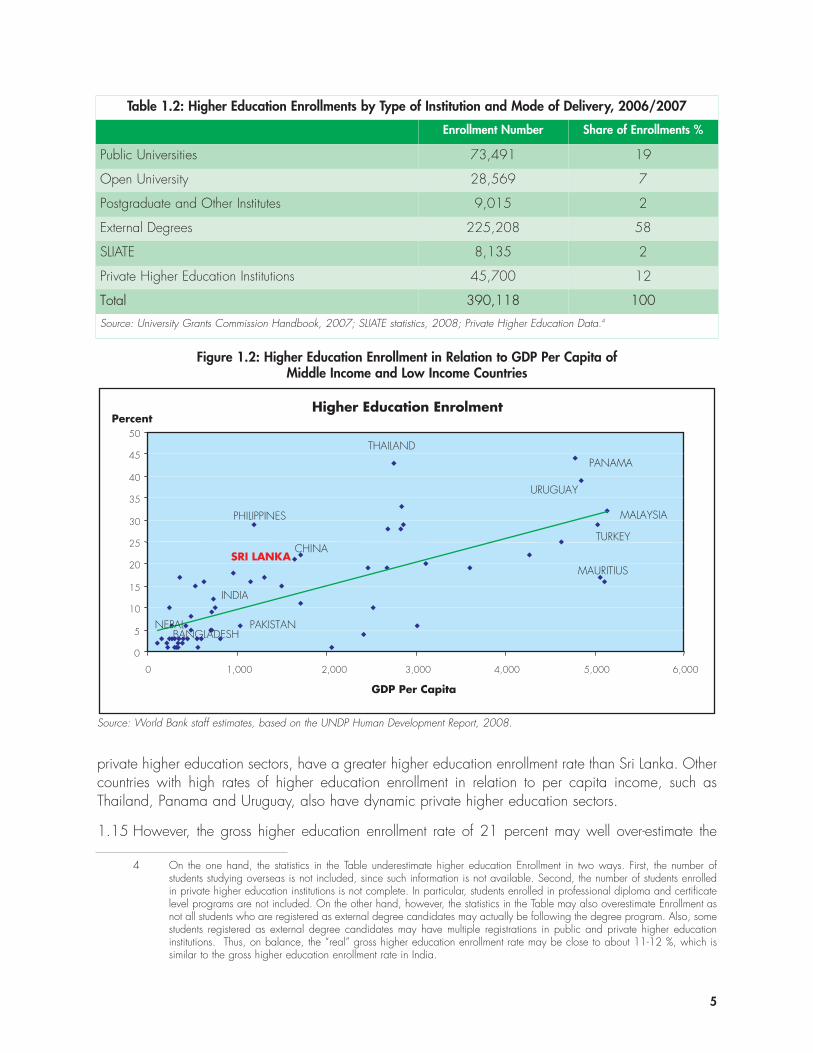
5
Table 1.2: Higher Education Enrollments by Type of Institution and Mode of Delivery, 2006/2007
Enrollment Number Share of Enrollments %
Public Universities 73,491 19
Open University 28,569 7
Postgraduate and Other Institutes 9,015 2
External Degrees 225,208 58
SLIATE 8,135 2
Private Higher Education Institutions 45,700 12
Total 390,118 100
Source: University Grants Commission Handbook, 2007; SLIATE statistics, 2008; Private Higher Education Data.4
4 On the one hand, the statistics in the Table underestimate higher education Enrollment in two ways. First, the number ofstudents studying overseas is not included, since such information is not available. Second, the number of students enrolledin private higher education institutions is not complete. In particular, students enrolled in professional diploma and certificatelevel programs are not included. On the other hand, however, the statistics in the Table may also overestimate Enrollment asnot all students who are registered as external degree candidates may actually be following the degree program. Also, somestudents registered as external degree candidates may have multiple registrations in public and private higher educationinstitutions. Thus, on balance, the “real” gross higher education enrollment rate may be close to about 11-12 %, which issimilar to the gross higher education enrollment rate in India.
Figure 1.2: Higher Education Enrollment in Relation to GDP Per Capita of Middle Income and Low Income Countries
0
5
10
15
20
25
30
35
40
45
50
0 1,000 2,000 3,000 4,000 5,000 6,000
GDP Per Capita
Higher Education Enrolment
PHILIPPINES
SRI LANKA
THAILAND
MALAYSIA
PANAMA
URUGUAY
CHINA TURKEY
MAURITIUS
NEPAL BANGLADESH
INDIA
PAKISTAN
Percent
Source: World Bank staff estimates, based on the UNDP Human Development Report, 2008.
private higher education sectors, have a greater higher education enrollment rate than Sri Lanka. Othercountries with high rates of higher education enrollment in relation to per capita income, such asThailand, Panama and Uruguay, also have dynamic private higher education sectors.
1.15 However, the gross higher education enrollment rate of 21 percent may well over-estimate the
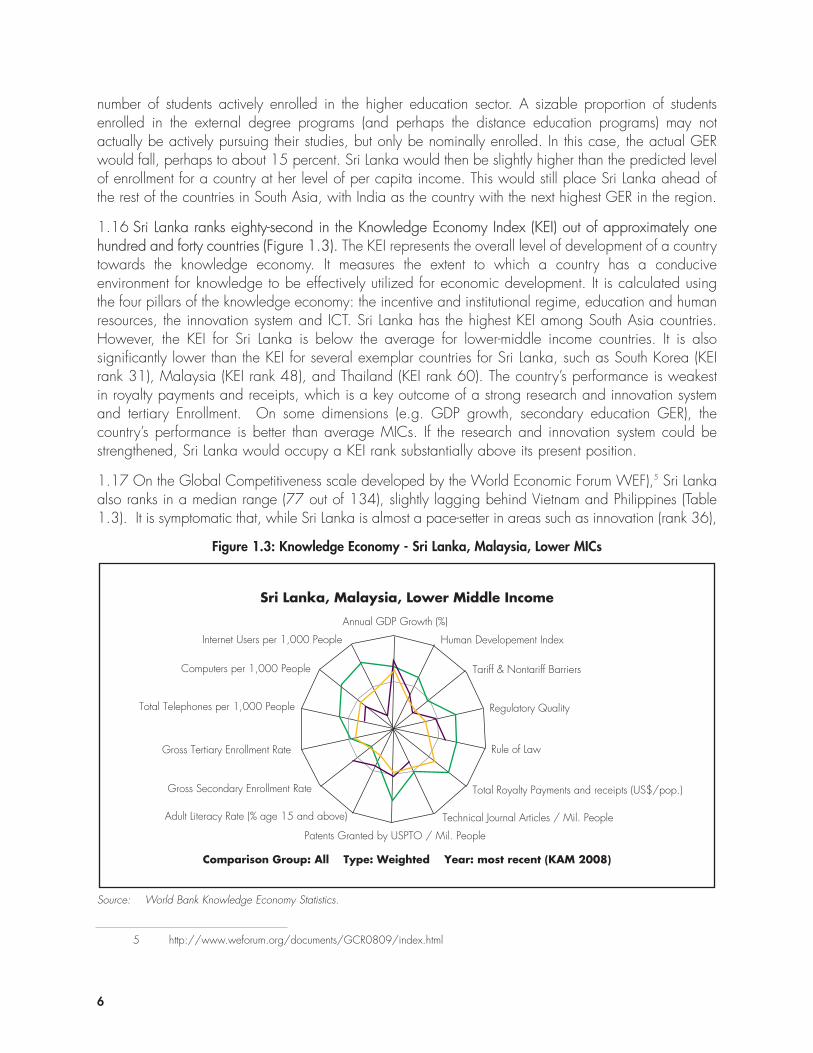
number of students actively enrolled in the higher education sector. A sizable proportion of studentsenrolled in the external degree programs (and perhaps the distance education programs) may notactually be actively pursuing their studies, but only be nominally enrolled. In this case, the actual GERwould fall, perhaps to about 15 percent. Sri Lanka would then be slightly higher than the predicted levelof enrollment for a country at her level of per capita income. This would still place Sri Lanka ahead ofthe rest of the countries in South Asia, with India as the country with the next highest GER in the region.
1.16 Sri Lanka ranks eighty-second in the Knowledge Economy Index (KEI) out of approximately onehundred and forty countries (Figure 1.3). The KEI represents the overall level of development of a countrytowards the knowledge economy. It measures the extent to which a country has a conduciveenvironment for knowledge to be effectively utilized for economic development. It is calculated usingthe four pillars of the knowledge economy: the incentive and institutional regime, education and humanresources, the innovation system and ICT. Sri Lanka has the highest KEI among South Asia countries.However, the KEI for Sri Lanka is below the average for lower-middle income countries. It is alsosignificantly lower than the KEI for several exemplar countries for Sri Lanka, such as South Korea (KEIrank 31), Malaysia (KEI rank 48), and Thailand (KEI rank 60). The country’s performance is weakestin royalty payments and receipts, which is a key outcome of a strong research and innovation systemand tertiary Enrollment. On some dimensions (e.g. GDP growth, secondary education GER), thecountry’s performance is better than average MICs. If the research and innovation system could bestrengthened, Sri Lanka would occupy a KEI rank substantially above its present position.
1.17 On the Global Competitiveness scale developed by the World Economic Forum WEF),5 Sri Lankaalso ranks in a median range (77 out of 134), slightly lagging behind Vietnam and Philippines (Table1.3). It is symptomatic that, while Sri Lanka is almost a pace-setter in areas such as innovation (rank 36),
6
5 http://www.weforum.org/documents/GCR0809/index.html
Figure 1.3: Knowledge Economy - Sri Lanka, Malaysia, Lower MICs
Sri Lanka, Malaysia, Lower Middle Income
Comparison Group: All Type: Weighted Year: most recent (KAM 2008)
Annual GDP Growth (%)
Internet Users per 1,000 People
Computers per 1,000 People
Total Telephones per 1,000 People
Gross Tertiary Enrollment Rate
Gross Secondary Enrollment Rate
Adult Literacy Rate (% age 15 and above)
Patents Granted by USPTO / Mil. People
Technical Journal Articles / Mil. People
Total Royalty Payments and receipts (US$/pop.)
Rule of Law
Regulatory Quality
Tariff & Nontariff Barriers
Human Developement Index
Source: World Bank Knowledge Economy Statistics.
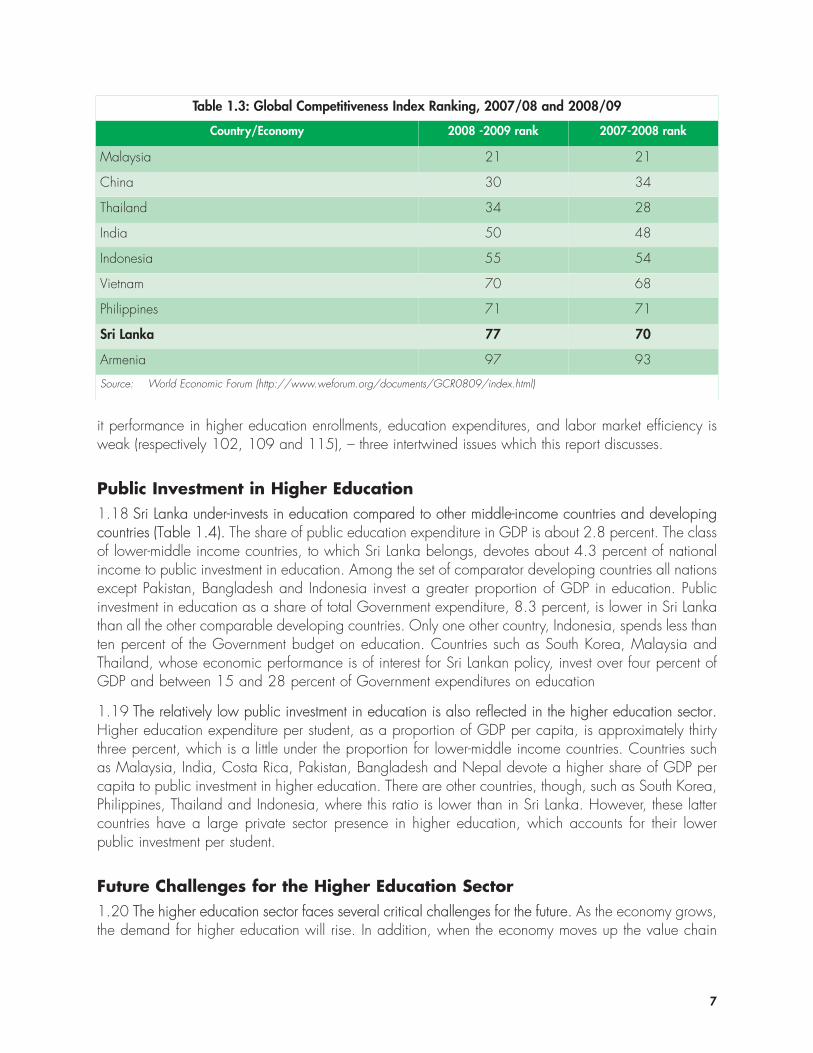
7
it performance in higher education enrollments, education expenditures, and labor market efficiency isweak (respectively 102, 109 and 115), – three intertwined issues which this report discusses.
Public Investment in Higher Education 1.18 Sri Lanka under-invests in education compared to other middle-income countries and developingcountries (Table 1.4). The share of public education expenditure in GDP is about 2.8 percent. The classof lower-middle income countries, to which Sri Lanka belongs, devotes about 4.3 percent of nationalincome to public investment in education. Among the set of comparator developing countries all nationsexcept Pakistan, Bangladesh and Indonesia invest a greater proportion of GDP in education. Publicinvestment in education as a share of total Government expenditure, 8.3 percent, is lower in Sri Lankathan all the other comparable developing countries. Only one other country, Indonesia, spends less thanten percent of the Government budget on education. Countries such as South Korea, Malaysia andThailand, whose economic performance is of interest for Sri Lankan policy, invest over four percent ofGDP and between 15 and 28 percent of Government expenditures on education
1.19 The relatively low public investment in education is also reflected in the higher education sector.Higher education expenditure per student, as a proportion of GDP per capita, is approximately thirtythree percent, which is a little under the proportion for lower-middle income countries. Countries suchas Malaysia, India, Costa Rica, Pakistan, Bangladesh and Nepal devote a higher share of GDP percapita to public investment in higher education. There are other countries, though, such as South Korea,Philippines, Thailand and Indonesia, where this ratio is lower than in Sri Lanka. However, these lattercountries have a large private sector presence in higher education, which accounts for their lowerpublic investment per student.
Future Challenges for the Higher Education Sector 1.20 The higher education sector faces several critical challenges for the future. As the economy grows,the demand for higher education will rise. In addition, when the economy moves up the value chain
Table 1.3: Global Competitiveness Index Ranking, 2007/08 and 2008/09
Country/Economy 2008 -2009 rank 2007-2008 rank
Malaysia 21 21
China 30 34
Thailand 34 28
India 50 48
Indonesia 55 54
Vietnam 70 68
Philippines 71 71
Sri Lanka 77 70
Armenia 97 93
Source: World Economic Forum (http://www.weforum.org/documents/GCR0809/index.html)
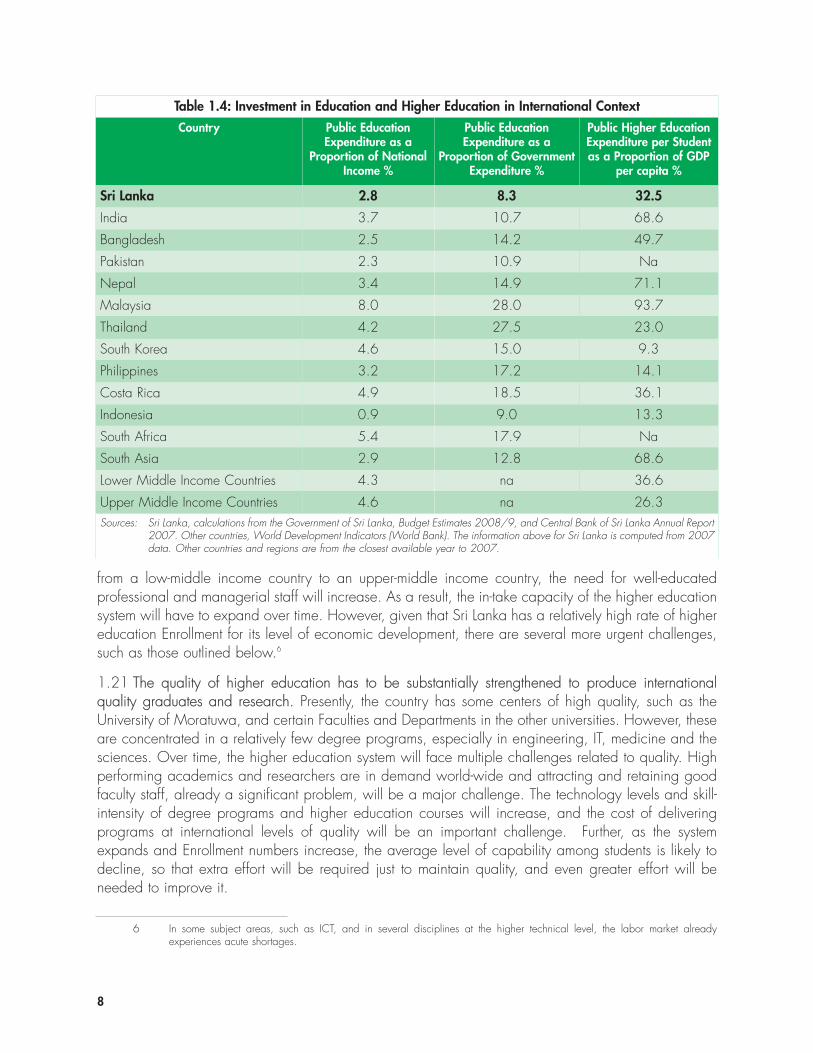
from a low-middle income country to an upper-middle income country, the need for well-educatedprofessional and managerial staff will increase. As a result, the in-take capacity of the higher educationsystem will have to expand over time. However, given that Sri Lanka has a relatively high rate of highereducation Enrollment for its level of economic development, there are several more urgent challenges,such as those outlined below.6
1.21 The quality of higher education has to be substantially strengthened to produce internationalquality graduates and research. Presently, the country has some centers of high quality, such as theUniversity of Moratuwa, and certain Faculties and Departments in the other universities. However, theseare concentrated in a relatively few degree programs, especially in engineering, IT, medicine and thesciences. Over time, the higher education system will face multiple challenges related to quality. Highperforming academics and researchers are in demand world-wide and attracting and retaining goodfaculty staff, already a significant problem, will be a major challenge. The technology levels and skill-intensity of degree programs and higher education courses will increase, and the cost of deliveringprograms at international levels of quality will be an important challenge. Further, as the systemexpands and Enrollment numbers increase, the average level of capability among students is likely todecline, so that extra effort will be required just to maintain quality, and even greater effort will beneeded to improve it.
8
Table 1.4: Investment in Education and Higher Education in International ContextCountry Public Education
Expenditure as aProportion of National
Income %
Public EducationExpenditure as a
Proportion of GovernmentExpenditure %
Public Higher EducationExpenditure per Studentas a Proportion of GDP
per capita %
Sri Lanka 2.8 8.3 32.5
India 3.7 10.7 68.6
Bangladesh 2.5 14.2 49.7
Pakistan 2.3 10.9 Na
Nepal 3.4 14.9 71.1
Malaysia 8.0 28.0 93.7
Thailand 4.2 27.5 23.0
South Korea 4.6 15.0 9.3
Philippines 3.2 17.2 14.1
Costa Rica 4.9 18.5 36.1
Indonesia 0.9 9.0 13.3
South Africa 5.4 17.9 Na
South Asia 2.9 12.8 68.6
Lower Middle Income Countries 4.3 na 36.6
Upper Middle Income Countries 4.6 na 26.3Sources: Sri Lanka, calculations from the Government of Sri Lanka, Budget Estimates 2008/9, and Central Bank of Sri Lanka Annual Report
2007. Other countries, World Development Indicators (World Bank). The information above for Sri Lanka is computed from 2007data. Other countries and regions are from the closest available year to 2007.
6 In some subject areas, such as ICT, and in several disciplines at the higher technical level, the labor market alreadyexperiences acute shortages.
1.22 The governance of the higher education sector will need to evolve in line with world-wide trendsand developments. In this context, the country needs well-functioning quality assurance systems for theoverall higher education sector, including university undergraduate degrees and postgraduate degrees,distance education programs, alternative higher education courses, and private sector degreeprograms. Competent and credible quality assurance systems will benefit policy makers, highereducation providers, students and parents. The country also needs a national qualification framework,covering both the higher education sector and the training sector. A qualification framework wouldpresent clear learning pathways, providing access to - and mobility and progression within - education,training and career paths. This, in turn, would provide scope for horizontal and vertical linkagesbetween higher education, training and the labor market. The monitoring and evaluation of highereducation, which is a complex and rapidly evolving sector, also needs strengthening. Monitoring isneeded, at both the national and institutional levels, to obtain information on the performance of policiesand programs, and to receive feedback for future policy and program development.
1.23 The economic and social relevance of the higher education sector needs to be transformed toenable Sri Lanka to meet the challenges of a dynamic global economy and world order. The highereducation institutions provide the professional, managerial, administrative and higher technical skillsrequired for the private and public sectors. In this context, there are important challenges for the future.A considerable proportion of university graduates, especially among graduates of distance modeprograms, and in the arts and management degrees, fail to obtain jobs in the private sector in line withtheir expectations as graduates. Inadequate English language and IT skills, and poor adaptability tothe working environment and culture of the private sector, appear to be major constraints. Thecomposition of university degree programs between employment-oriented programs and other programsneeds to be shifted more in favor of the former. Further, the alternative higher education sector, whichmainly targets the higher-level technical skills needed for the labor market, is small in comparison withthe traditional university sector. Over time, there will need to be greater balance between the universitysector and the alternative higher education sector.
1.24 The research and innovation capacity of the higher education system should be dramaticallystrengthened to support, and eventually lead, the development of Sri Lanka as a MIC. The long-termeconomic progress of Sri Lanka, especially to become a member of the community of high-middleincome and advanced economies, will require substantial research and innovation capacity in thecountry. The higher education sector will need to produce human resources for knowledge-intensiveindustries and services. The capacity for rapid technology adoption and adaptation, as well asinnovation, will play a crucial role in development. In addition, close linkages need to be promotedbetween universities and industries. This will be mutually beneficial, as it will enable industries to drawon the intellectual resources available in the university community, while providing universities an extrasource of research funding and income.
1.25 The development of a dynamic and vibrant higher education sector will require adequate funding.Expansion of enrollment, improvement of quality and labor market relevance, and the promotion ofresearch and innovation, will generate pressure on the resources available to the higher educationsector. As resources are always constrained, the Government will need to make choices betweenvarious policy options, based on their estimated costs and anticipated benefits. Further, to expand theresource envelope available to the sector, the framework for private-public partnerships in the financingand delivery of higher education, and for private sector investment in various modes of highereducation, may need to be strengthened.
9
Government’s Response to Address the Challenges1.26 The high-level policy makers in the higher education sector are fully aware of the importance ofintroducing strategic reforms and policy initiatives to enable the sector to meet the future economic andsocial needs of the country. The MHE states on its website that: “Education and knowledge havebecome the key for development in the 21st century and the prosperity of the next generation dependsto a great extent on education. Higher education can be considered as the key to economic prosperityin a country as human capital has been recognized as the key element in the process of development.Higher education institutions, therefore, need to be transformed in such a way so as to ensure that theybecome great partners in development”.7 Further, the UGC, which has the policy mandate for theoverall public funding of universities, states that: “Over the years many have contributed to theexpansion of higher education in our country… However, our system of higher education is now facinga host of challenges, the salient issues being the quality, relevance and equity of higher education and… the ever growing demand for higher education”.8
1.27 The National Education Commission (NEC), which advises the President on education policy, hasprepared a draft policy framework on higher education, in consultation with MHE, UGC, Sri LankaInstitute for Advanced Technological Education (SLIATE), universities and other higher educationproviders, academics, researchers and development partners. This draft, which is extensive and wide-ranging, contains important policy recommendations on such topics as: (i) the expansion of highereducation; (ii) academic programs; (iii) quality assurance, assessment and accreditation; (iv)development of linkages within different types of higher education institution; (v) development oflinkages between higher education and industry; (iv) research, innovation and creativity; (vi) highereducation and national development; (vii) postgraduate education; (viii) administration andmanagement; and (ix) financing. Once the policy framework has been finalized and adopted, MHE,UGC and SLIATE will implement the reforms through a strategic development program.
The Contribution of the World Bank Higher Education Report1.28 This report, which has been prepared in consultation with senior higher education policy makers,academics, researchers, employers, higher education providers, and students, serves several purposes.First, the report contains rigorous technical analyses and provides an understanding of the highereducation sector based on factual evidence. Second, the report presents and discuses the rich varietyof higher education systems, policies and reforms observed in the modern world. The discussion has aspecial focus on those areas where Sri Lanka faces its most important higher education policychallenges. Third, based on international and global experience, the report presents several policy andprogram options for the consideration of the policy makers, stakeholders and beneficiaries of the highereducation sector. Finally, the information and analysis in the report can contribute to the preparationand implementation of a long-term higher education development strategy in Sri Lanka.
10
7 http://www.mohe.gov.lk/minMsg.php
8 UGC Corporate Plan, 2008-2010
11
Chapter TwoACCESS TO, AND COVERAGE OF,
HIGHER EDUCATION
Introduction2.1 Enrollment in higher education has been increasing rapidly around the world in recent decades.This increase has been produced by a combination of causes, including the expansion of primary andsecondary education which has flowed over into higher education, greater economic benefits whichhave generated strong demand for higher education from individuals, and a rapid rise in the numberof institutions providing higher education services. Sri Lanka has experimented a similar expansion, withaggregate enrollment in higher education rising sharply in recent years. This chapter examines the sizeand composition of higher education access and coverage, and discusses possible policy options forthe future to address the key access related challenges faced by the country.
A. SITUATION, ACHIEVEMENTS AND ISSUESThe Current Situation and Recent Trends
A Global View2.2 There are two ways to look at enrollment in the higher education sector: the first one is acomparison with the relevant age group, the second a comparison with the pool of secondaryeducation graduates. In both cases, international comparisons allow a useful perspective.
2.3 The overall gross enrollment rate (GER) in higher education of about 21 percent of the relevantage group puts Sri Lanka ahead of the South Asia Region, on par with countries such as China, Brazil,El Salvador and Jamaica, all of which are wealthier countries. Sri Lanka’s higher education GER issimilar to countries such as Thailand, South Africa, Hungary, and the Czech Republic in the mid-1990s[Table 2.1]. It is also similar to the GER of OECD countries in the 1980s. However, as mentionedabove (para. 1.16), this rate may be overestimated because it includes EDP students. Not includingthe latter would lead to a GER less than 5%, which in turn would be an underestimate. As a largeproportion of the EDP students is not attending classes on a full time basis, it is fair to consider that the“real” GER is probably hovering in the 10 to 12 percent range. This would correspond to the ratewhich can be expected from Sri Lanka, which is now a lower middle-income country.
2.4 In Sri Lanka higher education enrollments began increasing in the 1980’s, but their mostsubstantial expansion dates from the early 2000’s. Since then enrollment has been steadily increasing.
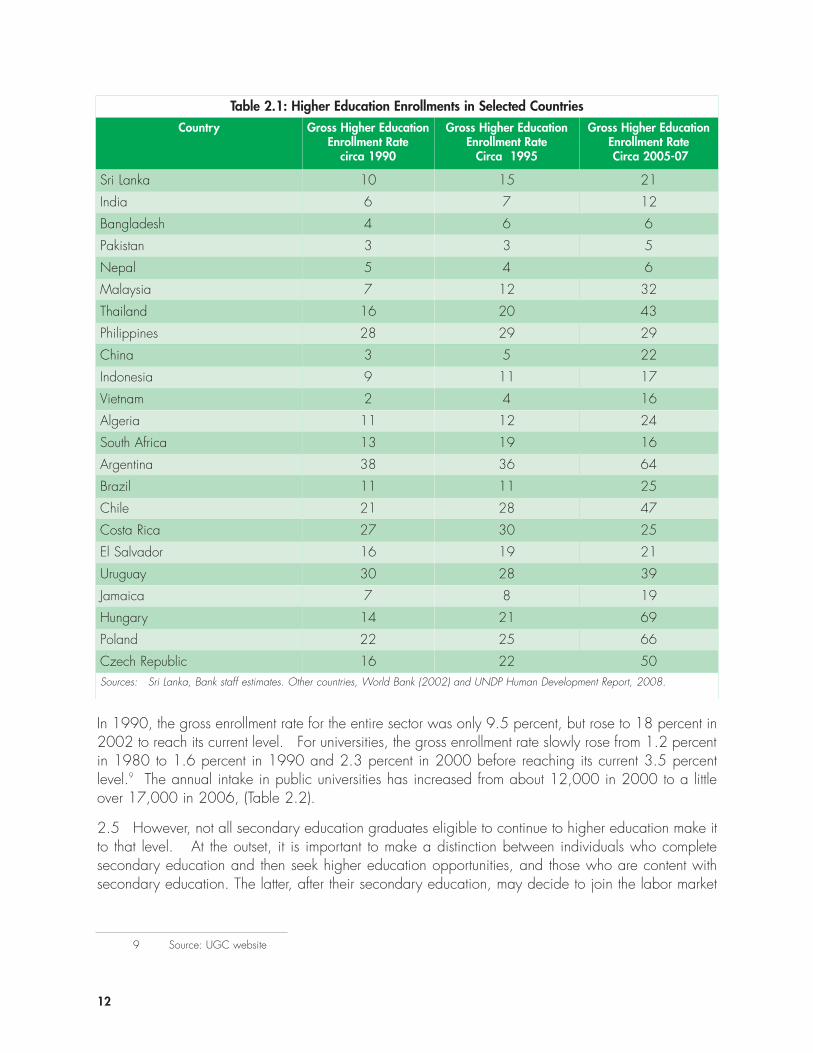
12
Table 2.1: Higher Education Enrollments in Selected CountriesCountry Gross Higher Education
Enrollment Ratecirca 1990
Gross Higher EducationEnrollment Rate
Circa 1995
Gross Higher EducationEnrollment RateCirca 2005-07
Sri Lanka 10 15 21
India 6 7 12
Bangladesh 4 6 6
Pakistan 3 3 5
Nepal 5 4 6
Malaysia 7 12 32
Thailand 16 20 43
Philippines 28 29 29
China 3 5 22
Indonesia 9 11 17
Vietnam 2 4 16
Algeria 11 12 24
South Africa 13 19 16
Argentina 38 36 64
Brazil 11 11 25
Chile 21 28 47
Costa Rica 27 30 25
El Salvador 16 19 21
Uruguay 30 28 39
Jamaica 7 8 19
Hungary 14 21 69
Poland 22 25 66
Czech Republic 16 22 50Sources: Sri Lanka, Bank staff estimates. Other countries, World Bank (2002) and UNDP Human Development Report, 2008.
9 Source: UGC website
In 1990, the gross enrollment rate for the entire sector was only 9.5 percent, but rose to 18 percent in2002 to reach its current level. For universities, the gross enrollment rate slowly rose from 1.2 percentin 1980 to 1.6 percent in 1990 and 2.3 percent in 2000 before reaching its current 3.5 percentlevel.9 The annual intake in public universities has increased from about 12,000 in 2000 to a littleover 17,000 in 2006, (Table 2.2).
2.5 However, not all secondary education graduates eligible to continue to higher education make itto that level. At the outset, it is important to make a distinction between individuals who completesecondary education and then seek higher education opportunities, and those who are content withsecondary education. The latter, after their secondary education, may decide to join the labor market
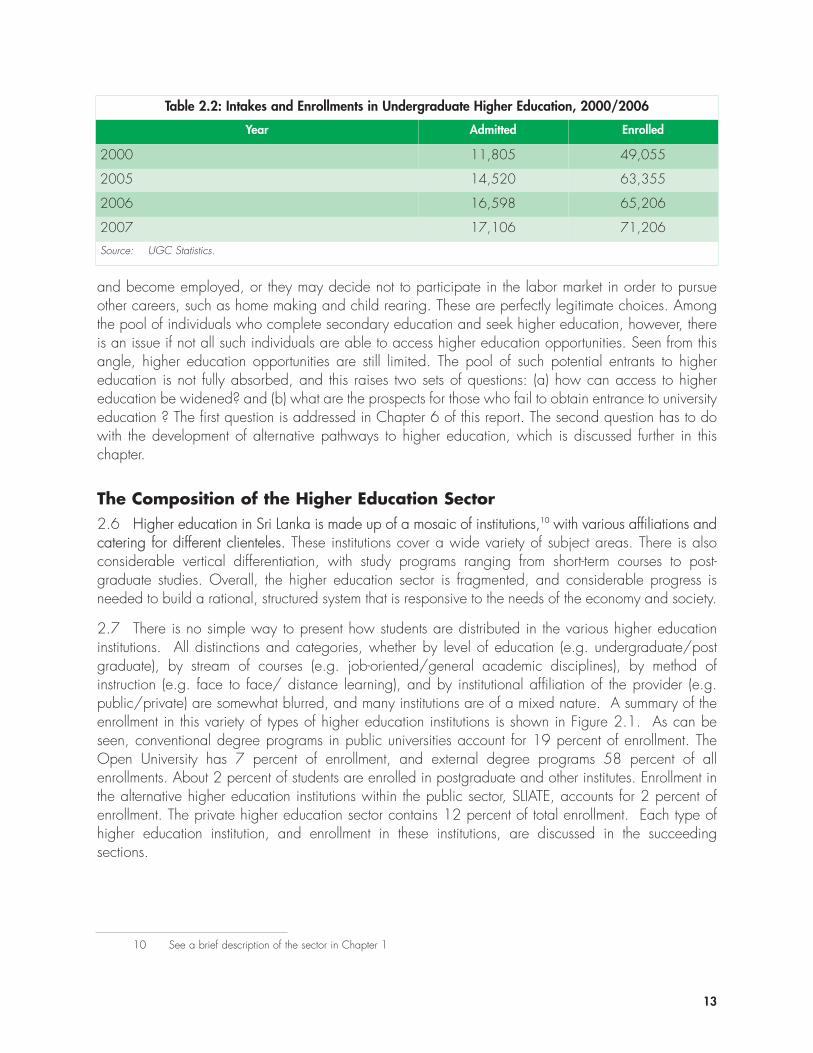
13
and become employed, or they may decide not to participate in the labor market in order to pursueother careers, such as home making and child rearing. These are perfectly legitimate choices. Amongthe pool of individuals who complete secondary education and seek higher education, however, thereis an issue if not all such individuals are able to access higher education opportunities. Seen from thisangle, higher education opportunities are still limited. The pool of such potential entrants to highereducation is not fully absorbed, and this raises two sets of questions: (a) how can access to highereducation be widened? and (b) what are the prospects for those who fail to obtain entrance to universityeducation ? The first question is addressed in Chapter 6 of this report. The second question has to dowith the development of alternative pathways to higher education, which is discussed further in thischapter.
The Composition of the Higher Education Sector2.6 Higher education in Sri Lanka is made up of a mosaic of institutions,10 with various affiliations andcatering for different clienteles. These institutions cover a wide variety of subject areas. There is alsoconsiderable vertical differentiation, with study programs ranging from short-term courses to post-graduate studies. Overall, the higher education sector is fragmented, and considerable progress isneeded to build a rational, structured system that is responsive to the needs of the economy and society.
2.7 There is no simple way to present how students are distributed in the various higher educationinstitutions. All distinctions and categories, whether by level of education (e.g. undergraduate/postgraduate), by stream of courses (e.g. job-oriented/general academic disciplines), by method ofinstruction (e.g. face to face/ distance learning), and by institutional affiliation of the provider (e.g.public/private) are somewhat blurred, and many institutions are of a mixed nature. A summary of theenrollment in this variety of types of higher education institutions is shown in Figure 2.1. As can beseen, conventional degree programs in public universities account for 19 percent of enrollment. TheOpen University has 7 percent of enrollment, and external degree programs 58 percent of allenrollments. About 2 percent of students are enrolled in postgraduate and other institutes. Enrollment inthe alternative higher education institutions within the public sector, SLIATE, accounts for 2 percent ofenrollment. The private higher education sector contains 12 percent of total enrollment. Each type ofhigher education institution, and enrollment in these institutions, are discussed in the succeedingsections.
Table 2.2: Intakes and Enrollments in Undergraduate Higher Education, 2000/2006
Year Admitted Enrolled
2000 11,805 49,055
2005 14,520 63,355
2006 16,598 65,206
2007 17,106 71,206
Source: UGC Statistics.
10 See a brief description of the sector in Chapter 1
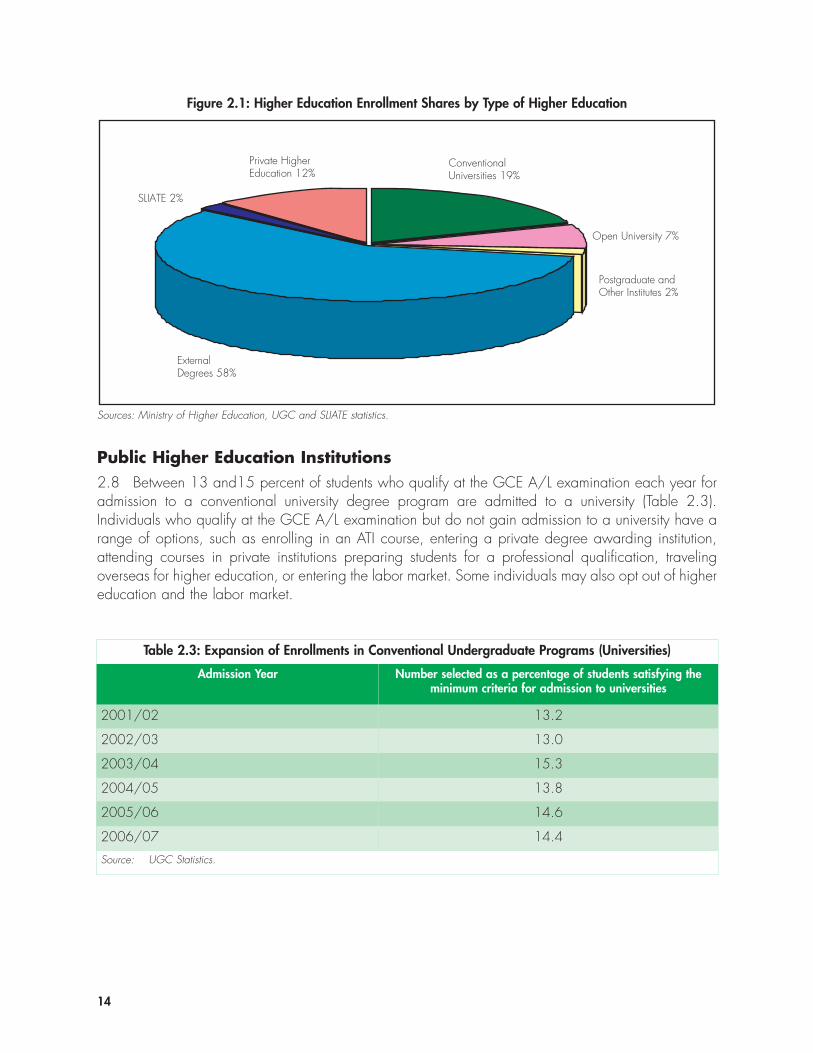
14
Public Higher Education Institutions2.8 Between 13 and15 percent of students who qualify at the GCE A/L examination each year foradmission to a conventional university degree program are admitted to a university (Table 2.3).Individuals who qualify at the GCE A/L examination but do not gain admission to a university have arange of options, such as enrolling in an ATI course, entering a private degree awarding institution,attending courses in private institutions preparing students for a professional qualification, travelingoverseas for higher education, or entering the labor market. Some individuals may also opt out of highereducation and the labor market.
Table 2.3: Expansion of Enrollments in Conventional Undergraduate Programs (Universities)
Admission Year Number selected as a percentage of students satisfying theminimum criteria for admission to universities
2001/02 13.2
2002/03 13.0
2003/04 15.3
2004/05 13.8
2005/06 14.6
2006/07 14.4
Source: UGC Statistics.
Figure 2.1: Higher Education Enrollment Shares by Type of Higher Education
Conventional Universities 19%
SLIATE 2%
External Degrees 58%
Open University 7%
Private Higher Education 12%
Postgraduate and Other Institutes 2%
Sources: Ministry of Higher Education, UGC and SLIATE statistics.
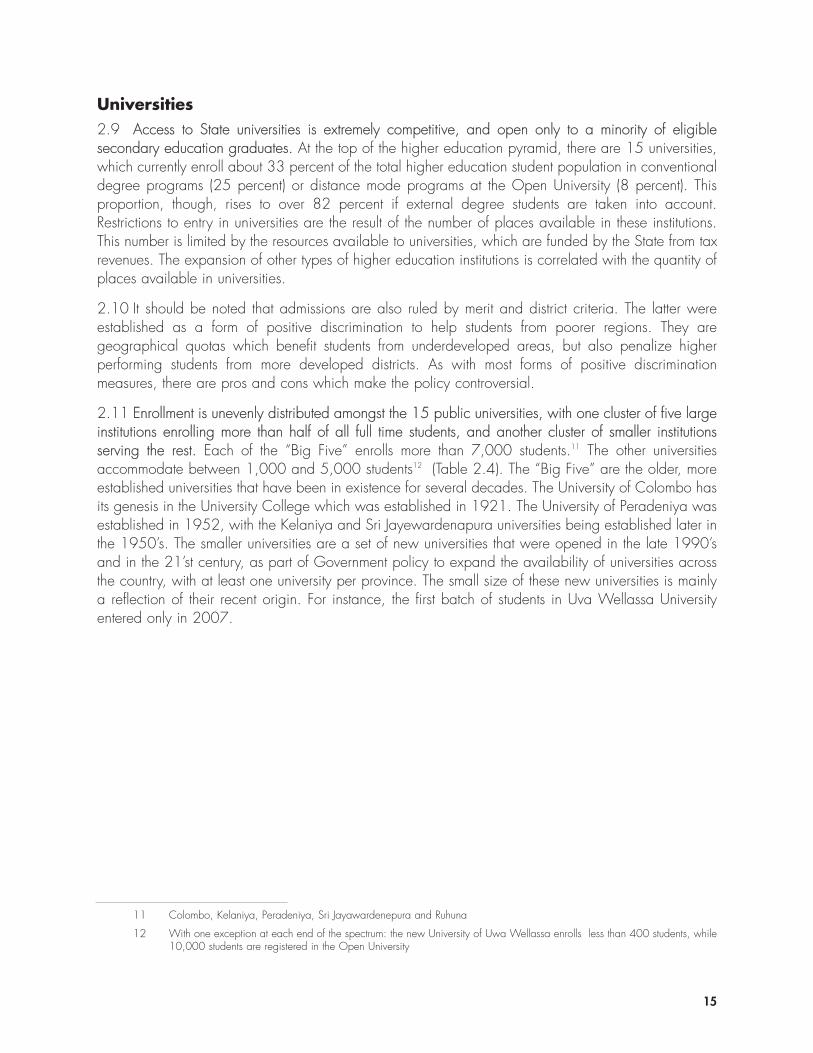
15
Universities2.9 Access to State universities is extremely competitive, and open only to a minority of eligiblesecondary education graduates. At the top of the higher education pyramid, there are 15 universities,which currently enroll about 33 percent of the total higher education student population in conventionaldegree programs (25 percent) or distance mode programs at the Open University (8 percent). Thisproportion, though, rises to over 82 percent if external degree students are taken into account.Restrictions to entry in universities are the result of the number of places available in these institutions.This number is limited by the resources available to universities, which are funded by the State from taxrevenues. The expansion of other types of higher education institutions is correlated with the quantity ofplaces available in universities.
2.10 It should be noted that admissions are also ruled by merit and district criteria. The latter wereestablished as a form of positive discrimination to help students from poorer regions. They aregeographical quotas which benefit students from underdeveloped areas, but also penalize higherperforming students from more developed districts. As with most forms of positive discriminationmeasures, there are pros and cons which make the policy controversial.
2.11 Enrollment is unevenly distributed amongst the 15 public universities, with one cluster of five largeinstitutions enrolling more than half of all full time students, and another cluster of smaller institutionsserving the rest. Each of the “Big Five” enrolls more than 7,000 students.11 The other universitiesaccommodate between 1,000 and 5,000 students12 (Table 2.4). The “Big Five” are the older, moreestablished universities that have been in existence for several decades. The University of Colombo hasits genesis in the University College which was established in 1921. The University of Peradeniya wasestablished in 1952, with the Kelaniya and Sri Jayewardenapura universities being established later inthe 1950’s. The smaller universities are a set of new universities that were opened in the late 1990’sand in the 21’st century, as part of Government policy to expand the availability of universities acrossthe country, with at least one university per province. The small size of these new universities is mainlya reflection of their recent origin. For instance, the first batch of students in Uva Wellassa Universityentered only in 2007.
11 Colombo, Kelaniya, Peradeniya, Sri Jayawardenepura and Ruhuna
12 With one exception at each end of the spectrum: the new University of Uwa Wellassa enrolls less than 400 students, while10,000 students are registered in the Open University
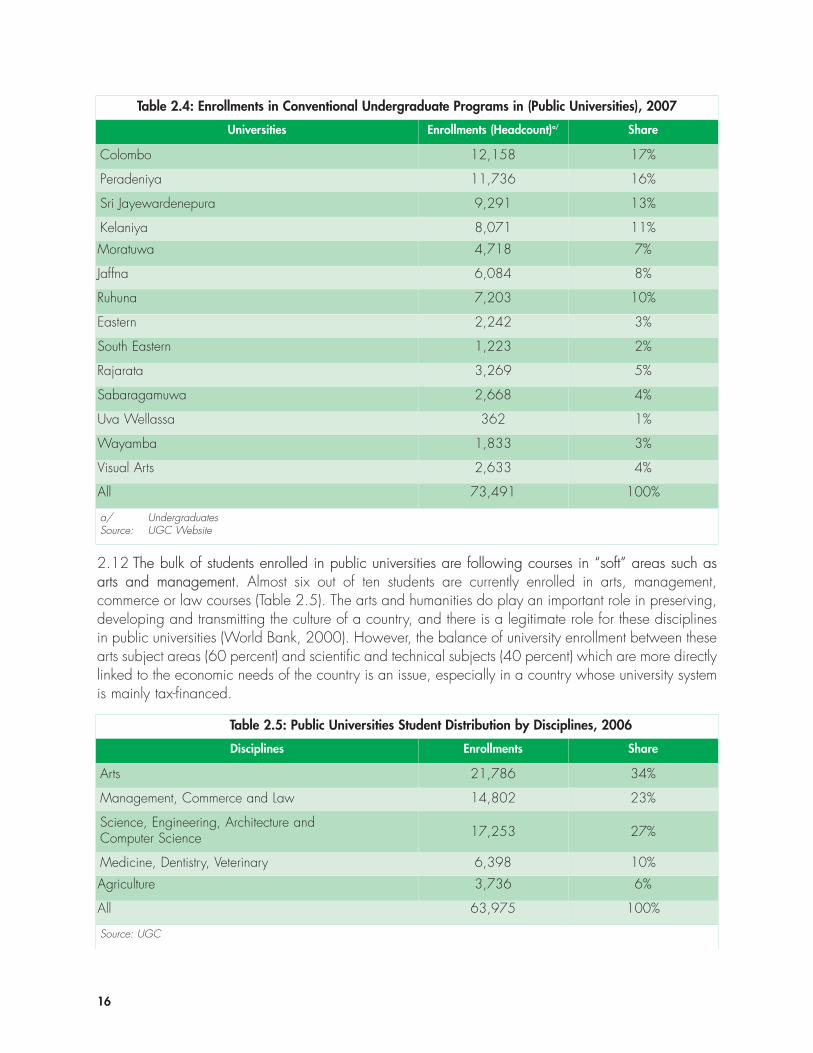
16
2.12 The bulk of students enrolled in public universities are following courses in “soft” areas such asarts and management. Almost six out of ten students are currently enrolled in arts, management,commerce or law courses (Table 2.5). The arts and humanities do play an important role in preserving,developing and transmitting the culture of a country, and there is a legitimate role for these disciplinesin public universities (World Bank, 2000). However, the balance of university enrollment between thesearts subject areas (60 percent) and scientific and technical subjects (40 percent) which are more directlylinked to the economic needs of the country is an issue, especially in a country whose university systemis mainly tax-financed.
Table 2.4: Enrollments in Conventional Undergraduate Programs in (Public Universities), 2007
Universities Enrollments (Headcount)a/ Share
Colombo 12,158 17%
Peradeniya 11,736 16%
Sri Jayewardenepura 9,291 13%
Kelaniya 8,071 11%
Moratuwa 4,718 7%
Jaffna 6,084 8%
Ruhuna 7,203 10%
Eastern 2,242 3%
South Eastern 1,223 2%
Rajarata 3,269 5%
Sabaragamuwa 2,668 4%
Uva Wellassa 362 1%
Wayamba 1,833 3%
Visual Arts 2,633 4%
All 73,491 100%
a/ UndergraduatesSource: UGC Website
Table 2.5: Public Universities Student Distribution by Disciplines, 2006
Disciplines Enrollments Share
Arts 21,786 34%
Management, Commerce and Law 14,802 23%
Science, Engineering, Architecture andComputer Science 17,253 27%
Medicine, Dentistry, Veterinary 6,398 10%
Agriculture 3,736 6%
All 63,975 100%
Source: UGC
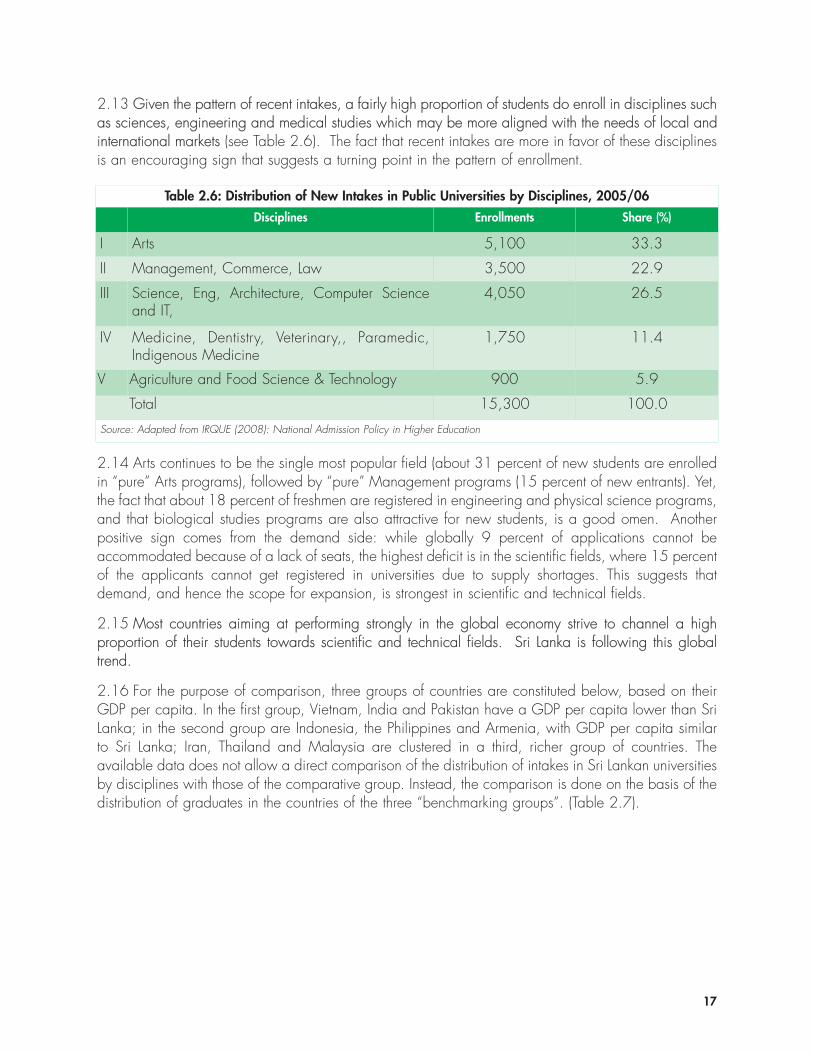
17
2.13 Given the pattern of recent intakes, a fairly high proportion of students do enroll in disciplines suchas sciences, engineering and medical studies which may be more aligned with the needs of local andinternational markets (see Table 2.6). The fact that recent intakes are more in favor of these disciplinesis an encouraging sign that suggests a turning point in the pattern of enrollment.
Table 2.6: Distribution of New Intakes in Public Universities by Disciplines, 2005/06Disciplines Enrollments Share (%)
I Arts 5,100 33.3
II Management, Commerce, Law 3,500 22.9
III Science, Eng, Architecture, Computer Scienceand IT,
4,050 26.5
IV Medicine, Dentistry, Veterinary,, Paramedic,Indigenous Medicine
1,750 11.4
V Agriculture and Food Science & Technology 900 5.9
Total 15,300 100.0
Source: Adapted from IRQUE (2008): National Admission Policy in Higher Education
2.14 Arts continues to be the single most popular field (about 31 percent of new students are enrolledin “pure” Arts programs), followed by “pure” Management programs (15 percent of new entrants). Yet,the fact that about 18 percent of freshmen are registered in engineering and physical science programs,and that biological studies programs are also attractive for new students, is a good omen. Anotherpositive sign comes from the demand side: while globally 9 percent of applications cannot beaccommodated because of a lack of seats, the highest deficit is in the scientific fields, where 15 percentof the applicants cannot get registered in universities due to supply shortages. This suggests thatdemand, and hence the scope for expansion, is strongest in scientific and technical fields.
2.15 Most countries aiming at performing strongly in the global economy strive to channel a highproportion of their students towards scientific and technical fields. Sri Lanka is following this globaltrend.
2.16 For the purpose of comparison, three groups of countries are constituted below, based on theirGDP per capita. In the first group, Vietnam, India and Pakistan have a GDP per capita lower than SriLanka; in the second group are Indonesia, the Philippines and Armenia, with GDP per capita similarto Sri Lanka; Iran, Thailand and Malaysia are clustered in a third, richer group of countries. Theavailable data does not allow a direct comparison of the distribution of intakes in Sri Lankan universitiesby disciplines with those of the comparative group. Instead, the comparison is done on the basis of thedistribution of graduates in the countries of the three “benchmarking groups”. (Table 2.7).
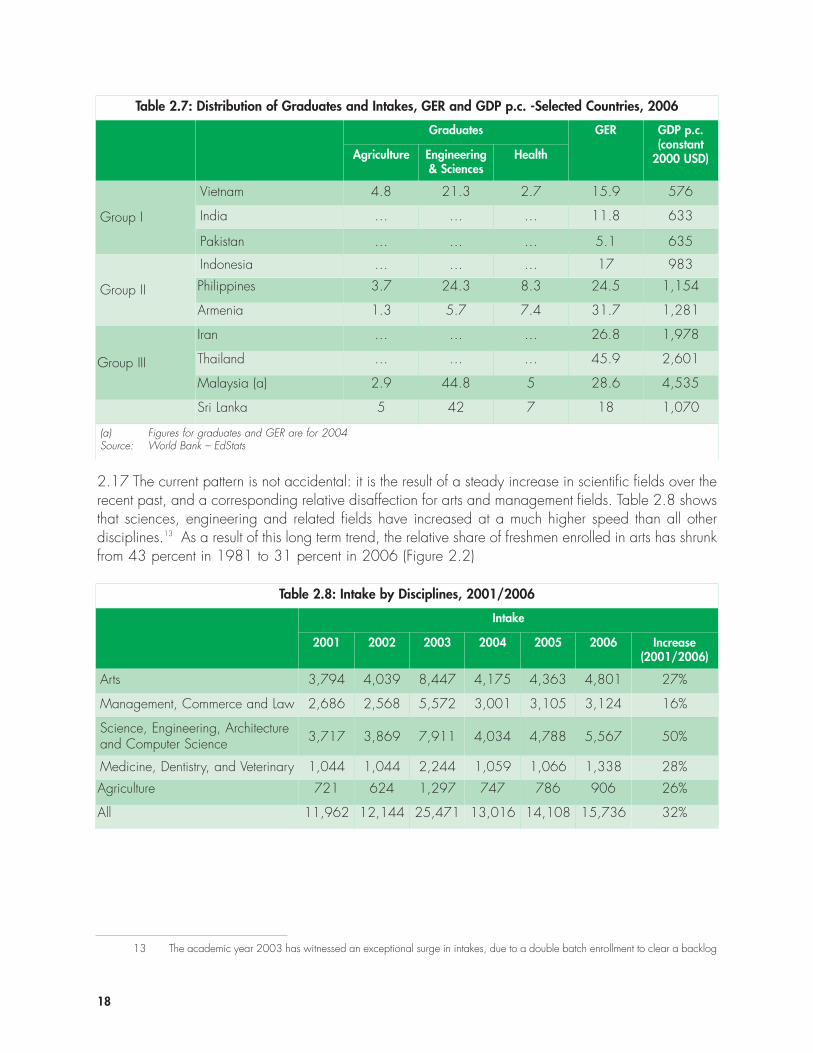
18
2.17 The current pattern is not accidental: it is the result of a steady increase in scientific fields over therecent past, and a corresponding relative disaffection for arts and management fields. Table 2.8 showsthat sciences, engineering and related fields have increased at a much higher speed than all otherdisciplines.13 As a result of this long term trend, the relative share of freshmen enrolled in arts has shrunkfrom 43 percent in 1981 to 31 percent in 2006 (Figure 2.2)
Table 2.7: Distribution of Graduates and Intakes, GER and GDP p.c. -Selected Countries, 2006
Graduates GER GDP p.c.(constant
2000 USD)Agriculture Engineering& Sciences
Health
Group I
Vietnam 4.8 21.3 2.7 15.9 576
India … … … 11.8 633
Pakistan … … … 5.1 635
Group II
Indonesia … … … 17 983
Philippines 3.7 24.3 8.3 24.5 1,154
Armenia 1.3 5.7 7.4 31.7 1,281
Group III
Iran … … … 26.8 1,978
Thailand … … … 45.9 2,601
Malaysia (a) 2.9 44.8 5 28.6 4,535
Sri Lanka 5 42 7 18 1,070
(a) Figures for graduates and GER are for 2004Source: World Bank – EdStats
Table 2.8: Intake by Disciplines, 2001/2006
Intake
2001 2002 2003 2004 2005 2006 Increase(2001/2006)
Arts 3,794 4,039 8,447 4,175 4,363 4,801 27%
Management, Commerce and Law 2,686 2,568 5,572 3,001 3,105 3,124 16%
Science, Engineering, Architectureand Computer Science 3,717 3,869 7,911 4,034 4,788 5,567 50%
Medicine, Dentistry, and Veterinary 1,044 1,044 2,244 1,059 1,066 1,338 28%
Agriculture 721 624 1,297 747 786 906 26%
All 11,962 12,144 25,471 13,016 14,108 15,736 32%
13 The academic year 2003 has witnessed an exceptional surge in intakes, due to a double batch enrollment to clear a backlog
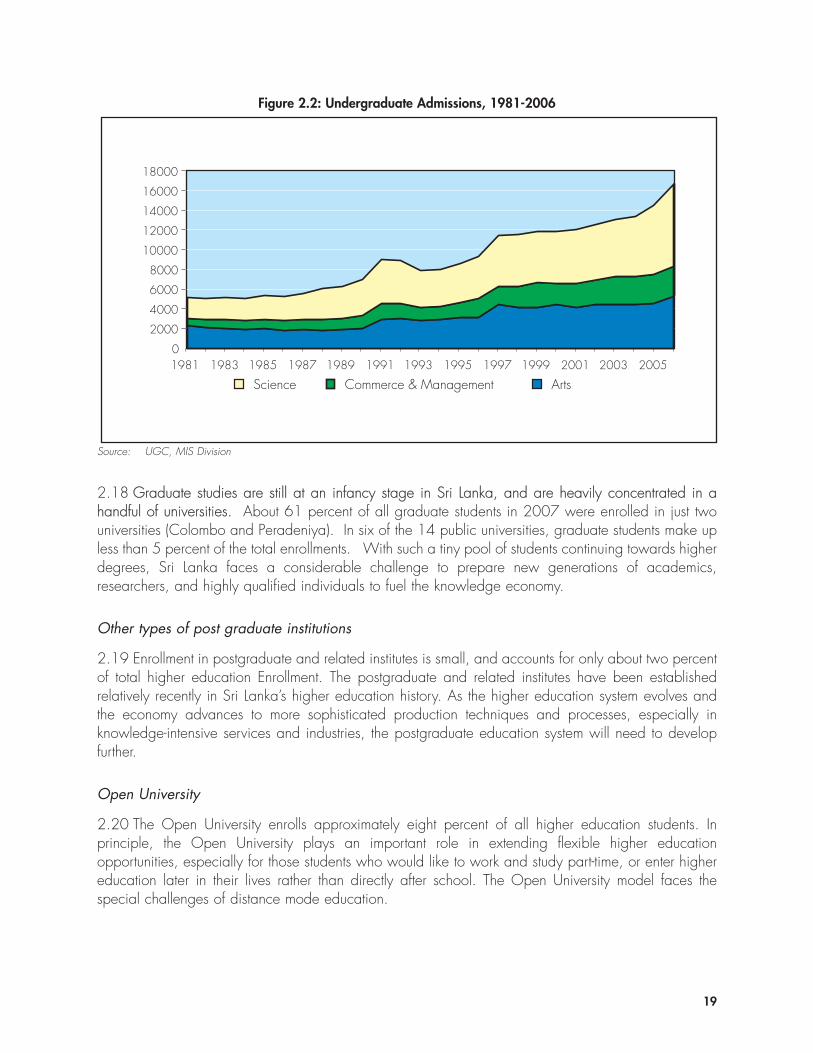
19
2.18 Graduate studies are still at an infancy stage in Sri Lanka, and are heavily concentrated in ahandful of universities. About 61 percent of all graduate students in 2007 were enrolled in just twouniversities (Colombo and Peradeniya). In six of the 14 public universities, graduate students make upless than 5 percent of the total enrollments. With such a tiny pool of students continuing towards higherdegrees, Sri Lanka faces a considerable challenge to prepare new generations of academics,researchers, and highly qualified individuals to fuel the knowledge economy.
Other types of post graduate institutions
2.19 Enrollment in postgraduate and related institutes is small, and accounts for only about two percentof total higher education Enrollment. The postgraduate and related institutes have been establishedrelatively recently in Sri Lanka’s higher education history. As the higher education system evolves andthe economy advances to more sophisticated production techniques and processes, especially inknowledge-intensive services and industries, the postgraduate education system will need to developfurther.
Open University
2.20 The Open University enrolls approximately eight percent of all higher education students. Inprinciple, the Open University plays an important role in extending flexible higher educationopportunities, especially for those students who would like to work and study part-time, or enter highereducation later in their lives rather than directly after school. The Open University model faces thespecial challenges of distance mode education.
Figure 2.2: Undergraduate Admissions, 1981-2006
0
2000
4000
6000
8000
10000
12000
14000
16000
18000
1981 1983 1985 1987 1989 1991 1993 1995 1997 1999 2001 2003 2005
Science Commerce & Management Arts
Source: UGC, MIS Division
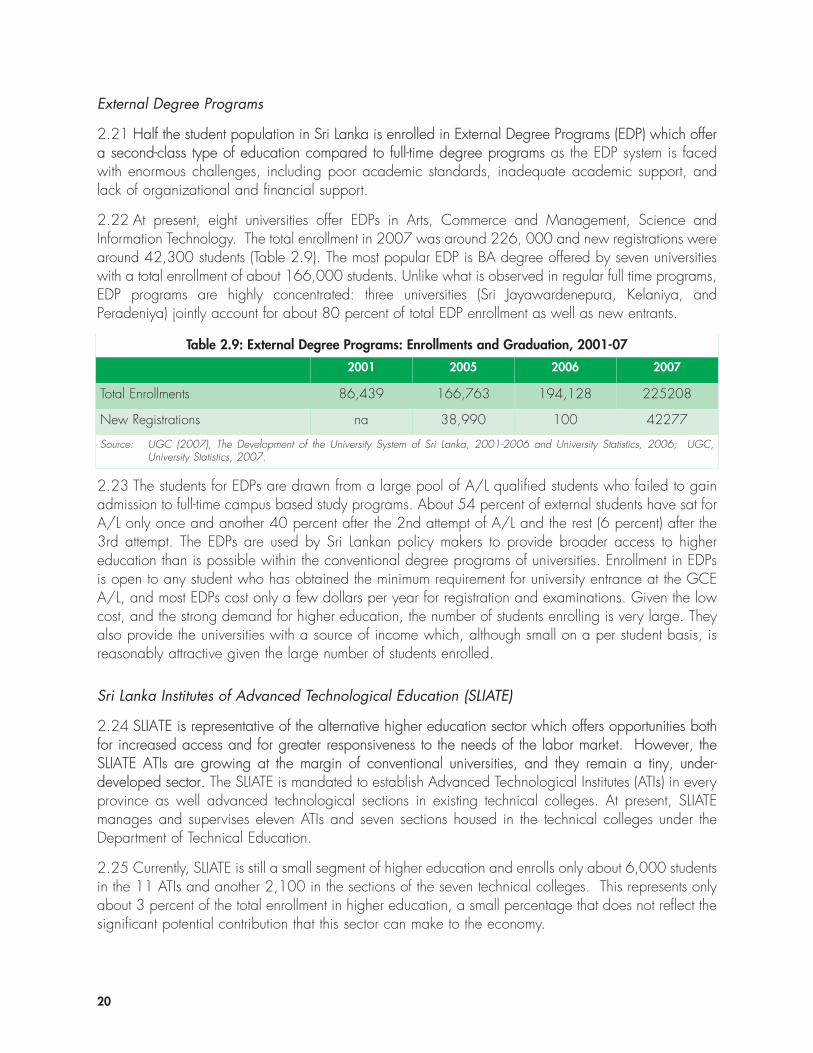
20
External Degree Programs
2.21 Half the student population in Sri Lanka is enrolled in External Degree Programs (EDP) which offera second-class type of education compared to full-time degree programs as the EDP system is facedwith enormous challenges, including poor academic standards, inadequate academic support, andlack of organizational and financial support.
2.22 At present, eight universities offer EDPs in Arts, Commerce and Management, Science andInformation Technology. The total enrollment in 2007 was around 226, 000 and new registrations werearound 42,300 students (Table 2.9). The most popular EDP is BA degree offered by seven universitieswith a total enrollment of about 166,000 students. Unlike what is observed in regular full time programs,EDP programs are highly concentrated: three universities (Sri Jayawardenepura, Kelaniya, andPeradeniya) jointly account for about 80 percent of total EDP enrollment as well as new entrants.
Table 2.9: External Degree Programs: Enrollments and Graduation, 2001-07
2001 2005 2006 2007
Total Enrollments 86,439 166,763 194,128 225208
New Registrations na 38,990 100 42277
Source: UGC (2007), The Development of the University System of Sri Lanka, 2001-2006 and University Statistics, 2006; UGC,University Statistics, 2007.
2.23 The students for EDPs are drawn from a large pool of A/L qualified students who failed to gainadmission to full-time campus based study programs. About 54 percent of external students have sat forA/L only once and another 40 percent after the 2nd attempt of A/L and the rest (6 percent) after the3rd attempt. The EDPs are used by Sri Lankan policy makers to provide broader access to highereducation than is possible within the conventional degree programs of universities. Enrollment in EDPsis open to any student who has obtained the minimum requirement for university entrance at the GCEA/L, and most EDPs cost only a few dollars per year for registration and examinations. Given the lowcost, and the strong demand for higher education, the number of students enrolling is very large. Theyalso provide the universities with a source of income which, although small on a per student basis, isreasonably attractive given the large number of students enrolled.
Sri Lanka Institutes of Advanced Technological Education (SLIATE)
2.24 SLIATE is representative of the alternative higher education sector which offers opportunities bothfor increased access and for greater responsiveness to the needs of the labor market. However, theSLIATE ATIs are growing at the margin of conventional universities, and they remain a tiny, under-developed sector. The SLIATE is mandated to establish Advanced Technological Institutes (ATIs) in everyprovince as well advanced technological sections in existing technical colleges. At present, SLIATEmanages and supervises eleven ATIs and seven sections housed in the technical colleges under theDepartment of Technical Education.
2.25 Currently, SLIATE is still a small segment of higher education and enrolls only about 6,000 studentsin the 11 ATIs and another 2,100 in the sections of the seven technical colleges. This represents onlyabout 3 percent of the total enrollment in higher education, a small percentage that does not reflect thesignificant potential contribution that this sector can make to the economy.
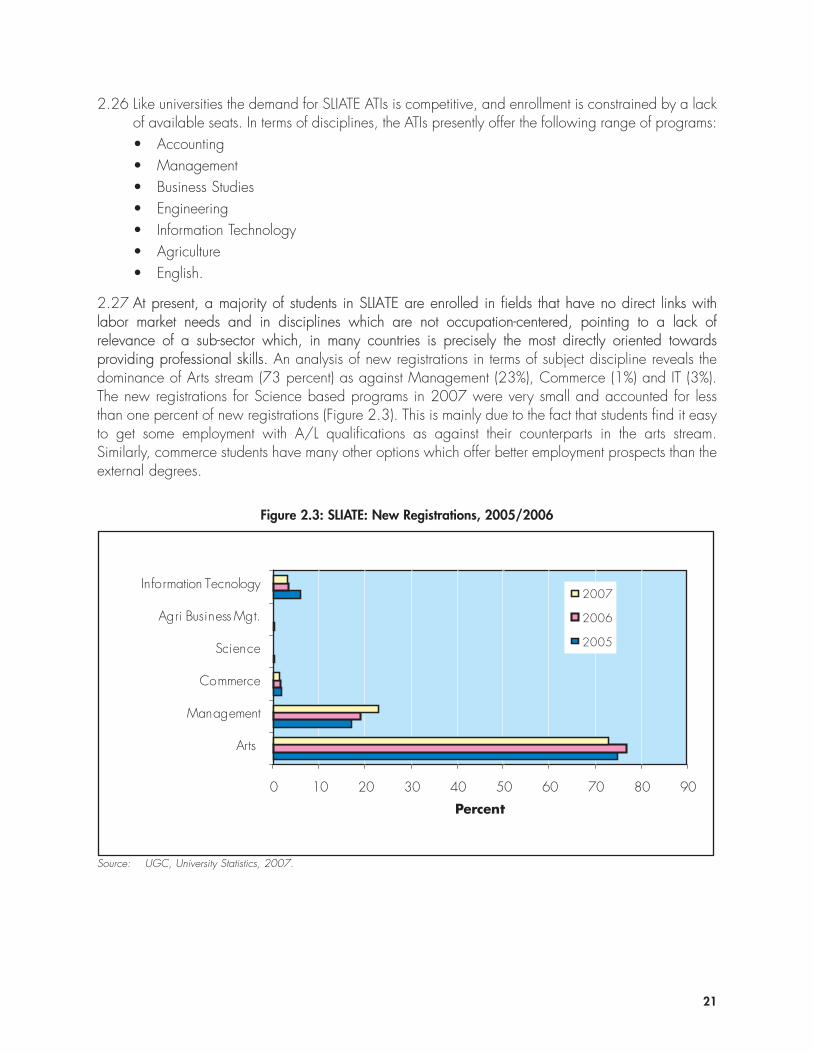
21
2.26 Like universities the demand for SLIATE ATIs is competitive, and enrollment is constrained by a lackof available seats. In terms of disciplines, the ATIs presently offer the following range of programs: • Accounting• Management• Business Studies• Engineering• Information Technology• Agriculture• English.
2.27 At present, a majority of students in SLIATE are enrolled in fields that have no direct links withlabor market needs and in disciplines which are not occupation-centered, pointing to a lack ofrelevance of a sub-sector which, in many countries is precisely the most directly oriented towardsproviding professional skills. An analysis of new registrations in terms of subject discipline reveals thedominance of Arts stream (73 percent) as against Management (23%), Commerce (1%) and IT (3%).The new registrations for Science based programs in 2007 were very small and accounted for lessthan one percent of new registrations (Figure 2.3). This is mainly due to the fact that students find it easyto get some employment with A/L qualifications as against their counterparts in the arts stream.Similarly, commerce students have many other options which offer better employment prospects than theexternal degrees.
Figure 2.3: SLIATE: New Registrations, 2005/2006
Percent
2007
2006
2005
Arts
Management
Commerce
Science
Agri Business Mgt.
Information Tecnology
0 10 20 30 40 50 60 70 80 90
Source: UGC, University Statistics, 2007.
22
Private Higher Education Institutions
2.28 The public HE sector is complemented by a growing private fee-paying HE institutions sectorwhich, however, still remains relatively small, enrolling only about 15 percent of all students. There areat least 45,700 students attending private sector HEIs and professional associations in Sri Lanka [Peiris(2007)], and more than 50 private institutions engaged in the provision of higher education.14 Theprivate higher education sector encompasses a diversity of providers, including degree-grantinginstitutions, institutions offering lower-level diplomas, certificates, short courses, and qualifications fromprofessional associations such as the Society of Certified Management Accountants of Sri Lanka. Mostprivate providers are located in large cities and towns such as Colombo and Kandy, although somehave branch campuses in several centers. The degree-granting segment of the private HE sector issmall, consisting of some 10 institutions, with enrollments of about 2,500, most of which offer degreesthrough affiliations with foreign universities. The bulk of these foreign universities are based in countriessuch as the United Kingdom, the United States, Australia, China, Singapore and Malaysia.
2.29 The private HE sector in Sri Lanka is relatively recent, with much of the development andexpansion of the sector dating back only to the 1990s.15 Private HEIs are generally small in size – withmost having fewer than 1,000 students enrolled. For example, the Imperial Institute of Higher Educationand APIIT enrolled 400 and 700 students, respectively, in 2007. A few providers – such as AquinasCollege – are much larger, with 10,000 enrollments. Aquinas College is a non-profit higher educationinstitution which has been in existence for many years, in contrast to the majority of other private highereducation institutions.
2.30 There are many factors which account for the growth in the private HE sector in Sri Lanka. Thefirst is of course the limited number of places at public universities. The private tertiary education sectorplays a significant role in absorbing qualified high school graduates who are unable to gain admissionto Sri Lanka’s public universities. Several other factors are at play. These include the fact that: (a) manystudents are not admitted to their preferred programs and universities and hence opt for a private HEIover their free public place; (b) private HEIs offer more applied and job relevant curricula; (c) privateHEIs turn out graduates with better command of English, and better developed ‘soft skills’ – which areimportant to employers;16 (d) strikes in public universities force their regular closure, resulting in alengthening of the time it takes students to complete a degree; (e) there are concerns about politicalinfluence in student affairs and student safety at public universities given campus violence and unrest,and the practice of ‘ragging’; and (f) there is high unemployment among public university graduates.17
2.31 Compared with other MIC such as those in East Asia or Latin America, the private sector in SriLanka still has a lot of room to grow. While public higher education remains the norm in many countries,the private sector plays a significant and growing role [Table 2.10]. In countries as diverse as Japan,Taiwan, South Korea, the Philippines, Chile, Brazil, Bangladesh, or Pakistan, the private sector
14 Peiris, C (2007) Students Taken for a Ride: Sri Lankan Example, Presentation to APQN Conference Emerging Challenges,Emerging Practices: Sharing a Global Vision of Quality Assurance in Higher Education, Kuala Lumpur.
15 For example, the Imperial Institute of Higher Education, APIIT and Metropolitan College were established in 1996, 2000and 2004 respectively.
16 Sri Lanka Information Communication Technology Association (2007) Rising Demand: The increasing demand for IT workersspells a challenging opportunity for the IT industry, p. 26.
17 For example, Wimalaweera (2008) shows that the proportion of graduates from the University of Colombo who found a jobwithin three months ranged from 3 percent (LLB) to 57 percent (BSc - Management).
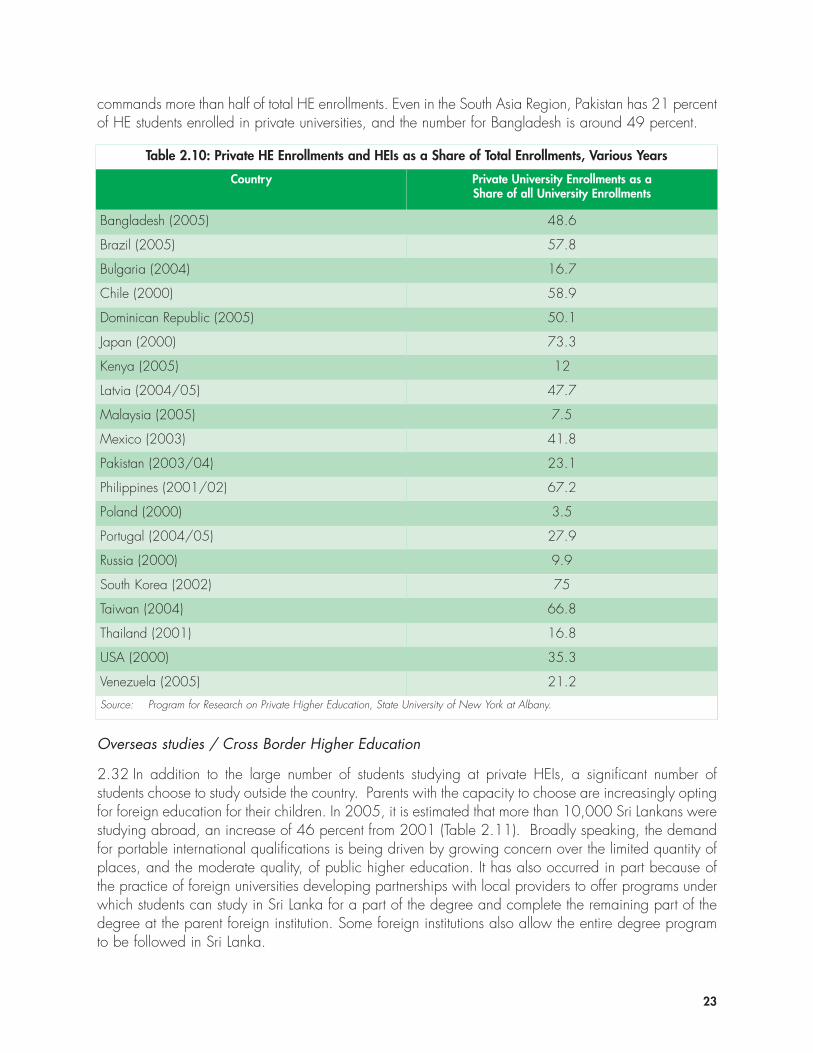
23
commands more than half of total HE enrollments. Even in the South Asia Region, Pakistan has 21 percentof HE students enrolled in private universities, and the number for Bangladesh is around 49 percent.
Table 2.10: Private HE Enrollments and HEIs as a Share of Total Enrollments, Various Years
Country Private University Enrollments as a Share of all University Enrollments
Bangladesh (2005) 48.6
Brazil (2005) 57.8
Bulgaria (2004) 16.7
Chile (2000) 58.9
Dominican Republic (2005) 50.1
Japan (2000) 73.3
Kenya (2005) 12
Latvia (2004/05) 47.7
Malaysia (2005) 7.5
Mexico (2003) 41.8
Pakistan (2003/04) 23.1
Philippines (2001/02) 67.2
Poland (2000) 3.5
Portugal (2004/05) 27.9
Russia (2000) 9.9
South Korea (2002) 75
Taiwan (2004) 66.8
Thailand (2001) 16.8
USA (2000) 35.3
Venezuela (2005) 21.2
Source: Program for Research on Private Higher Education, State University of New York at Albany.
Overseas studies / Cross Border Higher Education
2.32 In addition to the large number of students studying at private HEIs, a significant number ofstudents choose to study outside the country. Parents with the capacity to choose are increasingly optingfor foreign education for their children. In 2005, it is estimated that more than 10,000 Sri Lankans werestudying abroad, an increase of 46 percent from 2001 (Table 2.11). Broadly speaking, the demandfor portable international qualifications is being driven by growing concern over the limited quantity ofplaces, and the moderate quality, of public higher education. It has also occurred in part because ofthe practice of foreign universities developing partnerships with local providers to offer programs underwhich students can study in Sri Lanka for a part of the degree and complete the remaining part of thedegree at the parent foreign institution. Some foreign institutions also allow the entire degree programto be followed in Sri Lanka.
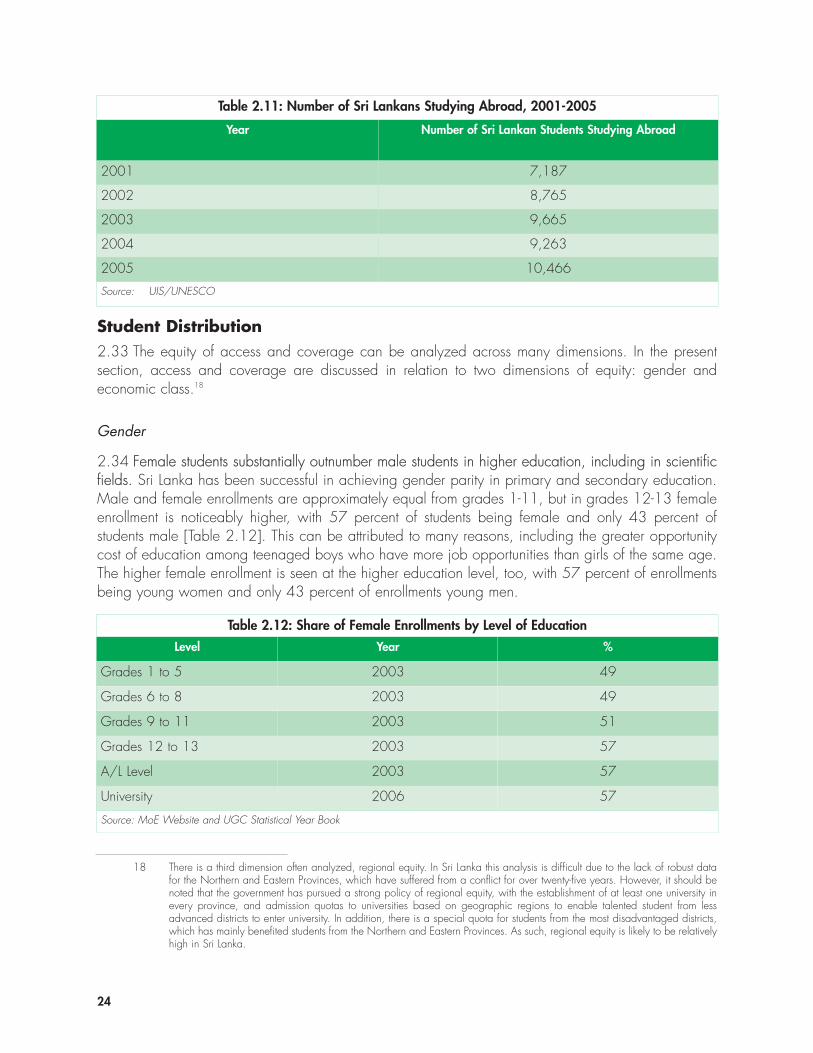
24
Table 2.11: Number of Sri Lankans Studying Abroad, 2001-2005
Year Number of Sri Lankan Students Studying Abroad
2001 7,187
2002 8,765
2003 9,665
2004 9,263
2005 10,466
Source: UIS/UNESCO
Student Distribution2.33 The equity of access and coverage can be analyzed across many dimensions. In the presentsection, access and coverage are discussed in relation to two dimensions of equity: gender andeconomic class.18
Gender
2.34 Female students substantially outnumber male students in higher education, including in scientificfields. Sri Lanka has been successful in achieving gender parity in primary and secondary education.Male and female enrollments are approximately equal from grades 1-11, but in grades 12-13 femaleenrollment is noticeably higher, with 57 percent of students being female and only 43 percent ofstudents male [Table 2.12]. This can be attributed to many reasons, including the greater opportunitycost of education among teenaged boys who have more job opportunities than girls of the same age.The higher female enrollment is seen at the higher education level, too, with 57 percent of enrollmentsbeing young women and only 43 percent of enrollments young men.
Table 2.12: Share of Female Enrollments by Level of Education
Level Year %
Grades 1 to 5 2003 49
Grades 6 to 8 2003 49
Grades 9 to 11 2003 51
Grades 12 to 13 2003 57
A/L Level 2003 57
University 2006 57
Source: MoE Website and UGC Statistical Year Book
18 There is a third dimension often analyzed, regional equity. In Sri Lanka this analysis is difficult due to the lack of robust datafor the Northern and Eastern Provinces, which have suffered from a conflict for over twenty-five years. However, it should benoted that the government has pursued a strong policy of regional equity, with the establishment of at least one university inevery province, and admission quotas to universities based on geographic regions to enable talented student from lessadvanced districts to enter university. In addition, there is a special quota for students from the most disadvantaged districts,which has mainly benefited students from the Northern and Eastern Provinces. As such, regional equity is likely to be relativelyhigh in Sri Lanka.
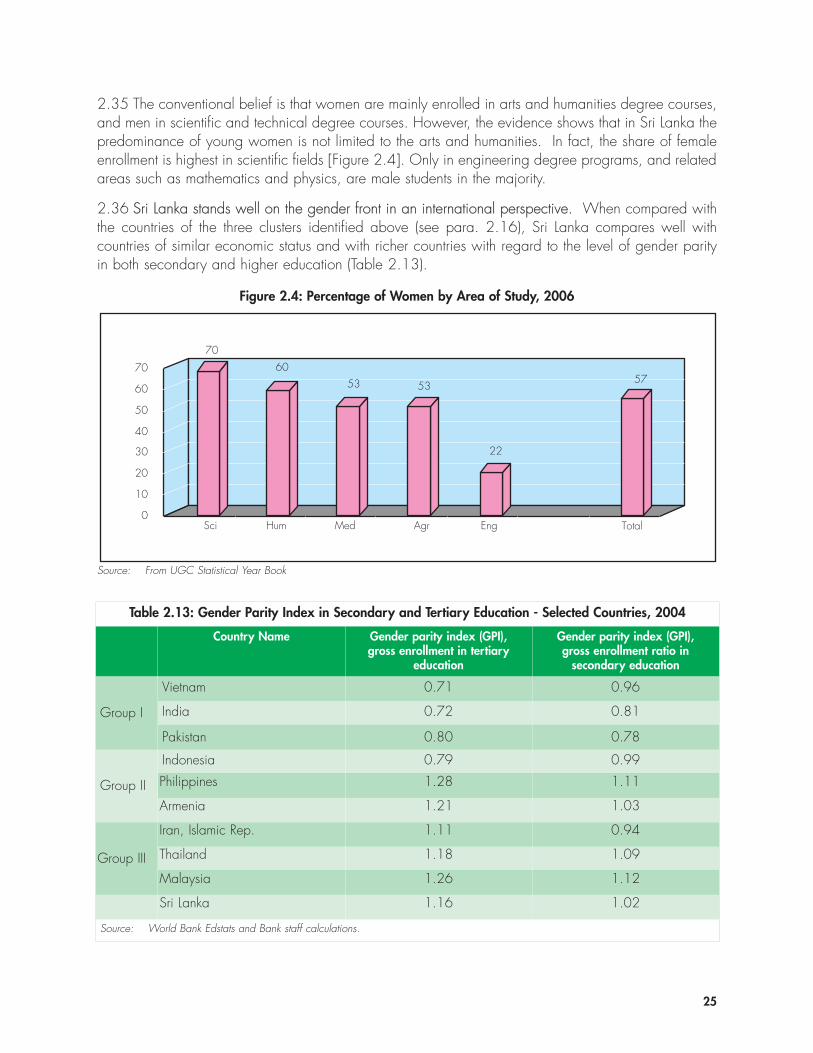
25
2.35 The conventional belief is that women are mainly enrolled in arts and humanities degree courses,and men in scientific and technical degree courses. However, the evidence shows that in Sri Lanka thepredominance of young women is not limited to the arts and humanities. In fact, the share of femaleenrollment is highest in scientific fields [Figure 2.4]. Only in engineering degree programs, and relatedareas such as mathematics and physics, are male students in the majority.
2.36 Sri Lanka stands well on the gender front in an international perspective. When compared withthe countries of the three clusters identified above (see para. 2.16), Sri Lanka compares well withcountries of similar economic status and with richer countries with regard to the level of gender parityin both secondary and higher education (Table 2.13).
Figure 2.4: Percentage of Women by Area of Study, 2006
70
6053 53
22
57
0
10
20
30
40
50
60
70
Sci Hum Med Agr Eng Total
Source: From UGC Statistical Year Book
Table 2.13: Gender Parity Index in Secondary and Tertiary Education - Selected Countries, 2004
Country Name Gender parity index (GPI), gross enrollment in tertiary
education
Gender parity index (GPI), gross enrollment ratio in
secondary education
Group I
Vietnam 0.71 0.96
India 0.72 0.81
Pakistan 0.80 0.78
Group II
Indonesia 0.79 0.99
Philippines 1.28 1.11
Armenia 1.21 1.03
Group III
Iran, Islamic Rep. 1.11 0.94
Thailand 1.18 1.09
Malaysia 1.26 1.12
Sri Lanka 1.16 1.02
Source: World Bank Edstats and Bank staff calculations.
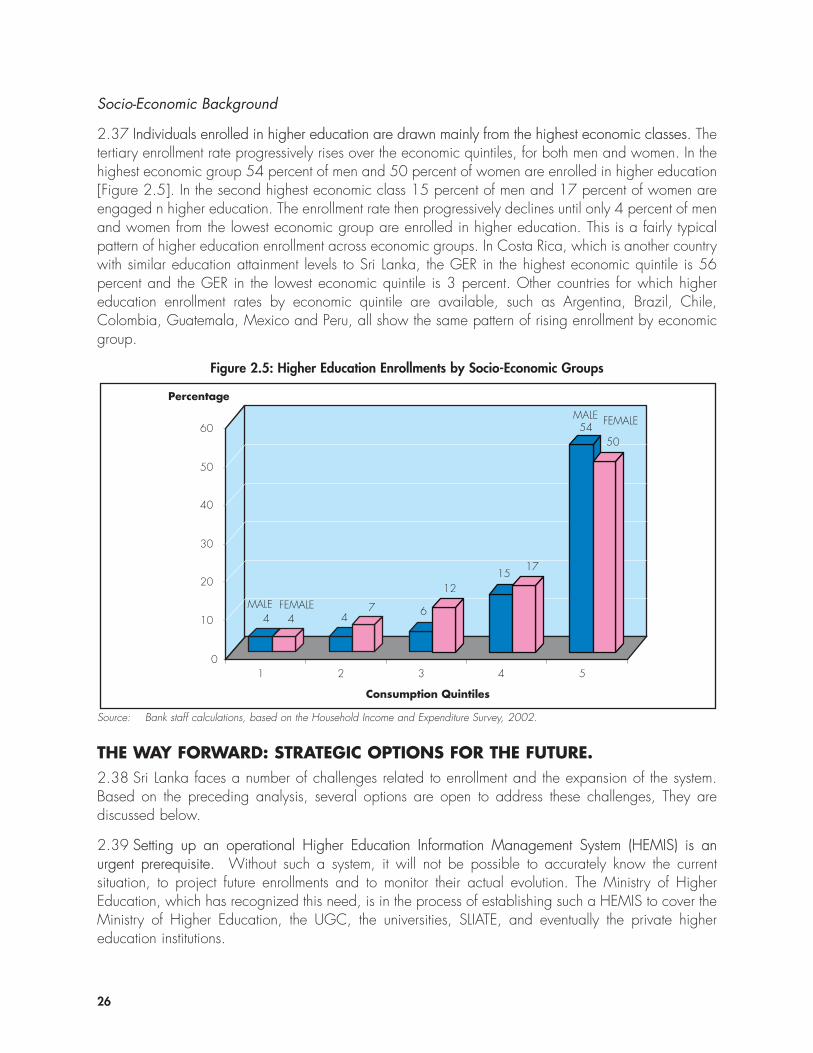
26
Socio-Economic Background
2.37 Individuals enrolled in higher education are drawn mainly from the highest economic classes. Thetertiary enrollment rate progressively rises over the economic quintiles, for both men and women. In thehighest economic group 54 percent of men and 50 percent of women are enrolled in higher education[Figure 2.5]. In the second highest economic class 15 percent of men and 17 percent of women areengaged n higher education. The enrollment rate then progressively declines until only 4 percent of menand women from the lowest economic group are enrolled in higher education. This is a fairly typicalpattern of higher education enrollment across economic groups. In Costa Rica, which is another countrywith similar education attainment levels to Sri Lanka, the GER in the highest economic quintile is 56percent and the GER in the lowest economic quintile is 3 percent. Other countries for which highereducation enrollment rates by economic quintile are available, such as Argentina, Brazil, Chile,Colombia, Guatemala, Mexico and Peru, all show the same pattern of rising enrollment by economicgroup.
Figure 2.5: Higher Education Enrollments by Socio-Economic Groups
4 4 47 6
1215
17
5450
0
10
20
30
40
50
60
Percentage
1 2 3 4 5
Consumption Quintiles
MALE FEMALE
MALE FEMALE
Source: Bank staff calculations, based on the Household Income and Expenditure Survey, 2002.
THE WAY FORWARD: STRATEGIC OPTIONS FOR THE FUTURE. 2.38 Sri Lanka faces a number of challenges related to enrollment and the expansion of the system.Based on the preceding analysis, several options are open to address these challenges, They arediscussed below.
2.39 Setting up an operational Higher Education Information Management System (HEMIS) is anurgent prerequisite. Without such a system, it will not be possible to accurately know the currentsituation, to project future enrollments and to monitor their actual evolution. The Ministry of HigherEducation, which has recognized this need, is in the process of establishing such a HEMIS to cover theMinistry of Higher Education, the UGC, the universities, SLIATE, and eventually the private highereducation institutions.
2.40 The main policy question regarding enrollments in higher education is whether the latter shouldbe stabilized or increased. Given the demographic and other pressures on the sector, the “natural”response is to opt for growth. What makes this question particularly difficult, however, is that it doesnot come alone, and it is intertwined with at least three other questions: what will be the direct(monetary) and indirect (opportunity) cost of the expansion? Who should bear this cost so that theexpansion is efficient and equitable? And how can the policy makers make sure that the expandedsystem will be improved in terms of quality and relevance? While these questions will be delved intoin subsequent chapters, some generic responses can be brought to the forefront.
2.41 As several of the weaknesses which adversely affect higher education have their roots at theschool level and simply flow into higher education in a mechanical way, actions have to be takenupstream at the pre-tertiary level. There are three critical dimensions to this: stream pathways, quality,and transition to higher education.
2.42 In order to channel a larger share of students into job-oriented and/or technical and scientificfields in higher education, gradual shifts have to happen in secondary and upper secondary educationso that students graduating from these levels are fully prepared to enter these fields in the highereducation system. English language skills and IT skills of students completing school education, inparticular, are extremely important for good quality higher education. The Government, under theEducation Sector Development Framework and Program (ESDFP), has commenced addressing theseneeds. However, this comes after generations of neglect and even antagonism towards Englishlanguage fluency. Also, IT equipment is relatively expensive in a developing country. As a result, aconsiderable period of time will be required to develop adequate English language fluency and IT skillson a broad scale.
2.43 The Government could consider diversifying further higher education, in order to offer secondaryeducation completers more alternatives avenues after graduating. More specifically, it would be timelyto open wider the doors to alternative higher education, such as the SLIATE ATIs. These HEIs offercourses directly oriented to the needs of the labor market, are relatively cost effective as they have lowerunit costs than university degree programs, and have courses of shorter duration, so that the graduatesare available in the labor market more quickly.
2.44 The fate of students choosing (or obliged to choose) EDPs needs to be seriously reconsidered. Thesecond-class treatment given to these students is a major issue. Further, graduate unemployment ishighest among these external degree holders, and the expansion of the external degree system wouldexacerbate this serious problem. Diversifying the provision of higher education services and linking upthe external degree courses to distance education may be one of the most effective ways to addressthe issue, especially since the facilities for distance education already exist.
2.45 The public university system will face pressure to increase over time. The state could considerdirecting expansion mainly to the new, small universities (e.g. those with under 2,000 students). Careis needed to increase enrollment so that the quality and labor market relevance of these graduates doesnot decline. If this can be achieved, it would improve the efficiency of the new higher educationinstitutions.
2.46 Many countries that share with Sri Lanka a strong state-centered economic legacy, such as Russia,China, the Czech Republic, Poland, Hungary, Ukraine, Georgia, the Slovak Republic, Bulgaria,Romania, and Vietnam, have diversified and expanded their higher education systems by encouraging
27
the private sector and by promoting private-public partnerships in higher education. Sri Lanka, too,could advance in this direction. Encouraging the private sector would have several benefits: (a) in-takecapacity in higher education would expand in market-oriented courses, as private HIEs typically offersuch programs; (b) it would attract more resources into the higher education sector; and (c) a dynamicprivate higher education sector would contribute to economic growth. Options for expanding theprivate higher education sector are discussed more in Chapters 4 and 6 of this report.
2.47 Private HEIs charge fees which could make it difficult for gifted students from poor homes toaccess their services. This can be overcome by policies to provide talented poor students with studentaid, such as vouchers, scholarships, bursaries and loans. This would need to be over and above thepositions available for such students in the tuition free public university system.
28
29
Chapter ThreeENHANCING HIGHEREDUCATION QUALITY
INTRODUCTION3.1 The quality of higher education is perceived to be unsatisfactory in the public discourse and themedia. There are no solid data to document such perception (in particular, no internationallycomparable data), but rather a convergence of signs and opinions, which give it some legitimacy.International experience suggests that all rapidly increasing systems of higher education do lose theirinitial level of quality, which they tend to recover once the system stabilizes (and when the country movesto a higher economic level). It is likely that Sri Lanka is exactly at this juncture, characteristic of thetransition stage which the country is currently experimenting. In fact, the quality of higher educationseems to vary widely. There are good quality institutions such as Moratuwa University, and some otherdegree programs, especially in medicine and IT. But the majority of programs, especially in the newuniversities and the higher education institutions in the lagging regions, do have considerable room forimprovement. This is particularly the case in terms of technical competence and soft skills.
3.2 This Chapter has five parts. The first part examines the multi-faceted nature of quality in the highereducation sector, with particular emphasis on the university system. The second part examines thequality issues of the external degree programs in public universities. The third part analyzes quality inthe Advanced Technical Institutes (ATIs) of SLIATE. The fourth part discusses the special features andissues relating to the quality of private higher education institutions. The final part describes potentialagencies and structures for quality assurance across the entire higher education sector.
THE MULTI-DIMENSIONAL NATURE OF HIGHER EDUCATION QUALITY3.3 The maintenance and improvement of quality assumes increasing importance as the highereducation sector expands. The experience of developed and upper-middle income countries shows thatit also becomes more demanding, as a greater number of less able students enter the system. Hence,it is important to appreciate and clarify the multi-dimensional nature of education quality.
3.4 Higher education quality depends, to a considerable extent, on the way all the inputs of theeducation process interact to produce outcomes. This is influenced, among other factors, by the nationalcontext. The UK’s Quality Assurance Agency, for instance, states that: “academic quality is a way ofdescribing how well the learning opportunities available to students help them to achieve their award.It is about making sure that appropriate and effective teaching, support, assessment and learning
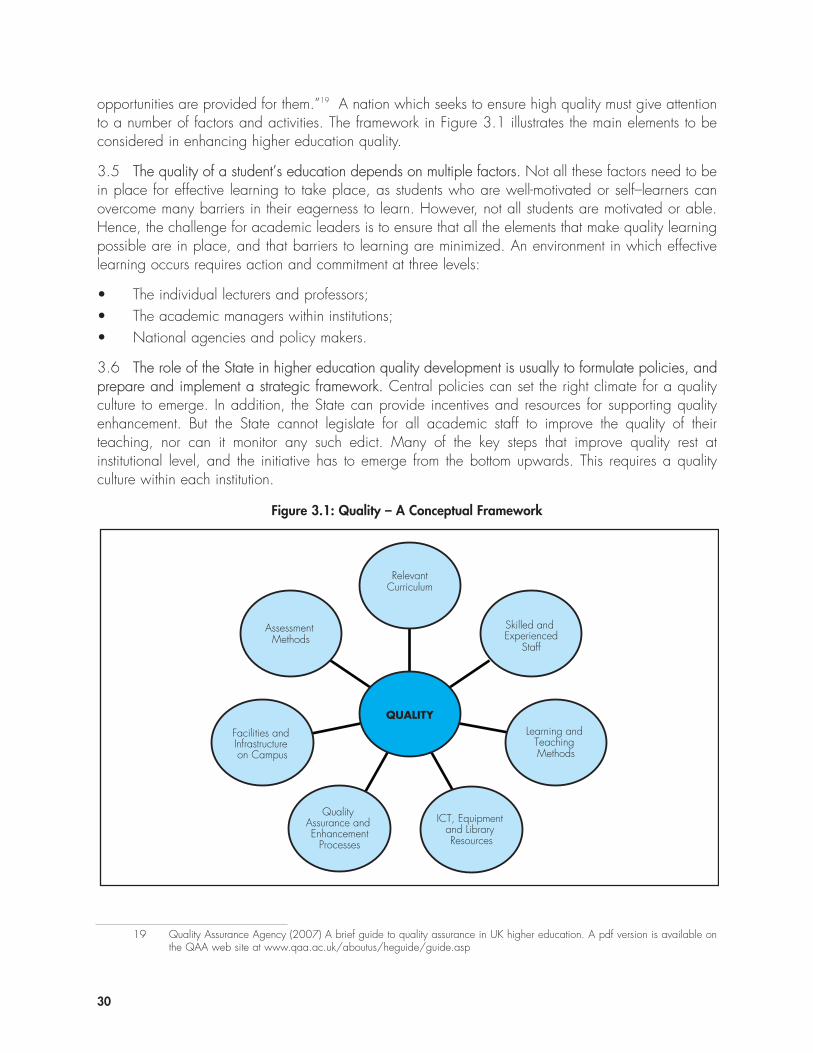
opportunities are provided for them.”19 A nation which seeks to ensure high quality must give attentionto a number of factors and activities. The framework in Figure 3.1 illustrates the main elements to beconsidered in enhancing higher education quality.
3.5 The quality of a student’s education depends on multiple factors. Not all these factors need to bein place for effective learning to take place, as students who are well-motivated or self–learners canovercome many barriers in their eagerness to learn. However, not all students are motivated or able.Hence, the challenge for academic leaders is to ensure that all the elements that make quality learningpossible are in place, and that barriers to learning are minimized. An environment in which effectivelearning occurs requires action and commitment at three levels:
• The individual lecturers and professors;• The academic managers within institutions; • National agencies and policy makers.
3.6 The role of the State in higher education quality development is usually to formulate policies, andprepare and implement a strategic framework. Central policies can set the right climate for a qualityculture to emerge. In addition, the State can provide incentives and resources for supporting qualityenhancement. But the State cannot legislate for all academic staff to improve the quality of theirteaching, nor can it monitor any such edict. Many of the key steps that improve quality rest atinstitutional level, and the initiative has to emerge from the bottom upwards. This requires a qualityculture within each institution.
30
Figure 3.1: Quality – A Conceptual Framework
Assessment Methods
Facilities and Infrastructure on Campus
Quality Assurance and Enhancement
Processes
ICT, Equipment and Library Resources
Learning and Teaching Methods
Skilled and Experienced
Staff
RelevantCurriculum
QUALITY
19 Quality Assurance Agency (2007) A brief guide to quality assurance in UK higher education. A pdf version is available onthe QAA web site at www.qaa.ac.uk/aboutus/heguide/guide.asp
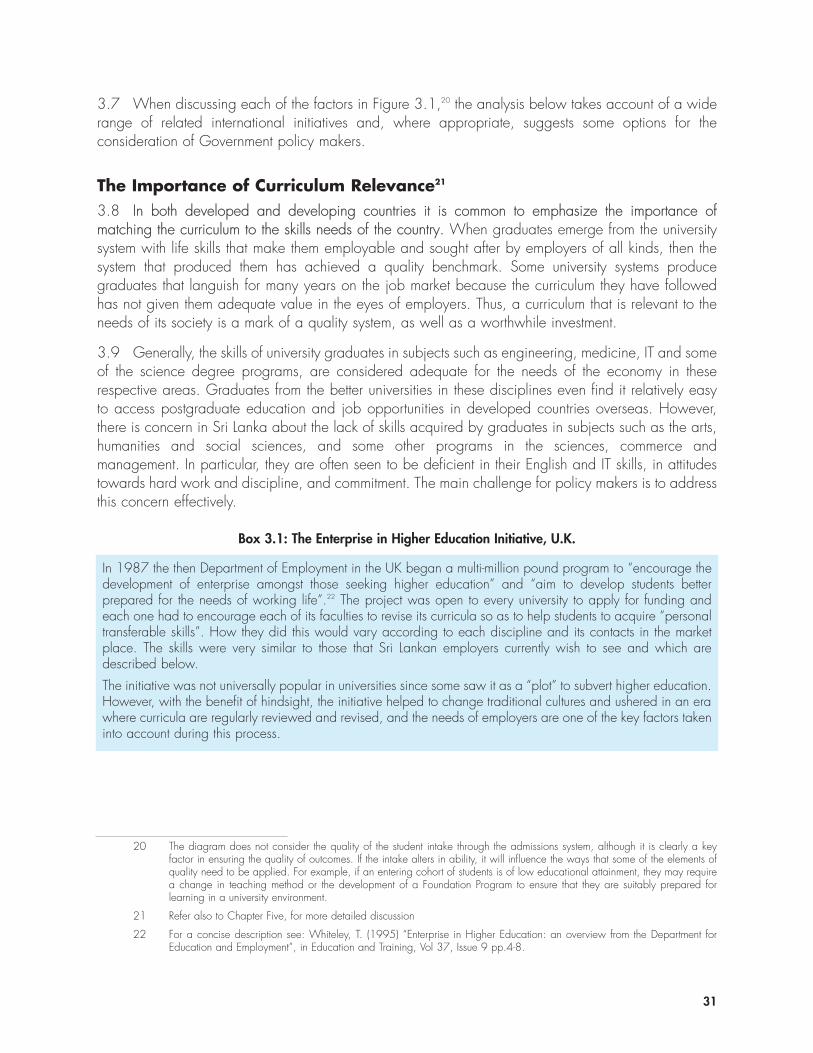
31
3.7 When discussing each of the factors in Figure 3.1,20 the analysis below takes account of a widerange of related international initiatives and, where appropriate, suggests some options for theconsideration of Government policy makers.
The Importance of Curriculum Relevance21
3.8 In both developed and developing countries it is common to emphasize the importance ofmatching the curriculum to the skills needs of the country. When graduates emerge from the universitysystem with life skills that make them employable and sought after by employers of all kinds, then thesystem that produced them has achieved a quality benchmark. Some university systems producegraduates that languish for many years on the job market because the curriculum they have followedhas not given them adequate value in the eyes of employers. Thus, a curriculum that is relevant to theneeds of its society is a mark of a quality system, as well as a worthwhile investment.
3.9 Generally, the skills of university graduates in subjects such as engineering, medicine, IT and someof the science degree programs, are considered adequate for the needs of the economy in theserespective areas. Graduates from the better universities in these disciplines even find it relatively easyto access postgraduate education and job opportunities in developed countries overseas. However,there is concern in Sri Lanka about the lack of skills acquired by graduates in subjects such as the arts,humanities and social sciences, and some other programs in the sciences, commerce andmanagement. In particular, they are often seen to be deficient in their English and IT skills, in attitudestowards hard work and discipline, and commitment. The main challenge for policy makers is to addressthis concern effectively.
20 The diagram does not consider the quality of the student intake through the admissions system, although it is clearly a keyfactor in ensuring the quality of outcomes. If the intake alters in ability, it will influence the ways that some of the elements ofquality need to be applied. For example, if an entering cohort of students is of low educational attainment, they may requirea change in teaching method or the development of a Foundation Program to ensure that they are suitably prepared forlearning in a university environment.
21 Refer also to Chapter Five, for more detailed discussion
22 For a concise description see: Whiteley, T. (1995) “Enterprise in Higher Education: an overview from the Department forEducation and Employment”, in Education and Training, Vol 37, Issue 9 pp.4-8.
Box 3.1: The Enterprise in Higher Education Initiative, U.K.
In 1987 the then Department of Employment in the UK began a multi-million pound program to “encourage thedevelopment of enterprise amongst those seeking higher education” and “aim to develop students betterprepared for the needs of working life”.22 The project was open to every university to apply for funding andeach one had to encourage each of its faculties to revise its curricula so as to help students to acquire “personaltransferable skills”. How they did this would vary according to each discipline and its contacts in the marketplace. The skills were very similar to those that Sri Lankan employers currently wish to see and which aredescribed below.
The initiative was not universally popular in universities since some saw it as a “plot” to subvert higher education.However, with the benefit of hindsight, the initiative helped to change traditional cultures and ushered in an erawhere curricula are regularly reviewed and revised, and the needs of employers are one of the key factors takeninto account during this process.
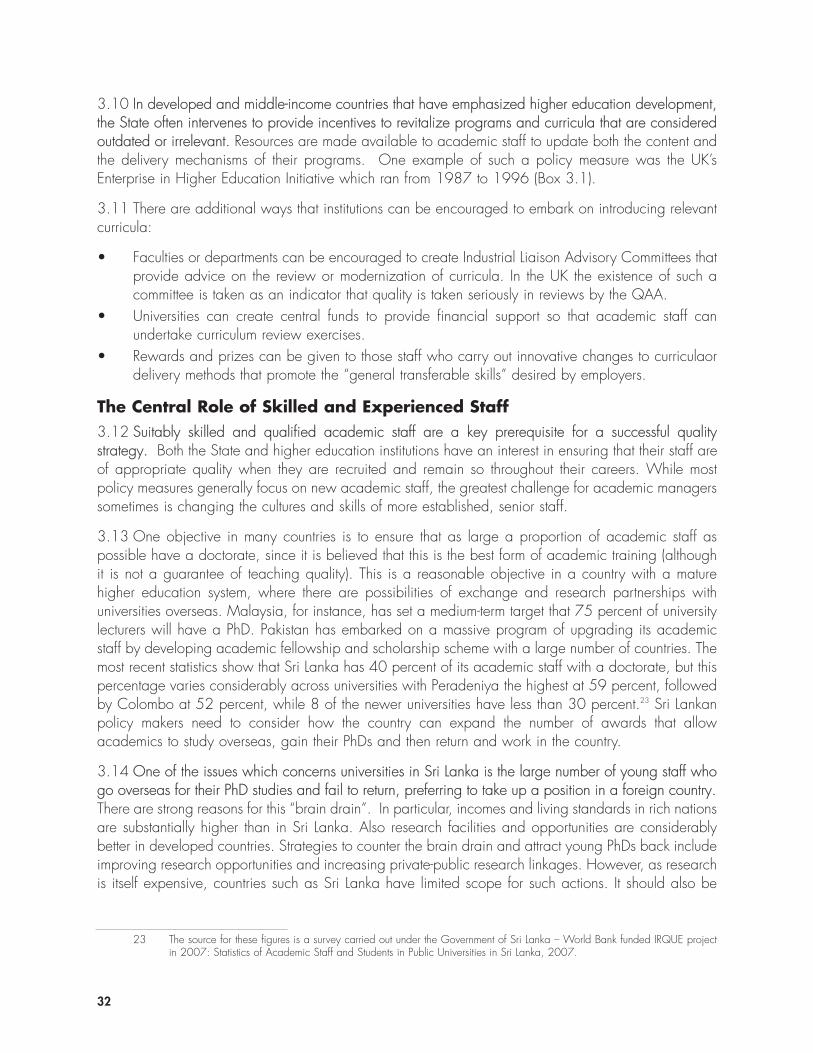
32
3.10 In developed and middle-income countries that have emphasized higher education development,the State often intervenes to provide incentives to revitalize programs and curricula that are consideredoutdated or irrelevant. Resources are made available to academic staff to update both the content andthe delivery mechanisms of their programs. One example of such a policy measure was the UK’sEnterprise in Higher Education Initiative which ran from 1987 to 1996 (Box 3.1).
3.11 There are additional ways that institutions can be encouraged to embark on introducing relevantcurricula:
• Faculties or departments can be encouraged to create Industrial Liaison Advisory Committees thatprovide advice on the review or modernization of curricula. In the UK the existence of such acommittee is taken as an indicator that quality is taken seriously in reviews by the QAA.
• Universities can create central funds to provide financial support so that academic staff canundertake curriculum review exercises.
• Rewards and prizes can be given to those staff who carry out innovative changes to curriculaordelivery methods that promote the “general transferable skills” desired by employers.
The Central Role of Skilled and Experienced Staff3.12 Suitably skilled and qualified academic staff are a key prerequisite for a successful qualitystrategy. Both the State and higher education institutions have an interest in ensuring that their staff areof appropriate quality when they are recruited and remain so throughout their careers. While mostpolicy measures generally focus on new academic staff, the greatest challenge for academic managerssometimes is changing the cultures and skills of more established, senior staff.
3.13 One objective in many countries is to ensure that as large a proportion of academic staff aspossible have a doctorate, since it is believed that this is the best form of academic training (althoughit is not a guarantee of teaching quality). This is a reasonable objective in a country with a maturehigher education system, where there are possibilities of exchange and research partnerships withuniversities overseas. Malaysia, for instance, has set a medium-term target that 75 percent of universitylecturers will have a PhD. Pakistan has embarked on a massive program of upgrading its academicstaff by developing academic fellowship and scholarship scheme with a large number of countries. Themost recent statistics show that Sri Lanka has 40 percent of its academic staff with a doctorate, but thispercentage varies considerably across universities with Peradeniya the highest at 59 percent, followedby Colombo at 52 percent, while 8 of the newer universities have less than 30 percent.23 Sri Lankanpolicy makers need to consider how the country can expand the number of awards that allowacademics to study overseas, gain their PhDs and then return and work in the country.
3.14 One of the issues which concerns universities in Sri Lanka is the large number of young staff whogo overseas for their PhD studies and fail to return, preferring to take up a position in a foreign country.There are strong reasons for this “brain drain”. In particular, incomes and living standards in rich nationsare substantially higher than in Sri Lanka. Also research facilities and opportunities are considerablybetter in developed countries. Strategies to counter the brain drain and attract young PhDs back includeimproving research opportunities and increasing private-public research linkages. However, as researchis itself expensive, countries such as Sri Lanka have limited scope for such actions. It should also be
23 The source for these figures is a survey carried out under the Government of Sri Lanka – World Bank funded IRQUE projectin 2007: Statistics of Academic Staff and Students in Public Universities in Sri Lanka, 2007.
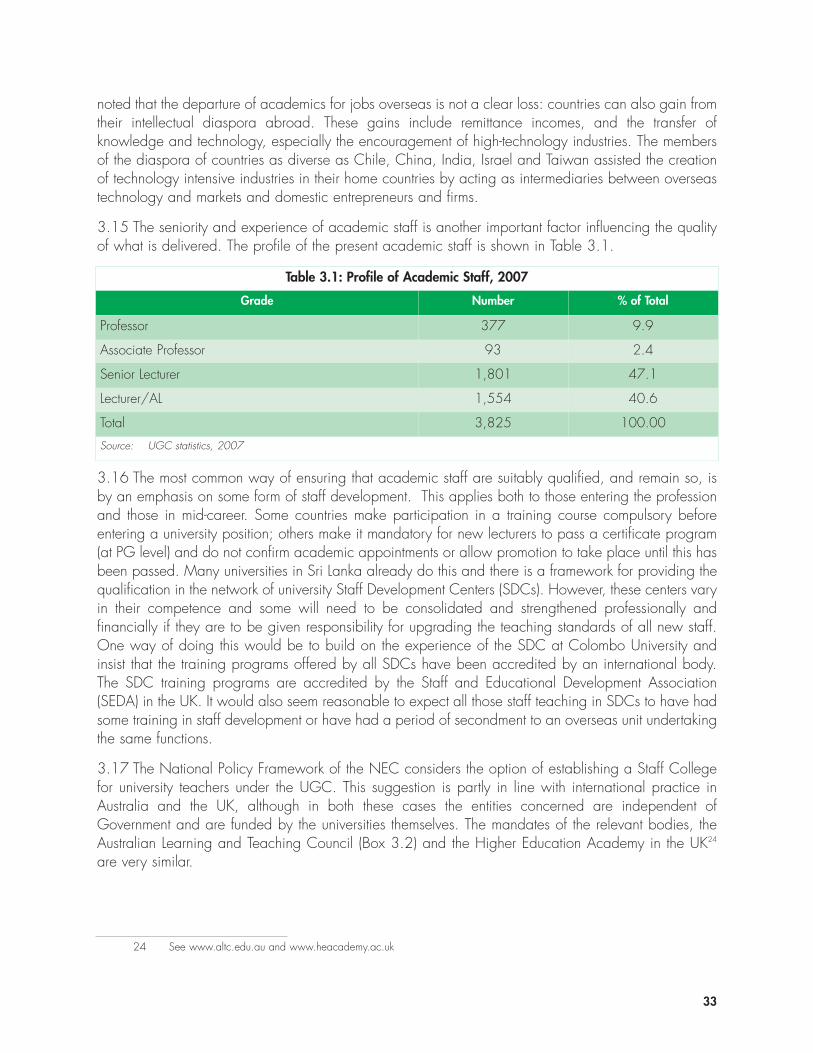
noted that the departure of academics for jobs overseas is not a clear loss: countries can also gain fromtheir intellectual diaspora abroad. These gains include remittance incomes, and the transfer ofknowledge and technology, especially the encouragement of high-technology industries. The membersof the diaspora of countries as diverse as Chile, China, India, Israel and Taiwan assisted the creationof technology intensive industries in their home countries by acting as intermediaries between overseastechnology and markets and domestic entrepreneurs and firms.
3.15 The seniority and experience of academic staff is another important factor influencing the qualityof what is delivered. The profile of the present academic staff is shown in Table 3.1.
33
Table 3.1: Profile of Academic Staff, 2007
Grade Number % of Total
Professor 377 9.9
Associate Professor 93 2.4
Senior Lecturer 1,801 47.1
Lecturer/AL 1,554 40.6
Total 3,825 100.00
Source: UGC statistics, 2007
3.16 The most common way of ensuring that academic staff are suitably qualified, and remain so, isby an emphasis on some form of staff development. This applies both to those entering the professionand those in mid-career. Some countries make participation in a training course compulsory beforeentering a university position; others make it mandatory for new lecturers to pass a certificate program(at PG level) and do not confirm academic appointments or allow promotion to take place until this hasbeen passed. Many universities in Sri Lanka already do this and there is a framework for providing thequalification in the network of university Staff Development Centers (SDCs). However, these centers varyin their competence and some will need to be consolidated and strengthened professionally andfinancially if they are to be given responsibility for upgrading the teaching standards of all new staff.One way of doing this would be to build on the experience of the SDC at Colombo University andinsist that the training programs offered by all SDCs have been accredited by an international body.The SDC training programs are accredited by the Staff and Educational Development Association(SEDA) in the UK. It would also seem reasonable to expect all those staff teaching in SDCs to have hadsome training in staff development or have had a period of secondment to an overseas unit undertakingthe same functions.
3.17 The National Policy Framework of the NEC considers the option of establishing a Staff Collegefor university teachers under the UGC. This suggestion is partly in line with international practice inAustralia and the UK, although in both these cases the entities concerned are independent ofGovernment and are funded by the universities themselves. The mandates of the relevant bodies, theAustralian Learning and Teaching Council (Box 3.2) and the Higher Education Academy in the UK24
are very similar.
24 See www.altc.edu.au and www.heacademy.ac.uk
3.18 Ensuring that all academic staff are providing high quality teaching and learning experiences totheir students is not something that can be achieved by government fiat. It requires commitment frominstitutional management and individual staff. The institutional objective has to seek a quality culturewhich places quality issues at the heart of every academic decision concerning programs and theirdelivery. What the State can do is to endorse this by emphasizing the value of good teaching.Countries such as the UK, Australia and China, for instance, organize national prizes for goodteaching. In the UK, for example, 50 National Teaching Fellows are honored at a ceremony, led bythe Minister of Education, and each receives a sum of GBP 10,000 to spend on an educational projectwithin their institution. The importance of quality teaching could also be confirmed if the Governmentwere to set up a national fund to finance institutional projects that enhance the quality of teaching. Thesignificance of government endorsement of good teaching is that the prevailing culture in mostuniversities favors research activity over teaching. Fame and esteem from peers comes from researchpublications rather than good teaching. This is the default instinct of most academics and thus strongleadership, a clear policy and supportive funding are needed if that instinct is to be balanced by afocus on good teaching.
3.19 There is a vitally important skill area where many academic staff require help from Government;this is in awareness and mastery of ICT. In considering the facilities and equipment that are neededfor Sri Lankan higher education to keep step with its international peers in academia, it should be bornein mind that any investment will be under-utilized if academic staff are not helped to acquire thenecessary computer literacy skills. Some university staff are fully competent in the ICT skills required fortheir discipline. However, a substantial investment in staff technical training will be needed in someinstitutions, both to ensure that staff (particularly older members) are as knowledgeable as their studentsand to enable them to make best use of the opportunities that e-learning will bring for improving learningand teaching. This is a world-wide problem; for instance, an article in the UK Guardian 2008 reportsthat in one university students were being paid for training their tutors in internet-based skills.25 One wayof remedying the problem would be for universities to expect all their academic staff to pass a test
34
Box 3.2: Australian Learning and Teaching Council
The Council (formerly called the Carrick Institute) has six objectives:
• Promote and support strategic changes in HEIs for the enhancement of teaching and learning,including curriculum development and assessment.
• Raise the profile and encourage recognition of the fundamental importance of teaching in HEIsand in the general community.
• Foster and acknowledge excellence in teaching in higher education.• Develop effective mechanisms for the identification, development, dissemination and
embedding of good individual practice in learning and teaching.• Develop and support reciprocal national and international arrangements for the purpose of
sharing and benchmarking learning and teaching processes.• Identify learning and teaching issues that impact on the national HE system and facilitate
national approaches to addressing them.Strategies used by the Council to achieve these objectives include: setting up networks of practitioners;managing national award schemes for good teaching; undertaking research into teaching methods; bringinginternational experts to Australia; and managing national grants and fellowship schemes.
25 The Guardian, 2 December 2008. See www.guardian.co.uk/digitalstudent
equivalent to the International Computer Driving License (ICDL). The Ministry of Education has programsto improve the computer literacy of school teachers. University academics should not be left behind.
3.20 There are a number of initiatives that need to be undertaken by responsible agencies to promotethe objective of ensuring that higher education institutions have skilled and experienced staff. Theseinclude:
• Increasing the number of nationally funded scholarships for PhDs and staff development throughinternational link programs, as well as the negotiation of bilateral scholarship agreements withfriendly countries.
• Making it a requirement that newly appointed staff should take a post graduate level certificatein teaching with an international accreditation (such as in Sweden and the UK). This certificatewould be a pre-requisite for promotion.
• Requiring that all those teaching in SDCs should have a certificate with accreditation from aninstitution such as SEDA or other institution, or have had experience working in a reputed SDC inanother country.
• Providing national funding for Teaching Excellence awards, with the awards made in anappropriate high profile ceremony to show the value given to teaching.
• A policy statement by Government regarding staff skills in ICT and a requirement that by a certaindate all academic staff shall have demonstrated competence in the use of ICT, by for instancepassing an appropriate test such as the ICDL.
3.21 An important element in the achievement of quality outcomes is the ability of the teaching staff tocommunicate effectively with learners. In some cases – particularly the humanities and social sciences- this is dependent on improving the English language skills of academics. This may be a significantproblem, as a Dean in one major university estimated that 80 percent of the staff in the humanitiesdepartments do not speak English well enough. Nor is it a requirement for entering the civil service sothat there are no strong incentives for students to improve their skills. There are several options forresolving this problem:
• Strengthening the English language training centers inside universities; • A policy ruling from Government that new public sector employees must have good English;• Encourage departments to prepare study guides/ work books in English;• Encourage departments to introduce internship as a part of the degree program i.e. with private
sector organizations;• Vice-Chancellors could request all academic staff to strengthen their English and include it as a
key criterion in staff selection and appointment;• Senates should also commit to moving all courses to the English language medium (as in Indian
universities);• The Government could offer pump-priming funding to develop new English curricula;• The Government could encourage/offer support to academic partnerships with universities in
English speaking countries as a way of developing English courses quickly.
Improving Learning and Teaching Methods3.22 The key to successful learning is the way that teaching staff interact with and assist students tolearn. Students need help, through interactive and activity-based teaching methods, to learn skills such
35
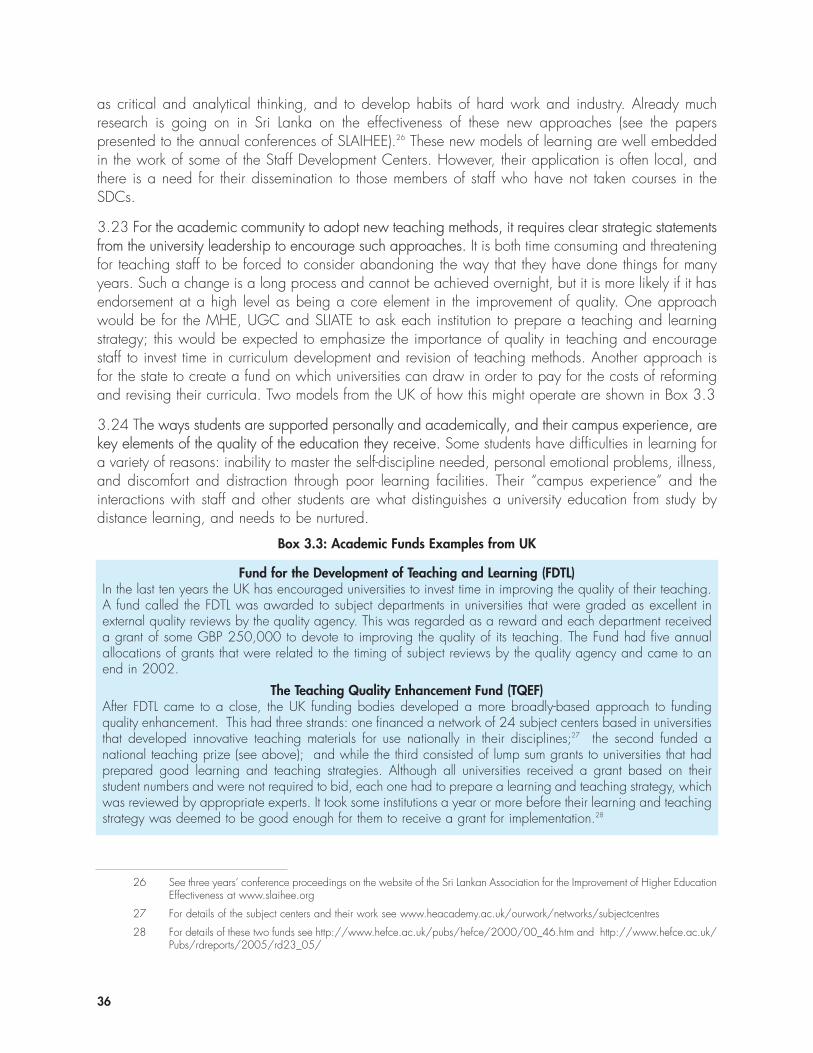
as critical and analytical thinking, and to develop habits of hard work and industry. Already muchresearch is going on in Sri Lanka on the effectiveness of these new approaches (see the paperspresented to the annual conferences of SLAIHEE).26 These new models of learning are well embeddedin the work of some of the Staff Development Centers. However, their application is often local, andthere is a need for their dissemination to those members of staff who have not taken courses in theSDCs.
3.23 For the academic community to adopt new teaching methods, it requires clear strategic statementsfrom the university leadership to encourage such approaches. It is both time consuming and threateningfor teaching staff to be forced to consider abandoning the way that they have done things for manyyears. Such a change is a long process and cannot be achieved overnight, but it is more likely if it hasendorsement at a high level as being a core element in the improvement of quality. One approachwould be for the MHE, UGC and SLIATE to ask each institution to prepare a teaching and learningstrategy; this would be expected to emphasize the importance of quality in teaching and encouragestaff to invest time in curriculum development and revision of teaching methods. Another approach isfor the state to create a fund on which universities can draw in order to pay for the costs of reformingand revising their curricula. Two models from the UK of how this might operate are shown in Box 3.3
3.24 The ways students are supported personally and academically, and their campus experience, arekey elements of the quality of the education they receive. Some students have difficulties in learning fora variety of reasons: inability to master the self-discipline needed, personal emotional problems, illness,and discomfort and distraction through poor learning facilities. Their “campus experience” and theinteractions with staff and other students are what distinguishes a university education from study bydistance learning, and needs to be nurtured.
36
26 See three years’ conference proceedings on the website of the Sri Lankan Association for the Improvement of Higher EducationEffectiveness at www.slaihee.org
27 For details of the subject centers and their work see www.heacademy.ac.uk/ourwork/networks/subjectcentres
28 For details of these two funds see http://www.hefce.ac.uk/pubs/hefce/2000/00_46.htm and http://www.hefce.ac.uk/Pubs/rdreports/2005/rd23_05/
Box 3.3: Academic Funds Examples from UK
Fund for the Development of Teaching and Learning (FDTL)In the last ten years the UK has encouraged universities to invest time in improving the quality of their teaching.A fund called the FDTL was awarded to subject departments in universities that were graded as excellent inexternal quality reviews by the quality agency. This was regarded as a reward and each department receiveda grant of some GBP 250,000 to devote to improving the quality of its teaching. The Fund had five annualallocations of grants that were related to the timing of subject reviews by the quality agency and came to anend in 2002.
The Teaching Quality Enhancement Fund (TQEF)After FDTL came to a close, the UK funding bodies developed a more broadly-based approach to fundingquality enhancement. This had three strands: one financed a network of 24 subject centers based in universitiesthat developed innovative teaching materials for use nationally in their disciplines;27 the second funded anational teaching prize (see above); and while the third consisted of lump sum grants to universities that hadprepared good learning and teaching strategies. Although all universities received a grant based on theirstudent numbers and were not required to bid, each one had to prepare a learning and teaching strategy, whichwas reviewed by appropriate experts. It took some institutions a year or more before their learning and teachingstrategy was deemed to be good enough for them to receive a grant for implementation.28
3.25 Universities can help to resolve students’ difficulties by providing central counseling and supportfunctions, and then ensuring that academic support is also available from within departments. However,such support services are not as universal or as professional as they should be, so that a prime elementin learning and teaching strategy is the recognition of the importance of these functions.
3.26 Students can benefit from periods of industrial placements during their degree programs. Thisenables students to learn the culture and environment of work places, as well as the practicalapplications of some of their theoretical training, and improve their job prospects. It also helps forge astronger link between universities and the industrial community. Some of the better degree programs inSri Lanka have instituted this practice, and with considerable success. It now needs to be broadenedacross the university system.
3.27 The implementation of e-learning is an area where Sri Lanka can benefit from being a lateadopter. Many mistakes have been made and large investments wasted in countries which have pilotede-learning approaches. It is now accepted, for example, that very few courses will benefit from beingwholly online and that the most effective use of e-learning is as part of a “blended learning” approachcombining traditional face-to-face instruction with student use of the internet and student access to webbased learning materials.29 Students also prefer this approach. The key to effective learning in aninstitution is to have one institutional VLE (Virtual Learning Environment) and ideally one that is opensource (such as Moodle) with a supporting team of specialists able to help academic staff make bestuse of the VLE and electronic resources in their teaching. The advent of the Open Source philosophynow applies to teaching materials, and institutions such as MIT and the UK’s Open University haveplaced much of their curriculum and teaching material on the web.30 This material can now be accessedby any one in Sri Lanka as a source of ideas or content when curricula are being revised. The DistanceEducation Modernization Project, funded by ADB, has begun the development of 7 new programs frompublic and private providers which, using the National Distance Education Network, will be availablethroughout Sri Lanka. These programs will be based on the most up to date on-line pedagogy drawingon the experience of the Commonwealth of Learning.
3.28 A key policy message from international experience is that any national investment in e-learningwould benefit from the establishment of an advisory service, charged with setting out guidelines for theeffective implementation of e-learning and providing advice to universities. Within institutions there willalso need to be some specialist staff able to work with academic colleagues on using the internet in away that draws on international materials and experience and provides students with a sound learningexperience.
3.29 With regard to improving learning and teaching methods, there are a number of further optionswhich warrant consideration, such as the following:
• A requirement that Faculties and University Senates should review curricula and teaching methodsat regular intervals, especially in the light of feedback from the quality assurance process.
• State funding for universities and ATIs specifically targeted at curriculum reform and developmentusing the most advanced teaching methods, as explained in the learning and teaching strategies.
37
29 In the UK 77 universities have compared notes on their benchmarking experiences in a three year program run by the HigherEducation Academy.
30 MIT’s Open Courseware at www.ocw.mit.edu makes available lecture notes, exams and other resources from more than1,800 courses. The Open University’s Open Learn www.openlearn.open.ac.uk contains over 5,000 hours of content andhas already been used by about 2 million people.
• HEIs could be encouraged to provide incoming students with short courses on study skills that willhelp them to benefit from new learning methods and opportunities.
• Establishment by the MHE of a national advisory service to help academic staff in HEIs mastere-learning, and draw on the large range of open source material becoming available.
ICT, Equipment and Library Resources3.30 IT literacy and competence is a necessary condition for a good quality graduate in the modernworld. The Government has emphasized the importance of IT for the country, and the importanceplaced by the Government on IT suggests that targets should be set for the use of computers by students,and an expectation that all graduates will leave university with a level of computer literacy adequateto satisfy the generic requirements in the labor market for graduates. Over time, student ownership ofPCs and laptops will increase, and the learning and teaching strategies of HEIs should take this factorinto account. Assumptions on this will influence policy decisions on whether capital expenditure shouldcentre on the provision of large-scale computer laboratories or on the infrastructure of wireless networks.The latter would encourage students to acquire their own laptops to access the university’s networks andlibrary resources.
3.31 Teaching in the developed world is making much greater use of electronic resources, and forscholarship and research access to global resources is now essential. This means not only that all staffshould be computer literate, but that libraries should have access to a wide range of international researchdatabases, e-journal collections (via aggregators31) and academic repositories of electronic teachingmaterials such as MERLOT32 or JORUM.33 The MHE, UGC and SLIATE will need to consider whether thereis room for national initiatives as regards electronic resources and the sharing of paper copies.
3.32 In view of the very complex copyright and licensing issues involved (e.g., electronic licenses andaccess agreements), there are strong arguments for having a technical team working with the Sri LankaLibrary Association and SLAIHEE at national level on behalf of the HEIs. One model for this is the JointInformation Services Committee (JISC) in the UK which is funded by the higher and further educationfunding bodies to provide technical support (such as a national academic network), advice and supportservices for all staff and students in higher and further education. One of the services it provides is tonegotiate special national discounts for electronic subscriptions with aggregators and publishers of journalsand databases. Pakistan provides a good example of rapid progress: the HEC has developed a DigitalLibrary with access to 20,000 full text electronic journals and 10,000 e-books within two years.34
3.33 The creation of a national scheme under which staff and students can access e-materials of allkinds must run in parallel with appropriate levels of investment in hard copies of books and journals,since it will be some time before the academic community – particularly older academics– will bewilling to forgo paper copies.
38
31 Aggregators are companies that collect journal or book titles from publishers and make electronic copies of them availableto institutions (or national consortia) for a subscription. Some aggregators are willing to consider discounts for developingcountries.
32 MERLOT is a US-Based collection of peer reviewed online learning materials, containing about 21,000 items. Seewww.merlot.org
33 JORUM is the UK’s national repository of electronic teaching materials and resources contributed on a voluntary basis byuniversity staff. It is available through www.jorum.ac.uk
34 As well as a lending library arrangement to borrow any of the British Library’s 150 million books and journals in its DocumentDelivery Service. See www.digitallibrary.edu.pk/
3.34 The U-HEMIS program that is being implemented under the World Bank funded IRQUE projectincludes a module to integrate each university library’s operational systems with the rest of the university’sadministrative processes. In parallel it is hoped that the computerization of each university library’scatalogue will soon be completed. These two achievements will open the way for much greater accessto hard copy resources by staff and students. They will make possible the development of a nationalinter-library loan scheme, based on access by one university (or one academic) to all other universities’library catalogues. Such a development should be possible over the medium-term.
3.35 In the context of promoting greater access to ICT, equipment and library resources there areseveral policy measures which are particularly important:
• The HEIs need to set goals and targets for student skills in ICT. • The MOE, UGC and SLIATE, in discussion with the MFP, need to set out a national strategy for
the provision of ICT infrastructure on campus.• The establishment of a national centre for electronic resources with the brief to negotiate and
acquire materials (databases, e-journals and e-books) for use by all academic staff and studentsof HEIs on a national academic network.
• The development of a national library catalogue linking all existing library catalogues, simplifyingthe development of a speedy system of Inter-Library Loans.
Quality Assurance and Enhancement Processes3.36 Several processes need to fall into place for quality to be assured, both within an institution andexternally. These include:
• An institutional strategy that promotes quality and quality enhancement, and has regular internalprocesses and procedures to achieve them.
• An internal process for undertaking program, departmental and subject reviews of quality atappropriate intervals.
• Support systems in the institution to advise academic staff on curriculum reform and providerelevant training and development in quality assurance and quality enhancement.
• An external quality review process that is based on nationally agreed criteria and subjectbenchmarks. This would undertake program, subject, departmental and institutional reviews atsuitable intervals, using trained external assessors.
• A mechanism for the national quality assurance (QA agency) to draw on international expertiseand experience so that it is abreast of current developments and thinking.
• An accreditation and licensing process that enables potential investors from overseas or from civilsociety in Sri Lanka to gain initial approval to establish an institution.
3.37 The World Bank funded IRQUE project has given Sri Lanka an excellent start in implementingalmost all of the above processes in universities. The work of the QAAC has given Sri Lanka aleadership role in the Asia Pacific region, as regards the scale and scope of its quality assuranceactivities at the national level in university first degree programs. The QA process now needs to bebroadened and deepened to cover external degree programs, postgraduate degrees, the alternativehigher education sector, and open and distance learning. The current status of each of the processeslisted above, for all sub-sectors, can be summarised as follows:
39
• The principal achievement of the QAAC is the successful establishment of a national QA functionfor public universities. This has achieved a great deal in four years, including developing Codesof Practice and a credit and qualifications framework, as well as undertaking 176 subject reviewsin institutions and 3 institutional reviews.
• The QAAC has networked very successfully in the Asia Pacific region and has also drawn heavilyon the work of the UK’s Quality Assurance Agency and the work of the International Network forQuality Assurance Agencies in Higher Education (INQAAHE). Should it become the basis for thefuture national QA agency, it is well-placed to build on its contacts and reputation so that it canbe at the forefront of international best practice.
• The next step is to increase the information base on the extent to which HEIs in the public orprivate sectors have developed learning and teaching strategies, the quality of these strategiesand their implementation experience. SLIATE has begun a development program to inculcatequality messages in the thinking of all ATI managers.
• More evidence is required on how universities are undertaking internal quality assurance.Although the QAAC has overseen the creation of internal QA Cells and helped to train their staff,it has no formal role in monitoring what they do. Little is known about the operation of QAprocesses in SLIATE institutes or private higher education institutions. The most visible QA is thatprovided by offshore academic partners when they work with private local institutions to delivertheir international awards. Since most of these institutions are accountable to their own nationalQA agency for the standards of programs delivered offshore, they are understandably concernedto have a role in reviewing the internal QA processes of their Sri Lankan partner.
• The principal internal support systems for QA and quality enhancement are those university cellsalready referred to; there is no evidence on the QA staffing and support in the other sectors.However, some private sector institutions have expressed interest in external quality audits.
3.38 The analysis shows that the quality assurance process has made an excellent start in the universityundergraduate sector. This process now needs to be expanded to cover the entire Sri Lankan highereducation system. This is a priority need to be addressed in the future.
Facilities and Infrastructure on Campus3.39 The space available for learning and teaching is a key determinant of quality. If the appropriateteaching space is not available, the quality of teaching and learning is likely to suffer. For instance,small group teaching is not possible in a 200 seat lecture hall. Therefore, any new space providedneeds to take modern teaching methods into account. In addition, funds will need to be made availableto modify existing teaching spaces. One problem that can be solved by internal management is that ofdepartments “owning” teaching space, which can lie empty when other departments elsewhere areshort of space in which to teach. To address this problem, each institution could be asked to confirmthat it has space policies which ensure that all teaching space is owned by the university and not byparticular units or departments. The same policy can be adopted for SLIATE ATIs.
3.40 Some of the physical facilities on campuses are in poor condition or are not suitable for modernuse, and a backlog of maintenance and repair has built up. The same concern would apply tolaboratory equipment needed for teaching and research. These shortcomings need to be remedied bythe injection of development funds to a long-term refurbishment and repair program. This would requirethe Government to set aside a specific fund for the purpose over a designated period of, say, 10 years.
40
Allied to the development funding there needs to be a maintenance culture which seeks to ensure thatadequate resources are set aside each year for a rolling preventive maintenance program.
3.41 One approach often used as the basis for allocating such a fund is to require each university andATI to undertake a condition survey of its buildings, using external professional surveyors. These surveyswould classify buildings depending on their condition. Those in the worst category would be the firstto receive funds from the national fund. The findings from all the surveyors’ reports would be costed andused to calculate what resources would be needed to remedy the shortcomings over a ten year rollingprogram, prior to discussions with the Ministry of Higher Education, UGC and the Ministry of Financeand Planning.
3.42 Care needs to be taken in ensuring that any new teaching accommodation on campus isconstructed so as to be flexible and linked to ICT wireless or wired networks with suitable connectionsfor student laptops, for future use.
3.43 When considering approaches to improving facilities and infrastructure on campus, the followinginitiatives would be particularly relevant:
• The MHE, UGC and SLIATE could undertake a condition survey of all the buildings in everyuniversity in order to set priorities for a phased program of renewal and repair. The cost of sucha program could be notified to the MFP in order to justify a bid for development funding.
• Space policies could be established that allow for flexible use and be applied to all newdevelopment bids for new buildings.
• Any new buildings, including hostels, should have full provision for ICT applications through theuse of wired or wireless networks.
Student Learning Assessments3.44 Student assessment is one of the cornerstones of quality in higher education. The main purposeof the assessment is the evaluation and certification of student learning outcomes, both knowledge andskills, in relation to learning objectives. Assessment is also linked to maintenance and enhancement ofacademic standards.
3.45 Most of the university disciplines in Sri Lanka have mechanisms in place to assess student learningoutcomes during each semester. These assessments are often a combination of continuous assignment,quizzes, mid-semester examinations and end-of-term examinations. The Credit and QualificationsFramework of the Degree Programs in Universities35 recommends that a minimum of 20 percent of thetotal grades be based on the continuous assessments for a given course, and that the maximum leveldepends on the type of course: for instance, more weight could be given to continuous assessments forcertain practical-oriented courses. The balance between continuous assessments and end-termexaminations varies greatly across faculties and disciplines. A range of assessments is used across thedisciplines, the most frequent being the pen-and-paper test.
3.46 The current practice of student assessments faces a number of major challenges. The foremostone is the lack of universal clear standards or benchmarks that specify the student learning outcomesfor all subjects/disciplines at each level. However, work on this has begun under the Quality Assuranceand Accreditation Council (QAAC) and the UGC is setting up a number of inter-university subject
41
35 QAAC, UGC/MHE ( 2007), The Credit and Qualifications Framework of the Degree Programs in Universities, November.
committees to develop subject benchmarks. Another major challenge is that assessment results arehardly used to provide feedback to students on how well they learn, and to academic staff on how wellthey teach.
3.47 In order to address these issues, one of the strategies recommended in the National PolicyFramework on Higher Education36 is the development of benchmarks for learning outcomes for everyprogram. What is also critical is capacity building for academic staff on assessment methodologies,as well as on how to use assessment results to improve learning and teaching. In addition, there shouldbe an entity in place at the university or faculty level, where appropriate, to ensure that adequatetraining is provided for academic staff on student learning assessment at graduate and postgraduatelevel, and that the assessments are properly conducted and used.
QUALITY IN EXTERNAL DEGREE PROGRAMS
Academic Standards3.48 Poor academic standards of external degree graduate output relative to corresponding internaldegree programs is a major criticism leveled against EDPs. As reported by a recent survey, the rate ofunemployment among EDP graduates is around 77 percent.37 This is to be expected given the absenceof support services provided by the universities. Although formally enrolled in certain public universities,these students are dependent either on self-study or external institutions for academic advice, knowledgeinputs, and skills development.
3.49 The issue of the poor quality of EDPs is critical, especially as there is strong pressure for thesegraduates to be absorbed in make-work programs by the State. It is of central importance that theGovernment addresses this issue, either by taking active steps to improve the quality of EDPs and makethese graduates more employable in the private sector, or by reducing the intake of EDPs, or, of course,by combining both these two options. A number of options to improve the quality and employability ofEDPs are given below.
3.50 The quality standards of services provided by external institutions for these students appear to bevery poor. For example, a recent survey of EDP completers revealed the poor quality of tutorialsprovided by such institutes as the main difficulty encountered by external graduates (44%).38 It alsoindicated that about 66 percent of students had not had tutorial classes. As shown in Table 3.2,lecturing is the widely used teaching mode (81%) as against practicals (12%) and group discussions(10%). The provision of reading lists and handouts is also not common. It appears that there is littleacademic advice and guidance at external institutions due to lack of group discussions and tutorials.The student counseling provided by external institutions is also limited to selection of subjects and lecturesessions. This is an extremely unsatisfactory position as external students have limited opportunity ofacquiring knowledge and soft skills.
42
36 National Education Commission (2008), National Policy Framework on Higher Education: University and Non UniversityTertiary Education, December.
37 DEMP (2006), Report on External Degree Programs.
38 DEMP (2006), op.cit.
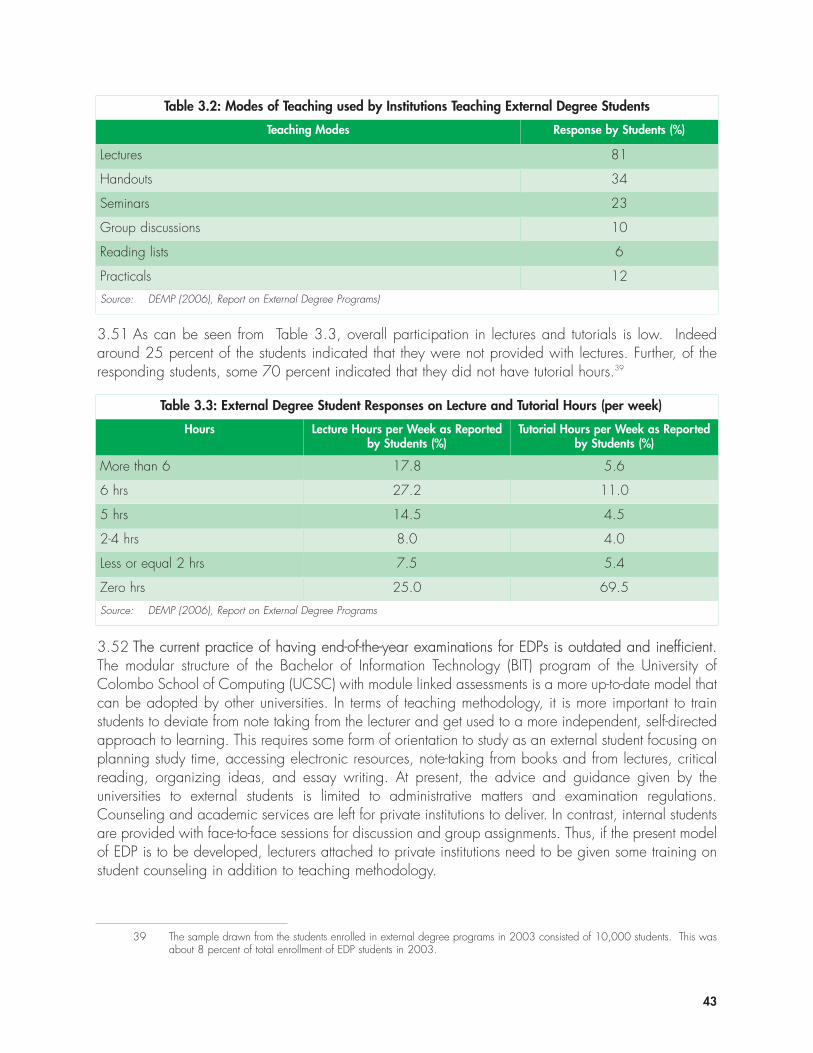
3.51 As can be seen from Table 3.3, overall participation in lectures and tutorials is low. Indeedaround 25 percent of the students indicated that they were not provided with lectures. Further, of theresponding students, some 70 percent indicated that they did not have tutorial hours.39
43
3.52 The current practice of having end-of-the-year examinations for EDPs is outdated and inefficient.The modular structure of the Bachelor of Information Technology (BIT) program of the University ofColombo School of Computing (UCSC) with module linked assessments is a more up-to-date model thatcan be adopted by other universities. In terms of teaching methodology, it is more important to trainstudents to deviate from note taking from the lecturer and get used to a more independent, self-directedapproach to learning. This requires some form of orientation to study as an external student focusing onplanning study time, accessing electronic resources, note-taking from books and from lectures, criticalreading, organizing ideas, and essay writing. At present, the advice and guidance given by theuniversities to external students is limited to administrative matters and examination regulations.Counseling and academic services are left for private institutions to deliver. In contrast, internal studentsare provided with face-to-face sessions for discussion and group assignments. Thus, if the present modelof EDP is to be developed, lecturers attached to private institutions need to be given some training onstudent counseling in addition to teaching methodology.
39 The sample drawn from the students enrolled in external degree programs in 2003 consisted of 10,000 students. This wasabout 8 percent of total enrollment of EDP students in 2003.
Table 3.2: Modes of Teaching used by Institutions Teaching External Degree Students
Teaching Modes Response by Students (%)
Lectures 81
Handouts 34
Seminars 23
Group discussions 10
Reading lists 6
Practicals 12
Source: DEMP (2006), Report on External Degree Programs)
Table 3.3: External Degree Student Responses on Lecture and Tutorial Hours (per week)
Hours Lecture Hours per Week as Reportedby Students (%)
Tutorial Hours per Week as Reportedby Students (%)
More than 6 17.8 5.6
6 hrs 27.2 11.0
5 hrs 14.5 4.5
2-4 hrs 8.0 4.0
Less or equal 2 hrs 7.5 5.4
Zero hrs 25.0 69.5
Source: DEMP (2006), Report on External Degree Programs
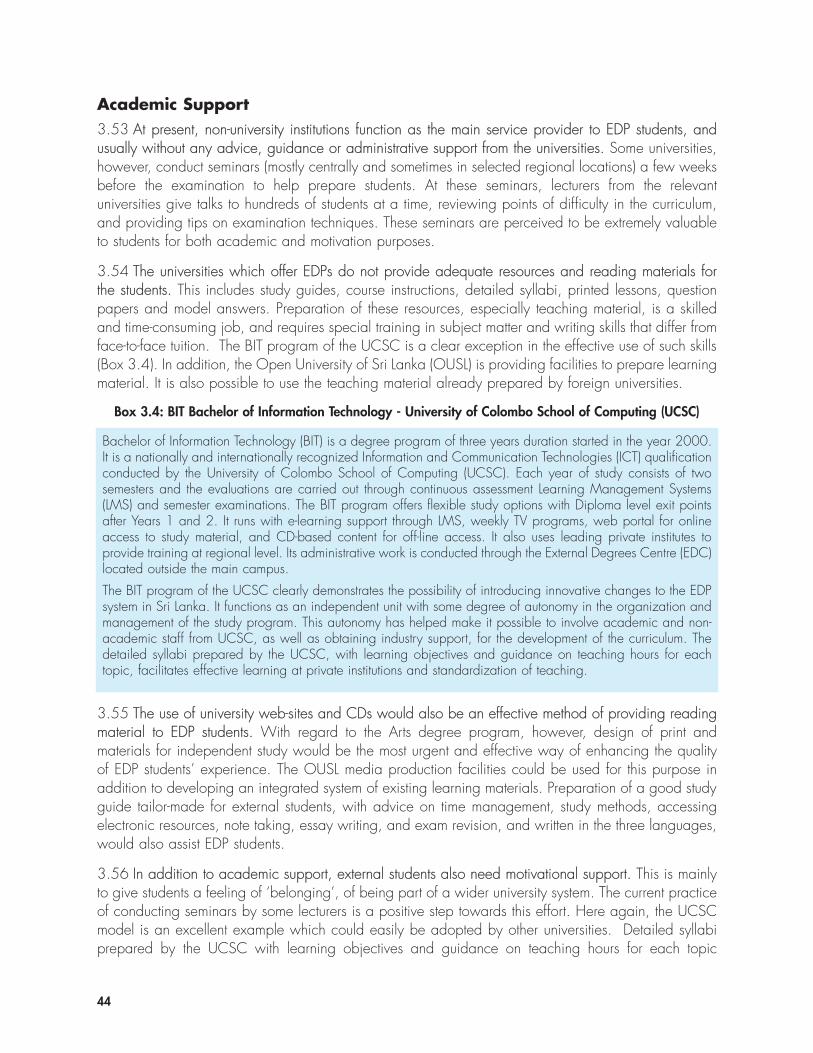
Academic Support3.53 At present, non-university institutions function as the main service provider to EDP students, andusually without any advice, guidance or administrative support from the universities. Some universities,however, conduct seminars (mostly centrally and sometimes in selected regional locations) a few weeksbefore the examination to help prepare students. At these seminars, lecturers from the relevantuniversities give talks to hundreds of students at a time, reviewing points of difficulty in the curriculum,and providing tips on examination techniques. These seminars are perceived to be extremely valuableto students for both academic and motivation purposes.
3.54 The universities which offer EDPs do not provide adequate resources and reading materials forthe students. This includes study guides, course instructions, detailed syllabi, printed lessons, questionpapers and model answers. Preparation of these resources, especially teaching material, is a skilledand time-consuming job, and requires special training in subject matter and writing skills that differ fromface-to-face tuition. The BIT program of the UCSC is a clear exception in the effective use of such skills(Box 3.4). In addition, the Open University of Sri Lanka (OUSL) is providing facilities to prepare learningmaterial. It is also possible to use the teaching material already prepared by foreign universities.
44
3.55 The use of university web-sites and CDs would also be an effective method of providing readingmaterial to EDP students. With regard to the Arts degree program, however, design of print andmaterials for independent study would be the most urgent and effective way of enhancing the qualityof EDP students’ experience. The OUSL media production facilities could be used for this purpose inaddition to developing an integrated system of existing learning materials. Preparation of a good studyguide tailor-made for external students, with advice on time management, study methods, accessingelectronic resources, note taking, essay writing, and exam revision, and written in the three languages,would also assist EDP students.
3.56 In addition to academic support, external students also need motivational support. This is mainlyto give students a feeling of ‘belonging’, of being part of a wider university system. The current practiceof conducting seminars by some lecturers is a positive step towards this effort. Here again, the UCSCmodel is an excellent example which could easily be adopted by other universities. Detailed syllabiprepared by the UCSC with learning objectives and guidance on teaching hours for each topic
Box 3.4: BIT Bachelor of Information Technology - University of Colombo School of Computing (UCSC)
Bachelor of Information Technology (BIT) is a degree program of three years duration started in the year 2000.It is a nationally and internationally recognized Information and Communication Technologies (ICT) qualificationconducted by the University of Colombo School of Computing (UCSC). Each year of study consists of twosemesters and the evaluations are carried out through continuous assessment Learning Management Systems(LMS) and semester examinations. The BIT program offers flexible study options with Diploma level exit pointsafter Years 1 and 2. It runs with e-learning support through LMS, weekly TV programs, web portal for onlineaccess to study material, and CD-based content for off-line access. It also uses leading private institutes toprovide training at regional level. Its administrative work is conducted through the External Degrees Centre (EDC)located outside the main campus.
The BIT program of the UCSC clearly demonstrates the possibility of introducing innovative changes to the EDPsystem in Sri Lanka. It functions as an independent unit with some degree of autonomy in the organization andmanagement of the study program. This autonomy has helped make it possible to involve academic and non-academic staff from UCSC, as well as obtaining industry support, for the development of the curriculum. Thedetailed syllabi prepared by the UCSC, with learning objectives and guidance on teaching hours for eachtopic, facilitates effective learning at private institutions and standardization of teaching.
facilitates effective learning at tutor level and standardization of the teaching given. It also publishes alist of private institutions and their pass rates so that students have enough information to select the bestprivate institution for their EDP. With regard to other subjects, their selection of private institutionsappears to be based mainly on students’ experience on private tuition, or word of mouth, oradvertisements in the media.
3.57 Similar to internal degree students, universities should have a primary responsibility ofstrengthening EDPs through various support services. This would involve providing learning material,academic advice and guidance, and conducting course related orientation sessions, training oflectures/tutors attached to private institutions, and providing guidance and information on choice ofprivate teaching institutes.
3.58 EDP programs do not fall within the present remit of the QAAC, and therefore are not subject toany official external quality review. It is important that they come within the ambit of the QAAC’s regularexternal institutional and subject reviews, possibly using some of the QA criteria developed for ODL.
QUALITY IN THE SLIATE INSTITUTES
The Occupational Relevance of the Alternative Higher Education SectorPrograms3.59 The continued occupational relevance of academic programs designed and delivered by thealternative sector institutions is fundamental to the employability of their graduates. An important successfactor in this type of education involves ensuring that new programs are created only after they haveprovided evidence, typically backed by documented market information, that their graduates are, andwill continue to be, needed by the labor market. The design of programs also needs to be scrutinizedcarefully by program advisory committees, based on criteria provided by academic experts andprevailing occupational standards established by relevant professional associations. The same rigorousprocess also needs to be applied to the renewal and /or upgrading of existing programs.Occupational relevance is also enhanced by the adoption of a work-based cooperative approach toprogram delivery, with alternate periods of study and work placements. This approach has beensuccessful in a number of OECD countries, including Canada, France, Ireland, the United Kingdom andthe United States.
3.60 All the SLIATE programs are relatively new and their identification and establishment has obviouslybeen done with an eye on the labor market and the potential employability of graduates. However,there is at present no formal process for including employer and professional organizations’representatives in Program Advisory Committees.
Options for Development3.61 SLIATE should institute Program Advisory Committees as a key requirement for all ATI programswith a mandate to: (a) support the institution in validating the continuing market information on changesin the labor market; (b) provide advice on the relevant knowledge, skills and competencies required ofthe graduates; and (c) provide input and advice to the regular process of program renewal.
45
The Institutional Culture: A Student-Centred Learning Environment3.62 Successful alternative higher education institutions have become leaders in developing flexible,adaptable, and responsive institutional cultures that reflect their stated mission and values, allowing themto adopt learning innovation, including student-centered teaching, co-teaching, and interdisciplinaryteaching, as well as novel uses of computers and distance learning, and the integration of internshipsand other forms of work-based learning.
3.63 At present the teachers in the SLIATE system tend to be young university graduates, most of whomhave only a first degree in their discipline, and the majority with no other relevant work experience.Furthermore, the majority have not received a formal orientation or training through a program in theprinciples of adult education and training. Although the programs of studies appear to be balancedand well- structured, the majority of courses use pedagogical methods which are teacher-centered,rather than student-centered, involving more than 32 hours per week of teacher-oriented classroomactivities.
The Way Forward: Options for Development3.64 The ability of SLIATE institutions to attract well-qualified, successful professionals to academic staffpositions, as well as to support the continued development of their knowledge, professionalcompetencies, and relevant skills, is essential for achieving their missions as educational institutions. Payscales, workloads, and institutional culture will determine SLIATE’s ability to attract and retain highly-qualified professionals. However, building institutional capacity to develop viable programs for thecontinuous upgrading of faculty skills and competencies in program and course development, teachingand evaluation, and academic counseling, are also key elements in ensuring success. Hence, SLIATEcould consider the establishment of an Academic Staff Leadership Institute (ASLI), with a mandate toprovide the following types of support to the academic staff of the ATIs:
• Learning innovations: The differences in outcomes observed among alternative institutions in othercountries can often be attributed to the mechanisms that they use to mobilize their institutionalresources, including training in effective teaching, availability of faculty development programs,sustained mentoring programs, and funds for experimenting with teaching methods andtechnology. These mechanisms could be developed by an ASLI and made available to SLIATE’spresent and future ATIs.
• Work-based learning methodologies: The design of effective programs in alternative institutionsoften involves some student work placements, as well as the participation of businessprofessionals in curriculum design and teaching, to ensure the integration of theory and practice.The proposed ASLI could undertake a study of the lessons learned from integrating successfulwork-based and application-oriented learning in the academic programs of similar institutions in,for instance, Europe, India and Singapore, and adapt the best practices for the SLIATE institutions.
3.65 There is no formal quality assurance structure for SLIATE institutions. At present quality assurancein the sector consists of simple checks on the integrity and delivery of the centrally-designed programs.Many countries in various regions of the world have some form of quality assurance for their alternativehigher education sector institutions and programs, which is provided either by an independent nationalor regional quality assurance body or, in many cases, a department of the ministry responsible forhigher education. In some countries, such oversight is generally provided by the same quality assurancesystems and agencies as those that oversee university programs.
46
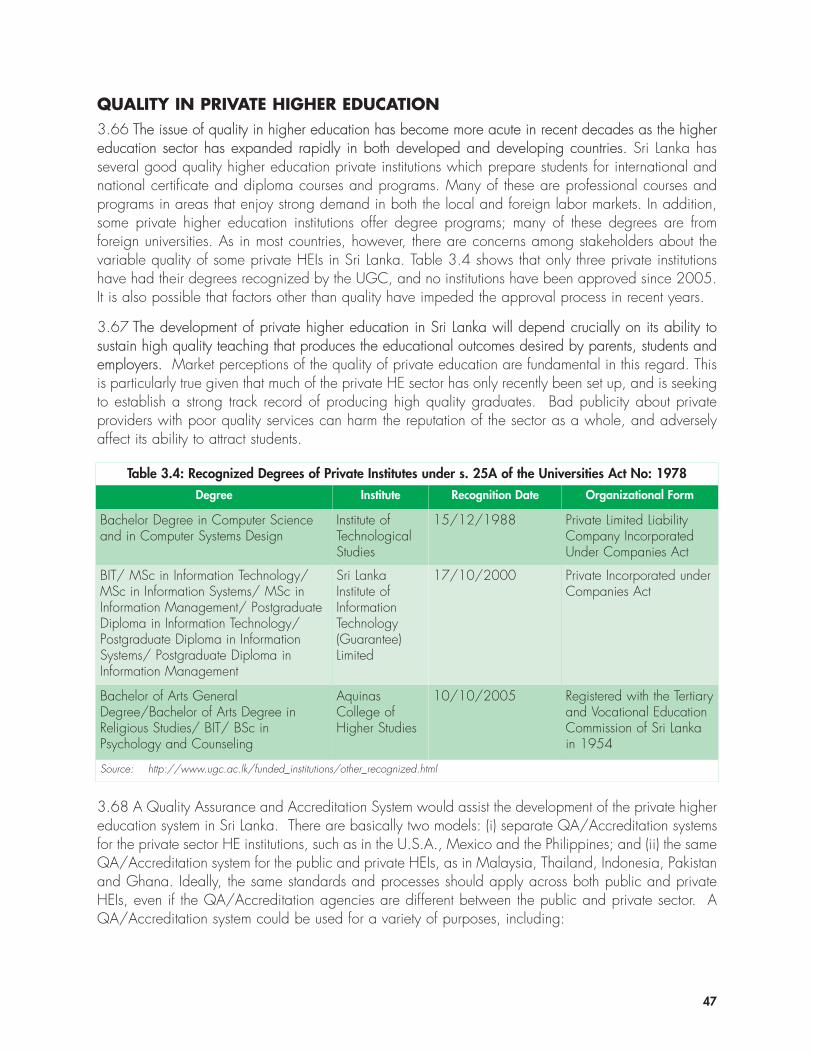
QUALITY IN PRIVATE HIGHER EDUCATION 3.66 The issue of quality in higher education has become more acute in recent decades as the highereducation sector has expanded rapidly in both developed and developing countries. Sri Lanka hasseveral good quality higher education private institutions which prepare students for international andnational certificate and diploma courses and programs. Many of these are professional courses andprograms in areas that enjoy strong demand in both the local and foreign labor markets. In addition,some private higher education institutions offer degree programs; many of these degrees are fromforeign universities. As in most countries, however, there are concerns among stakeholders about thevariable quality of some private HEIs in Sri Lanka. Table 3.4 shows that only three private institutionshave had their degrees recognized by the UGC, and no institutions have been approved since 2005.It is also possible that factors other than quality have impeded the approval process in recent years.
3.67 The development of private higher education in Sri Lanka will depend crucially on its ability tosustain high quality teaching that produces the educational outcomes desired by parents, students andemployers. Market perceptions of the quality of private education are fundamental in this regard. Thisis particularly true given that much of the private HE sector has only recently been set up, and is seekingto establish a strong track record of producing high quality graduates. Bad publicity about privateproviders with poor quality services can harm the reputation of the sector as a whole, and adverselyaffect its ability to attract students.
47
Table 3.4: Recognized Degrees of Private Institutes under s. 25A of the Universities Act No: 1978Degree Institute Recognition Date Organizational Form
Bachelor Degree in Computer Scienceand in Computer Systems Design
Institute ofTechnologicalStudies
15/12/1988 Private Limited LiabilityCompany IncorporatedUnder Companies Act
BIT/ MSc in Information Technology/MSc in Information Systems/ MSc inInformation Management/ PostgraduateDiploma in Information Technology/Postgraduate Diploma in InformationSystems/ Postgraduate Diploma inInformation Management
Sri LankaInstitute ofInformationTechnology(Guarantee)Limited
17/10/2000 Private Incorporated underCompanies Act
Bachelor of Arts GeneralDegree/Bachelor of Arts Degree inReligious Studies/ BIT/ BSc inPsychology and Counseling
AquinasCollege ofHigher Studies
10/10/2005 Registered with the Tertiaryand Vocational EducationCommission of Sri Lankain 1954
Source: http://www.ugc.ac.lk/funded_institutions/other_recognized.html
3.68 A Quality Assurance and Accreditation System would assist the development of the private highereducation system in Sri Lanka. There are basically two models: (i) separate QA/Accreditation systemsfor the private sector HE institutions, such as in the U.S.A., Mexico and the Philippines; and (ii) the sameQA/Accreditation system for the public and private HEIs, as in Malaysia, Thailand, Indonesia, Pakistanand Ghana. Ideally, the same standards and processes should apply across both public and privateHEIs, even if the QA/Accreditation agencies are different between the public and private sector. AQA/Accreditation system could be used for a variety of purposes, including:
• assessing the degree-awarding capacity of HEIs;• ranking HEIs;• approving the entry of foreign HEIs;• recognising degrees by third parties;• assessing credit-transfers to other accredited HEIs;• determining eligibility for direct or indirect Government funding/scholarships;• other rights such as entitlement to a reduced amount of regulation.
3.69 In Sri Lanka, one option would be for the existing QAAC external review mechanisms andprocesses to be applied to the private sector under the umbrella of a single independent agency.Another option would be for the association of private degree awarding institutions to manage a qualityassurance process itself, using the same standards and guidelines as the QAAC applies to publicinstitutions. Private universities would presumably pay for these reviews which would not be a burdenon the state. Of course, if the reports from both institutional and subject reviews were published, thepublic could have greater confidence in the quality of private sector provision.
3.70 An external quality review of private and international providers offers many benefits to students,governments, institutions and employers. It gives students and governments some assurance that thetuition being delivered is of a certain standard. It also provides employers with useful screeninginformation on the quality of degrees obtained by job-seekers. Finally, accreditation providesGovernments with a useful instrument upon which to base institutional registration, funding andregulatory decisions.
3.71 It is important that the QA/accreditation system for private HEIs be flexible enough to allow forthe parallel system of ‘private’ accreditation by which HEIs accept the right of foreign or domesticinstitutional partners or foreign accreditation agencies (such as the Quality Assurance Agency (UK) orthe Australian Universities Quality Agency) to assure their quality. Under such a system, private HEIscould either be accredited by the QAAC (or equivalent body) or could have their partner’s foreignaccreditation recognized by QAAC (or equivalent body). In other words, the domestic QA systemshould be introduced as a complement to, not as a replacement for, the existing system of institutionalaffiliations. Under such a system, the role of the QAAC would be to accredit accreditation agenciesand international partners, rather than accredit institutions. The concept of private accreditation isbeing, or has been, used in a number of jurisdictions internationally.
3.72 A system where private HEIs are affiliated to existing domestic or foreign institutions or accreditedby external agencies provides a relatively non-bureaucratic means of assuring quality. Under any ofthese ‘out-sourcing’ options, the role of the Sri Lankan QA agency would involve setting broadguidelines for accreditation of institutions and certifying that accreditation bodies (whether other tertiaryinstitutions or foreign agencies) were of a suitable standard. There are several advantages to thissystem. First, it places the responsibility for quality assurance with the institutions themselves rather thanwith a central accreditation body. Second, it would provide for more streamlined and possiblyspeedier recognition of institutions. Third, it would more easily accommodate the expansion of theprivate higher education sector in Sri Lanka. Fourth, the registration process and approval process forcurriculum changes would be under the institution’s control, and not subject to external delays.
48
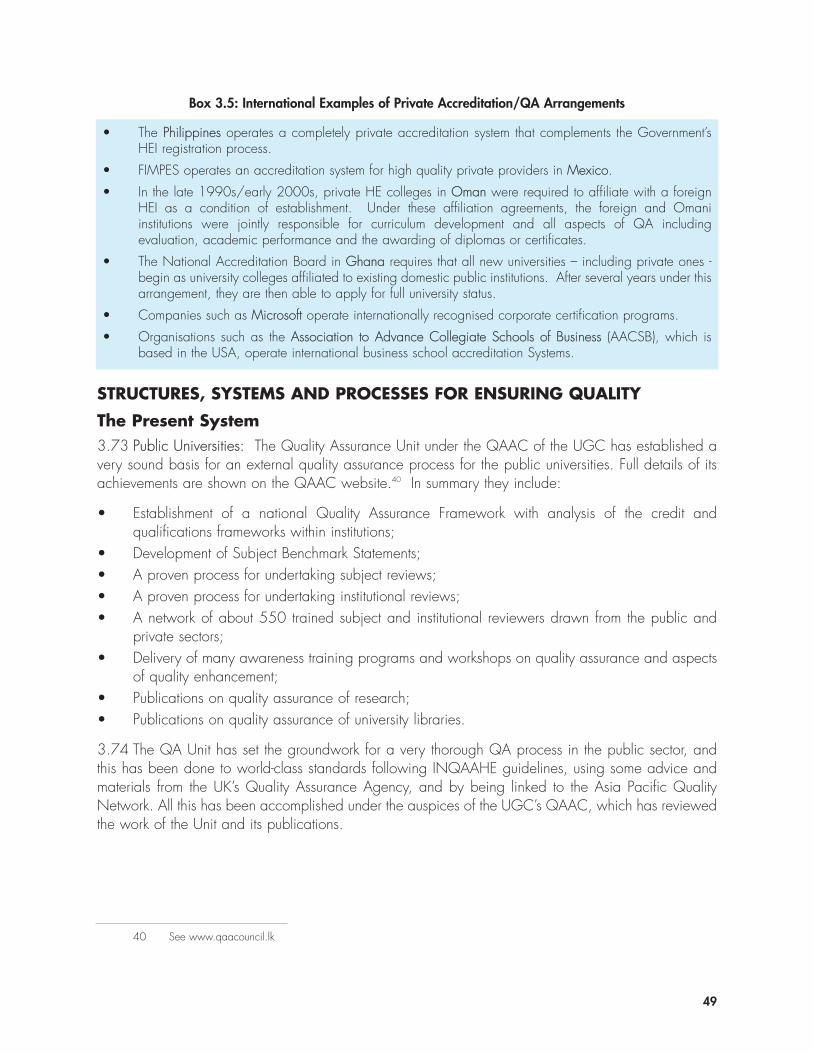
STRUCTURES, SYSTEMS AND PROCESSES FOR ENSURING QUALITY
The Present System3.73 Public Universities: The Quality Assurance Unit under the QAAC of the UGC has established avery sound basis for an external quality assurance process for the public universities. Full details of itsachievements are shown on the QAAC website.40 In summary they include:
• Establishment of a national Quality Assurance Framework with analysis of the credit andqualifications frameworks within institutions;
• Development of Subject Benchmark Statements;• A proven process for undertaking subject reviews;• A proven process for undertaking institutional reviews;• A network of about 550 trained subject and institutional reviewers drawn from the public and
private sectors;• Delivery of many awareness training programs and workshops on quality assurance and aspects
of quality enhancement;• Publications on quality assurance of research;• Publications on quality assurance of university libraries.
3.74 The QA Unit has set the groundwork for a very thorough QA process in the public sector, andthis has been done to world-class standards following INQAAHE guidelines, using some advice andmaterials from the UK’s Quality Assurance Agency, and by being linked to the Asia Pacific QualityNetwork. All this has been accomplished under the auspices of the UGC’s QAAC, which has reviewedthe work of the Unit and its publications.
49
Box 3.5: International Examples of Private Accreditation/QA Arrangements
• The Philippines operates a completely private accreditation system that complements the Government’sHEI registration process.
• FIMPES operates an accreditation system for high quality private providers in Mexico.
• In the late 1990s/early 2000s, private HE colleges in Oman were required to affiliate with a foreignHEI as a condition of establishment. Under these affiliation agreements, the foreign and Omaniinstitutions were jointly responsible for curriculum development and all aspects of QA includingevaluation, academic performance and the awarding of diplomas or certificates.
• The National Accreditation Board in Ghana requires that all new universities – including private ones -begin as university colleges affiliated to existing domestic public institutions. After several years under thisarrangement, they are then able to apply for full university status.
• Companies such as Microsoft operate internationally recognised corporate certification programs.
• Organisations such as the Association to Advance Collegiate Schools of Business (AACSB), which isbased in the USA, operate international business school accreditation Systems.
40 See www.qaacouncil.lk
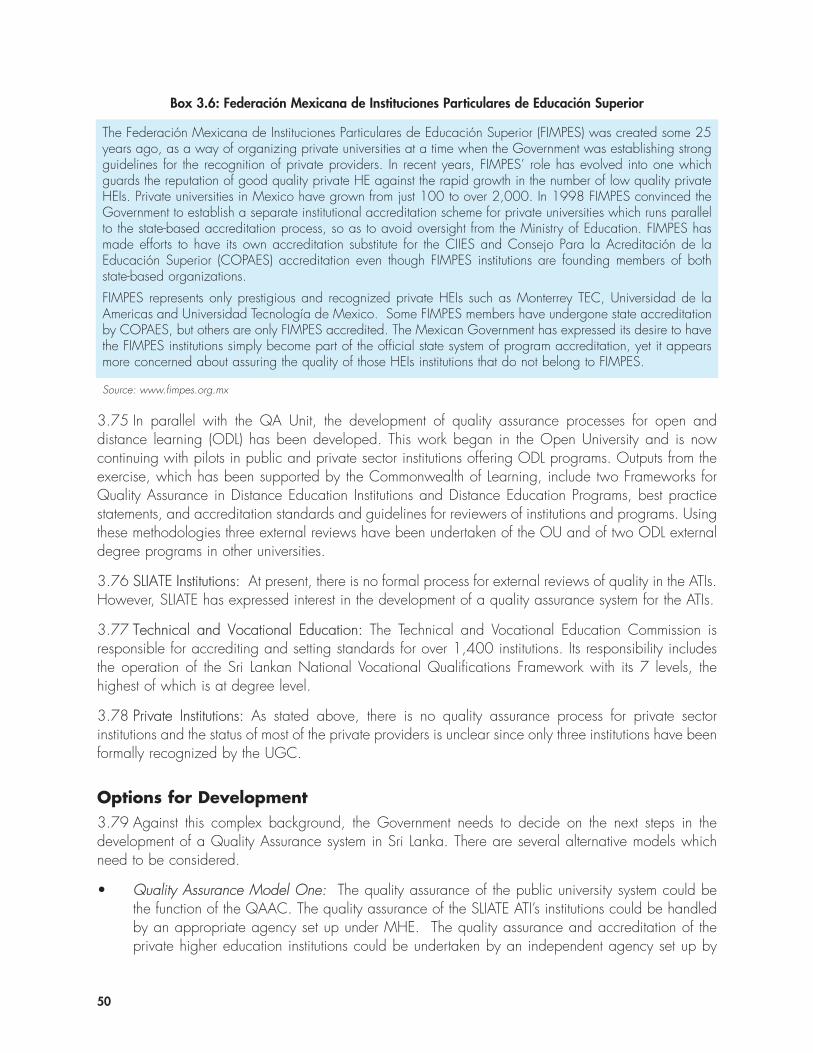
3.75 In parallel with the QA Unit, the development of quality assurance processes for open anddistance learning (ODL) has been developed. This work began in the Open University and is nowcontinuing with pilots in public and private sector institutions offering ODL programs. Outputs from theexercise, which has been supported by the Commonwealth of Learning, include two Frameworks forQuality Assurance in Distance Education Institutions and Distance Education Programs, best practicestatements, and accreditation standards and guidelines for reviewers of institutions and programs. Usingthese methodologies three external reviews have been undertaken of the OU and of two ODL externaldegree programs in other universities.
3.76 SLIATE Institutions: At present, there is no formal process for external reviews of quality in the ATIs.However, SLIATE has expressed interest in the development of a quality assurance system for the ATIs.
3.77 Technical and Vocational Education: The Technical and Vocational Education Commission isresponsible for accrediting and setting standards for over 1,400 institutions. Its responsibility includesthe operation of the Sri Lankan National Vocational Qualifications Framework with its 7 levels, thehighest of which is at degree level.
3.78 Private Institutions: As stated above, there is no quality assurance process for private sectorinstitutions and the status of most of the private providers is unclear since only three institutions have beenformally recognized by the UGC.
Options for Development3.79 Against this complex background, the Government needs to decide on the next steps in thedevelopment of a Quality Assurance system in Sri Lanka. There are several alternative models whichneed to be considered.
• Quality Assurance Model One: The quality assurance of the public university system could bethe function of the QAAC. The quality assurance of the SLIATE ATI’s institutions could be handledby an appropriate agency set up under MHE. The quality assurance and accreditation of theprivate higher education institutions could be undertaken by an independent agency set up by
50
Box 3.6: Federación Mexicana de Instituciones Particulares de Educación Superior
The Federación Mexicana de Instituciones Particulares de Educación Superior (FIMPES) was created some 25years ago, as a way of organizing private universities at a time when the Government was establishing strongguidelines for the recognition of private providers. In recent years, FIMPES’ role has evolved into one whichguards the reputation of good quality private HE against the rapid growth in the number of low quality privateHEIs. Private universities in Mexico have grown from just 100 to over 2,000. In 1998 FIMPES convinced theGovernment to establish a separate institutional accreditation scheme for private universities which runs parallelto the state-based accreditation process, so as to avoid oversight from the Ministry of Education. FIMPES hasmade efforts to have its own accreditation substitute for the CIIES and Consejo Para la Acreditación de laEducación Superior (COPAES) accreditation even though FIMPES institutions are founding members of bothstate-based organizations.
FIMPES represents only prestigious and recognized private HEIs such as Monterrey TEC, Universidad de laAmericas and Universidad Tecnología de Mexico. Some FIMPES members have undergone state accreditationby COPAES, but others are only FIMPES accredited. The Mexican Government has expressed its desire to havethe FIMPES institutions simply become part of the official state system of program accreditation, yet it appearsmore concerned about assuring the quality of those HEIs institutions that do not belong to FIMPES.
Source: www.fimpes.org.mx
these private institutions. This model would be similar to the system which exists in the U.S.A.,where quality assurance of higher education institutions is carried out by private, non-profitorganizations designed and established for this exact purpose. The Council for Higher EducationAccreditation (CHEA) constitutes the largest umbrella of accreditation agencies in the U.S.A., withabout 3,000 institutional members and 60 recognized institutional and programmatic accreditingorganizations. CHEA is governed by a board containing college and university presidents, aswell as institutional representatives and eminent members of the public.
• Quality Assurance Model Two: There could be one independent quality assurance andaccreditation agency responsible for the public universities, SLIATE ATIs and the private highereducation institutions. This quality assurance and accreditation agency could be under theMinistry of Higher Education. If so, this would make it similar to the Malaysian QualificationsAgency (MQA), which functions as a national government agency covering both public andprivate higher education providers.
• Quality Assurance Model Three: There could be one independent quality assurance andaccreditation agency responsible for the public universities, SLIATE ATIs and the private highereducation institutions. It would receive core operational funding from the Government. However,it would need to maintain a high degree of independence from the official Government highereducation system. This could be achieved by, for example, establishing it as a semi-autonomousinstitution of the MHE. Such a model would be similar to the Australian Universities QualityAgency (AUQA), which is owned by and benefits from core operational funding from theCommonwealth, State and Territory Ministries of Higher Education, but maintains strictindependence from the Government and higher education institutions.
• Quality Assurance Model Four: There can be one independent quality assurance andaccreditation agency responsible for the public universities, SLIATE ATIs and the private highereducation institutions. This agency would be an independent institution which is funded partlyfrom the Government and partly from subscriptions paid by private higher education institutions.This would be similar to the Quality Assurance Agency for Higher Education (QAA) in the U.K.The QAA is funded through the payments by the universities and colleges of higher education,and through contracts with the higher education funding bodies in England, Scotland, NorthernIreland and Wales.
51
Box 3.7: Some International Models of Quality Assurance
Some of the models that have emerged throughout the world for locating the QA Council in the Governmentstructure are as follows:
• An autonomous organization maintained by its member higher education institutions (such as the Councilfor Higher Education Accreditation in the U.S.A., which has 3,000 institutions as members andrecognizes 60 accrediting agencies).
• An autonomous organization with its own independent Act of Parliament or charter (QAA in UK, AUQAin Australia, ONESQA in Thailand).
• A sub-committee of an independent statutory Advisory Council to the Minister of Education with a role ofproviding advice to the Minister on quality in higher education (HEQC in South Africa).
• A QA division of the Ministry of Higher Education (Malaysia).
• An independent body established by the Committee of Vice-Chancellors or Directors (NZAAU in NewZealand).
3.80 There are also variations within these models. Box 3.7 illustrates experiences elsewhere in theworld. The dominant model is one which has an independent agency that is not under the direct controlof Government or a buffer body.
3.81 The actual choice of the model for Sri Lanka will depend on the preferences of policy makers,and the political and economic context of the country. Whichever model is chosen, it is important thatcommon standards and criteria, and similar processes, are applied by the QA agencies or agency forthe public and private higher education institutions. The present QAAC has already implemented asubstantial volume of work and achieved international standards. It is important to maintain and buildupon these achievements.
The Way Forward3.82 The preceding sections have discussed the quality of higher education over a broad set of areas,and in detail. This includes the quality of academic staff, facilities, equipment and technology,curriculum relevance, incentives and rewards for improving the quality of teaching in public highereducation institutions, and quality assurance for both public and private higher education institutions. Ateach point the recent, relevant international experience has been outlined. The next step is for the policymakers, academics and administrators to discuss the various options outlined, and select which optionswould be implemented, in what order, and the resources required for the implementation. Somedevelopment options are in the control of individual faculties and degree programs, and could beimplemented relatively swiftly. Other options require reforms at the level of institutions, such as theuniversities and SLIATE. These can be instituted relatively quickly, too, provided the relevant institutionalauthorities, such as the University Councils and Senates, agree. A third set of options need to beimplemented through national level policy initiatives and reforms. These would require more time.However, with the leadership of the Ministry of Higher Education, the UGC and SLIATE, there areseveral promising policy measures that can be implemented, and which are likely to have far-reachingpositive consequences for higher education quality.
52
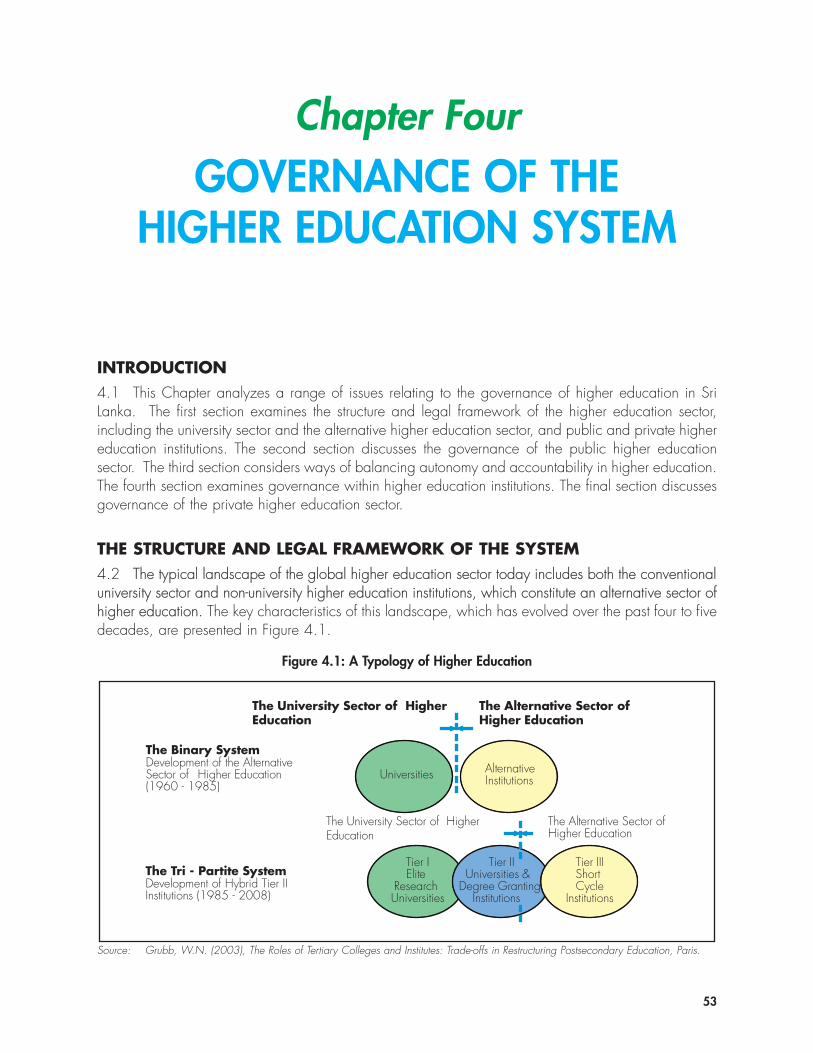
53
Chapter FourGOVERNANCE OF THE
HIGHER EDUCATION SYSTEM
INTRODUCTION4.1 This Chapter analyzes a range of issues relating to the governance of higher education in SriLanka. The first section examines the structure and legal framework of the higher education sector,including the university sector and the alternative higher education sector, and public and private highereducation institutions. The second section discusses the governance of the public higher educationsector. The third section considers ways of balancing autonomy and accountability in higher education.The fourth section examines governance within higher education institutions. The final section discussesgovernance of the private higher education sector.
THE STRUCTURE AND LEGAL FRAMEWORK OF THE SYSTEM 4.2 The typical landscape of the global higher education sector today includes both the conventionaluniversity sector and non-university higher education institutions, which constitute an alternative sector ofhigher education. The key characteristics of this landscape, which has evolved over the past four to fivedecades, are presented in Figure 4.1.
Figure 4.1: A Typology of Higher Education
Universities Alternative Institutions
The Binary SystemDevelopment of the Alternative Sector of Higher Education(1960 - 1985)
Tier IElite
Research Universities
Tier IIUniversities &
Degree GrantingInstitutions
Tier IIIShort Cycle
Institutions
The Tri - Partite SystemDevelopment of Hybrid Tier II Institutions (1985 - 2008)
The Alternative Sector of Higher Education
The University Sector of Higher Education
The University Sector of Higher Education
The Alternative Sector of Higher Education
Source: Grubb, W.N. (2003), The Roles of Tertiary Colleges and Institutes: Trade-offs in Restructuring Postsecondary Education, Paris.
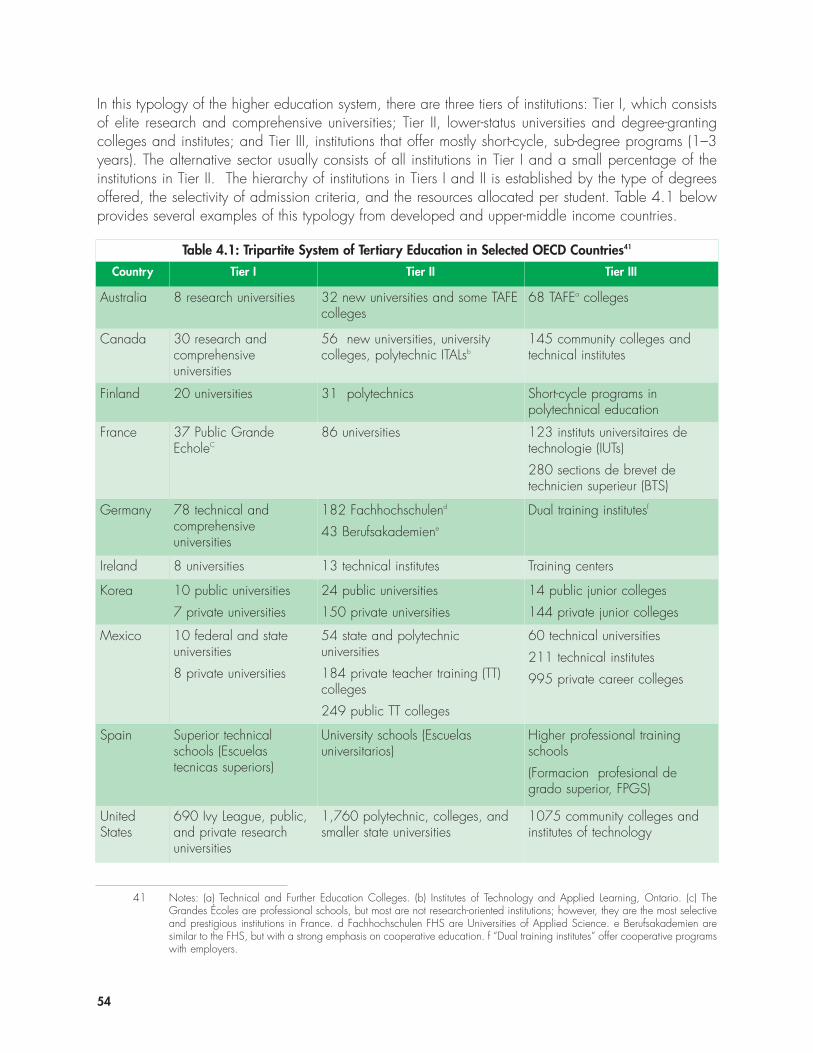
54
41 Notes: (a) Technical and Further Education Colleges. (b) Institutes of Technology and Applied Learning, Ontario. (c) TheGrandes Écoles are professional schools, but most are not research-oriented institutions; however, they are the most selectiveand prestigious institutions in France. d Fachhochschulen FHS are Universities of Applied Science. e Berufsakademien aresimilar to the FHS, but with a strong emphasis on cooperative education. f “Dual training institutes” offer cooperative programswith employers.
Table 4.1: Tripartite System of Tertiary Education in Selected OECD Countries41
Country Tier I Tier II Tier III
Australia 8 research universities 32 new universities and some TAFEcolleges
68 TAFEa colleges
Canada 30 research andcomprehensiveuniversities
56 new universities, universitycolleges, polytechnic ITALsb
145 community colleges andtechnical institutes
Finland 20 universities 31 polytechnics Short-cycle programs inpolytechnical education
France 37 Public GrandeEcholeC
86 universities 123 instituts universitaires detechnologie (IUTs)
280 sections de brevet detechnicien superieur (BTS)
Germany 78 technical andcomprehensiveuniversities
182 Fachhochschulend
43 Berufsakademiene
Dual training institutesf
Ireland 8 universities 13 technical institutes Training centers
Korea 10 public universities
7 private universities
24 public universities
150 private universities
14 public junior colleges
144 private junior colleges
Mexico 10 federal and stateuniversities
8 private universities
54 state and polytechnicuniversities
184 private teacher training (TT)colleges
249 public TT colleges
60 technical universities
211 technical institutes
995 private career colleges
Spain Superior technicalschools (Escuelastecnicas superiors)
University schools (Escuelasuniversitarios)
Higher professional trainingschools
(Formacion profesional degrado superior, FPGS)
UnitedStates
690 Ivy League, public,and private researchuniversities
1,760 polytechnic, colleges, andsmaller state universities
1075 community colleges andinstitutes of technology
In this typology of the higher education system, there are three tiers of institutions: Tier I, which consistsof elite research and comprehensive universities; Tier II, lower-status universities and degree-grantingcolleges and institutes; and Tier III, institutions that offer mostly short-cycle, sub-degree programs (1–3years). The alternative sector usually consists of all institutions in Tier I and a small percentage of theinstitutions in Tier II. The hierarchy of institutions in Tiers I and II is established by the type of degreesoffered, the selectivity of admission criteria, and the resources allocated per student. Table 4.1 belowprovides several examples of this typology from developed and upper-middle income countries.
55
4.3 The Sri Lankan higher education sector fits within the universal typology as it contains a widerange of institutions, such as the older established universities, the newer universities, the advancedtechnical institutes of the Sri Lanka Institute for Technological Education (SLIATE), private degreeawarding institutions, and private higher education institutions which award certificates and diplomas.Sri Lanka’s higher education system can be seen as transitioning from the binary type to the tri-partiteone. It could be useful for policy makers to classify these institutions into the three-tier system, forpurposes of policy development and resource allocation.
4.4 Higher education operational policy and strategy development in Sri Lanka are the responsibilityof the Ministry of Higher Education. Some of its operational tasks have been delegated to UGC, Publicuniversities are semi-autonomous entities with their own governing councils, but operate within theregulations, guidelines and procedures emerging from the UGC and MFP, especially for fundingpurposes.
4.5 Sri Lanka has the traditional Commonwealth model of a buffer body located between the MHEand the universities. The Sri Lankan UGC was established by the Universities Act, 1978, which definesits powers to include:
• To plan and co-ordinate university education “so as to conform to national policy”;• To apportion the funds voted by Parliament;• To maintain academic standards;• To regulate the administration of institutions;• To regulate the admission of students.
4.6 Public universities in Sri Lanka are legal entities established under various Acts which have beenconsolidated into the Universities Act 1978. They are funded by the Government, through the UGC’srecommendation, for both recurrent (operational) and development (capital) expenditure. There is nonormative funding system for public universities: instead, recurrent funding for individual universities isbased largely on historical levels, although there is some relationship between funding levels and thetypes of programs offered at different institutions. Universities offering courses such as engineering,medicine and science are funded at higher per-student levels than those offering arts and humanitiesprograms.
4.7 The Sri Lanka Institute of Advanced Technical Education (SLIATE) was formed under Act No. 29of 1995, as a statutory body under the purview of the MHE. SLIATE contains a set of AdvancedTechnical Institutes (ATIs). These are a potentially important part of the higher education sector, and areintended to respond to the rapidly evolving labor market requirements of the country. At present, theATIs offer courses in accounting, management, business studies, engineering, information technology,agriculture and English.
4.8 There are a number of private higher education institutions that prepare students for professionalqualifications, particularly in areas such as accounting, IT, management and marketing. In addition,there are private higher education institutions (HEIs) which seek to offer degree level programs andcourses. Degree-granting status can be obtained either by applying to the UGC under s.25 of theUniversities Act 1978 or by affiliating with foreign universities. The UGC avenue for approval is open,in principle, to both public and private HEIs. Thus far three private institutions have obtained recognitionfrom the UGC as degree-awarding institutions. The bulk of private degree-granting institutions in SriLanka have opted to link up with foreign universities.
56
4.9 Private HEIs do not receive either public recurrent or capital funding. Private HEIs offering coursesin a wide range of program areas may receive incentives such as tax holidays and remission of customsduties if they are established under Board of Investment of Sri Lanka (BoISL) regulations. At the end of2006 there were 42 education and skills BoISL-registered projects in commercial operation, with avalue of nearly 1.5 billion rupees. The major source countries for investment include the UK, Australia,India and Singapore.
GOVERNANCE OF THE PUBLIC HIGHER EDUCATION SECTOR
The Current Position4.10 Sri Lanka has recently produced several important policy documents that should influence thefuture direction of the higher education sector. The Mahinda Chintana 2006-201642 identifies fourmajor policies in relation to higher education:
• Increase access by enabling more choices in courses, modes of learning and alternate institutionswithin a regulatory framework, for all prospective students;
• Enhance quality and upgrade standards with emphasis on employability and social harmony andto cope with national developmental needs and global competitiveness;
• Foster a culture of scholarship and research; and• Ensure accountability, sound performance and financial sustainability.
44.11 The National Education Commission’s wide-ranging Higher Education Policy Framework200843 covers administration and management; and financing. Many of its policy-relatedrecommendations are in line with the options suggested in this report and they are referred to in therelevant sections below.
Global Developments in Higher Education Governance and Options forSri Lanka4.12 Higher education policy reform and development initiatives around the world raise the followingtypes of questions concerning planning and management of the sector:
• What is the role of the state, and who will have ultimate responsibility for developing, reviewingand fine-tuning the strategy?
• What performance indicators or targets should be developed to assess the success of the strategyin achieving its goals?
• What are the appropriate indicators and targets at the level of individual institutions, such asuniversities and ATIs, to adopt within their own strategic planning exercises?
• How does the private sector fit in to the national strategic planning and monitoring processes? • In what way can the MHE know about the private sector contribution to the national strategy?
4.13 One way for the state to know whether it is achieving its strategy is for it to develop a set ofperformance targets relating to the key goals in the strategy. Malaysia has undertaken a similar
42 Government of Sri Lanka (2007) Mahinda Chintana: Vision for a New Sri Lanka, Colombo
43 National Education Commission, National Policy Framework on Higher Education: University and Non-University TertiaryEducation, June 2008)
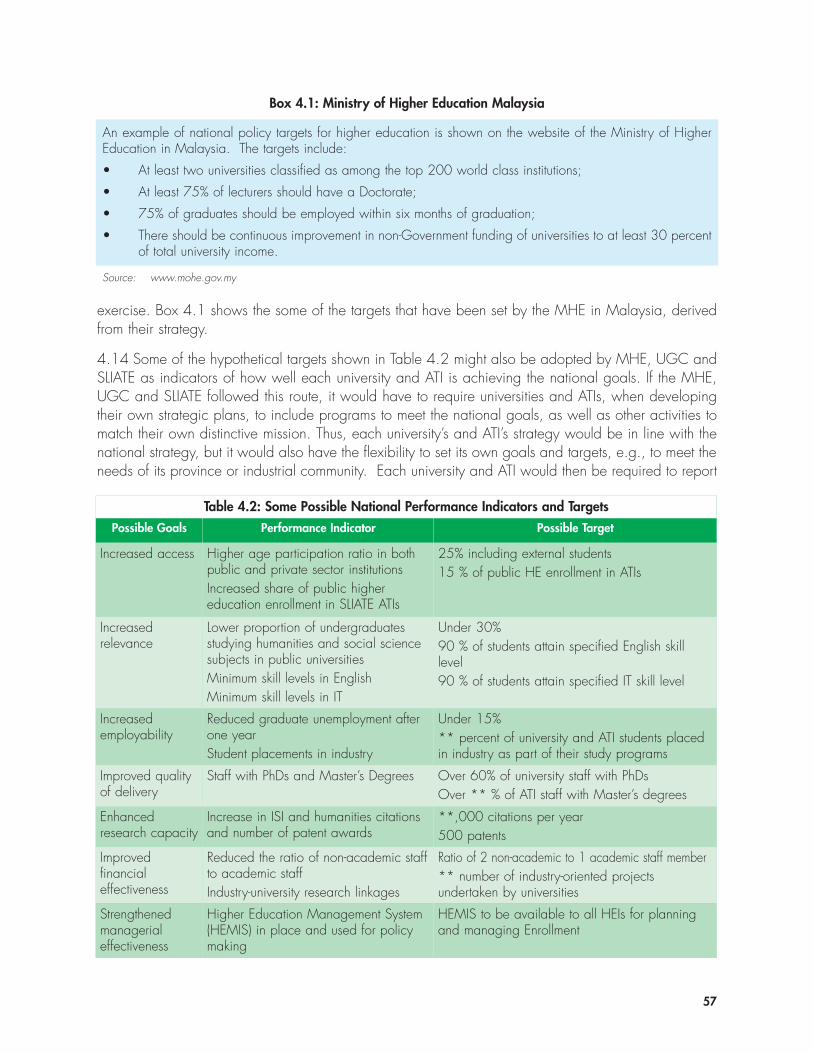
57
exercise. Box 4.1 shows the some of the targets that have been set by the MHE in Malaysia, derivedfrom their strategy.
4.14 Some of the hypothetical targets shown in Table 4.2 might also be adopted by MHE, UGC andSLIATE as indicators of how well each university and ATI is achieving the national goals. If the MHE,UGC and SLIATE followed this route, it would have to require universities and ATIs, when developingtheir own strategic plans, to include programs to meet the national goals, as well as other activities tomatch their own distinctive mission. Thus, each university’s and ATI’s strategy would be in line with thenational strategy, but it would also have the flexibility to set its own goals and targets, e.g., to meet theneeds of its province or industrial community. Each university and ATI would then be required to report
Box 4.1: Ministry of Higher Education Malaysia
An example of national policy targets for higher education is shown on the website of the Ministry of HigherEducation in Malaysia. The targets include:
• At least two universities classified as among the top 200 world class institutions;
• At least 75% of lecturers should have a Doctorate;
• 75% of graduates should be employed within six months of graduation;
• There should be continuous improvement in non-Government funding of universities to at least 30 percentof total university income.
Source: www.mohe.gov.my
Table 4.2: Some Possible National Performance Indicators and TargetsPossible Goals Performance Indicator Possible Target
Increased access Higher age participation ratio in bothpublic and private sector institutionsIncreased share of public highereducation enrollment in SLIATE ATIs
25% including external students15 % of public HE enrollment in ATIs
Increasedrelevance
Lower proportion of undergraduatesstudying humanities and social sciencesubjects in public universitiesMinimum skill levels in EnglishMinimum skill levels in IT
Under 30%90 % of students attain specified English skilllevel90 % of students attain specified IT skill level
Increasedemployability
Reduced graduate unemployment afterone yearStudent placements in industry
Under 15%** percent of university and ATI students placedin industry as part of their study programs
Improved qualityof delivery
Staff with PhDs and Master’s Degrees Over 60% of university staff with PhDsOver ** % of ATI staff with Master’s degrees
Enhancedresearch capacity
Increase in ISI and humanities citationsand number of patent awards
**,000 citations per year500 patents
Improvedfinancialeffectiveness
Reduced the ratio of non-academic staffto academic staff Industry-university research linkages
Ratio of 2 non-academic to 1 academic staff member** number of industry-oriented projectsundertaken by universities
Strengthenedmanagerialeffectiveness
Higher Education Management System(HEMIS) in place and used for policymaking
HEMIS to be available to all HEIs for planningand managing Enrollment
its performance scores or Key Performance Indicators (KPI) in respect of the national targets to the MHE,UGC and SLIATE, annually. Any KPIs that were developed for their own strategic goals would also bereported both to its own Council and the UGC.
4.15 In some cases it would be necessary to develop new systems for collecting the informationrequired for these high level indicators. The indicator on employability is one example: it is common insome countries for all students to be asked to provide information on their work status at a standarddata collection point of, say, six months after their graduation. Within universities and ATIs this couldbe collected by academic departments along with up-to-date addresses (to assist alumni activities). If anational system were adopted in Sri Lanka, all higher education institutions would be asked to analyzethe responses from students and send the summary information to the MHE, UGC and SLIATE,respectively. A high score in student employability could be seen by the MFP as a positive indicator forfuture resource allocation.
BALANCING AUTONOMY AND ACCOUNTABILITY
The University Sector4.16 The Universities Act, 1978 provides the UGC with powers to intervene directly in universityoperations. This power covers a large range of routine operational matters relating to decisions oncourses to be offered, the establishment of posts for academic staff, their appointment and promotionprocedures, and the appointment and location of administrative staff. In addition to the highereducation legislation and UGC’s regulations, the usual public sector financial regulations apply touniversities, as interpreted by the Treasury. These affect institutions’ ability to set salaries, retain incomegenerated, sell assets and reinvest the proceeds or raise capital through loans from banks. In recentyears there has been some relaxation of these regulations in respect of the ability to retain incomegenerated from programs where fees are charged and through consulting and research services. Suchrevenue can now be placed in a Development Fund within the university.
4.17 One of the standard dilemmas in higher education governance is getting the balance of controlright between a light touch that enables and supports institutions and a tight control that regulates andlimits them. By international standards the degree of detailed central control over universities in Sri Lankais at the tight end of the spectrum. This is at a time when the trend globally is towards governmentsgranting institutions greater autonomy.44 Discussions with university staff have identified several areaswhere central control is considered excessive, and where greater institutional autonomy in operationaldecision making could be helpful .Some of these topic areas are:
• The centralized administrative staff service, which enables administrative staff to be transferredwithin the university sector;
• UGC’s detailed control over all staff appointments below the level of Assistant Professor andRegistrar and Bursar;
• Financial regulations that prohibit the payment of salaries in excess of a certain level, even wherethe activity is self-financing and independent of government support.
58
44 See World Bank (2008). Global Trends in University Governance, Education Discussion Paper, No 7.
4.18 Other areas where there is central control include:
• UGC nominates a majority of the members of the University Council;• Nominees of the UGC have to be present at all interview boards for senior academic and
administrative posts;• UGC’s Standing Committees must approve all new course proposals (at undergraduate and
postgraduate levels) in their subject area;• MHE and UGC must approve the creation of new faculties and any changes in the academic
structure of departments or faculties;• MHE and UGC recommend the creation of all new posts, based on requests from universities,
after obtaining the relevant approvals from the MFP;• MHE and UGC sets out procedures for schemes of recruitment and appointment of staff which
universities have to follow;• Decisions on the admission of undergraduate students are taken by the UGC based on national
admissions policies;• The overseas travel plans of all academic staff have to be approved by the MHE and UGC.
4.19 Some of these areas of central control are linked to the funding structure of universities, as theseare financed by the central Government. For instance, the control over the establishment of faculties andthe creation of new staff positions by the Ministry of Finance and Planning, the MHE and the UGC isneeded, as these entail long-term financial commitments from the Government. Other controls, such asthe leave requirements for academic staff, are residual factors from the period of foreign exchangecontrol in Sri Lanka during the 1960’s and early 1970’s, and are anachronisms in the world of modernuniversities. Universities can be given autonomy to carry out some of the above functions, without anyinvolvement from a ministry or a buffer body, assuming that the MHE and the UGC wish to move in thedirection of greater empowerment of universities.
The Main Challenges4.20 The present practice is rooted partly in reliance on the legislation and in the belief, common tosome countries, such as India, Italy or Spain that the best approach to optimizing the outcomes from ahigher education system is to control it tightly. However, this has the following implications:
• Stifling entrepreneurialism and initiative in universities because of the need to obtain centralapproval;
• Delays while the central institutions makes a decision;• Unnecessary workload in the MHE and UGC caused by the number of operational decisions that
need to be taken. As the sector increases in size, the central workload of operating the controlsincreases pro rata;
• Central decision making tends to assume that a standard solution is best, while in practiceuniversities will have different missions and clienteles. Decentralized decision making wouldenable this to be taken into account;
• A risk of poor quality decisions due to unfamiliarity of some UGC officials with the universityculture, and their physical remoteness from the institutions;
• Frustration with the university system causes some individuals to use their personal authority or
59
political relationships to ignore the regulations and take unilateral decisions that run counter toofficial policy. While this may be effective in the short-term, it is not sound management.
4.21 At the same time, there are also some arguments in favor of central control:
• There will be greater consistency in the decisions taken;• The ability in some cases to achieve national rather than institutional benefit: for instance, this
argument is used to justify the power to allocate and relocate administrative staff throughout thesystem;
• It is easier to guarantee that financial probity and accountability have been achieved. Somefiduciary issues will always exist and a tight central control can claim to reduce it.
4.22 Universities accept the need for some controls and do not expect to have total freedom; they alsounderstand the need to be accountable by providing information to the MHE and UGC on theiroperations and performance. Once the extent of autonomy has been agreed, there are various waysthat the state can hold its institutions accountable on both policy and financial matters. If the stateaccepts the principle that it should no longer exercise detailed control, what are the options open to it?Workable approaches include:
• Exercising control through a high level approval of the university’s strategy and then monitoringperformance through the use of its key performance indicators;
• Agreeing through a contract with the institution that it should deliver certain outcomes in return forfunding;
• Creating a regime with light central regulation combined with reporting on outcomes andperformance. The state can also influence behavior by offering incentive funding, if institutionsadopt certain desired national policies.
4.23 There is a global trend to the devolution of powers to universities and the gradual withdrawal ofthe state from detailed monitoring and control. Sri Lanka will need to consider the balance betweencentral control and empowerment of individual universities as the higher education system develops inthe future. The National Education Commission recommends greater institutional autonomy in its policydeliberations. Global experience has shown that, once institutions feel that they can control their ownfutures, their performance is greatly improved since they have an incentive to make changes. If anychanges require long debates with a remote national body, the risk is that institutions might prefer tokeep quiet and do nothing. This is the situation in Italy, Spain and some German landers where thecentralization of decision making is thought to be one of the factors causing the poor performance ofuniversities from those countries in the global league tables.
4.24 Autonomy is often centered on an institution’s strategic plan and, once this is agreed, the councilof the university is granted the freedom necessary to implement and achieve its strategic objectives.Although Sri Lanka’s universities do prepare corporate plans, they appear to be lacking operationalrelevance, as they do not lead to dialogue with the MHE and UGC, and are often not implementeddue to technical and financial constraints.
4.25 Wherever the Government wishes to empower universities more, some or many of the existingregulations and controls listed above need to be removed. The MHE and UGC could delegate morepowers to universities in some or all of the following areas:
60
• Promotion of academic staff, which could be allowed within a set guideline of a maximum asenior/junior staff ratio to prevent too many senior appointments.
• Setting academic salary levels in shortage subjects (within authorised limits) such as in the U.S.A.Canada and South Africa;
• Development of new academic courses, where there is an identified market need;• Creation of new academic posts within an agreed overall budget which is standard practice in
many OECD countries such as Australia, Netherlands and the UK;• Deciding the academic structure of the university (number of faculties, the creation of schools or
institutes, etc), another function which is wholly within the remit of universities in countries such asthe U.S.A., Canada and Sweden;
• The level of payments made to temporary or contract staff on fee-earning and self-sufficientcourses.
4.26 These powers would be exercised by the Vice-Chancellor and colleagues under the supervisionof the University Council. The Council would need to ensure that decisions in these topic areas werebacked by adequate analysis provided by the administrative staff. The Council would also be heldaccountable for following any procedural guidelines (such as on promotions) set by the UGC and couldbe made liable to audits at any time.
4.27 It would be important to ensure that any existing public sector financial regulations did not standin the way of universities exercising autonomy in these areas. Hence, consultations with the MFP willbe necessary.
4.28 One implication of universities gaining greater managerial freedom is that their Councils and Vice-Chancellors will need to build adequate management capacity to manage their institutional affairs.Some classic private sector skills such as marketing, costing and pricing will be required and may notbe particularly strong at present, as the administrative staff are taken from the normal public sectorcadres. This weakness could be resolved by empowering university Councils to:
• Undertake a skills analysis of their management and administrative capacity so that they can haveconfidence in the technical support for decisions;
• Allocate a management development budget for all staff with managerial responsibilities.
4.29 Management capacity could be strengthened by the UGC funding a program of managementdevelopment for senior management staff, as recommended in the NEC’s Policy Framework.45
4.30 The resources for the Sri Lankan university system are mainly controlled from the center, withlimited financial autonomy to universities. Funds provided by the Ministry of Finance and Planning (MFP)through the Government budget need to proceed through a process of negotiation between the MFP,the MHE and UGC, and the universities. These funds can be used only for purposes designated byand agreed with the MFP, the MHE and UGC. Resources raised by universities directly, throughactivities such as the delivery of fee-levying courses, research, consultancy and interactions with industry,can be used for purposes approved by the universities themselves. However, the extent to which theuniversities exercise the financial autonomy available to them over resources generated by them variesfrom university to university. A very few universities make full use of this autonomy, while most universities
61
45 Some countries such as Malaysia, Australia and the United Kingdom have created national leadership academies fordelivering management development programs for senior staff.
make very limited use of these powers. Greater capacity building of the lagging universities wouldincrease the incentives for these universities to increase self-generated income and utilize theseadditional funds for the development of their institutions.
SLIATE4.32 Universities are much older, more established, and have a better resource base than theircounterparts in SLIATE. Universities remain the institutions of choice for the majority of secondary-schoolgraduates and their families in most countries. Public acceptance of alternative higher institutionsdepends, to a great extent, on the perception of their status and autonomy compared to that ofuniversities. In many countries, the demarcation between the two sectors is very clear: universities areautonomous and steered from a distance by government through various governance frameworks,whereas alternative colleges and institutions are governed directly and bureaucratically by a ministryresponsible for higher education. This is usually interpreted by the public, that the alternative institutionsare simply an extension of the secondary school system, where policies, curricula, and teachingmethods are dictated by bureaucratic directives.
4.33 SLIATE’s institutions and sections are presently governed by a SLIATE Council that defines the ATIs’mandate, admission policies program offerings, programs’ contents and course structure, academicstaff workload and other relevant academic management matters. The ATIs have clearly limitedautonomy compared to the universities. The MHE and SLIATE need to consider what powers andfunctions should be delegated to the individual ATIs, for the long-term development of the alternativehigher education sector in Sri Lanka. Once these powers and functions have been identified, suitablecapacity building programs can be instituted by the MHE and SLIATE.
GOVERNANCE WITHIN INSTITUTIONS4.34 Sri Lankan universities have adopted the classic British Commonwealth university governancestructures consisting of a University Council, a Senate (Academic Board) and Deans with responsibilityfor faculties. A Vice-Chancellor is given overall academic and financial management responsibility andis accountable to the University Council. A Registrar has responsibility for the administration. TheCouncil is the governing authority of the university and will vary in size depending on the number ofDeans. For example, at the University of Peredeniya it comprises 21 people and at Colombo it is 22.Such structures are set out in the Universities Act No. 16 of 1978 under which most universities werecreated.46
4.35 Sri Lanka, however, does differ in some ways from the model found in most Commonwealthcountries today:
• The President of Sri Lanka approves the appointment of the Vice-Chancellor from three candidatesput forward by the Council.
• There is a significant role for the UGC in the appointment of a majority of Council members andall senior academic staff.
• There are no senior university-wide posts such as Pro-Vice-Chancellor or Provost between the Vice-Chancellor and the Deans. This means that the full burden of integrating all aspects of policy andmanagement falls on the Vice-Chancellor. This has the effect of making a clear connection
62
46 However the University of Uva Wellassa was established in 2006 by an announcement in the Government Gazette.
between the personality and skills of the Vice-Chancellor and the success or otherwise of theuniversity. If a wider number of senior managers were involved, this connection would not be sostrong and the managerial burden could be shared.
• If the Vice-Chancellor and Senate wish to alter the academic structure of the university (such ascreating a new faculty or merging faculties) they cannot do so without the endorsement of theSenate, which then requires the approval of the UGC. This could have the effect of encouraginga standard approach to structure and not allowing an institution to organise itself to respond toits particular mix of strengths.
• Senates are very large bodies and include all professors (which can mean that they have over100 members). An international trend is to shrink them in size with faculties electing a fewprofessors to represent them.
4.36 Other features of the present structure are that under the Universities Act Deans are elected bytheir Faculty Board in a special meeting attended by the Vice-Chancellor and then the Senate andCouncil are informed. This means that academic or personal criteria may be uppermost in the election,whereas if a Vice-Chancellor were making the appointment the likelihood is that managementcompetence would be included as a factor in the appointment. A curious anomaly is that Heads ofDepartments are appointed by the Council upon the recommendation of the Vice-Chancellor, but s/heis denied that power for Deans, who usually have the more significant management task.
4.37 Some questions can be raised about the present system. If it is accepted that the general principleis to increase the autonomy of universities, what are the areas in which the powers of the universitiesshould be increased? For instance, academic staff proceeding overseas for conferences, seminars,sabbatical leave etc, could have their leave approved within the university. Universities could beempowered to recruit administrative and clerical staff directly to the university, rather than obtain themthrough a centralized service. Universities could also be empowered to set their own payment rates forstaff engaging in fee levying, self-sufficient courses such as extension programs.
4.38 There is a key issue of principle to be answered in designing a governance structure: if theuniversity Council and the Vice-Chancellor are to be held accountable for the performance of theuniversity, does the system of governance by the UGC and the Ministry provide the right amount ofincentive and freedom to achieve mutually agreed goals? Can one be sure that all of the regulations,controls and reporting systems are necessary and do not obstruct performance?
Options for Development4.39 Consistent with the earlier argument for greater autonomy, a preferred option could be thatuniversities are delegated the authority to devise organizational structures to suit their particular needsand priorities. A corollary to this enhanced autonomy would be a relaxation of residual financialcontrols that act as a break on institutional freedom to generate income through, for example, research,consulting services and short-courses. A culture change is needed in this area, since universities currentlyfeel that there are few incentives for generating income from external sources.
GOVERNANCE OF THE PRIVATE SECTOR4.40 The expansion and development of the private higher education sector, both non-profit institutionsand for-profit institutions, is one of the most striking features of the modern global higher education
63
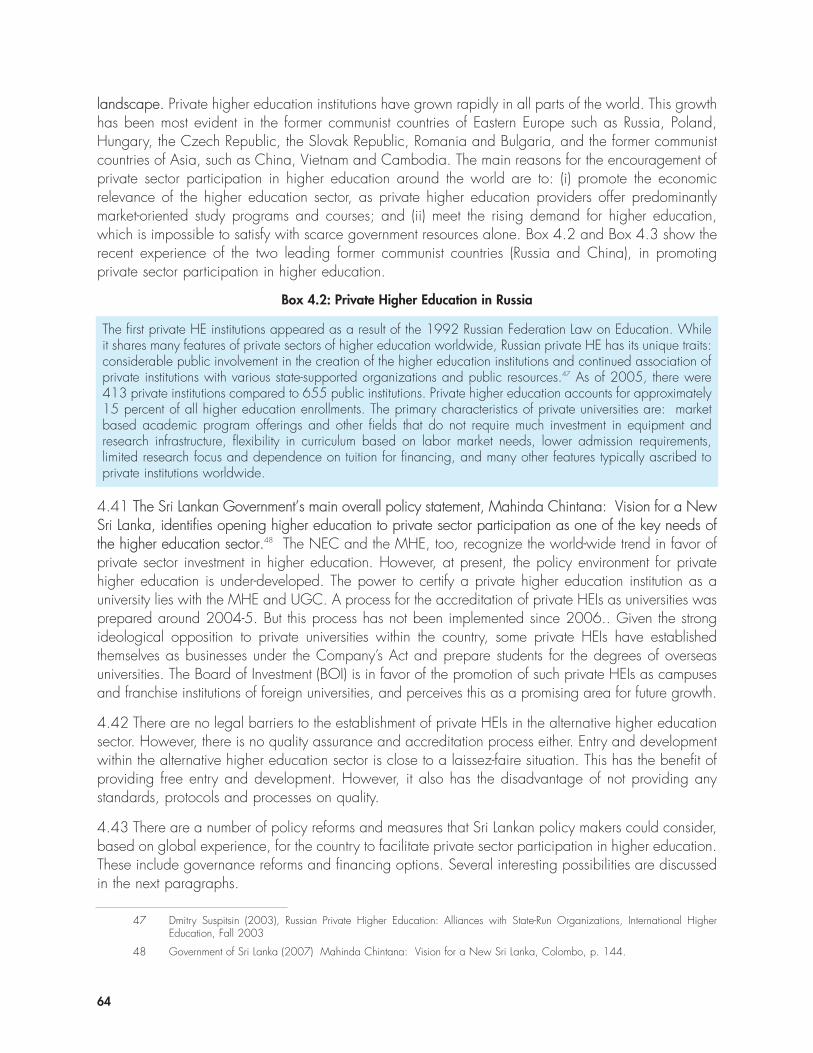
landscape. Private higher education institutions have grown rapidly in all parts of the world. This growthhas been most evident in the former communist countries of Eastern Europe such as Russia, Poland,Hungary, the Czech Republic, the Slovak Republic, Romania and Bulgaria, and the former communistcountries of Asia, such as China, Vietnam and Cambodia. The main reasons for the encouragement ofprivate sector participation in higher education around the world are to: (i) promote the economicrelevance of the higher education sector, as private higher education providers offer predominantlymarket-oriented study programs and courses; and (ii) meet the rising demand for higher education,which is impossible to satisfy with scarce government resources alone. Box 4.2 and Box 4.3 show therecent experience of the two leading former communist countries (Russia and China), in promotingprivate sector participation in higher education.
64
47 Dmitry Suspitsin (2003), Russian Private Higher Education: Alliances with State-Run Organizations, International HigherEducation, Fall 2003
48 Government of Sri Lanka (2007) Mahinda Chintana: Vision for a New Sri Lanka, Colombo, p. 144.
4.41 The Sri Lankan Government’s main overall policy statement, Mahinda Chintana: Vision for a NewSri Lanka, identifies opening higher education to private sector participation as one of the key needs ofthe higher education sector.48 The NEC and the MHE, too, recognize the world-wide trend in favor ofprivate sector investment in higher education. However, at present, the policy environment for privatehigher education is under-developed. The power to certify a private higher education institution as auniversity lies with the MHE and UGC. A process for the accreditation of private HEIs as universities wasprepared around 2004-5. But this process has not been implemented since 2006.. Given the strongideological opposition to private universities within the country, some private HEIs have establishedthemselves as businesses under the Company’s Act and prepare students for the degrees of overseasuniversities. The Board of Investment (BOI) is in favor of the promotion of such private HEIs as campusesand franchise institutions of foreign universities, and perceives this as a promising area for future growth.
4.42 There are no legal barriers to the establishment of private HEIs in the alternative higher educationsector. However, there is no quality assurance and accreditation process either. Entry and developmentwithin the alternative higher education sector is close to a laissez-faire situation. This has the benefit ofproviding free entry and development. However, it also has the disadvantage of not providing anystandards, protocols and processes on quality.
4.43 There are a number of policy reforms and measures that Sri Lankan policy makers could consider,based on global experience, for the country to facilitate private sector participation in higher education.These include governance reforms and financing options. Several interesting possibilities are discussedin the next paragraphs.
Box 4.2: Private Higher Education in Russia
The first private HE institutions appeared as a result of the 1992 Russian Federation Law on Education. Whileit shares many features of private sectors of higher education worldwide, Russian private HE has its unique traits:considerable public involvement in the creation of the higher education institutions and continued association ofprivate institutions with various state-supported organizations and public resources.47 As of 2005, there were413 private institutions compared to 655 public institutions. Private higher education accounts for approximately15 percent of all higher education enrollments. The primary characteristics of private universities are: marketbased academic program offerings and other fields that do not require much investment in equipment andresearch infrastructure, flexibility in curriculum based on labor market needs, lower admission requirements,limited research focus and dependence on tuition for financing, and many other features typically ascribed toprivate institutions worldwide.
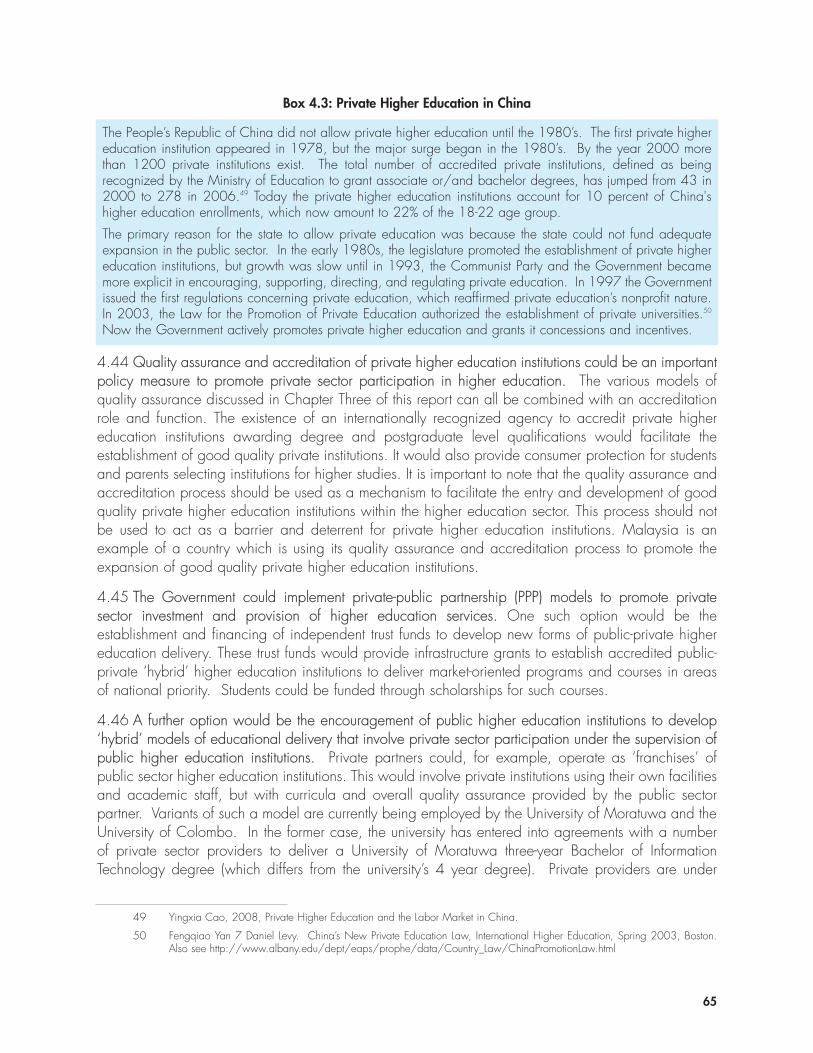
4.44 Quality assurance and accreditation of private higher education institutions could be an importantpolicy measure to promote private sector participation in higher education. The various models ofquality assurance discussed in Chapter Three of this report can all be combined with an accreditationrole and function. The existence of an internationally recognized agency to accredit private highereducation institutions awarding degree and postgraduate level qualifications would facilitate theestablishment of good quality private institutions. It would also provide consumer protection for studentsand parents selecting institutions for higher studies. It is important to note that the quality assurance andaccreditation process should be used as a mechanism to facilitate the entry and development of goodquality private higher education institutions within the higher education sector. This process should notbe used to act as a barrier and deterrent for private higher education institutions. Malaysia is anexample of a country which is using its quality assurance and accreditation process to promote theexpansion of good quality private higher education institutions.
4.45 The Government could implement private-public partnership (PPP) models to promote privatesector investment and provision of higher education services. One such option would be theestablishment and financing of independent trust funds to develop new forms of public-private highereducation delivery. These trust funds would provide infrastructure grants to establish accredited public-private ‘hybrid’ higher education institutions to deliver market-oriented programs and courses in areasof national priority. Students could be funded through scholarships for such courses.
4.46 A further option would be the encouragement of public higher education institutions to develop‘hybrid’ models of educational delivery that involve private sector participation under the supervision ofpublic higher education institutions. Private partners could, for example, operate as ‘franchises’ ofpublic sector higher education institutions. This would involve private institutions using their own facilitiesand academic staff, but with curricula and overall quality assurance provided by the public sectorpartner. Variants of such a model are currently being employed by the University of Moratuwa and theUniversity of Colombo. In the former case, the university has entered into agreements with a numberof private sector providers to deliver a University of Moratuwa three-year Bachelor of InformationTechnology degree (which differs from the university’s 4 year degree). Private providers are under
65
Box 4.3: Private Higher Education in China
The People’s Republic of China did not allow private higher education until the 1980’s. The first private highereducation institution appeared in 1978, but the major surge began in the 1980’s. By the year 2000 morethan 1200 private institutions exist. The total number of accredited private institutions, defined as beingrecognized by the Ministry of Education to grant associate or/and bachelor degrees, has jumped from 43 in2000 to 278 in 2006.49 Today the private higher education institutions account for 10 percent of China'shigher education enrollments, which now amount to 22% of the 18-22 age group.
The primary reason for the state to allow private education was because the state could not fund adequateexpansion in the public sector. In the early 1980s, the legislature promoted the establishment of private highereducation institutions, but growth was slow until in 1993, the Communist Party and the Government becamemore explicit in encouraging, supporting, directing, and regulating private education. In 1997 the Governmentissued the first regulations concerning private education, which reaffirmed private education’s nonprofit nature.In 2003, the Law for the Promotion of Private Education authorized the establishment of private universities.50
Now the Government actively promotes private higher education and grants it concessions and incentives.
49 Yingxia Cao, 2008, Private Higher Education and the Labor Market in China.
50 Fengqiao Yan 7 Daniel Levy. China’s New Private Education Law, International Higher Education, Spring 2003, Boston.Also see http://www.albany.edu/dept/eaps/prophe/data/Country_Law/ChinaPromotionLaw.html
independent management, but the University of Moratuwa provides quality oversight. In the latter case,the University of Colombo has established a fee-paying branch offering IT education (the University ofColombo School of Computing) and is currently developing an extended campus. This campus willoffer a range of programs on a cost recovery basis.
4.47 An additional option would be for the Government to introduce a program of merit and equity-based higher education scholarships, stipends or vouchers. These would be made available toqualifying students attending all types of higher education institutions in Sri Lanka, including publicuniversities, public-private ‘hybrid’ higher education institutions, and accredited private degree grantinghigher education institutions. The existence of merit and equity-based scholarship, stipend or voucherschemes is that they broaden access to higher education for bright students from less well-of homes.These scholarships could be allocated on the basis of a competitive and transparent applicationprocess. Funding for the scholarships, stipends or vouchers could be provided by the Government.Private corporations, firms and trusts, as well as individuals, could also contribute to the financing ofsuch a scheme.
4.48 This could involve funds as capital grants for activities such as the development of infrastructure,or cost-sharing of recurrent expenditure, such as a contribution to the salaries of academic staff.Government scholarships, stipends and vouchers that are eligible for use in private higher educationinstitutions would be another way of funding the private sector. The Government could also fundresearch activities in private higher education institutions. Many of the world’s leading universities, suchas Harvard, Stanford, Yale, MIT and Princeton, are private higher education institutions which receivelarge Government grants for research.
4.49 There are currently no formal mechanisms for the Government to consult private higher educationinstitutions on ongoing policy issues. The existence of a national association of private higher educationinstitutions would facilitate the establishment of such a consultation process. The MHE could establish aregular forum for discussion of policy and operational issues with such an association. Private highereducation institutions face many policy and sector issues in common with public higher educationinstitutions. The complexity of the issues facing the Sri Lankan higher education sector, and the potentialfor significant policy changes and development of the sector, makes it particularly important for the MHEto have effective mechanisms in place to promote consultation with the private sector.
The Way Forward4.50 The previous paragraphs have discussed higher education governance across a wide field. Thisincludes the governance at the national level, governance between and across higher educationinstitutions, and governance within higher education institutions. The governance of the university sector,and the alternative higher education sector, has both been discussed. And the analysis has covered thepublic and private higher education sectors. A number of policy options, and the relevant internationalexperience, have been identified. The next step is for the policy makers, academics and administratorsto discuss the various options which have been presented, and to choose the options to beimplemented. The options selected will need to be ordered, according to priority. The resourcesrequired to implement the priority options, including financial, technical and operational resources, willhave to be obtained. The benefits of implementing the alternative policy reforms discussed would beconsiderable, and long-lasting, for the Sri Lankan higher education system.
66
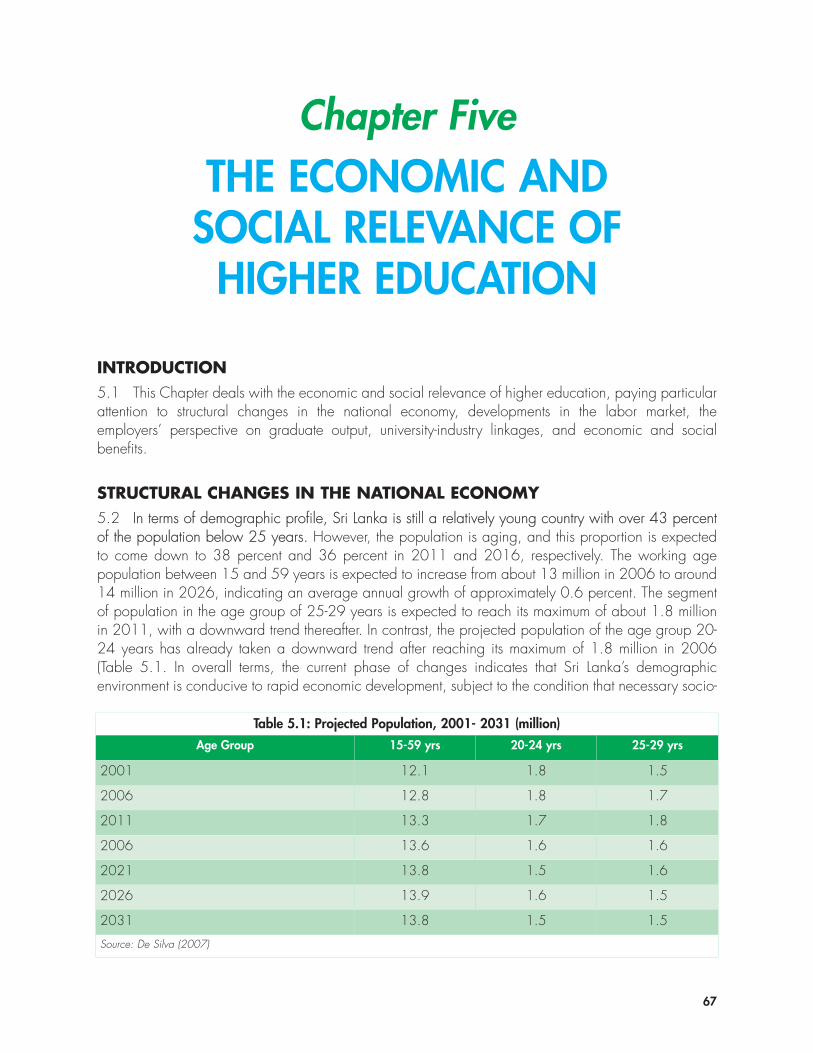
67
Chapter FiveTHE ECONOMIC AND
SOCIAL RELEVANCE OF HIGHER EDUCATION
INTRODUCTION5.1 This Chapter deals with the economic and social relevance of higher education, paying particularattention to structural changes in the national economy, developments in the labor market, theemployers’ perspective on graduate output, university-industry linkages, and economic and socialbenefits.
STRUCTURAL CHANGES IN THE NATIONAL ECONOMY5.2 In terms of demographic profile, Sri Lanka is still a relatively young country with over 43 percentof the population below 25 years. However, the population is aging, and this proportion is expectedto come down to 38 percent and 36 percent in 2011 and 2016, respectively. The working agepopulation between 15 and 59 years is expected to increase from about 13 million in 2006 to around14 million in 2026, indicating an average annual growth of approximately 0.6 percent. The segmentof population in the age group of 25-29 years is expected to reach its maximum of about 1.8 millionin 2011, with a downward trend thereafter. In contrast, the projected population of the age group 20-24 years has already taken a downward trend after reaching its maximum of 1.8 million in 2006(Table 5.1. In overall terms, the current phase of changes indicates that Sri Lanka’s demographicenvironment is conducive to rapid economic development, subject to the condition that necessary socio-
Table 5.1: Projected Population, 2001- 2031 (million)
Age Group 15-59 yrs 20-24 yrs 25-29 yrs
2001 12.1 1.8 1.5
2006 12.8 1.8 1.7
2011 13.3 1.7 1.8
2006 13.6 1.6 1.6
2021 13.8 1.5 1.6
2026 13.9 1.6 1.5
2031 13.8 1.5 1.5
Source: De Silva (2007)
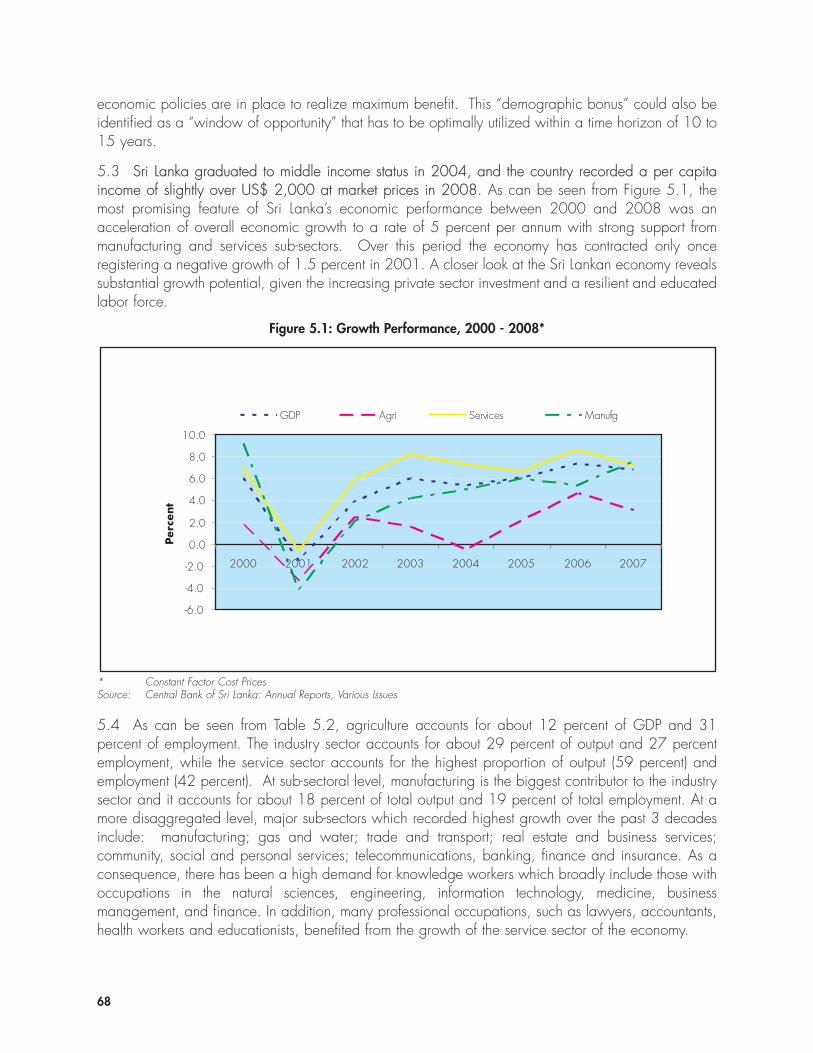
economic policies are in place to realize maximum benefit. This “demographic bonus” could also beidentified as a “window of opportunity” that has to be optimally utilized within a time horizon of 10 to15 years.
5.3 Sri Lanka graduated to middle income status in 2004, and the country recorded a per capitaincome of slightly over US$ 2,000 at market prices in 2008. As can be seen from Figure 5.1, themost promising feature of Sri Lanka’s economic performance between 2000 and 2008 was anacceleration of overall economic growth to a rate of 5 percent per annum with strong support frommanufacturing and services sub-sectors. Over this period the economy has contracted only onceregistering a negative growth of 1.5 percent in 2001. A closer look at the Sri Lankan economy revealssubstantial growth potential, given the increasing private sector investment and a resilient and educatedlabor force.
68
Figure 5.1: Growth Performance, 2000 - 2008*
-6.0
-4.0
-2.0
0.0
2.0
4.0
6.0
8.0
10.0
2000 2001 2002 2003 2004 2005 2006 2007
Per
cent
GDP Agri Services Manufg
* Constant Factor Cost PricesSource: Central Bank of Sri Lanka: Annual Reports, Various Issues
5.4 As can be seen from Table 5.2, agriculture accounts for about 12 percent of GDP and 31percent of employment. The industry sector accounts for about 29 percent of output and 27 percentemployment, while the service sector accounts for the highest proportion of output (59 percent) andemployment (42 percent). At sub-sectoral level, manufacturing is the biggest contributor to the industrysector and it accounts for about 18 percent of total output and 19 percent of total employment. At amore disaggregated level, major sub-sectors which recorded highest growth over the past 3 decadesinclude: manufacturing; gas and water; trade and transport; real estate and business services;community, social and personal services; telecommunications, banking, finance and insurance. As aconsequence, there has been a high demand for knowledge workers which broadly include those withoccupations in the natural sciences, engineering, information technology, medicine, businessmanagement, and finance. In addition, many professional occupations, such as lawyers, accountants,health workers and educationists, benefited from the growth of the service sector of the economy.
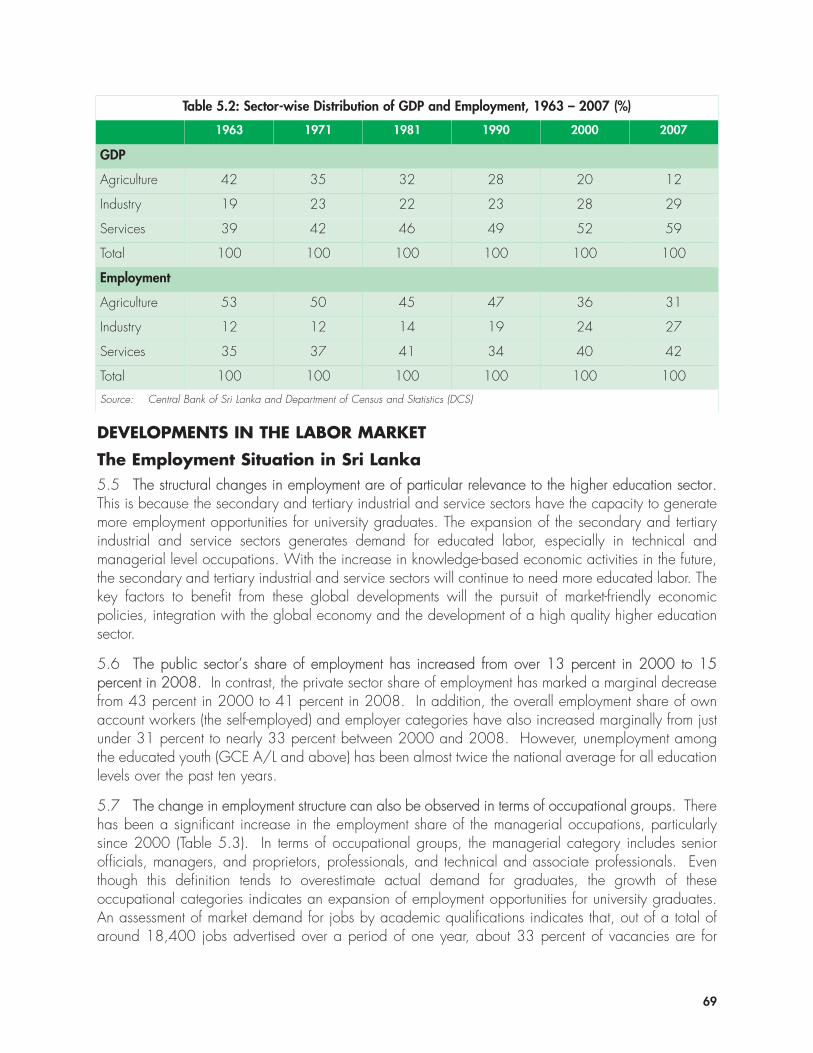
69
DEVELOPMENTS IN THE LABOR MARKET
The Employment Situation in Sri Lanka5.5 The structural changes in employment are of particular relevance to the higher education sector.This is because the secondary and tertiary industrial and service sectors have the capacity to generatemore employment opportunities for university graduates. The expansion of the secondary and tertiaryindustrial and service sectors generates demand for educated labor, especially in technical andmanagerial level occupations. With the increase in knowledge-based economic activities in the future,the secondary and tertiary industrial and service sectors will continue to need more educated labor. Thekey factors to benefit from these global developments will the pursuit of market-friendly economicpolicies, integration with the global economy and the development of a high quality higher educationsector.
5.6 The public sector’s share of employment has increased from over 13 percent in 2000 to 15percent in 2008. In contrast, the private sector share of employment has marked a marginal decreasefrom 43 percent in 2000 to 41 percent in 2008. In addition, the overall employment share of ownaccount workers (the self-employed) and employer categories have also increased marginally from justunder 31 percent to nearly 33 percent between 2000 and 2008. However, unemployment amongthe educated youth (GCE A/L and above) has been almost twice the national average for all educationlevels over the past ten years.
5.7 The change in employment structure can also be observed in terms of occupational groups. Therehas been a significant increase in the employment share of the managerial occupations, particularlysince 2000 (Table 5.3). In terms of occupational groups, the managerial category includes seniorofficials, managers, and proprietors, professionals, and technical and associate professionals. Eventhough this definition tends to overestimate actual demand for graduates, the growth of theseoccupational categories indicates an expansion of employment opportunities for university graduates.An assessment of market demand for jobs by academic qualifications indicates that, out of a total ofaround 18,400 jobs advertised over a period of one year, about 33 percent of vacancies are for
Table 5.2: Sector-wise Distribution of GDP and Employment, 1963 – 2007 (%)
1963 1971 1981 1990 2000 2007
GDP
Agriculture 42 35 32 28 20 12
Industry 19 23 22 23 28 29
Services 39 42 46 49 52 59
Total 100 100 100 100 100 100
Employment
Agriculture 53 50 45 47 36 31
Industry 12 12 14 19 24 27
Services 35 37 41 34 40 42
Total 100 100 100 100 100 100
Source: Central Bank of Sri Lanka and Department of Census and Statistics (DCS)
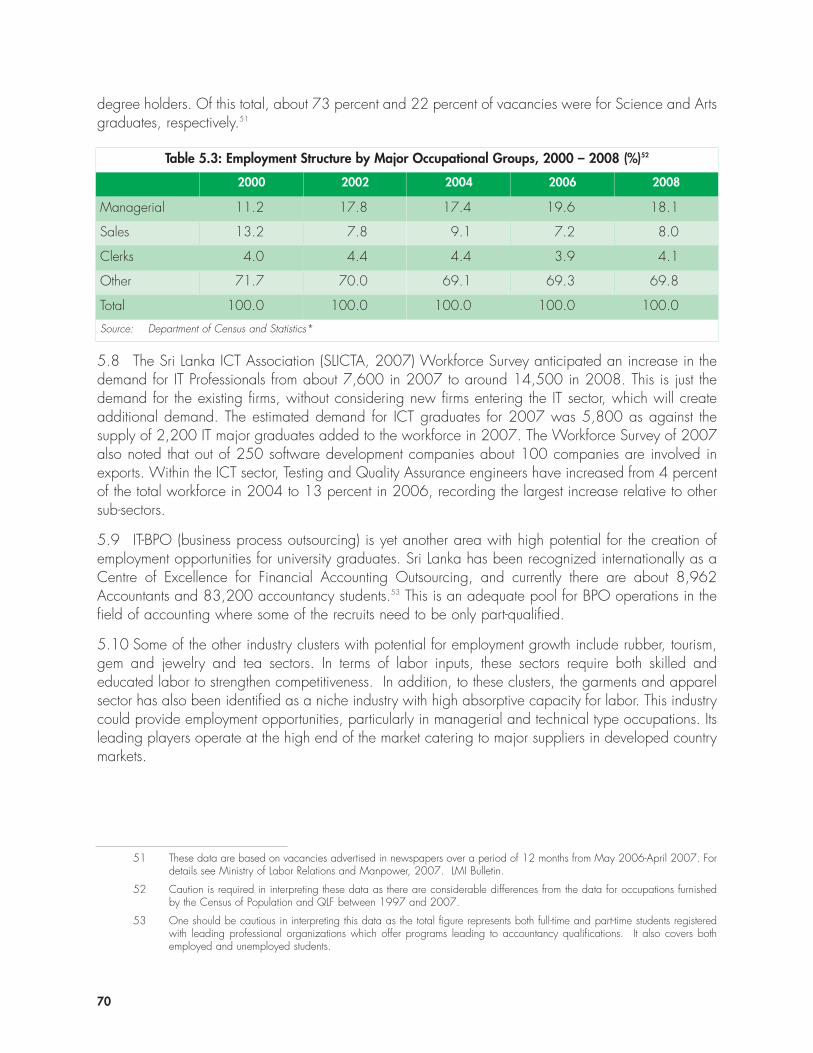
70
degree holders. Of this total, about 73 percent and 22 percent of vacancies were for Science and Artsgraduates, respectively.51
51 These data are based on vacancies advertised in newspapers over a period of 12 months from May 2006-April 2007. Fordetails see Ministry of Labor Relations and Manpower, 2007. LMI Bulletin.
52 Caution is required in interpreting these data as there are considerable differences from the data for occupations furnishedby the Census of Population and QLF between 1997 and 2007.
53 One should be cautious in interpreting this data as the total figure represents both full-time and part-time students registeredwith leading professional organizations which offer programs leading to accountancy qualifications. It also covers bothemployed and unemployed students.
Table 5.3: Employment Structure by Major Occupational Groups, 2000 – 2008 (%)52
2000 2002 2004 2006 2008
Managerial 11.2 17.8 17.4 19.6 18.1
Sales 13.2 7.8 9.1 7.2 8.0
Clerks 4.0 4.4 4.4 3.9 4.1
Other 71.7 70.0 69.1 69.3 69.8
Total 100.0 100.0 100.0 100.0 100.0
Source: Department of Census and Statistics*
5.8 The Sri Lanka ICT Association (SLICTA, 2007) Workforce Survey anticipated an increase in thedemand for IT Professionals from about 7,600 in 2007 to around 14,500 in 2008. This is just thedemand for the existing firms, without considering new firms entering the IT sector, which will createadditional demand. The estimated demand for ICT graduates for 2007 was 5,800 as against thesupply of 2,200 IT major graduates added to the workforce in 2007. The Workforce Survey of 2007also noted that out of 250 software development companies about 100 companies are involved inexports. Within the ICT sector, Testing and Quality Assurance engineers have increased from 4 percentof the total workforce in 2004 to 13 percent in 2006, recording the largest increase relative to othersub-sectors.
5.9 IT-BPO (business process outsourcing) is yet another area with high potential for the creation ofemployment opportunities for university graduates. Sri Lanka has been recognized internationally as aCentre of Excellence for Financial Accounting Outsourcing, and currently there are about 8,962Accountants and 83,200 accountancy students.53 This is an adequate pool for BPO operations in thefield of accounting where some of the recruits need to be only part-qualified.
5.10 Some of the other industry clusters with potential for employment growth include rubber, tourism,gem and jewelry and tea sectors. In terms of labor inputs, these sectors require both skilled andeducated labor to strengthen competitiveness. In addition, to these clusters, the garments and apparelsector has also been identified as a niche industry with high absorptive capacity for labor. This industrycould provide employment opportunities, particularly in managerial and technical type occupations. Itsleading players operate at the high end of the market catering to major suppliers in developed countrymarkets.
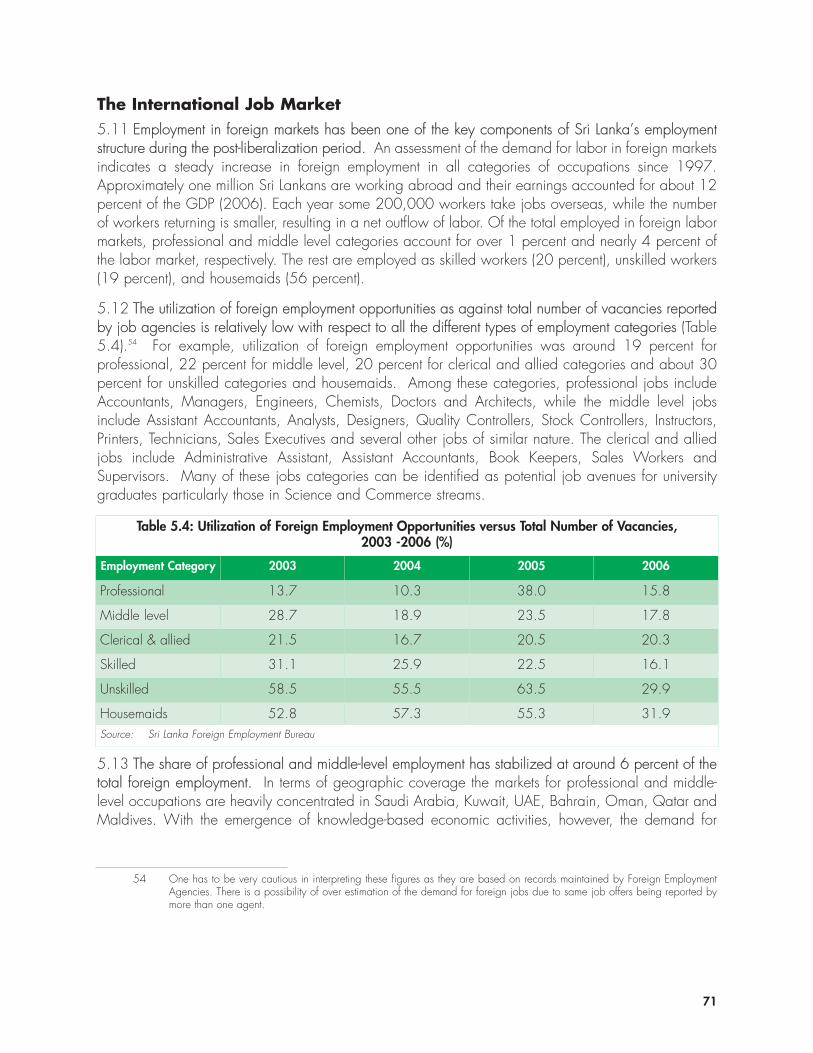
The International Job Market5.11 Employment in foreign markets has been one of the key components of Sri Lanka’s employmentstructure during the post-liberalization period. An assessment of the demand for labor in foreign marketsindicates a steady increase in foreign employment in all categories of occupations since 1997.Approximately one million Sri Lankans are working abroad and their earnings accounted for about 12percent of the GDP (2006). Each year some 200,000 workers take jobs overseas, while the numberof workers returning is smaller, resulting in a net outflow of labor. Of the total employed in foreign labormarkets, professional and middle level categories account for over 1 percent and nearly 4 percent ofthe labor market, respectively. The rest are employed as skilled workers (20 percent), unskilled workers(19 percent), and housemaids (56 percent).
5.12 The utilization of foreign employment opportunities as against total number of vacancies reportedby job agencies is relatively low with respect to all the different types of employment categories (Table5.4).54 For example, utilization of foreign employment opportunities was around 19 percent forprofessional, 22 percent for middle level, 20 percent for clerical and allied categories and about 30percent for unskilled categories and housemaids. Among these categories, professional jobs includeAccountants, Managers, Engineers, Chemists, Doctors and Architects, while the middle level jobsinclude Assistant Accountants, Analysts, Designers, Quality Controllers, Stock Controllers, Instructors,Printers, Technicians, Sales Executives and several other jobs of similar nature. The clerical and alliedjobs include Administrative Assistant, Assistant Accountants, Book Keepers, Sales Workers andSupervisors. Many of these jobs categories can be identified as potential job avenues for universitygraduates particularly those in Science and Commerce streams.
71
5.13 The share of professional and middle-level employment has stabilized at around 6 percent of thetotal foreign employment. In terms of geographic coverage the markets for professional and middle-level occupations are heavily concentrated in Saudi Arabia, Kuwait, UAE, Bahrain, Oman, Qatar andMaldives. With the emergence of knowledge-based economic activities, however, the demand for
54 One has to be very cautious in interpreting these figures as they are based on records maintained by Foreign EmploymentAgencies. There is a possibility of over estimation of the demand for foreign jobs due to same job offers being reported bymore than one agent.
Table 5.4: Utilization of Foreign Employment Opportunities versus Total Number of Vacancies, 2003 -2006 (%)
Employment Category 2003 2004 2005 2006
Professional 13.7 10.3 38.0 15.8
Middle level 28.7 18.9 23.5 17.8
Clerical & allied 21.5 16.7 20.5 20.3
Skilled 31.1 25.9 22.5 16.1
Unskilled 58.5 55.5 63.5 29.9
Housemaids 52.8 57.3 55.3 31.9Source: Sri Lanka Foreign Employment Bureau
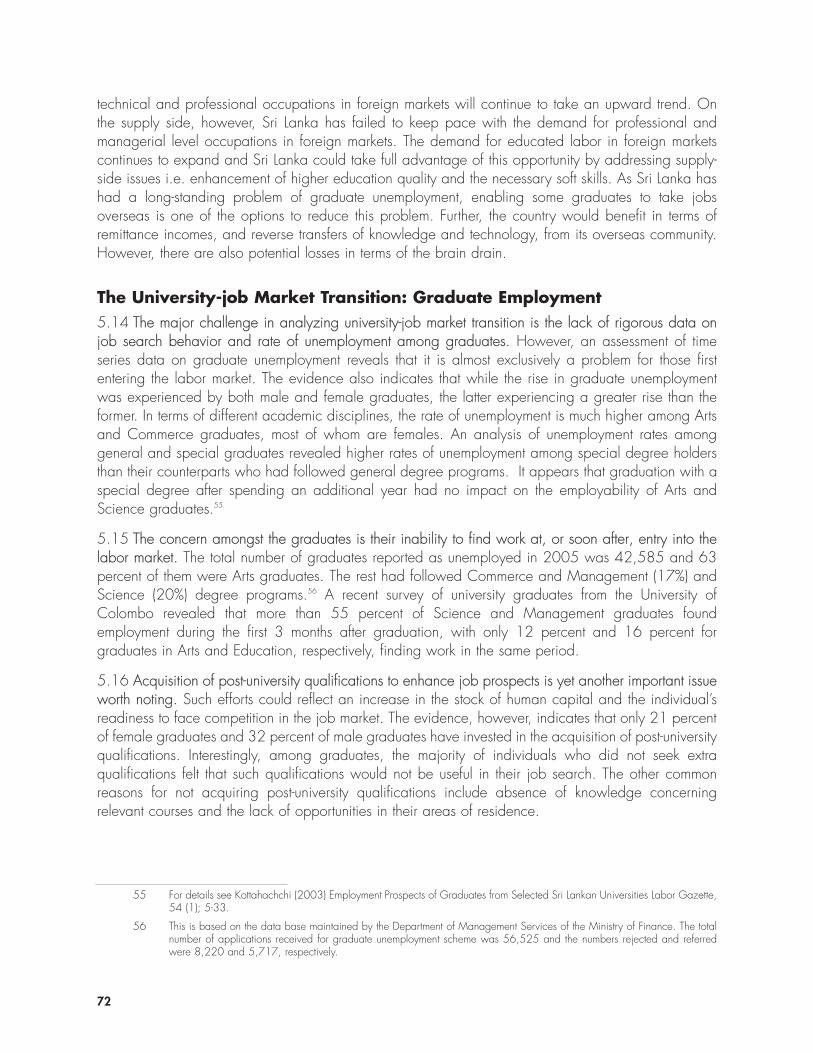
technical and professional occupations in foreign markets will continue to take an upward trend. Onthe supply side, however, Sri Lanka has failed to keep pace with the demand for professional andmanagerial level occupations in foreign markets. The demand for educated labor in foreign marketscontinues to expand and Sri Lanka could take full advantage of this opportunity by addressing supply-side issues i.e. enhancement of higher education quality and the necessary soft skills. As Sri Lanka hashad a long-standing problem of graduate unemployment, enabling some graduates to take jobsoverseas is one of the options to reduce this problem. Further, the country would benefit in terms ofremittance incomes, and reverse transfers of knowledge and technology, from its overseas community.However, there are also potential losses in terms of the brain drain.
The University-job Market Transition: Graduate Employment5.14 The major challenge in analyzing university-job market transition is the lack of rigorous data onjob search behavior and rate of unemployment among graduates. However, an assessment of timeseries data on graduate unemployment reveals that it is almost exclusively a problem for those firstentering the labor market. The evidence also indicates that while the rise in graduate unemploymentwas experienced by both male and female graduates, the latter experiencing a greater rise than theformer. In terms of different academic disciplines, the rate of unemployment is much higher among Artsand Commerce graduates, most of whom are females. An analysis of unemployment rates amonggeneral and special graduates revealed higher rates of unemployment among special degree holdersthan their counterparts who had followed general degree programs. It appears that graduation with aspecial degree after spending an additional year had no impact on the employability of Arts andScience graduates.55
5.15 The concern amongst the graduates is their inability to find work at, or soon after, entry into thelabor market. The total number of graduates reported as unemployed in 2005 was 42,585 and 63percent of them were Arts graduates. The rest had followed Commerce and Management (17%) andScience (20%) degree programs.56 A recent survey of university graduates from the University ofColombo revealed that more than 55 percent of Science and Management graduates foundemployment during the first 3 months after graduation, with only 12 percent and 16 percent forgraduates in Arts and Education, respectively, finding work in the same period.
5.16 Acquisition of post-university qualifications to enhance job prospects is yet another important issueworth noting. Such efforts could reflect an increase in the stock of human capital and the individual’sreadiness to face competition in the job market. The evidence, however, indicates that only 21 percentof female graduates and 32 percent of male graduates have invested in the acquisition of post-universityqualifications. Interestingly, among graduates, the majority of individuals who did not seek extraqualifications felt that such qualifications would not be useful in their job search. The other commonreasons for not acquiring post-university qualifications include absence of knowledge concerningrelevant courses and the lack of opportunities in their areas of residence.
72
55 For details see Kottahachchi (2003) Employment Prospects of Graduates from Selected Sri Lankan Universities Labor Gazette,54 (1); 5-33.
56 This is based on the data base maintained by the Department of Management Services of the Ministry of Finance. The totalnumber of applications received for graduate unemployment scheme was 56,525 and the numbers rejected and referredwere 8,220 and 5,717, respectively.
5.17 The experience of Tharuna Aruna (TA) is related to the issue of university-employment transition.This was one of the joint initiatives by the Government and private sector to facilitate university-jobtransition through skills development and work experience. The experience of TA I, however, was belowthe level envisaged at its inception. The key reported reasons for the failure were negative attitudes,high job aspirations, poor levels of English, high rate of absenteeism, inability of trainees to cope withthe high demands for performance and levels of discipline required by the private sector, abandonmentof training without prior notice, and preference towards public sector jobs. The experience of TA II waseven more disappointing, especially in terms of attitudes towards private sector organizations andacquisition of soft skills. Most of the TA graduates, in fact, preferred public sector jobs even aftercompleting TA II training. As reported by TA II management, attitudinal changes towards private sectoremployment are important at university level. Work experience providers, were limited to a smallnumber of companies (350 out of a registered 25,000 companies in 1998). Larger companies werenot in a position to provide placements for TA graduates due to prevailing economic conditions. Thus,the placements had to be found in the small and medium-scale enterprise segment of the industry. Theircapacity to offer training opportunities was limited to one or two trainees per establishment.
5.18 Since the early 1970s successive Governments have formulated graduate employment schemesto train and recruit graduates to public sector institutions. The purpose has been to facilitate theuniversity-job transition with some initial investment in skill development. For example, the graduateemployment program of 2005 had a major training component with a total investment of about SLRs.860 million (or SLRs. 21,000 per graduate). It covered five major components: (i) introduction to publicservice; (ii) awareness of IT; (iii) communication skills; (iv) English as a working language; and (v) neweconomic policy of the Government. The key point worth examining is whether the skills developmentand change of attitudes can be incorporated into the study programs of the university.
The Employers’ Perspective5.19 Private sector employers value technical skills, but they also look for soft skills and positive work attitude.This includes the development of higher cognitive abilities and applicable, transferable skills, and personaldevelopment in which competency in English language is a prime tool, rather than mere book learning. Arecent study (Chandrasiri, 2008), based on a cross-sectional survey of private sector senior executives fromseven major sectors of the economy (Banking, Insurance, Garments, Information Technology,Telecommunications, Food and Beverages and Shipping) revealed that, in addition to imparting subjectknowledge, developing core skills and personality attributes was very important at the university level. Further,out of a pre-determined list of seven major attributes, initiative, flexibility and adaptability emerged as vitalfor private sector employment (Figure 5.2). The personality attributes mostly cited by the respondents includecommunication skills, team orientation, trainability, presentation skills, positive attitudes, accountability,ambition, discipline and civics (general understanding on law and order etc.).
5.20 The overwhelming consensus among industry leaders is that, while specific technical skills can belearned on the job or through university training, the number one shortcoming at all levels of work-placeentry is the lack of communication skills in both local and especially English languages, together withsoft skills, such as creativity, problem solving, social habits, decision-making and risk-taking. As notedby Sri Lanka ICT Association Workforce Survey (SLICTA, 2007) employers find that essential soft skillsare deficient in IT graduates, with communications skills being the most deficient. Some of the ICTproviders operating both in domestic and foreign markets emphasized the need for developingnegotiation skills to deal with different client groups.
73
5.21 Interviews with HR managers revealed that private sector organizations prefer to employ foreign-trained graduates as they possess better skills than their counterparts from Sri Lankan universities. In theiropinion, graduates should possess three main competencies: (i) technical; (ii) conceptual; and (iii)behavioral competencies. The technical and conceptual competencies refer to subject knowledge andtheoretical background to understand problems in real world situations. The behavioral componentcovers attitudes and values of graduates seeking employment in private sector organizations. In theirview, local graduates are strong on technical and conceptual competencies, but weak in behavioralcompetencies.
5.22 A focus group interview with a group of senior managers indicated that the private sector wants“skills rather than genius”. Managers stated that: “if we are recruiting at management trainee level, itwon’t matter to us what class they got for their degree. What we need is some sort of life skills.”Moreover, representatives from the garments sector regard graduates’ awareness of responsibility as avital aspect to employability. While the common issues of English fluency and communication werebrought up, the emphasis from the corporate sector was on graduates cultivating the correct attitude:“They have to be willing to work and learn and not expect to be promoted on entry because of theirqualification”. The university faculty was seen as requiring a change of mentality; that they should steertheir students toward employer-friendly skills and not merely academic brilliance. The role of privatesector was also recognized, and corporate internships to final year students and private sponsorship ofcareer guidance were suggested as possible solutions. The internship programs, however, are limitedto a few departments of selected universities and need to be expanded.
5.23 The assessment on university-job market transition and employers’ perspectives on quality ofgraduates indicates the need for developing soft skills as a strategy to enhance employability ofgraduates. Change of attitudes towards private sector employment is equally important in this regardand the Government needs to take the first initiative at the university level. Then, the private sector needsto respond positively by assisting universities in curriculum development work and providing facilities forstudent internships.
74
Figure 5.2: Ranking of Personality Attributes
3.6 3.8 4 4.2 4.4 4.6 4.8 5
Initiative
Flexibility
Adaptability
Responsibility
Decision making
Problem solving
Creativity
4.82
4.64
4.64
4.58
4.55
4.42
4.08
Source: Chandrasiri (2008).
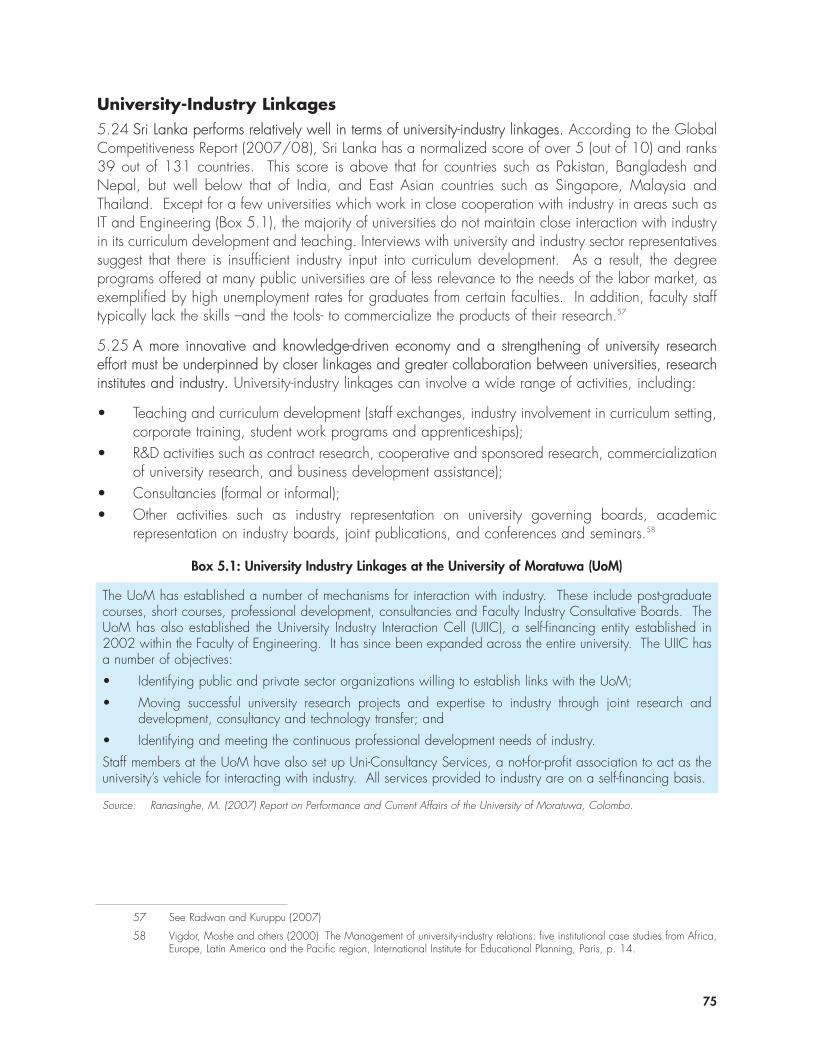
University-Industry Linkages5.24 Sri Lanka performs relatively well in terms of university-industry linkages. According to the GlobalCompetitiveness Report (2007/08), Sri Lanka has a normalized score of over 5 (out of 10) and ranks39 out of 131 countries. This score is above that for countries such as Pakistan, Bangladesh andNepal, but well below that of India, and East Asian countries such as Singapore, Malaysia andThailand. Except for a few universities which work in close cooperation with industry in areas such asIT and Engineering (Box 5.1), the majority of universities do not maintain close interaction with industryin its curriculum development and teaching. Interviews with university and industry sector representativessuggest that there is insufficient industry input into curriculum development. As a result, the degreeprograms offered at many public universities are of less relevance to the needs of the labor market, asexemplified by high unemployment rates for graduates from certain faculties. In addition, faculty stafftypically lack the skills –and the tools- to commercialize the products of their research.57
5.25 A more innovative and knowledge-driven economy and a strengthening of university researcheffort must be underpinned by closer linkages and greater collaboration between universities, researchinstitutes and industry. University-industry linkages can involve a wide range of activities, including:
• Teaching and curriculum development (staff exchanges, industry involvement in curriculum setting,corporate training, student work programs and apprenticeships);
• R&D activities such as contract research, cooperative and sponsored research, commercializationof university research, and business development assistance);
• Consultancies (formal or informal); • Other activities such as industry representation on university governing boards, academic
representation on industry boards, joint publications, and conferences and seminars.58
75
57 See Radwan and Kuruppu (2007)
58 Vigdor, Moshe and others (2000) The Management of university-industry relations: five institutional case studies from Africa,Europe, Latin America and the Pacific region, International Institute for Educational Planning, Paris, p. 14.
Box 5.1: University Industry Linkages at the University of Moratuwa (UoM)
The UoM has established a number of mechanisms for interaction with industry. These include post-graduatecourses, short courses, professional development, consultancies and Faculty Industry Consultative Boards. TheUoM has also established the University Industry Interaction Cell (UIIC), a self-financing entity established in2002 within the Faculty of Engineering. It has since been expanded across the entire university. The UIIC hasa number of objectives:
• Identifying public and private sector organizations willing to establish links with the UoM;
• Moving successful university research projects and expertise to industry through joint research anddevelopment, consultancy and technology transfer; and
• Identifying and meeting the continuous professional development needs of industry.
Staff members at the UoM have also set up Uni-Consultancy Services, a not-for-profit association to act as theuniversity’s vehicle for interacting with industry. All services provided to industry are on a self-financing basis.
Source: Ranasinghe, M. (2007) Report on Performance and Current Affairs of the University of Moratuwa, Colombo.
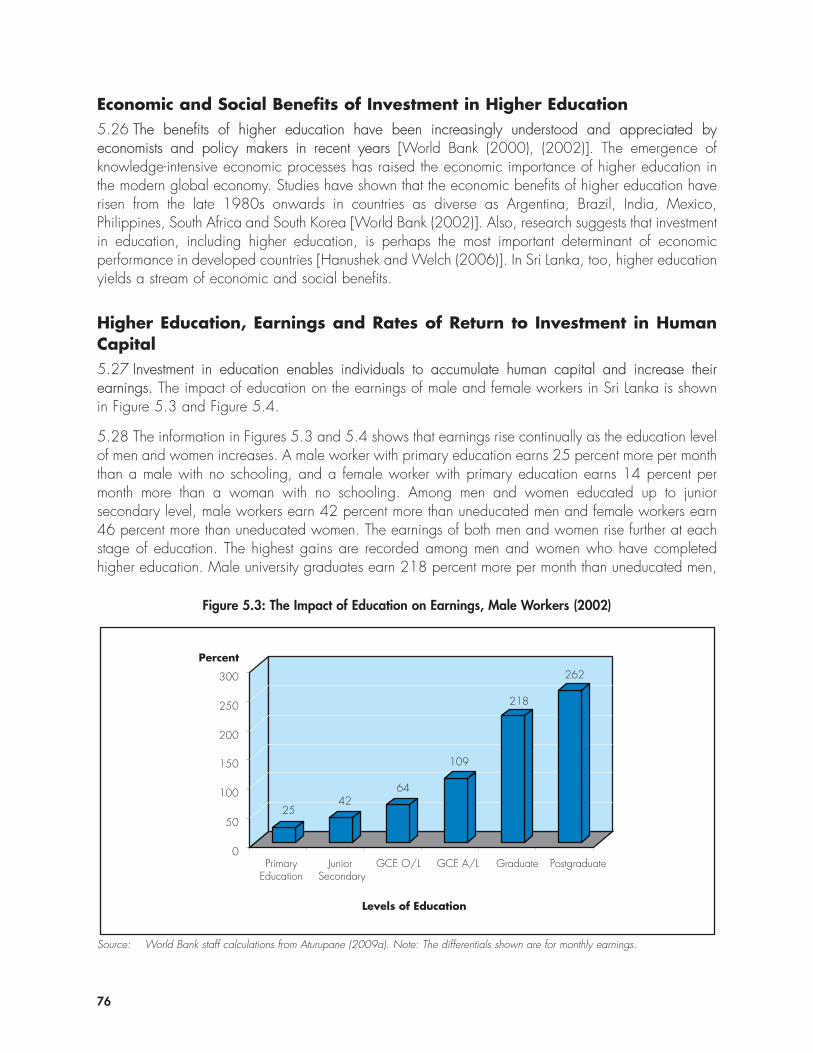
Economic and Social Benefits of Investment in Higher Education5.26 The benefits of higher education have been increasingly understood and appreciated byeconomists and policy makers in recent years [World Bank (2000), (2002)]. The emergence ofknowledge-intensive economic processes has raised the economic importance of higher education inthe modern global economy. Studies have shown that the economic benefits of higher education haverisen from the late 1980s onwards in countries as diverse as Argentina, Brazil, India, Mexico,Philippines, South Africa and South Korea [World Bank (2002)]. Also, research suggests that investmentin education, including higher education, is perhaps the most important determinant of economicperformance in developed countries [Hanushek and Welch (2006)]. In Sri Lanka, too, higher educationyields a stream of economic and social benefits.
Higher Education, Earnings and Rates of Return to Investment in HumanCapital5.27 Investment in education enables individuals to accumulate human capital and increase theirearnings. The impact of education on the earnings of male and female workers in Sri Lanka is shownin Figure 5.3 and Figure 5.4.
5.28 The information in Figures 5.3 and 5.4 shows that earnings rise continually as the education levelof men and women increases. A male worker with primary education earns 25 percent more per monththan a male with no schooling, and a female worker with primary education earns 14 percent permonth more than a woman with no schooling. Among men and women educated up to juniorsecondary level, male workers earn 42 percent more than uneducated men and female workers earn46 percent more than uneducated women. The earnings of both men and women rise further at eachstage of education. The highest gains are recorded among men and women who have completedhigher education. Male university graduates earn 218 percent more per month than uneducated men,
76
Figure 5.3: The Impact of Education on Earnings, Male Workers (2002)
2542
64
109
218
262
0
50
100
150
200
250
300
Percent
PrimaryEducation
Junior Secondary
GCE O/L GCE A/L Graduate Postgraduate
Levels of Education
Source: World Bank staff calculations from Aturupane (2009a). Note: The differentials shown are for monthly earnings.
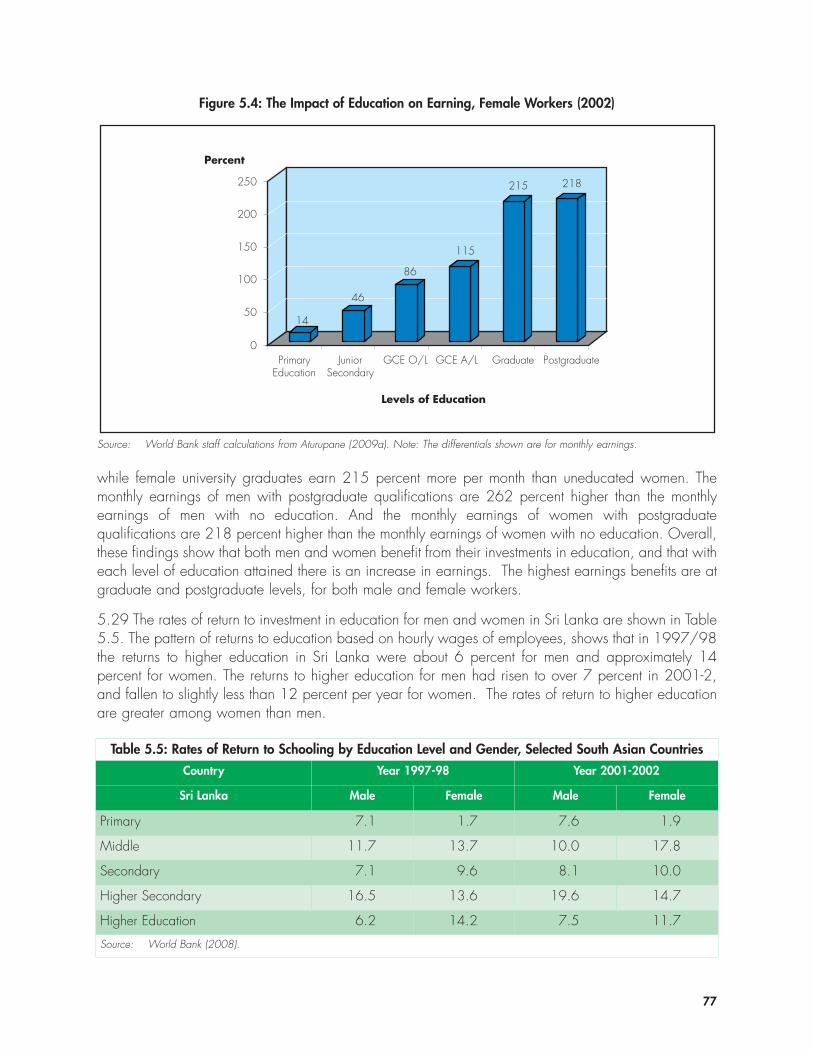
while female university graduates earn 215 percent more per month than uneducated women. Themonthly earnings of men with postgraduate qualifications are 262 percent higher than the monthlyearnings of men with no education. And the monthly earnings of women with postgraduatequalifications are 218 percent higher than the monthly earnings of women with no education. Overall,these findings show that both men and women benefit from their investments in education, and that witheach level of education attained there is an increase in earnings. The highest earnings benefits are atgraduate and postgraduate levels, for both male and female workers.
5.29 The rates of return to investment in education for men and women in Sri Lanka are shown in Table5.5. The pattern of returns to education based on hourly wages of employees, shows that in 1997/98the returns to higher education in Sri Lanka were about 6 percent for men and approximately 14percent for women. The returns to higher education for men had risen to over 7 percent in 2001-2,and fallen to slightly less than 12 percent per year for women. The rates of return to higher educationare greater among women than men.
77
Figure 5.4: The Impact of Education on Earning, Female Workers (2002)
14
46
86
115
215 218
0
50
100
150
200
250
Percent
JuniorSecondary
GCE O/L GCE A/L Graduate Postgraduate
Levels of Education
PrimaryEducation
Source: World Bank staff calculations from Aturupane (2009a). Note: The differentials shown are for monthly earnings.
Table 5.5: Rates of Return to Schooling by Education Level and Gender, Selected South Asian Countries
Country Year 1997-98 Year 2001-2002
Sri Lanka Male Female Male Female
Primary 7.1 1.7 7.6 1.9
Middle 11.7 13.7 10.0 17.8
Secondary 7.1 9.6 8.1 10.0
Higher Secondary 16.5 13.6 19.6 14.7
Higher Education 6.2 14.2 7.5 11.7
Source: World Bank (2008).
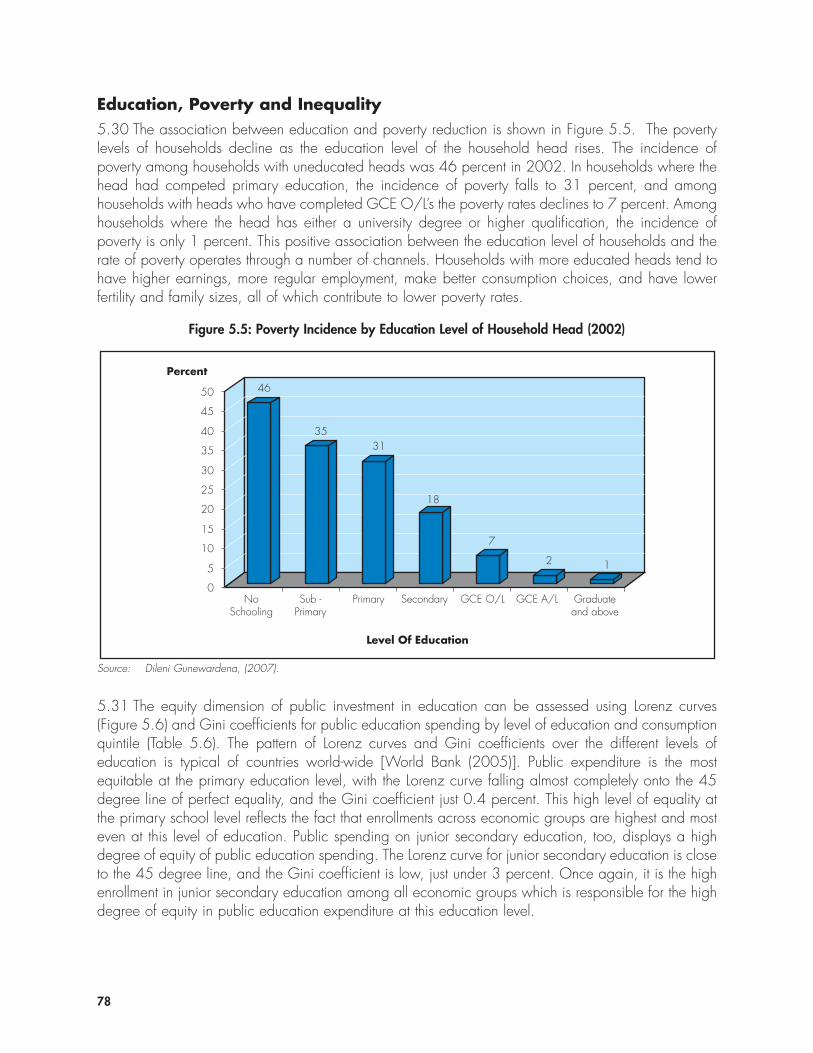
Education, Poverty and Inequality5.30 The association between education and poverty reduction is shown in Figure 5.5. The povertylevels of households decline as the education level of the household head rises. The incidence ofpoverty among households with uneducated heads was 46 percent in 2002. In households where thehead had competed primary education, the incidence of poverty falls to 31 percent, and amonghouseholds with heads who have completed GCE O/L’s the poverty rates declines to 7 percent. Amonghouseholds where the head has either a university degree or higher qualification, the incidence ofpoverty is only 1 percent. This positive association between the education level of households and therate of poverty operates through a number of channels. Households with more educated heads tend tohave higher earnings, more regular employment, make better consumption choices, and have lowerfertility and family sizes, all of which contribute to lower poverty rates.
78
Figure 5.5: Poverty Incidence by Education Level of Household Head (2002)
46
3531
18
7
2 1
0
5
10
15
20
25
30
35
40
45
50
Percent
NoSchooling
Sub -Primary
Primary Secondary GCE O/L GCE A/L Graduateand above
Level Of Education
Source: Dileni Gunewardena, (2007).
5.31 The equity dimension of public investment in education can be assessed using Lorenz curves(Figure 5.6) and Gini coefficients for public education spending by level of education and consumptionquintile (Table 5.6). The pattern of Lorenz curves and Gini coefficients over the different levels ofeducation is typical of countries world-wide [World Bank (2005)]. Public expenditure is the mostequitable at the primary education level, with the Lorenz curve falling almost completely onto the 45degree line of perfect equality, and the Gini coefficient just 0.4 percent. This high level of equality atthe primary school level reflects the fact that enrollments across economic groups are highest and mosteven at this level of education. Public spending on junior secondary education, too, displays a highdegree of equity of public education spending. The Lorenz curve for junior secondary education is closeto the 45 degree line, and the Gini coefficient is low, just under 3 percent. Once again, it is the highenrollment in junior secondary education among all economic groups which is responsible for the highdegree of equity in public education expenditure at this education level.
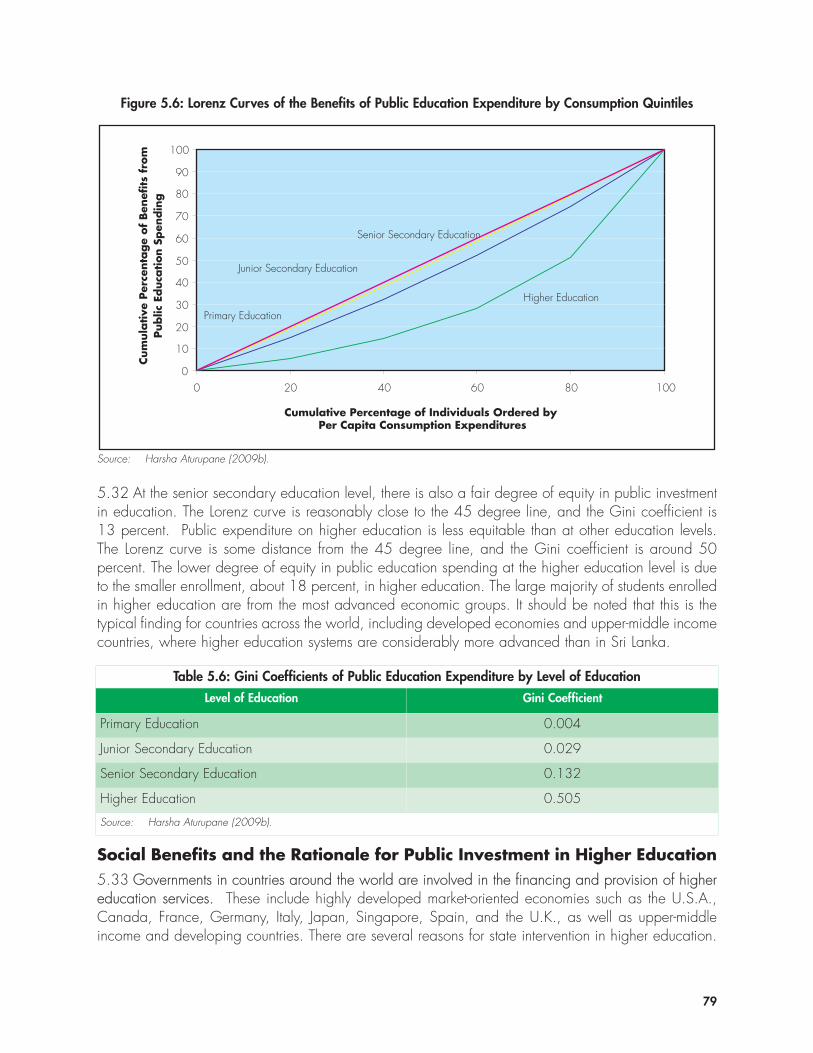
5.32 At the senior secondary education level, there is also a fair degree of equity in public investmentin education. The Lorenz curve is reasonably close to the 45 degree line, and the Gini coefficient is13 percent. Public expenditure on higher education is less equitable than at other education levels.The Lorenz curve is some distance from the 45 degree line, and the Gini coefficient is around 50percent. The lower degree of equity in public education spending at the higher education level is dueto the smaller enrollment, about 18 percent, in higher education. The large majority of students enrolledin higher education are from the most advanced economic groups. It should be noted that this is thetypical finding for countries across the world, including developed economies and upper-middle incomecountries, where higher education systems are considerably more advanced than in Sri Lanka.
79
Figure 5.6: Lorenz Curves of the Benefits of Public Education Expenditure by Consumption Quintiles
0
10
20
30
40
50
60
70
80
90
100
0 20 40 60 80 100
Cumulative Percentage of Individuals Ordered by Per Capita Consumption Expenditures
Cum
ula
tive
Per
centa
ge
of
Ben
efits
fro
m
Public
Educa
tion S
pen
din
g
Primary Education
Junior Secondary Education
Senior Secondary Education
Higher Education
Source: Harsha Aturupane (2009b).
Table 5.6: Gini Coefficients of Public Education Expenditure by Level of Education
Level of Education Gini Coefficient
Primary Education 0.004
Junior Secondary Education 0.029
Senior Secondary Education 0.132
Higher Education 0.505
Source: Harsha Aturupane (2009b).
Social Benefits and the Rationale for Public Investment in Higher Education5.33 Governments in countries around the world are involved in the financing and provision of highereducation services. These include highly developed market-oriented economies such as the U.S.A.,Canada, France, Germany, Italy, Japan, Singapore, Spain, and the U.K., as well as upper-middleincome and developing countries. There are several reasons for state intervention in higher education.
5.34 Countries need highly educated individuals to manage, administer and provide knowledge andtechnical inputs for their public services and private firms and corporations. This is especially the casein the modern world of complex global economic, commercial, cultural and political interactions. Thepresence of a pool of highly educated individuals, when it attains a crucial size, becomes a keynational resource. The overwhelming majority of managers, administrators and knowledge andtechnical specialists in Sri Lanka, as in most other countries, qualify from the national higher educationinstitutions, including the universities, the private degree awarding agencies, and the public and privateinstitutions of the alternative higher education sector. The quality of highly educated labor provided bythe higher education sector has been adequate to achieve and sustain a national growth rate of over5 percent per year, on average, over the last thirty years.
5.35 Higher education drives research and innovation systems. Developing countries need highlyeducated citizens to participate in the research and innovation process, and to acquire, adapt andapply technologies to meet their economic and social needs. Basic research and knowledge has strongexternality benefits, and it is important for governments to invest in research, as the private sector under-invests and under-produces fundamental research and knowledge. In Sri Lanka, the State is one of themain providers of research funds for the higher education sector, through such institutions as theNational Science Foundation.
5.36 Higher education is one of the main repositories and inter-generational transmission mechanismsof the culture, history and society of a country. The social and cultural benefits of this role of highereducation are not necessarily fully captured in the private higher education sector. Hence, the state mayneed to intervene to promote higher education in, for instance, the Arts, Humanities and SocialSciences, which the market typically fails to produce, optimally.
5.37 Higher education can make an important contribution to the promotion of cultured and civilizedbehavior, democratic norms and values, pluralism and respect for diversity, and a favorableenvironment for a multi-ethnic, multi-religious and multi-cultural society. The State can facilitate and fosterthis aspect of higher education, whether through the provision of funds or the delivery of appropriatehigher education services or a combination of both these options.
5.38 The State can play a major role in promoting equity of access to higher education. Typically,talented individuals from poor homes cannot afford the fees of private higher education institutions,especially for-profit institutions. In the absence of state assistance, such students would miss higheducation opportunities. However, the State can intervene, whether by providing vouchers, scholarshipsor stipends for talented, poor students, or by directly delivering affordable higher education services.
5.39 The higher education sector can play a leading role in promoting a socially cohesive society. SriLanka has suffered an ethnic-based secessionist conflict for over twenty-five years, and promoting socialcohesion between different ethnic, religious and cultural groups is of critical importance for the future.The higher education community provides the intellectual leadership of a country. Hence, the HEIs canmake a vital and lasting contribution, through their research, teaching and community services, to thepromotion of a favorable climate for a multi-ethnic, multi-religious and multi-cultural Sri Lanka.
The Way Forward5.40 The economic benefits of higher education are strong. Investment in higher education yieldssubstantial rates of return, and is closely associated with increased earnings and lower rates of poverty.
80
81
The preceding discussion shows that the structural changes of the national economy have led to anincrease in demand for university graduates in a variety of occupational categories and private sectorenterprises. The demand for educated labor in foreign markets has also shown an upward trend. Inspite of these changes, however, the issue of graduate employment has been a persisting problem,particularly among arts and humanities graduates. The assessment of university-job market transition andemployers’ perspectives on quality of graduates indicates the need for the development of soft skills asa strategy to enhance the employability of graduates.
5.41 There are several options to improve the economic relevance of the higher education sector. Atthe outset, the country could recognize that it has sufficient graduates in the “liberal arts” type programs,and concentrate further expansion in more job-oriented degree programs. This would include Enrollmentin job-oriented arts programs where the country faces a labor shortage, such as English languagegraduates. A corollary would be to expand the alternative higher-education sector, which focuses onemployment-oriented courses, faster than the conventional public university sector. A further corollarywould be to encourage the private sector to expand degree programs, as these typically offer job-oriented courses.
5.42 A deeper involvement of universities offering EDPs in their functioning is vitally important tostrengthen these programs. There are several strategies to raise the quality of EDPs. A licensing schemeneeds to be introduced for private institutions which prepare students for the EDP qualification andcertification process. This would ensure that such institutions have a required minimum level of quality,and also provide consumer protection to students enrolled in EDPs. Greater reliance can also be placedon the Open University to deliver the services currently provided through EDPs, as one option to improvethe quality of EDP programs. In addition, a more systematic use of university e-material will be a rationalapproach to improve the quality of these external degree programs.
5.43 Developing the English language and ICT skills of students would dramatically improve theiremployment prospects and productivity at work. This initiative is especially needed for the arts,humanities, commerce and social science students, as a key weakness of these graduates, accordingto employers is their low stock of English language and ICT skills. The universities and faculties that offerarts, humanities, commerce and social science degrees should target additional resources, includingICT equipment and staff-student contact time, and develop quality processes, such as student supportfor the acquisition of language skills, to improve the English language and ICT skills of their students.This is a strategic initiative that would generate clear, multiple benefits. It would be popular amongstudents, have a high impact on their future performance in the world of work, and contribute positivelyto the quality of the country’s future labor force. The existence of a population fluent in English and ICTwould also help attract foreign firms to locate operations in the country.
5.44 Developing soft-skills as a part of degree programs would considerably enhance theemployability of graduates. The degree programs of universities have focused mainly on the subjectcontent and technical skills of students. Employers, however, require attitudes and skills such as initiative,trainability, flexibility, team-orientation, communication, positive work attitudes and discipline.Developing teaching, learning and assessment methods to impart such attitudes and skills amongstudents, during their degree programs, would strongly enhance the employability of graduates.
5.45 Expanding internship programs to provide work experience to students would strengthen therelevance of higher education programs. Such internship programs have dual sets of benefits. On theside of industry, they enable employers to inculcate, train and assess students for their industrial needs
during in-plant training. This builds specific human capital and reduces search and sorting costs. Onthe side of students it provides an opportunity to learn the skills and culture of private sector work places,and enables the development of attitudinal and technical skills for private sector employment.
5.46 Increasing private-sector partnerships in career guidance programs could make these programsmore relevant. University career guidance programs would be enriched by increased participation ofrepresentatives from the private sector. These representatives would be able to communicate in advancethe type of opportunities likely to arise in the private sector, as well as the skills that students need tobenefit from such opportunities. Students would then be able to make choices, such as the types ofcourses to offer, with such opportunities and skills in mind.
5.47 Promoting industry-university linkages in science, technology, and research and development is ofcardinal importance for Sri Lanka to be a high-performing middle income country. The country’seconomic advancement as a middle-income economy will depend critically on the acquisition,operation and use of technologies at increasing levels of complexity, quality and productivity, as wellas the generation of a continuous stream of improvements and innovations. The research skills andcapacity of universities can uniquely support firms in technology acquisition, utilization and adaptation,as well as in innovation and knowledge creation. The promotion of such industry-university linkages inscience, technology, and research and development would be greatly assisted through the developmentof professionally managed university business centers, technology commercialization offices andtechnology broker programs
5.48 The higher education sector should also play a leading role in promoting a socially cohesivesociety. The higher education sector, which provides intellectual and cultural leadership for a country,can make a vital and lasting contribution to the promotion of a favorable climate for a multi-ethnic, multi-religious and multi-cultural Sri Lanka. There are a number of avenues through which this can beaccomplished. The content of academic courses and research activities, especially in the arts,humanities and social sciences, can highlight the positive characteristics of multi-ethnic and multi-religious societies, and the requirements for stability and cohesiveness in such societies. Nearly all thehigher education institutions contain a mix of ethnic and religious groups among their students and staff.These provide an excellent environment for collaboration and cooperation among the various groups.Higher education institutions engage in intellectual, cultural and sporting activities among each other,and these enable students of different ethnic and religious communities from different parts of the countryto meet and interact together. Higher education institutions also provide a climate for collaborativeresearch among academics of from different ethnic and religious groups.
82
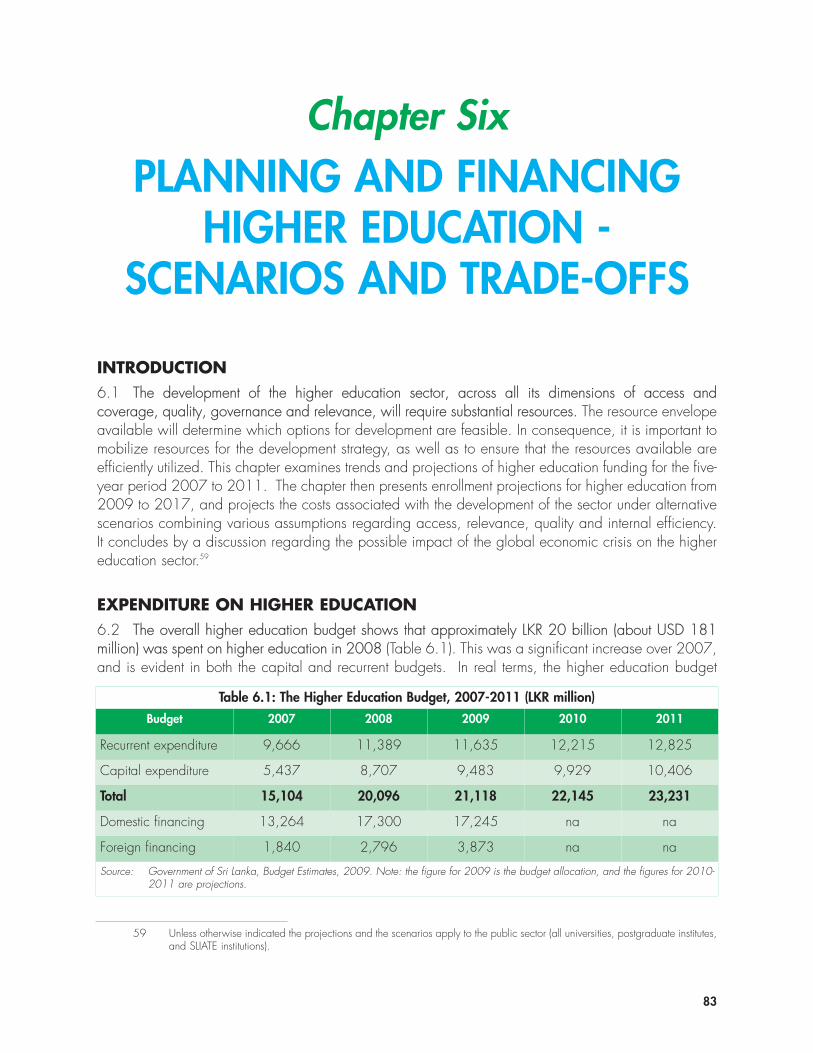
83
Chapter SixPLANNING AND FINANCING
HIGHER EDUCATION -SCENARIOS AND TRADE-OFFS
INTRODUCTION6.1 The development of the higher education sector, across all its dimensions of access andcoverage, quality, governance and relevance, will require substantial resources. The resource envelopeavailable will determine which options for development are feasible. In consequence, it is important tomobilize resources for the development strategy, as well as to ensure that the resources available areefficiently utilized. This chapter examines trends and projections of higher education funding for the five-year period 2007 to 2011. The chapter then presents enrollment projections for higher education from2009 to 2017, and projects the costs associated with the development of the sector under alternativescenarios combining various assumptions regarding access, relevance, quality and internal efficiency.It concludes by a discussion regarding the possible impact of the global economic crisis on the highereducation sector.59
EXPENDITURE ON HIGHER EDUCATION6.2 The overall higher education budget shows that approximately LKR 20 billion (about USD 181million) was spent on higher education in 2008 (Table 6.1). This was a significant increase over 2007,and is evident in both the capital and recurrent budgets. In real terms, the higher education budget
Table 6.1: The Higher Education Budget, 2007-2011 (LKR million)
Budget 2007 2008 2009 2010 2011
Recurrent expenditure 9,666 11,389 11,635 12,215 12,825
Capital expenditure 5,437 8,707 9,483 9,929 10,406
Total 15,104 20,096 21,118 22,145 23,231
Domestic financing 13,264 17,300 17,245 na na
Foreign financing 1,840 2,796 3,873 na na
Source: Government of Sri Lanka, Budget Estimates, 2009. Note: the figure for 2009 is the budget allocation, and the figures for 2010-2011 are projections.
59 Unless otherwise indicated the projections and the scenarios apply to the public sector (all universities, postgraduate institutes,and SLIATE institutions).
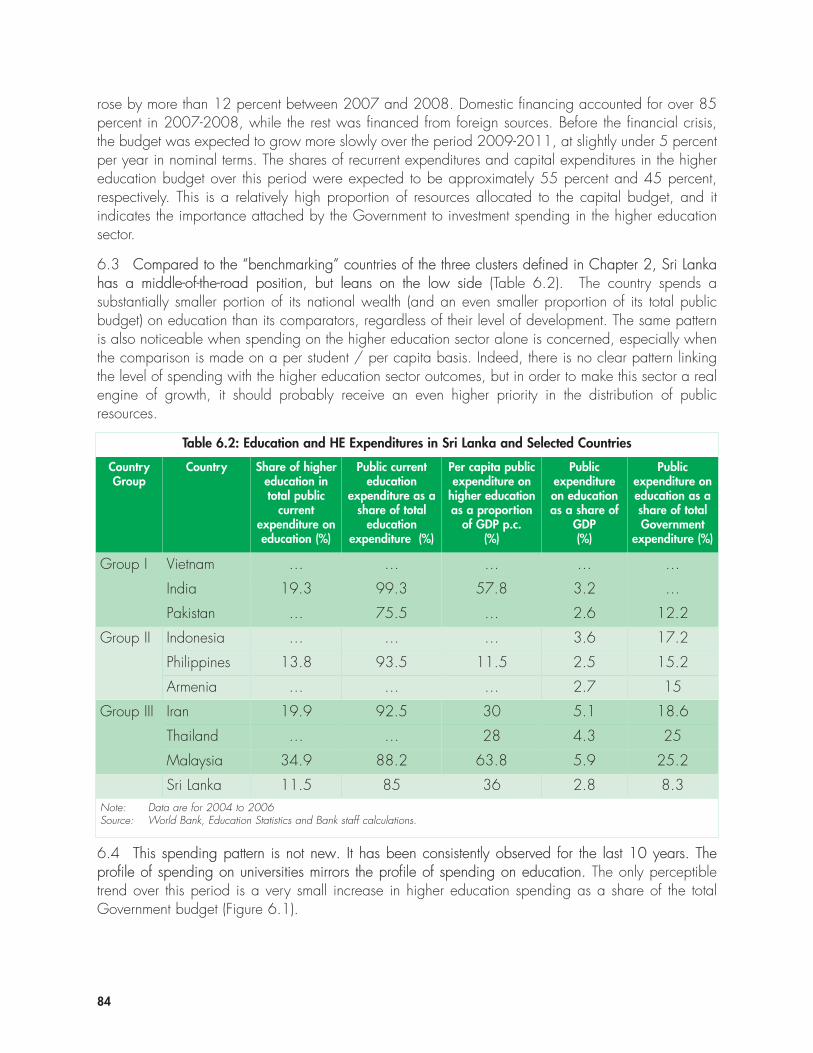
rose by more than 12 percent between 2007 and 2008. Domestic financing accounted for over 85percent in 2007-2008, while the rest was financed from foreign sources. Before the financial crisis,the budget was expected to grow more slowly over the period 2009-2011, at slightly under 5 percentper year in nominal terms. The shares of recurrent expenditures and capital expenditures in the highereducation budget over this period were expected to be approximately 55 percent and 45 percent,respectively. This is a relatively high proportion of resources allocated to the capital budget, and itindicates the importance attached by the Government to investment spending in the higher educationsector.
6.3 Compared to the “benchmarking” countries of the three clusters defined in Chapter 2, Sri Lankahas a middle-of-the-road position, but leans on the low side (Table 6.2). The country spends asubstantially smaller portion of its national wealth (and an even smaller proportion of its total publicbudget) on education than its comparators, regardless of their level of development. The same patternis also noticeable when spending on the higher education sector alone is concerned, especially whenthe comparison is made on a per student / per capita basis. Indeed, there is no clear pattern linkingthe level of spending with the higher education sector outcomes, but in order to make this sector a realengine of growth, it should probably receive an even higher priority in the distribution of publicresources.
84
6.4 This spending pattern is not new. It has been consistently observed for the last 10 years. Theprofile of spending on universities mirrors the profile of spending on education. The only perceptibletrend over this period is a very small increase in higher education spending as a share of the totalGovernment budget (Figure 6.1).
Table 6.2: Education and HE Expenditures in Sri Lanka and Selected Countries
CountryGroup
Country Share of highereducation intotal public
currentexpenditure oneducation (%)
Public currenteducation
expenditure as ashare of total
educationexpenditure (%)
Per capita publicexpenditure on
higher educationas a proportion
of GDP p.c.(%)
Publicexpenditureon educationas a share of
GDP(%)
Publicexpenditure oneducation as ashare of totalGovernment
expenditure (%)
Group I Vietnam … … … … …
India 19.3 99.3 57.8 3.2 …
Pakistan … 75.5 … 2.6 12.2
Group II Indonesia … … … 3.6 17.2
Philippines 13.8 93.5 11.5 2.5 15.2
Armenia … … … 2.7 15
Group III Iran 19.9 92.5 30 5.1 18.6
Thailand … … 28 4.3 25
Malaysia 34.9 88.2 63.8 5.9 25.2
Sri Lanka 11.5 85 36 2.8 8.3Note: Data are for 2004 to 2006Source: World Bank, Education Statistics and Bank staff calculations.
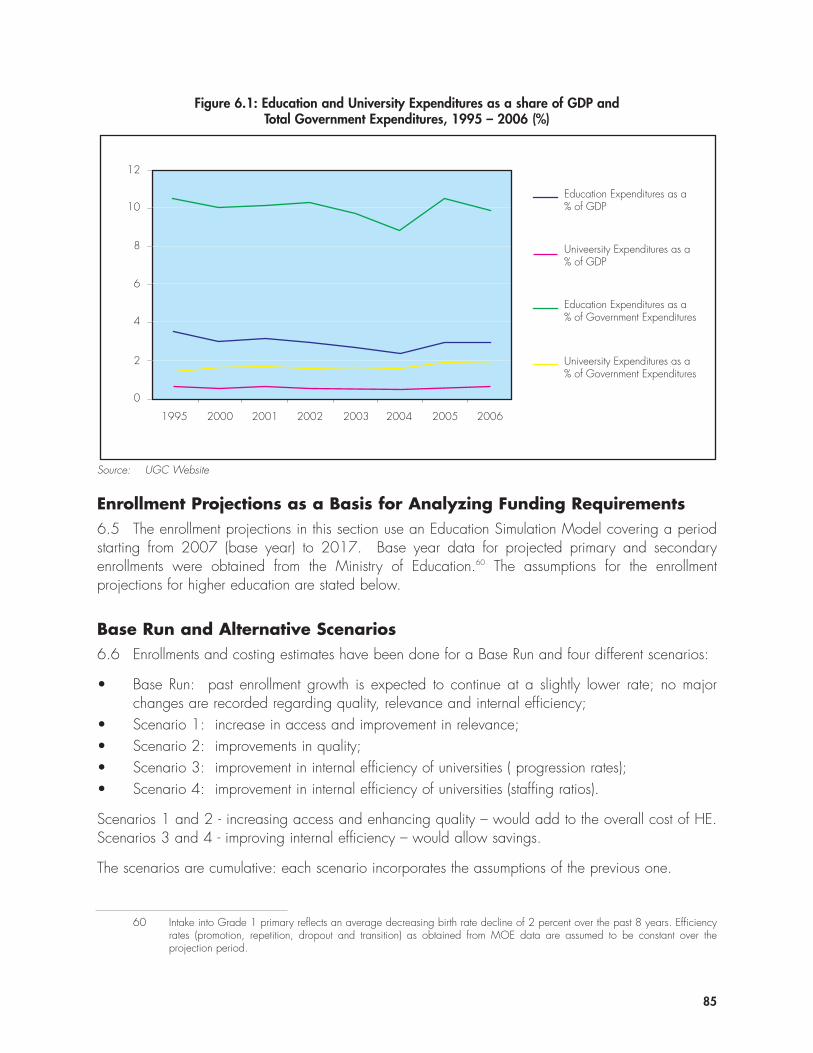
85
Figure 6.1: Education and University Expenditures as a share of GDP and Total Government Expenditures, 1995 – 2006 (%)
0
2
4
6
8
10
12
1995 2001 2003 2004 2005 20062000 2002
Education Expenditures as a% of GDP
Univeersity Expenditures as a% of GDP
Education Expenditures as a% of Government Expenditures
Univeersity Expenditures as a% of Government Expenditures
Source: UGC Website
Enrollment Projections as a Basis for Analyzing Funding Requirements6.5 The enrollment projections in this section use an Education Simulation Model covering a periodstarting from 2007 (base year) to 2017. Base year data for projected primary and secondaryenrollments were obtained from the Ministry of Education.60 The assumptions for the enrollmentprojections for higher education are stated below.
Base Run and Alternative Scenarios6.6 Enrollments and costing estimates have been done for a Base Run and four different scenarios:
• Base Run: past enrollment growth is expected to continue at a slightly lower rate; no majorchanges are recorded regarding quality, relevance and internal efficiency;
• Scenario 1: increase in access and improvement in relevance;• Scenario 2: improvements in quality;• Scenario 3: improvement in internal efficiency of universities ( progression rates);• Scenario 4: improvement in internal efficiency of universities (staffing ratios).
Scenarios 1 and 2 - increasing access and enhancing quality – would add to the overall cost of HE.Scenarios 3 and 4 - improving internal efficiency – would allow savings.
The scenarios are cumulative: each scenario incorporates the assumptions of the previous one.
60 Intake into Grade 1 primary reflects an average decreasing birth rate decline of 2 percent over the past 8 years. Efficiencyrates (promotion, repetition, dropout and transition) as obtained from MOE data are assumed to be constant over theprojection period.
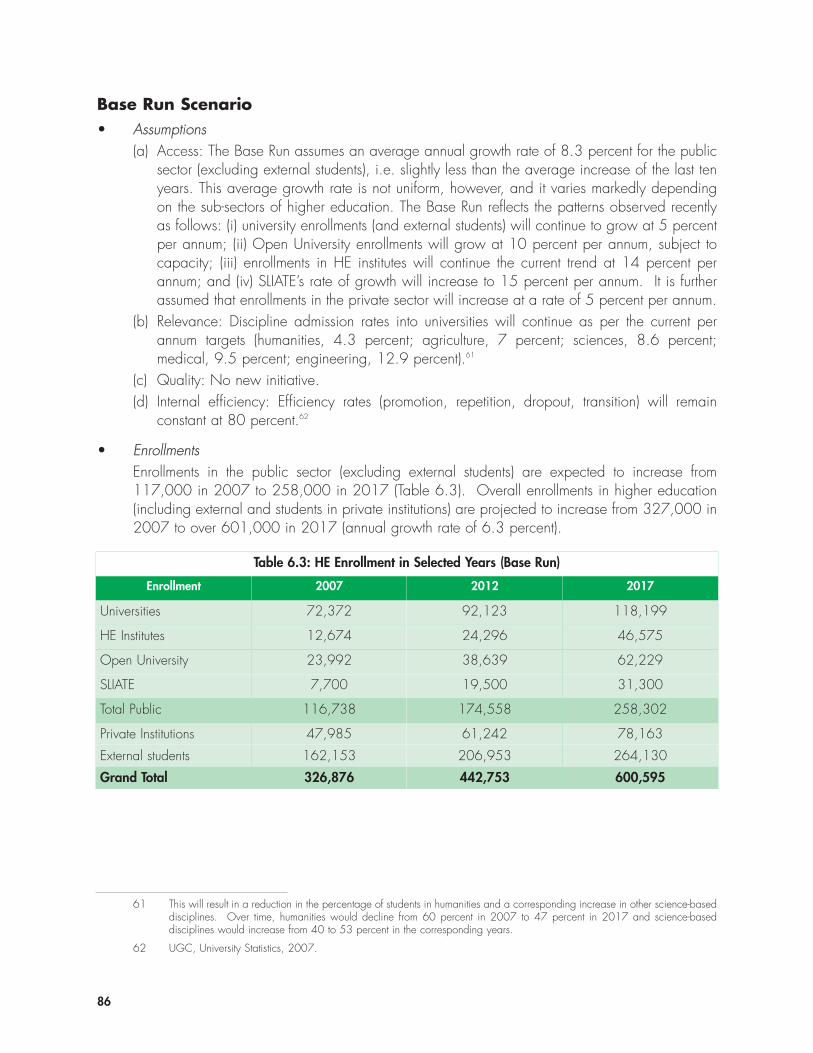
86
Base Run Scenario• Assumptions
(a) Access: The Base Run assumes an average annual growth rate of 8.3 percent for the publicsector (excluding external students), i.e. slightly less than the average increase of the last tenyears. This average growth rate is not uniform, however, and it varies markedly dependingon the sub-sectors of higher education. The Base Run reflects the patterns observed recentlyas follows: (i) university enrollments (and external students) will continue to grow at 5 percentper annum; (ii) Open University enrollments will grow at 10 percent per annum, subject tocapacity; (iii) enrollments in HE institutes will continue the current trend at 14 percent perannum; and (iv) SLIATE’s rate of growth will increase to 15 percent per annum. It is furtherassumed that enrollments in the private sector will increase at a rate of 5 percent per annum.
(b) Relevance: Discipline admission rates into universities will continue as per the current perannum targets (humanities, 4.3 percent; agriculture, 7 percent; sciences, 8.6 percent;medical, 9.5 percent; engineering, 12.9 percent).61
(c) Quality: No new initiative.(d) Internal efficiency: Efficiency rates (promotion, repetition, dropout, transition) will remain
constant at 80 percent.62
• Enrollments Enrollments in the public sector (excluding external students) are expected to increase from117,000 in 2007 to 258,000 in 2017 (Table 6.3). Overall enrollments in higher education(including external and students in private institutions) are projected to increase from 327,000 in2007 to over 601,000 in 2017 (annual growth rate of 6.3 percent).
61 This will result in a reduction in the percentage of students in humanities and a corresponding increase in other science-baseddisciplines. Over time, humanities would decline from 60 percent in 2007 to 47 percent in 2017 and science-baseddisciplines would increase from 40 to 53 percent in the corresponding years.
62 UGC, University Statistics, 2007.
Table 6.3: HE Enrollment in Selected Years (Base Run)
Enrollment 2007 2012 2017
Universities 72,372 92,123 118,199
HE Institutes 12,674 24,296 46,575
Open University 23,992 38,639 62,229
SLIATE 7,700 19,500 31,300
Total Public 116,738 174,558 258,302
Private Institutions 47,985 61,242 78,163
External students 162,153 206,953 264,130
Grand Total 326,876 442,753 600,595
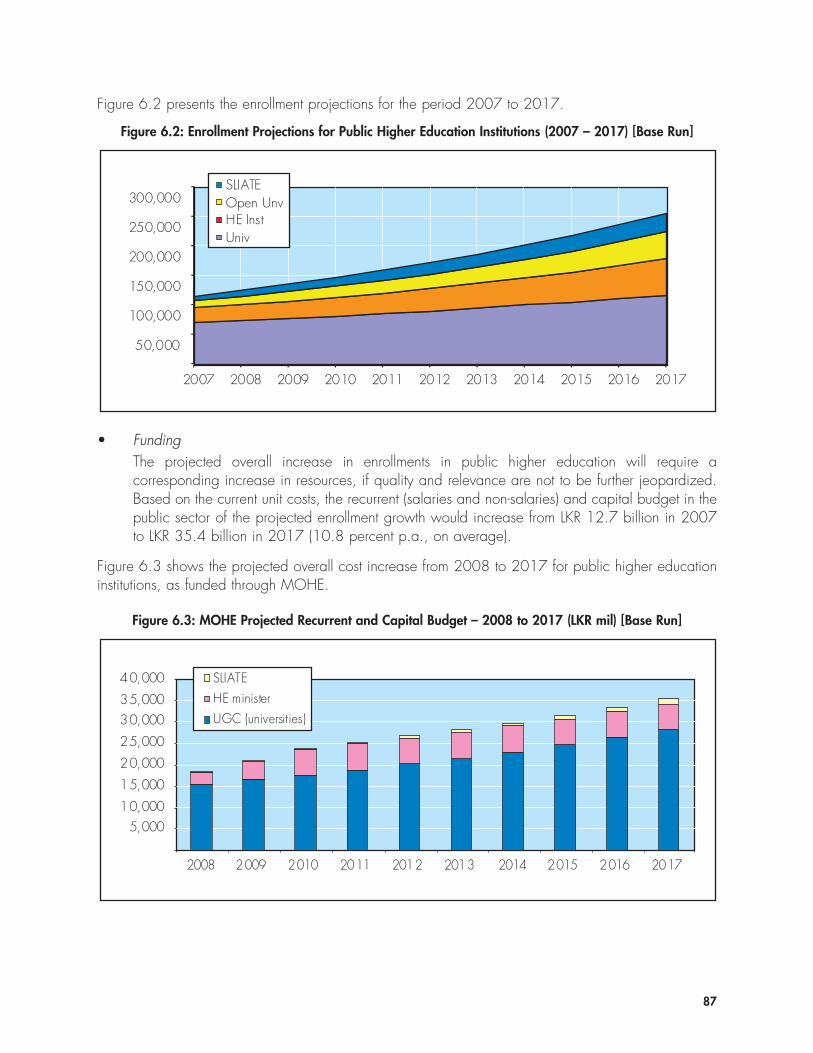
87
• FundingThe projected overall increase in enrollments in public higher education will require acorresponding increase in resources, if quality and relevance are not to be further jeopardized.Based on the current unit costs, the recurrent (salaries and non-salaries) and capital budget in thepublic sector of the projected enrollment growth would increase from LKR 12.7 billion in 2007to LKR 35.4 billion in 2017 (10.8 percent p.a., on average).
Figure 6.3 shows the projected overall cost increase from 2008 to 2017 for public higher educationinstitutions, as funded through MOHE.
Figure 6.2 presents the enrollment projections for the period 2007 to 2017.
Figure 6.2: Enrollment Projections for Public Higher Education Institutions (2007 – 2017) [Base Run]
50,000
100,000
150,000
200,000
250,000
300,000
2007 2008 2009 2010 2011 2012 2013 2014 2015 2016 2017
SLIATEOpen UnvHE InstUniv
Figure 6.3: MOHE Projected Recurrent and Capital Budget – 2008 to 2017 (LKR mil) [Base Run]
5,00010,000
15,000
20,000
25,000
30,00035,000
40,000
2008 2009 2010 2011 2012 2013 2014 2015 2016 2017
SLIATEHE ministerUGC (universities)
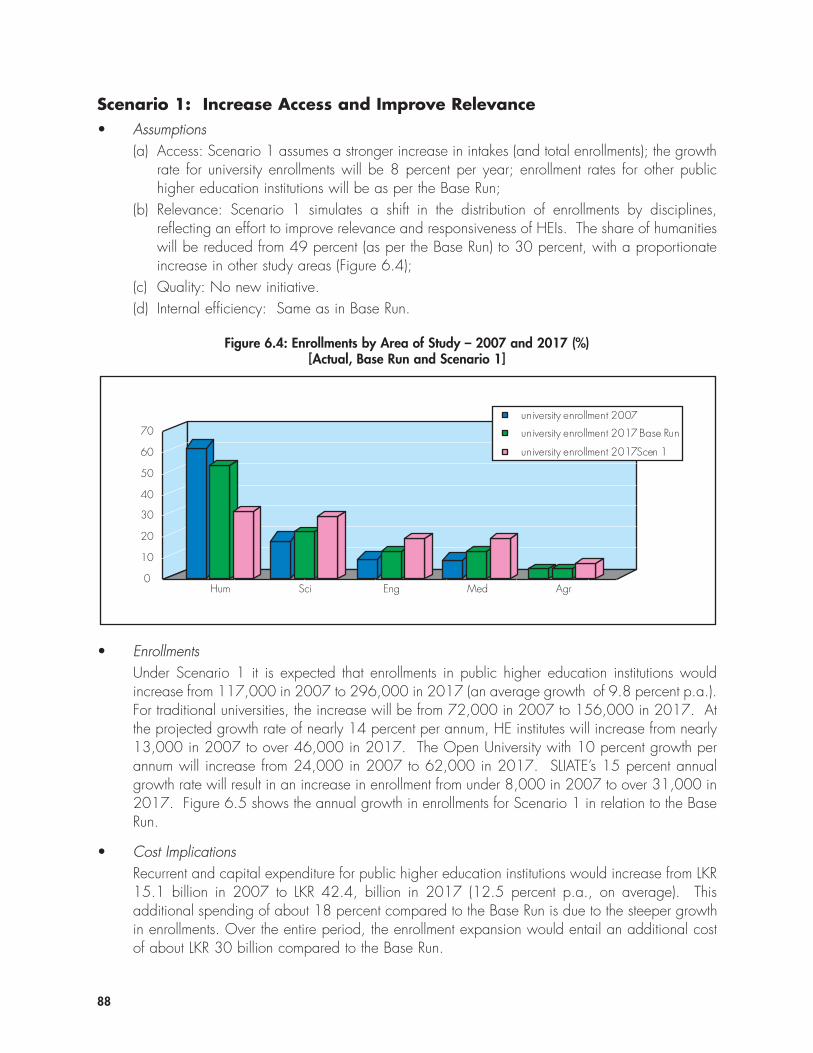
Scenario 1: Increase Access and Improve Relevance• Assumptions
(a) Access: Scenario 1 assumes a stronger increase in intakes (and total enrollments); the growthrate for university enrollments will be 8 percent per year; enrollment rates for other publichigher education institutions will be as per the Base Run;
(b) Relevance: Scenario 1 simulates a shift in the distribution of enrollments by disciplines,reflecting an effort to improve relevance and responsiveness of HEIs. The share of humanitieswill be reduced from 49 percent (as per the Base Run) to 30 percent, with a proportionateincrease in other study areas (Figure 6.4);
(c) Quality: No new initiative.(d) Internal efficiency: Same as in Base Run.
88
• EnrollmentsUnder Scenario 1 it is expected that enrollments in public higher education institutions wouldincrease from 117,000 in 2007 to 296,000 in 2017 (an average growth of 9.8 percent p.a.).For traditional universities, the increase will be from 72,000 in 2007 to 156,000 in 2017. Atthe projected growth rate of nearly 14 percent per annum, HE institutes will increase from nearly13,000 in 2007 to over 46,000 in 2017. The Open University with 10 percent growth perannum will increase from 24,000 in 2007 to 62,000 in 2017. SLIATE’s 15 percent annualgrowth rate will result in an increase in enrollment from under 8,000 in 2007 to over 31,000 in2017. Figure 6.5 shows the annual growth in enrollments for Scenario 1 in relation to the BaseRun.
• Cost ImplicationsRecurrent and capital expenditure for public higher education institutions would increase from LKR15.1 billion in 2007 to LKR 42.4, billion in 2017 (12.5 percent p.a., on average). Thisadditional spending of about 18 percent compared to the Base Run is due to the steeper growthin enrollments. Over the entire period, the enrollment expansion would entail an additional costof about LKR 30 billion compared to the Base Run.
Figure 6.4: Enrollments by Area of Study – 2007 and 2017 (%) [Actual, Base Run and Scenario 1]
0
10
20
30
40
50
60
70
Hum Sci Eng Med Agr
university enrollment 2007
university enrollment 2017 Base Run
university enrollment 2017Scen 1
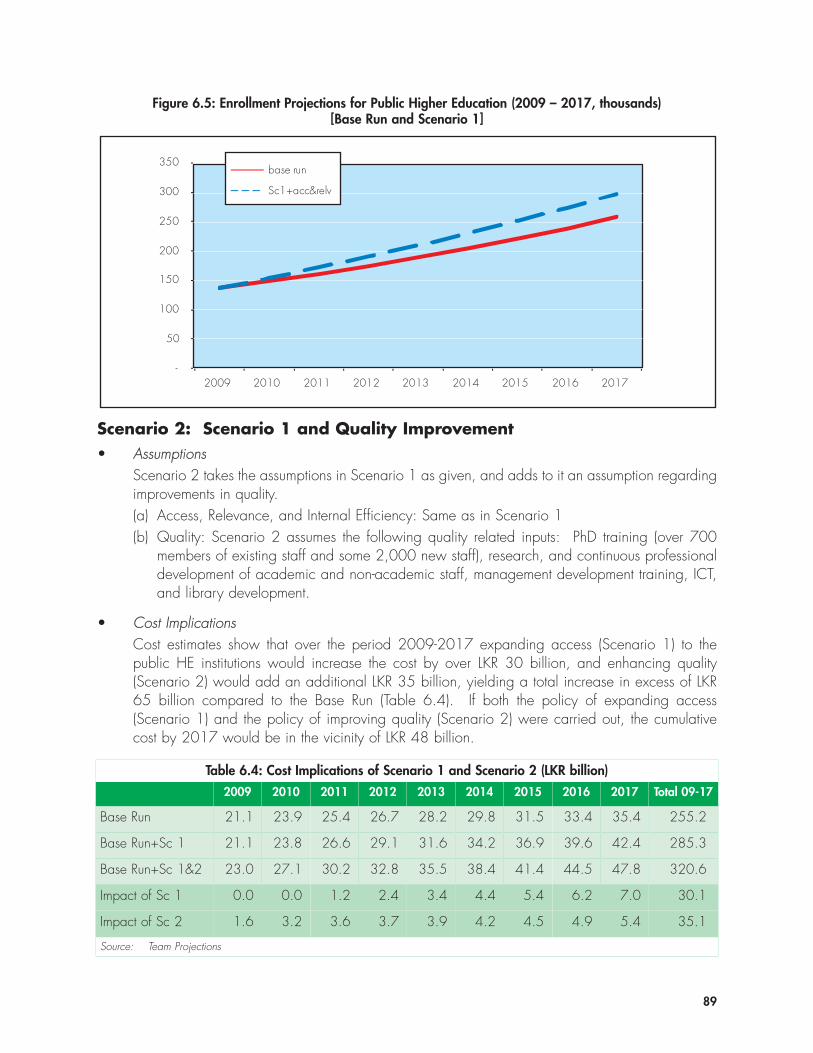
Scenario 2: Scenario 1 and Quality Improvement• Assumptions
Scenario 2 takes the assumptions in Scenario 1 as given, and adds to it an assumption regardingimprovements in quality.(a) Access, Relevance, and Internal Efficiency: Same as in Scenario 1(b) Quality: Scenario 2 assumes the following quality related inputs: PhD training (over 700
members of existing staff and some 2,000 new staff), research, and continuous professionaldevelopment of academic and non-academic staff, management development training, ICT,and library development.
• Cost ImplicationsCost estimates show that over the period 2009-2017 expanding access (Scenario 1) to thepublic HE institutions would increase the cost by over LKR 30 billion, and enhancing quality(Scenario 2) would add an additional LKR 35 billion, yielding a total increase in excess of LKR65 billion compared to the Base Run (Table 6.4). If both the policy of expanding access(Scenario 1) and the policy of improving quality (Scenario 2) were carried out, the cumulativecost by 2017 would be in the vicinity of LKR 48 billion.
89
Figure 6.5: Enrollment Projections for Public Higher Education (2009 – 2017, thousands) [Base Run and Scenario 1]
-
50
100
150
200
250
300
350
2009 2010 2011 2012 2013 2014 2015 2016 2017
base run
Sc1+acc&relv
Table 6.4: Cost Implications of Scenario 1 and Scenario 2 (LKR billion)2009 2010 2011 2012 2013 2014 2015 2016 2017 Total 09-17
Base Run 21.1 23.9 25.4 26.7 28.2 29.8 31.5 33.4 35.4 255.2
Base Run+Sc 1 21.1 23.8 26.6 29.1 31.6 34.2 36.9 39.6 42.4 285.3
Base Run+Sc 1&2 23.0 27.1 30.2 32.8 35.5 38.4 41.4 44.5 47.8 320.6
Impact of Sc 1 0.0 0.0 1.2 2.4 3.4 4.4 5.4 6.2 7.0 30.1
Impact of Sc 2 1.6 3.2 3.6 3.7 3.9 4.2 4.5 4.9 5.4 35.1
Source: Team Projections
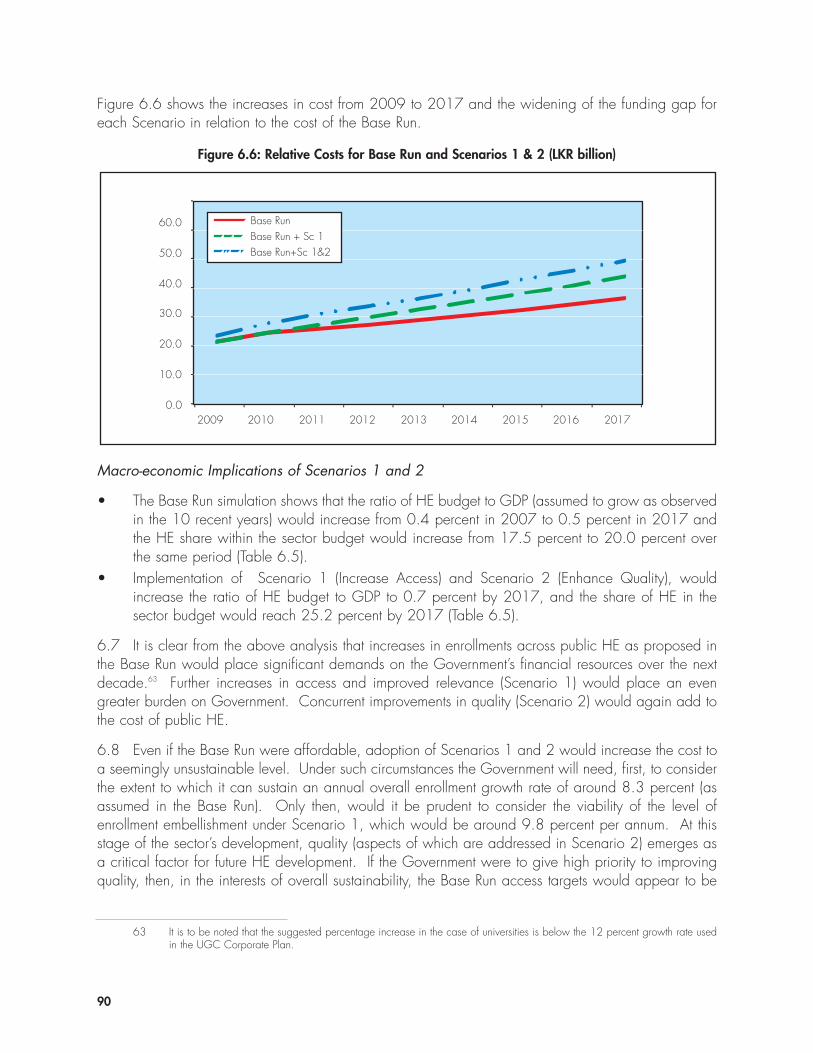
Macro-economic Implications of Scenarios 1 and 2
• The Base Run simulation shows that the ratio of HE budget to GDP (assumed to grow as observedin the 10 recent years) would increase from 0.4 percent in 2007 to 0.5 percent in 2017 andthe HE share within the sector budget would increase from 17.5 percent to 20.0 percent overthe same period (Table 6.5).
• Implementation of Scenario 1 (Increase Access) and Scenario 2 (Enhance Quality), wouldincrease the ratio of HE budget to GDP to 0.7 percent by 2017, and the share of HE in thesector budget would reach 25.2 percent by 2017 (Table 6.5).
6.7 It is clear from the above analysis that increases in enrollments across public HE as proposed inthe Base Run would place significant demands on the Government’s financial resources over the nextdecade.63 Further increases in access and improved relevance (Scenario 1) would place an evengreater burden on Government. Concurrent improvements in quality (Scenario 2) would again add tothe cost of public HE.
6.8 Even if the Base Run were affordable, adoption of Scenarios 1 and 2 would increase the cost toa seemingly unsustainable level. Under such circumstances the Government will need, first, to considerthe extent to which it can sustain an annual overall enrollment growth rate of around 8.3 percent (asassumed in the Base Run). Only then, would it be prudent to consider the viability of the level ofenrollment embellishment under Scenario 1, which would be around 9.8 percent per annum. At thisstage of the sector’s development, quality (aspects of which are addressed in Scenario 2) emerges asa critical factor for future HE development. If the Government were to give high priority to improvingquality, then, in the interests of overall sustainability, the Base Run access targets would appear to be
90
Figure 6.6 shows the increases in cost from 2009 to 2017 and the widening of the funding gap foreach Scenario in relation to the cost of the Base Run.
Figure 6.6: Relative Costs for Base Run and Scenarios 1 & 2 (LKR billion)
0.0
10.0
20.0
30.0
40.0
50.0
60.0
2009 2010 2011 2012 2013 2014 2015 2016 2017
Base RunBase Run + Sc 1Base Run+Sc 1&2
63 It is to be noted that the suggested percentage increase in the case of universities is below the 12 percent growth rate usedin the UGC Corporate Plan.
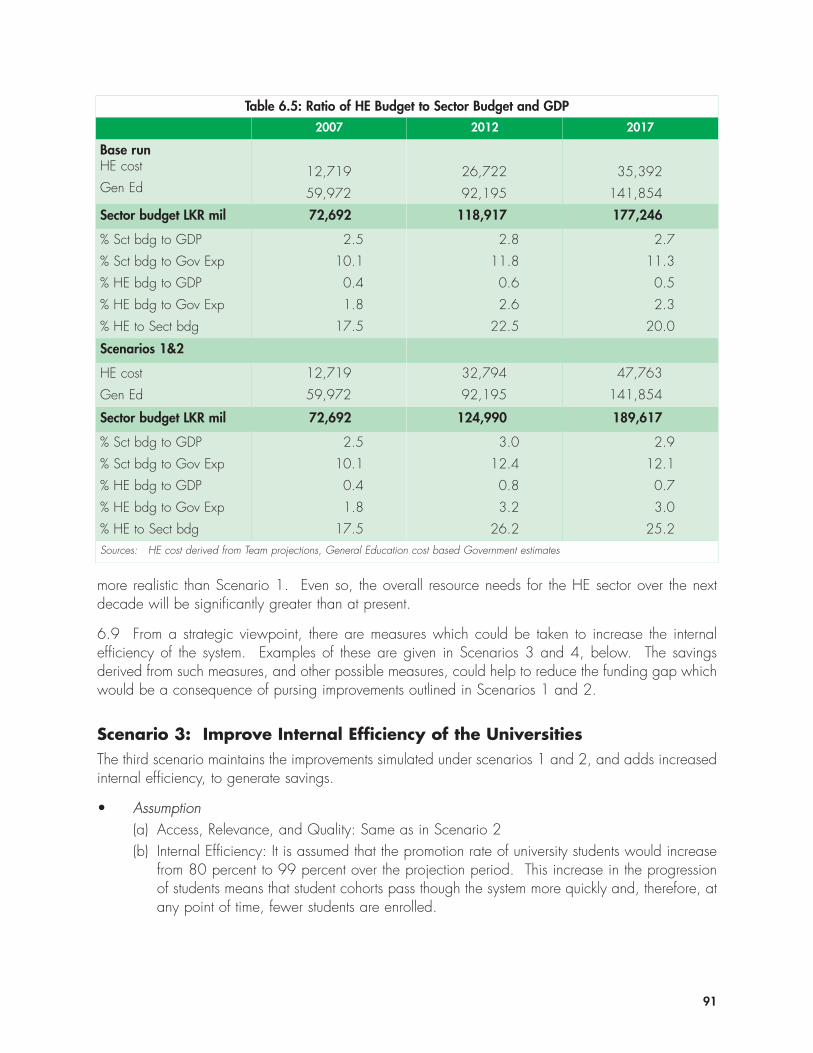
more realistic than Scenario 1. Even so, the overall resource needs for the HE sector over the nextdecade will be significantly greater than at present.
6.9 From a strategic viewpoint, there are measures which could be taken to increase the internalefficiency of the system. Examples of these are given in Scenarios 3 and 4, below. The savingsderived from such measures, and other possible measures, could help to reduce the funding gap whichwould be a consequence of pursing improvements outlined in Scenarios 1 and 2.
Scenario 3: Improve Internal Efficiency of the UniversitiesThe third scenario maintains the improvements simulated under scenarios 1 and 2, and adds increasedinternal efficiency, to generate savings.
• Assumption(a) Access, Relevance, and Quality: Same as in Scenario 2(b) Internal Efficiency: It is assumed that the promotion rate of university students would increase
from 80 percent to 99 percent over the projection period. This increase in the progressionof students means that student cohorts pass though the system more quickly and, therefore, atany point of time, fewer students are enrolled.
91
Table 6.5: Ratio of HE Budget to Sector Budget and GDP2007 2012 2017
Base runHE cost
Gen Ed12,719
59,972
26,722
92,195
35,392
141,854
Sector budget LKR mil 72,692 118,917 177,246
% Sct bdg to GDP
% Sct bdg to Gov Exp
% HE bdg to GDP
% HE bdg to Gov Exp
% HE to Sect bdg
2.5
10.1
0.4
1.8
17.5
2.8
11.8
0.6
2.6
22.5
2.7
11.3
0.5
2.3
20.0
Scenarios 1&2
HE cost
Gen Ed
12,719
59,972
32,794
92,195
47,763
141,854
Sector budget LKR mil 72,692 124,990 189,617
% Sct bdg to GDP
% Sct bdg to Gov Exp
% HE bdg to GDP
% HE bdg to Gov Exp
% HE to Sect bdg
2.5
10.1
0.4
1.8
17.5
3.0
12.4
0.8
3.2
26.2
2.9
12.1
0.7
3.0
25.2 Sources: HE cost derived from Team projections, General Education cost based Government estimates
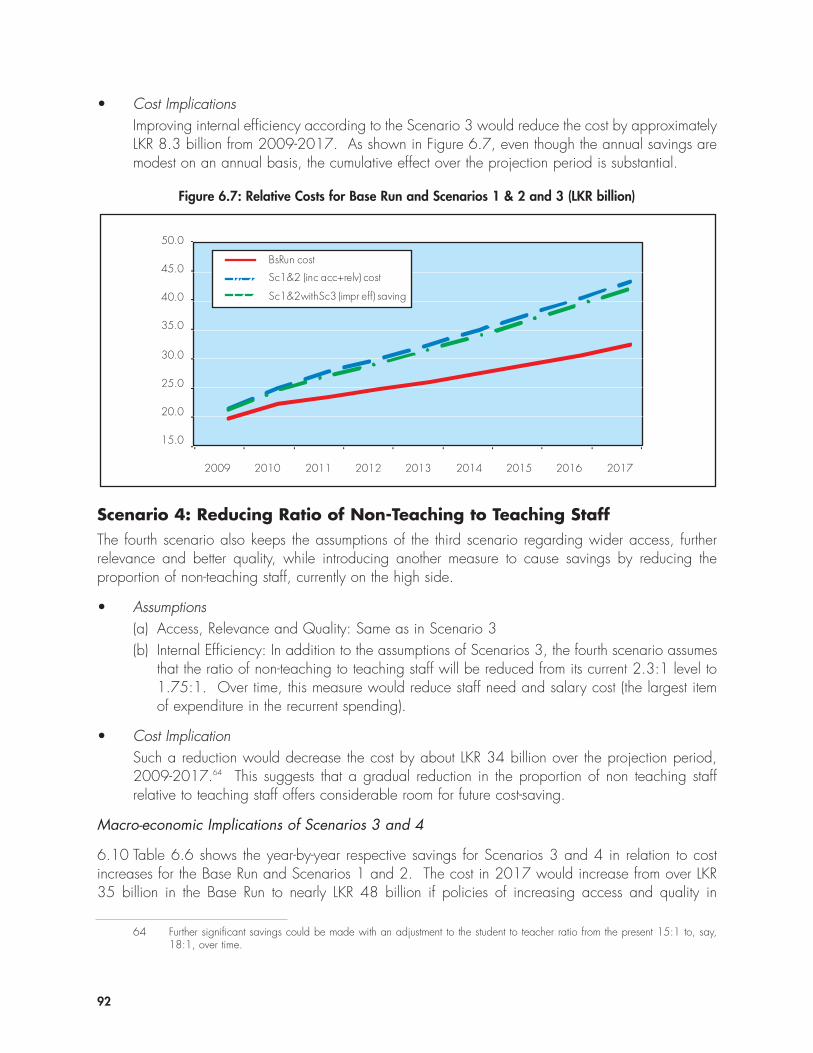
• Cost ImplicationsImproving internal efficiency according to the Scenario 3 would reduce the cost by approximatelyLKR 8.3 billion from 2009-2017. As shown in Figure 6.7, even though the annual savings aremodest on an annual basis, the cumulative effect over the projection period is substantial.
92
Scenario 4: Reducing Ratio of Non-Teaching to Teaching StaffThe fourth scenario also keeps the assumptions of the third scenario regarding wider access, furtherrelevance and better quality, while introducing another measure to cause savings by reducing theproportion of non-teaching staff, currently on the high side.
• Assumptions(a) Access, Relevance and Quality: Same as in Scenario 3(b) Internal Efficiency: In addition to the assumptions of Scenarios 3, the fourth scenario assumes
that the ratio of non-teaching to teaching staff will be reduced from its current 2.3:1 level to1.75:1. Over time, this measure would reduce staff need and salary cost (the largest itemof expenditure in the recurrent spending).
• Cost ImplicationSuch a reduction would decrease the cost by about LKR 34 billion over the projection period,2009-2017.64 This suggests that a gradual reduction in the proportion of non teaching staffrelative to teaching staff offers considerable room for future cost-saving.
Macro-economic Implications of Scenarios 3 and 4
6.10 Table 6.6 shows the year-by-year respective savings for Scenarios 3 and 4 in relation to costincreases for the Base Run and Scenarios 1 and 2. The cost in 2017 would increase from over LKR35 billion in the Base Run to nearly LKR 48 billion if policies of increasing access and quality in
Figure 6.7: Relative Costs for Base Run and Scenarios 1 & 2 and 3 (LKR billion)
2009 2010 2011 2012 2013 2014 2015 2016 2017
BsRun cost
Sc1&2 (inc acc+relv) cost
Sc1&2withSc3 (impr eff) saving
15.0
20.0
25.0
30.0
35.0
40.0
45.0
50.0
64 Further significant savings could be made with an adjustment to the student to teacher ratio from the present 15:1 to, say,18:1, over time.
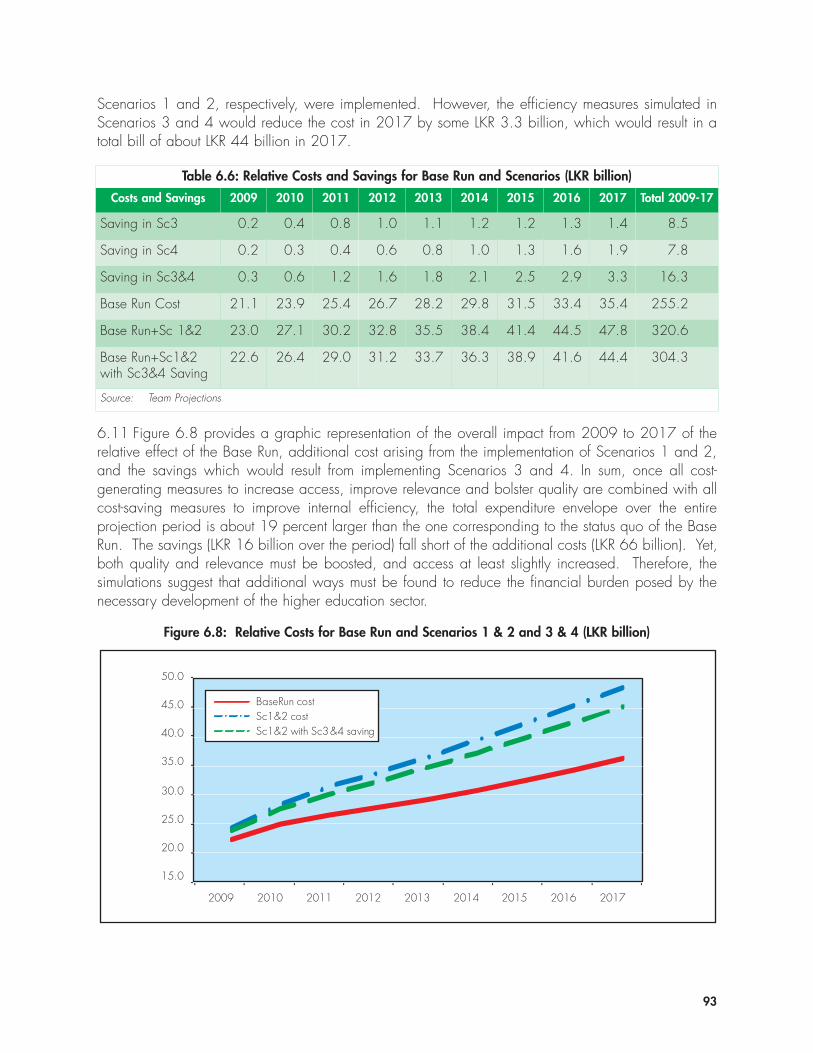
Scenarios 1 and 2, respectively, were implemented. However, the efficiency measures simulated inScenarios 3 and 4 would reduce the cost in 2017 by some LKR 3.3 billion, which would result in atotal bill of about LKR 44 billion in 2017.
93
Figure 6.8: Relative Costs for Base Run and Scenarios 1 & 2 and 3 & 4 (LKR billion)
15.0
20.0
25.0
30.0
35.0
40.0
45.0
50.0
2009 2010 2011 2012 2013 2014 2015 2016 2017
BaseRun costSc1&2 costSc1&2 with Sc3&4 saving
6.11 Figure 6.8 provides a graphic representation of the overall impact from 2009 to 2017 of therelative effect of the Base Run, additional cost arising from the implementation of Scenarios 1 and 2,and the savings which would result from implementing Scenarios 3 and 4. In sum, once all cost-generating measures to increase access, improve relevance and bolster quality are combined with allcost-saving measures to improve internal efficiency, the total expenditure envelope over the entireprojection period is about 19 percent larger than the one corresponding to the status quo of the BaseRun. The savings (LKR 16 billion over the period) fall short of the additional costs (LKR 66 billion). Yet,both quality and relevance must be boosted, and access at least slightly increased. Therefore, thesimulations suggest that additional ways must be found to reduce the financial burden posed by thenecessary development of the higher education sector.
Table 6.6: Relative Costs and Savings for Base Run and Scenarios (LKR billion)
Costs and Savings 2009 2010 2011 2012 2013 2014 2015 2016 2017 Total 2009-17
Saving in Sc3 0.2 0.4 0.8 1.0 1.1 1.2 1.2 1.3 1.4 8.5
Saving in Sc4 0.2 0.3 0.4 0.6 0.8 1.0 1.3 1.6 1.9 7.8
Saving in Sc3&4 0.3 0.6 1.2 1.6 1.8 2.1 2.5 2.9 3.3 16.3
Base Run Cost 21.1 23.9 25.4 26.7 28.2 29.8 31.5 33.4 35.4 255.2
Base Run+Sc 1&2 23.0 27.1 30.2 32.8 35.5 38.4 41.4 44.5 47.8 320.6
Base Run+Sc1&2with Sc3&4 Saving
22.6 26.4 29.0 31.2 33.7 36.3 38.9 41.6 44.4 304.3
Source: Team Projections
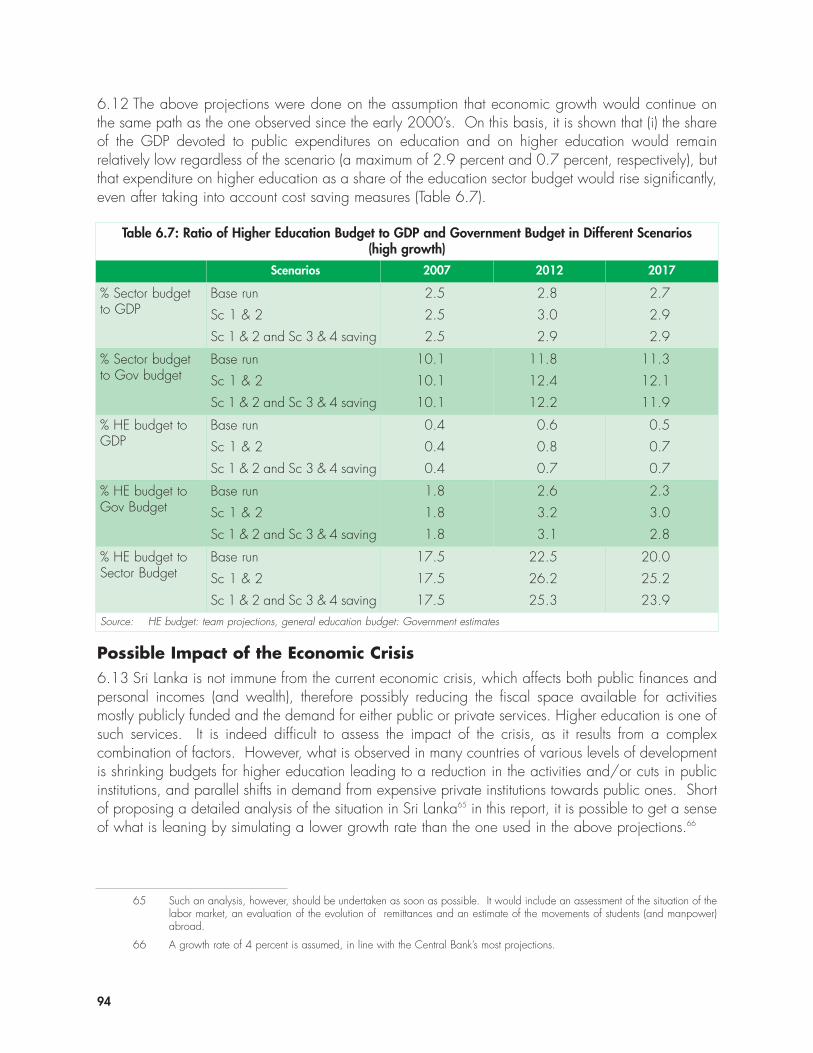
6.12 The above projections were done on the assumption that economic growth would continue onthe same path as the one observed since the early 2000’s. On this basis, it is shown that (i) the shareof the GDP devoted to public expenditures on education and on higher education would remainrelatively low regardless of the scenario (a maximum of 2.9 percent and 0.7 percent, respectively), butthat expenditure on higher education as a share of the education sector budget would rise significantly,even after taking into account cost saving measures (Table 6.7).
94
Table 6.7: Ratio of Higher Education Budget to GDP and Government Budget in Different Scenarios(high growth)
Scenarios 2007 2012 2017
% Sector budgetto GDP
Base run
Sc 1 & 2
Sc 1 & 2 and Sc 3 & 4 saving
2.5
2.5
2.5
2.8
3.0
2.9
2.7
2.9
2.9
% Sector budgetto Gov budget
Base run
Sc 1 & 2
Sc 1 & 2 and Sc 3 & 4 saving
10.1
10.1
10.1
11.8
12.4
12.2
11.3
12.1
11.9
% HE budget toGDP
Base run
Sc 1 & 2
Sc 1 & 2 and Sc 3 & 4 saving
0.4
0.4
0.4
0.6
0.8
0.7
0.5
0.7
0.7
% HE budget toGov Budget
Base run
Sc 1 & 2
Sc 1 & 2 and Sc 3 & 4 saving
1.8
1.8
1.8
2.6
3.2
3.1
2.3
3.0
2.8
% HE budget toSector Budget
Base run
Sc 1 & 2
Sc 1 & 2 and Sc 3 & 4 saving
17.5
17.5
17.5
22.5
26.2
25.3
20.0
25.2
23.9Source: HE budget: team projections, general education budget: Government estimates
65 Such an analysis, however, should be undertaken as soon as possible. It would include an assessment of the situation of thelabor market, an evaluation of the evolution of remittances and an estimate of the movements of students (and manpower)abroad.
66 A growth rate of 4 percent is assumed, in line with the Central Bank’s most projections.
Possible Impact of the Economic Crisis6.13 Sri Lanka is not immune from the current economic crisis, which affects both public finances andpersonal incomes (and wealth), therefore possibly reducing the fiscal space available for activitiesmostly publicly funded and the demand for either public or private services. Higher education is one ofsuch services. It is indeed difficult to assess the impact of the crisis, as it results from a complexcombination of factors. However, what is observed in many countries of various levels of developmentis shrinking budgets for higher education leading to a reduction in the activities and/or cuts in publicinstitutions, and parallel shifts in demand from expensive private institutions towards public ones. Shortof proposing a detailed analysis of the situation in Sri Lanka65 in this report, it is possible to get a senseof what is leaning by simulating a lower growth rate than the one used in the above projections.66
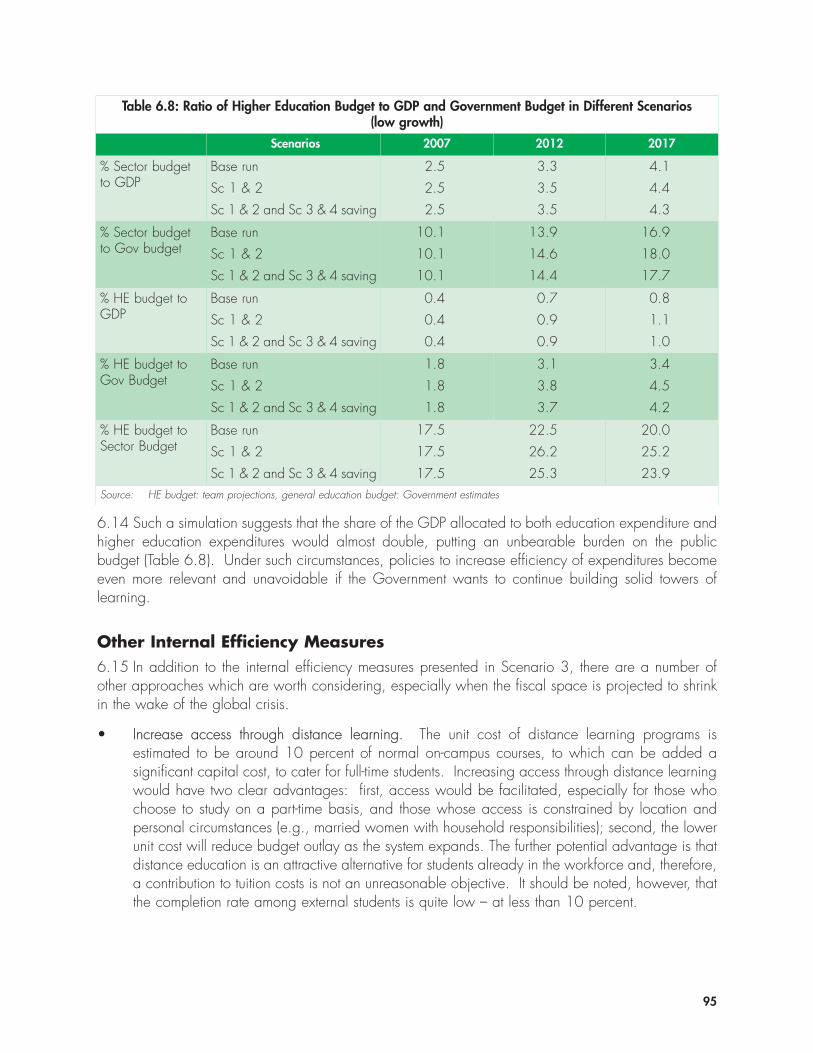
6.14 Such a simulation suggests that the share of the GDP allocated to both education expenditure andhigher education expenditures would almost double, putting an unbearable burden on the publicbudget (Table 6.8). Under such circumstances, policies to increase efficiency of expenditures becomeeven more relevant and unavoidable if the Government wants to continue building solid towers oflearning.
Other Internal Efficiency Measures6.15 In addition to the internal efficiency measures presented in Scenario 3, there are a number ofother approaches which are worth considering, especially when the fiscal space is projected to shrinkin the wake of the global crisis.
• Increase access through distance learning. The unit cost of distance learning programs isestimated to be around 10 percent of normal on-campus courses, to which can be added asignificant capital cost, to cater for full-time students. Increasing access through distance learningwould have two clear advantages: first, access would be facilitated, especially for those whochoose to study on a part-time basis, and those whose access is constrained by location andpersonal circumstances (e.g., married women with household responsibilities); second, the lowerunit cost will reduce budget outlay as the system expands. The further potential advantage is thatdistance education is an attractive alternative for students already in the workforce and, therefore,a contribution to tuition costs is not an unreasonable objective. It should be noted, however, thatthe completion rate among external students is quite low – at less than 10 percent.
95
Table 6.8: Ratio of Higher Education Budget to GDP and Government Budget in Different Scenarios(low growth)
Scenarios 2007 2012 2017
% Sector budgetto GDP
Base run
Sc 1 & 2
Sc 1 & 2 and Sc 3 & 4 saving
2.5
2.5
2.5
3.3
3.5
3.5
4.1
4.4
4.3
% Sector budgetto Gov budget
Base run
Sc 1 & 2
Sc 1 & 2 and Sc 3 & 4 saving
10.1
10.1
10.1
13.9
14.6
14.4
16.9
18.0
17.7
% HE budget toGDP
Base run
Sc 1 & 2
Sc 1 & 2 and Sc 3 & 4 saving
0.4
0.4
0.4
0.7
0.9
0.9
0.8
1.1
1.0
% HE budget toGov Budget
Base run
Sc 1 & 2
Sc 1 & 2 and Sc 3 & 4 saving
1.8
1.8
1.8
3.1
3.8
3.7
3.4
4.5
4.2
% HE budget toSector Budget
Base run
Sc 1 & 2
Sc 1 & 2 and Sc 3 & 4 saving
17.5
17.5
17.5
22.5
26.2
25.3
20.0
25.2
23.9Source: HE budget: team projections, general education budget: Government estimates
• Encourage public HEIs to improve the efficiency of delivery. Appropriate measures include: • benchmarking operating and staff costs and revenues for public HEIs – in aggregate, and for
individual sub-components - to provide HEIs and regulators with information on efficientpractices;
• encouraging public HEIs to outsource non-core services such as cleaning, security andtransportation to the private sector. Outsourcing involves the transfer of service provision froma public entity to an external – usually private sector – organisation and has been widely usedby Government agencies to procure a broad range of services;
• identifying good practice in institutional management and disseminating such examples toother HEIs.
6.16 These measures would provide the MHE/UGC and individual HEIs with valuable information onthe efficiency and quality of delivery across institutions. This is particularly relevant given the increasingscope for benchmarks as a result of the expansion of the private HE sector, as well as the emergenceof innovative delivery vehicles being introduced by public HEIs such as UoM and UoC. One potentialmodel for the implementation of a benchmarking programme would be the US-based Consortium forHigher Education Benchmarking Analysis (CHEBA).67 CHEBA provides a network for the exchange ofperformance measurements and benchmarking data for all levels of HE around the world.
• Derive a rational system for determining unit costs for funding purposes. At present there are widedifferences in the unit costs of traditional Sri Lankan public universities. These significantdifferences in costs suggest that further information and analysis is required to assess the relativeefficiency of public HEIs. Such an analysis could lead to the development of a normative formula-based funding system for public HEIs. The formula would take into account such factors asnumber of students, types of programmes, age of institutions, location, and hostelaccommodation, together with any special circumstances, such as new institutions, faculties andcourses.
• Investigate the feasibility of introducing Public-Private Partnerships (PPPs). PPPs are particularlyapplicable to the development of infrastructure (including laboratories, classroom blocks andstudent hostels), especially given the considerable investment required to provide HEIs with 21st-century teaching and research infrastructure. For example, the MHE/UGC could considermaking greater use of the private sector in the financing, design, construction and operation ofpublic HE infrastructure. Infrastructure PPPs are an increasingly common form of partnerships usedby Governments to procure social infrastructure. Under the most common form of these initiatives,a Government makes contracts with the private sector for the finance, design, construction, andoperation of infrastructural assets, such as schools, university hostels, hospitals, and roads.Infrastructure PPPs can contribute, albeit indirectly, to increasing student access and improving theteaching and research environment. To the extent that the measures reduce costs, they could alsostretch the Government’s higher education budget. At the same time, their influence should not beoverstated as they do not directly affect the delivery of teaching and the conduct of research. Inaddition, the capacity-building requirements for introducing PPPs are significant.
• Recognize the contribution of the private sector. There is a delicate balance between expansionof higher education and the availability of state funds required to improve and sustain quality and
96
67 See www.cheba.com
97
relevance across the public sector. As pointed out above68 there are a number of benefits to bederived from public funding of higher education. At the same time it has to be recognized thatstate funds for higher education are limited. An obvious option for the Government is to beprepared to endorse the legitimacy of the private sector (albeit after due debate). There are twoclear advantages: first, access will be increased, thus helping to achieve one of Government’spriorities for higher education; and second, the resultant increase in enrollment will be achievedwith minimal cost to the state. Any concerns about quality can be addressed by requiring allprivate providers to be subjected to the same quality assurance mechanisms and criteria as thoseapplying to the public sector.
International Approaches to Funding Higher Education6.17 Public higher education institutions are funded in a variety of ways in the world. In addition, asingle country can have one or more models of higher education funding. The predominant models inthe world are described below.
• The first model, which is found in many countries of continental Western Europe, and was alsofollowed in the U.K. through much of the twentieth century, is to finance higher educationinstitutions through taxes, and provide degree programs free of tuition fees to students. This is themodel that was introduced for university undergraduate education in Sri Lanka in the 1940s, andis still followed for undergraduate degree programs in conventional universities. Variations of thismodel include charging earmarked fees, for example for registration and examination, and/orfor lodging and food, while providing free tuition. Countries such as India, Egypt and someAfrican countries follow this model.
• A second model is to share costs between the Government and students, with the degree ofsubsidy varying from country to country, and even within countries. This model is followed, forinstance, in the state higher education systems in the U.S.A. If a student attends a state universityin his/her home state there is a subsidy provided, with the degree of subsidy varying from stateto state. The U.K. and New Zealand are two other countries where the state and students sharethe costs of education in public universities, through a subsidy from the Government, whichpartially meets the cost of tuition. The Open University in Sri Lanka, too, follows this model, with30 percent of recurrent expenditures raised through fees.
• A third model is to have a dual track system, where one set of places is available in publicuniversities free of tuition fees, while fees are charged for another set of places for students whohave the minimum qualifications for entry, but fail to receive sufficient marks to gain a free place.This model is seen in several former Communist countries, such as the Czech Republic, Hungary,Poland and Russia, and in China.
• A fourth model is to have a combination of free and fee levying institutions and programs. In thismodel some higher education institutions and programs are free of tuition fees, while others levyfees. The latter are typically more market-oriented institutions and programs, whose graduateshave promising labor market prospects. Countries such as Mexico, Nigeria or China follow thismodel. Sri Lanka adopts this model for postgraduate degree programs. Some postgraduate andresearch degrees are free, while other postgraduate and research degrees are fee-levying.
• A fifth model is the provision of subsidies to the private higher education sector. Under this modelthe state may provide students vouchers or scholarships which can be used in private higher
68 Chapter 5, Section 6.
education institutions, and as such are an instrument of student aid. Alternatively, the state maydirectly provide financial support to the private higher education institutions, either as a capitalgrant or towards operating expenses for a designated number of students. Several states in theUSA are following this model, also known as demand-side financing (e.g. Colorado –where it isassociated with a performance-based allocation mechanism), as well as countries as diverse asChile, Poland and Sweden.
• A sixth model is the introduction of deferred tuition fees, where students meet the cost of theirundergraduate education after they have completed their studies and commenced work. Anumber of countries, including Australia, New Zealand, England, Scotland and Wales, have thismodel.
• A seventh model is the introduction of “up front” tuition fees at all public universities. Countriessuch as Britain, Netherlands, Austria, China, New Zealand, Vietnam and South Africa have thismodel.
6.18 As can be seen the range of models, and the diversity of usages even within one country, is large.Each country has to work out the best model for itself, depending on its policy objectives, politicaleconomy context and the resource envelope available for the public higher education sector.69 The mainreason for the models which are not fully tax financed, but where some form of cost sharing exists, isbecause the tax financed model is very expensive on a per student basis. As the demand for highereducation expands, and the cost of improving quality and relevance increases, most countries struggleto meet the needs of the higher education sector purely through tax financing, and adopt one or moreof the cost sharing models above. It should be noted that, if Sri Lankan policy makers were to considera cost sharing option in the future, it is very important that poor but talented students continue to beprovided financial assistance to enable them to complete their studies.
Promoting Performance through Funding6.19 Within the public higher education sector, performance can be promoted through an appropriatesystem of incentives and rewards. At present Sri Lankan universities are financed through a system ofad hoc negotiations between the individual institutions, the UGC, MHE and MFP. A more strategicfunding mechanism would be a combination of need-based funding and performance-based funding.About 85-90 percent of the budget for the university sector could be allocated on the basis of need, tofinance the inputs and processes required for the functioning of the universities. Need would take intoaccount various input and process criteria, such as the number of students enrolled and the stepsrequired to respond to the recommendations of the quality assurance process. In addition, the need-based criteria would take the initial conditions of universities into account for the allocation of resources:for instance, older established universities are better resourced than newer universities in distant areas,and universities in the Northern and Eastern Provinces have special needs for post-conflict rehabilitation,renovation and reconstruction. The performance-based allocation could use the balance 10-15 percentof the budget to provide incentives and rewards for good performance. Universities, faculties anddegree programs which achieve medium-term output targets, such as course completion rates, passrates at examinations and years to completion, and long-term outcome targets, such as greateremployment of graduates in the private sector, would be appropriately rewarded through theperformance-based allocation.
98
69 See Dahlman (2009) for a discussion of possible strategies relevant to the countries of South Asia.
The Way Forward 6.20 The analysis in the preceding sections of this report shows that the development of the highereducation sector will require considerable resources. This is consistent with the evidence of highereducation reform and development in other countries around the world. There are also many strategiesadopted by countries to mobilize funds and expand the resource envelope available to the highereducation sector, as discussed above. In addition to increasing the resource envelope, there are alsostrategies to improve internal efficiency and save resources for the sector.
6.21 The various strategies to increase resources and to improve internal efficiency require policy andoperational decisions. Some of these decisions need to be made at the level of the Ministry of Financeand Planning (for instance, the proportion of the national budget which can be allocated for highereducation, given the overall budget and the priorities across sectors). Other decisions need to be madeat the level of the Ministry of Higher Education and the UGC (for example, the appropriate staff-studentratios and academic staff to non-academic staff ratios). Yet other decisions can be made at the level ofindividual institutions (for instance, the promotion and development of revenue raising measures such asconsultancy services and industry services).
6.22 Policy makers could consider improving the quality and relevance of university education, bothconventional degrees and (especially) EDPs, as the top future priority for investment of public resourcesin university education. This would represent a paradigm shift from the chief priority of the past, whichwas to expand enrollments in conventional degree programs while channelling the “excess demand”in neglected EDPs. The university system now needs to move on to the second stage of development,with the central focus of attention on quality and relevance, rather than enrolments.
6.23 Policy makers could also consider targeting whatever public resources are made available forexpanding enrollments in higher education at job-oriented university degree programs and thealternative higher education sector. The Government has already been moving in this direction over therecent past for university education. However, more priority needs to be given to developing thealternative higher education sector. This sector provides, in principle, directly job-oriented courses. Theduration of these courses are typically shorter than university degree programs, and have a lower unitcost. Therefore, the expansion of this sector would be a cost-effective option.
6.24 Measures to improve internal efficiency and reduce costs in the system need to be consideredand implemented. This includes a variety of possible measures, such as a higher academic staff to nonacademic staff ratio, a higher staff-student ratio, and increased procedural efficiency in activities suchas the procurement of equipment. However, it is important that costs savings generated within the highereducation sector are retained within the sector. Similarly, whatever costs savings are generated withina higher education institution need to be available for re-investment within that institution.
6.25 Creating a favourable environment for public-private partnerships and private sector investment inhigher education has helped other countries, including countries such as Russia, China, Poland,Hungary, and the Czech Republic, mobilize greater resources for the higher education sector. Thisoption needs to be considered by policy makers in Sri Lanka. Measures to expand private sectorparticipation in higher education could include establishing a sound quality assurance andaccreditation system, and introducing voucher, stipend and loan schemes for students enrolled in privatehigher education institutions. The option of a public sector subsidy to private higher educationinstitutions, as in Sweden, Chile, Poland and some states in the U.S.A. could also be considered.
99

101
Chapter SevenHIGHER EDUCATION
DEVELOPMENT -ACCELERATING PROGRESS
7.1 The development of the higher education sector will be of immense benefit and value to Sri Lanka:it will also be a complex and challenging process, and require visionary leadership from politicalauthorities and policy makers, and ownership and long-term commitment from the higher educationcommunity.
7.2 The higher education system has served Sri Lanka well in some areas, and performed badly inothers. On the positive side, the higher education system has provided the major proportion of theGovernments’ policy makers and administrators, the private sectors’ managers and technical specialists,and the intellectual community’s knowledge workers. Many graduates of the higher education systemare able to obtain jobs in foreign countries, including in the world’s most developed economies. Manygraduates of the universities are also able to obtain postgraduate education opportunities in developedcountries, including in some of the most prestigious universities in the world. There have been successfulreforms introduced in the past which has enabled a high degree of vertical and horizontaldifferentiation, so that a rich mosaic of higher education programs and courses are available in thecountry. Higher education Enrollment is on par with other countries at similar levels of per capitaincome. And the range and share of employment-oriented courses in the higher education system hasbeen rising over time. The higher education reform and development program of the country should beencouraged by these positive achievements of the past, and rise to address the next set of challenges.
7.3 On the negative side, the country faces a persistent problem of graduate unemployment andunder-employment. There has been a long-term disequilibrium between the employment expectations ofgraduates, and the ability of the economy to absorb these graduates. There are several complexreasons for this problem, but the inadequate quality of general competencies and skills of graduates,especially in certain types of disciplines, has been one of the major causes. Periodic bouts of studentunrest are a second challenge facing the higher education system. A third serious problem is thefinancing of universities and public higher education institutions. The inadequate resources availablethrough tax financing means that the higher education institutions fall behind in modern equipment,technology and facilities, as well as face problems of brain drain, and insufficient research anddevelopment opportunities. And the incentive framework for performance, especially the quality ofteaching and learning in the higher education sector, needs to be modernized.
7.4 The strategic initiatives for higher education development need to be prioritized and sequenced.The higher education policy debate in Sri Lanka, as characterized by the NEC Report (2008), various
policy statements by the Ministry of Higher Education, the University Grants Commission, and thediscussion and the menu of options presented in this report, is extensive and far-reaching. TheGovernment needs to select a set of strategic policy initiatives that can be implemented. Some of theseinitiatives can be implemented in parallel: other initiatives may need to be implemented sequentially:and yet other initiatives could be implemented cumulatively.
7.5 The higher education development strategy in Sri Lanka needs to be broadly communicated,especially among the academic community, and widespread ownership generated. The individualacademic staff members are of central importance to the delivery of good quality higher educationservices. Therefore, the ownership and commitment of academics is a necessary condition for asuccessful higher development strategy. The Ministry of Higher Education, the NEC and the UGC needto communicate the scope, objective and rationale for the higher education development program tothe academic community. The choice of strategies to implement, and their ordering and sequencing,will need to be accomplished with the participation, ownership and commitment of the academiccommunity.
7.6 The higher education development strategy needs targeted interventions to address the mostburning issues, such as graduate unemployment and under-employment. The external degree programs,the arts and humanities, and some of the general science programs, appear to be the areas wheregraduate unemployment and under-employment is highest. Broad-brush policy measures, such asincreasing Enrollment in more employment-oriented degree programs, are one part of the solution.However, an equally important part of the solution would be to introduce targeted programs to improvethe employability of these students. This could include far-stronger measures to enhance their Englishlanguage and IT skills. It could also include increasing the trans-disciplinary and multi-disciplinarycourses available in the arts, humanities and general sciences.
7.7 Higher education change and development can have many opponents. These can includeacademics who feel that their interests are not represented in the development initiatives proposed,political parties that are ideologically opposed to the changes proposed, and student groups withvested interests. The leaders of change need to build bridges with any academics and student groupswho may have concerns about the strategy, and ensure that these concerns are heard and genuineissues addressed. The leaders will also need to manage competing political ideologies in a way thatenables the best options selected for the strategy to be implemented for the overall benefit of the country.
7.8 Higher education development requires sustained, long-term commitment from political authorities.In particular, innovative initiatives in governance can be difficult, as these often involve devolving powerand authority from central levels of Government to individual institutions, such as the universities andadvanced technical institutions. In addition, modern innovations in university financing, such asintroducing revenue systems that range broader than tax financing, and introducing performance basedfunding as an incentive and reward, can be controversial as it pushes traditional-minded individuals outof their comfort zone. Hence, such policy initiatives need visionary and sustained leadership from thehighest levels of the political system.
7.9 The higher education institutions in lagging regions, such as the Northern, Eastern and otheroutlying Provinces, need special attention. The higher education development strategy needs to bedifferentiated according to the level of development of the various higher education institutions. Theolder, well-established higher education institutions in the neighborhood of cities such as Colombo,Kandy and Matara are at a more advanced stage of development. As a result, they can undertake
102
more ambitious development initiatives. In contrast, the higher education institutions located in laggingregions, such as the Northern, Eastern and other distant provinces are relatively under-developed, withless qualified staff, poorer facilities, and academic and managerial systems and processes that are stillbeing established. As a result, these higher education institutions need greater policy attention andfinancial assistance.
7.10 The media needs to be allies in the process of implementation of the higher educationdevelopment strategy. The popular media plays a vital role in providing information and shaping theperceptions of the general public. It is important that the achievements of the higher education system,its future challenges, and the strategies adopted to address these challenges, are communicated to andunderstood by the media. This, in turn, will enable the leaders of change and development tocommunicate to the general public their vision of the future of the higher education system, and theirstrategy to achieve that vision. The support and understanding of the public will be of great importanceto generate long-term political interest and commitment to the higher education development strategy.
7.11 The higher education community contains the cream of the country’s intelligentsia, and has uniquepotential to contribute to the economic and human development of the country. However, this is apotential that has been under-utilized in the past, partly due to the various constraints faced by thesector, and partly due to the weaknesses within the sector. The academic community of the countryneeds to lead, participate in and support the process of higher education development. This processof development will have to be at multiple levels, including the level of the full higher education sector,the level of individual institutions within the sector, and the level of individual programs and courseswithin institutions. The higher education community operates at each of these levels, and can and shouldgenerate and sustain development in each sphere, and of course, over all spheres.
103

105
REFERENCES
Aturupane, Harsha. (2009a), “Celebrating 60 Years Of Progress And Challenges” In Education in SriLanka, South Asia Sector for Human Development Working Paper, the World Bank (forthcoming).
Aturupane, Harsha. (2009b), “The Pearl of Great Price: Achieving Equitable Access to Primary andSecondary Education and Enhancing Learning in Sri Lanka “, CREATE Monograph 29, London, U.K.
Bashir, Sajitha. (2007), Trends in International Trade in Higher Education. Education Working PaperSeries, HDNED, the World Bank, Washington D.C., U.S.A.
Chandrasiri, Sunil. (2008), “Labour Market Experience of University Graduates in Sri Lanka”, HigherEducation Policy, Vol.21: 405-423.
Central Bank of Sri Lanka, Annual Reports, various years.
Dahlman, Carl (2009), Education and Growth of Services. The World Bank, Washington D.C.,U.S.A.
De Silva, Nilanthi. (2008), Improving the Relevance and Quality of Higher Education in Sri Lanka.Ministry of Higher Education, Colombo, Sri Lanka. Processed.
Government of Sri Lanka. (2007), Mahinda Chintana: Vision for a New Sri Lanka. Colombo.
Gunewardena, Dileni. (2007), Consumption Poverty in Sri Lanka: 1985-2002: An Updated Analysisof Household Survey Data. Center for Poverty Analysis, Colombo, Sri Lanka.
Gunatunga, Sunil. (2008), Cost and Financing of Higher Education in Sri Lanka. Ministry of HigherEducation. Colombo, Sri Lanka. Processed.
Grubb, W.N. (2003), “The Roles of Tertiary Colleges and Institutes: Trade-Offs in RestructuringPostsecondary Education”, Paris.
Hanushesk, Eric and Finis Welch. (2006), Handbook of the Economics of Education Volume 1. ElsevierScience and Technology Books.
Fielden, John. (2008), Global Trends in University Governance. Education Working Paper Series,HDNED, the World Bank, Washington D.C., U.S.A.
Kottahachchi, D (2003), “Employment Prospects of Graduates from Selected Sri Lankan Universities “,Labor Gazette 54(1) pp 5-33.
Mazeran, Jacques, Experton, William, et al (2007). Short-Term Vocational Higher Education: A GlobalChallenge in Education. The World Bank, Washington D.C., U.S.A.
Mikhail, Sam. (2008), The Alternative Tertiary Education Sector: More Than Non-University Education.Education Working Paper Series, HDNED, the World Bank, Washington D.C., U.S.A.
Ministry of Education. (2007), Education Sector Development Framework and Programme, Colombo,Sri Lanka.
Ministry of Higher Education. Review of Activities. Various issues. Colombo, Sri Lanka.
Ministry of Finance and Planning. Budget Books. Various issues. Colombo, Sri Lanka.
National Education Commission. (2008), National Policy Framework on University, Technical andVocational Education. Colombo, Sri Lanka.
Perera, K.K.Y.W. (2008), Future Growth of Higher Education: Size and Structure. Ministry of HigherEducation, Colombo, Sri Lanka. Processed.
Radwan, Ismail, Kuruppu Nishana, Wijesinha (2007), Building the Sri Lankan Knowledge Economy.The World Bank, Washington D.C., U.S.A
Ranasinghe, N. (2007), Report on performance and Current Affairs of the University of Moratuwa.Colombo.
Salmi, Jamil, (2009). The Challenge of Establishing World-Class Universities. The World Bank,Washington D.C., U.S.A.
Suspitsin, Dmitry. (2003), Russian Private Higher Education: Alliances with State-Run Organizations,International Higher Education, Fall 2003
Tantrigoda, Dhammika. (2008), Governance and Management of Higher Education in Sri Lanka.Ministry of Higher Education, Colombo, Sri Lanka. Processed.
University Grants Commission. Statistical Yearbook. Various issues. Colombo, Sri Lanka.
Vigdor, Moshe, (2000). The Management of university-industry relations: five institutional case studiesfrom Africa, Europe, Latin America and the Pacific region, International Institute for EducationalPlanning, Paris, p. 14.
Warnapala, Wiswa. (2009) Higher Education in Sri Lanka: New Perspectives and Change.
Vijitha Yapa Publications. Colombo, Sri lanka.
Whiteley, T. (1995) “Enterprise in Higher Education: an overview from the Department for Educationand Employment “ in Education and Training, Vol 37, Issue 9, pp 4-8.
World Bank (2000). Higher Education in Developing Countries: Peril and Promise. The World Bank,Washington D.C., U.S.A.
World Bank (2002). Constructing Knowledge Societies: New Challenges for Tertiary Education. TheWorld Bank, Washington D.C., U.S.A.
106
World Bank (2005). Treasures of the Education System in Sri Lanka: Restoring Performance,Expanding Opportunities and Enhancing Prospects. The World Bank, Colombo Sri Lanka andWashington D.C., U.S.A.
World Economic Forum (2008). Global Competitiveness Index Report
Yan, Fengqiao and Daniel Levy. (2003), China’s New Private Education Law, International HigherEducation, Spring, Boston.
Yingxia Cao (2008). Private Higher Education and the Labor Market in China.
107


![Ekart Tol Tisina Govori[1]](https://img.pdfslide.us/doc/110x75/55cf99f0550346d0339fcf76/ekart-tol-tisina-govori1.jpg)