Embed Size (px)
Citation preview

1
The Role of Perceived Support and Employee Commitment in Employee-Customer Encounters: A Study in the Fast-Food Industry
Christian Vandenberghe
Canada Research Chair in the management of employee commitment and performance
HEC Montreal
2
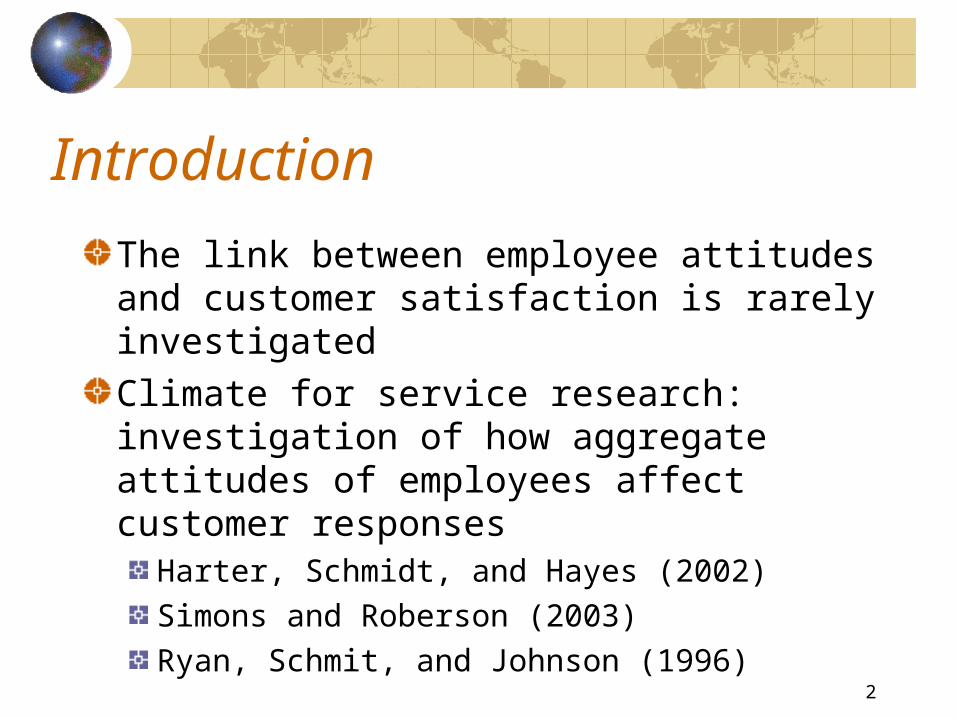
Introduction
The link between employee attitudes and customer satisfaction is rarely investigatedClimate for service research: investigation of how aggregate attitudes of employees affect customer responses
Harter, Schmidt, and Hayes (2002) Simons and Roberson (2003) Ryan, Schmit, and Johnson (1996)

3
Objective
Address the individual service provider-customer encounter, which is a key aspect of services because contact-employees are boundary spanners who interact with customers on an individual basis Fast food industry: service encounters; emotional labor

4
Theoretical framework: POS
Perceived organizational support (Eisenberger, Huntington, Hutchison, & Sowa, 1986)
when employees feel supported or valued, they tend to reciprocate by exerting positive efforts benefiting the donorconservation of resources theory (Hobfoll, 1998)
We found no study that has examined whether this principle applies to the service provider-customer encounter

5
Theoretical framework: POS (cont’d)
COR theory supports the view that in a service environment, employees who feel supported by their organization will provide high-quality services to the organization’s customers. Hypothesis 1a: At the employee level, POS will be positively related to customer perceptions of service quality.
6
Theoretical framework: POS (cont’d)
Previous research on climate for service suggests that aggregate perceptions of support (e.g., a supportive climate) is positively related to customer satisfaction. Hypothesis 1b: At the unit-level, POS will be positively related to customer perceptions of service quality.
7
Theoretical framework: commitment
The three-component modelAffective commitmentNormative commitmentContinuance commitment• Perceived high sacrifice (HiSac)• Perceived lack of employment
alternatives (LoAlt)
8
Theoretical framework: commitment (cont’d)
Affectively committed individuals will tend to help the organization reach its goals
Hypothesis 2: Organizational AC will be positively related to customer satisfaction.
9
Theoretical framework: commitment (cont’d)
Previous research suggests that NC has hardly an effect on outcomes such as in-role or extra-role performance when its affective counterpart is controlled forService employees committed to their organization on a normative basis, because they feel obligated towards their employer, will probably carry out their tasks more grudgingly

10
Theoretical framework: commitment (cont’d)
HiSac refers to a variety of ties with the organization, with one set being instrumental but others being motivational. In the latter case, the ties reflect the fact that the individual has invested a lot of him or herself in the job or the organization. HiSac should characterize a positive inclination towards satisfying customers in the context of this study
11
Theoretical framework: commitment (cont’d)
The reverse might be true for LoAlt which reveals negative perceptions regarding opportunities in the external environment. Those staying with their organization because of a lack of employment alternatives may feel trapped, hence be more anxious and less willing to invest themselves in providing quality services to customers
12
Theoretical framework: commitment (cont’d)
Hypothesis 3: HiSac will be positively related to customer satisfaction.
Hypothesis 4: LoAlt will be negatively related to customer satisfaction.
13
Theoretical framework: commitment (cont’d)
The three-component model provides a useful basis for depicting employees’ attitudes toward customersIn the case of AC, the mindset will be one of desire to pursue a course of action of relevance to customers, such as exerting extra effort to achieve their goals
14
Theoretical framework: commitment (cont’d)
Plausibly, AC to customers exerts an emotional contagion effect that is unique to the service provider-customer encounter
Hypothesis 5: AC to customers will be positively related to customer satisfaction.
15
Theoretical framework: commitment (cont’d)
NC implies a perceived obligation to meet the customer’s expectations. Because of its obligation tone, this binding force should not be as strong as that emanating from a desire mindset, hence should not much sustain employees’ efforts toward better services.
16
Theoretical framework: commitment (cont’d)
Finally, CC to customers is arguably based on the perceived cost of failing to pursue a course of action of relevance to customers (e.g., meeting their expectations). Little effect of this dimension is expected because employees with strong CC to customers will just comply with the minimum requirement to avoid customer dissatisfaction.
17
Method: Sample and Procedures
Study conducted in 12 restaurants of a fast-food organization located in Belgium.
Employee sample: • 266 (response rate = 63.34%)• 133 cashiers• 53% women• Average tenure = 1.01 years (SD = 1.42)• 63.4% worked less than 20 hours per week while
the remaining 34.6% worked more than 20 hours per week
• 66.2% were students rather than regular employees (33.8%)
18
Method: Sample and Procedures (Cont’d)
Customer sample: • 1774 participated, for a response rate of
89.78%• 1116 customer surveys could be matched
to the 133 employees working as cashiers, for an average number of customers per employee of 8.39
• The average number of employee responses per restaurant was 11.09 (range = 7-19)
• The average size of restaurants in terms of staff employed was 35 (range = 28-39)
19
Method: Measures
POS: 8-item version of the Survey of Perceived Organizational Support originally developed by Eisenberger et al. (1986), and validated in French by Vandenberghe and Peiro (1999)French version of the organizational commitment scales developed by Bentein et al. (2005) to measure Meyer and Allen’s (1991) components of commitment (AC-NC, 6 items; HiSac-LoAlt, 3 items).
20
Method: Measures (Cont’d)
Commitment to customers: We used a measure of the three-component model of commitment targeted to customers (Stinglhamber, Bentein, & Vandenberghe, 2002): AC (6 items), NC (6 items), CC (5 items).
21
Method: Measures (Cont’d)
Customer satisfaction: we adapted the SERVPERF to the purpose of this study. Among the 22 perceptual items, 12 were judged as being relevant to the industry context. A thirteen item was suggested by the Human Resources Department staff. The 12 items from the SERVPERF were slightly adapted and then translated into French by a first translator and independently back-translated by a second translator.
22
Method: Measures (Cont’d)
To determine whether customers agreed reasonably well in their evaluations of service experiences with the target employees, we used the average mean deviation (ADM) index of agreement suggested by Burke and colleagues (Burke & Dunlap, 2002; Burke, Finkelstein, & Dusig, 1999; Dunlap, Burke, & Smith-Crowe, 2003).
23
Method: Measures (Cont’d)
To supplement the analysis of interrater agreement among customer evaluations, we calculated the ICC(1) intraclass correlation for the two customer satisfaction dimensions reported in Table 1. For the two dimensions of customer satisfaction reported in Table 1, ICC(1) values were .20 and .18, respectively.
24
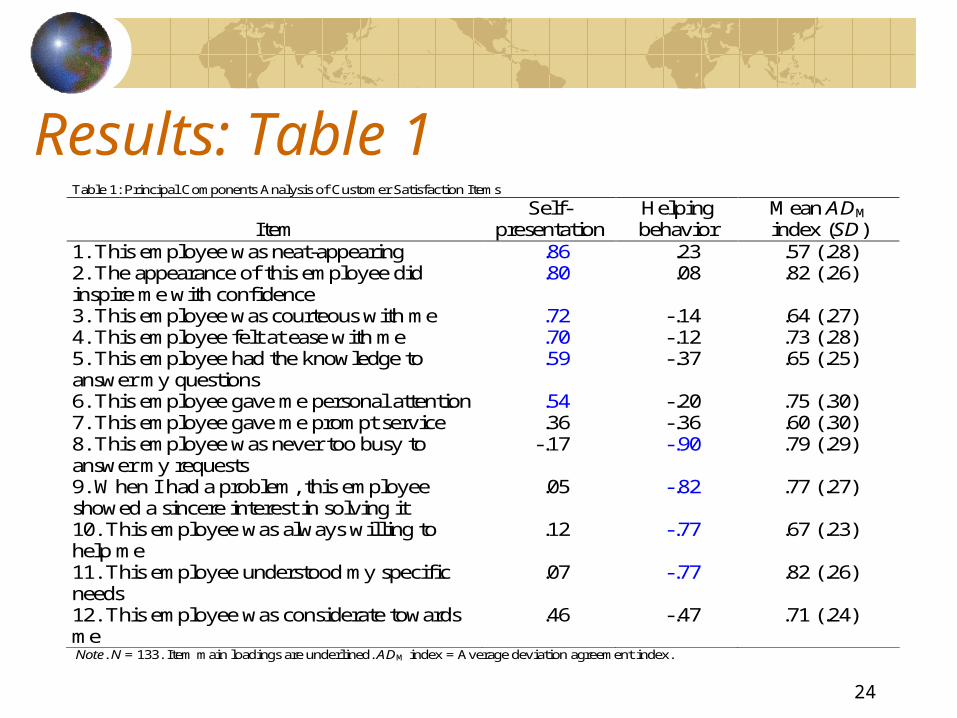
Results: Table 1Table 1: Principal Components Analysis of Customer Satisfaction Items
Item
Self-presentation
Helping behavior
Mean ADM index (SD)
1. This employee was neat-appearing .86 .23 .57 (.28) 2. The appearance of this employee did inspire me with confidence
.80 .08 .82 (.26)
3. This employee was courteous with me .72 -.14 .64 (.27) 4. This employee felt at ease with me .70 -.12 .73 (.28) 5. This employee had the knowledge to answer my questions
.59 -.37 .65 (.25)
6. This employee gave me personal attention .54 -.20 .75 (.30) 7. This employee gave me prompt service .36 -.36 .60 (.30) 8. This employee was never too busy to answer my requests
-.17 -.90 .79 (.29)
9. When I had a problem, this employee showed a sincere interest in solving it
.05 -.82 .77 (.27)
10. This employee was always willing to help me
.12 -.77 .67 (.23)
11. This employee understood my specific needs
.07 -.77 .82 (.26)
12. This employee was considerate towards me
.46 -.47 .71 (.24)
Note. N = 133. Item main loadings are underlined. ADM index = Average deviation agreement index.
25
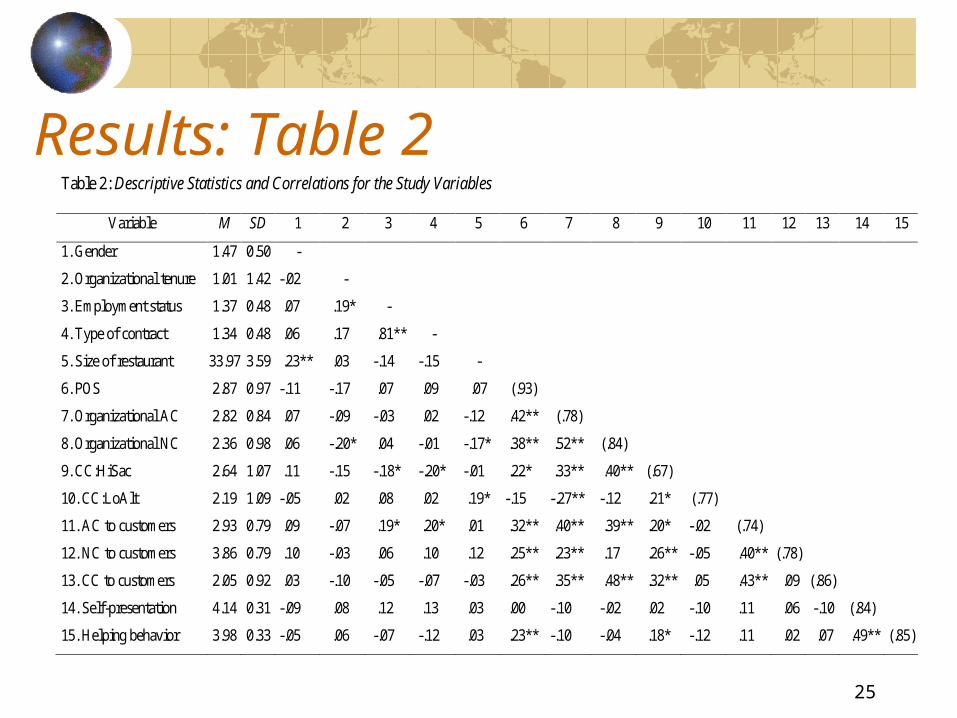
Results: Table 2Table 2: Descriptive Statistics and Correlations for the Study Variables
Variable M SD 1 2 3 4 5 6 7 8 9 10 11 12 13 14 15
1. Gender 1.47 0.50 -
2. Organizational tenure 1.01 1.42 -.02 -
3. Employment status 1.37 0.48 .07 .19* -
4. Type of contract 1.34 0.48 .06 .17 .81** -
5. Size of restaurant 33.97 3.59 .23** .03 -.14 -.15 -
6. POS 2.87 0.97 -.11 -.17 .07 .09 .07 (.93)
7. Organizational AC 2.82 0.84 .07 -.09 -.03 .02 -.12 .42** (.78)
8. Organizational NC 2.36 0.98 .06 -.20* .04 -.01 -.17* .38** .52** (.84)
9. CC:HiSac 2.64 1.07 .11 -.15 -.18* -.20* -.01 .22* .33** .40** (.67)
10. CC:LoAlt 2.19 1.09 -.05 .02 .08 .02 .19* -.15 -.27** -.12 .21* (.77)
11. AC to customers 2.93 0.79 .09 -.07 .19* .20* .01 .32** .40** .39** .20* -.02 (.74)
12. NC to customers 3.86 0.79 .10 -.03 .06 .10 .12 .25** .23** .17 .26** -.05 .40** (.78)
13. CC to customers 2.05 0.92 .03 -.10 -.05 -.07 -.03 .26** .35** .48** .32** .05 .43** .09 (.86)
14. Self-presentation 4.14 0.31 -.09 .08 .12 .13 .03 .00 -.10 -.02 .02 -.10 .11 .06 -.10 (.84)
15. Helping behavior 3.98 0.33 -.05 .06 -.07 -.12 .03 .23** -.10 -.04 .18* -.12 .11 .02 .07 .49** (.85)
26
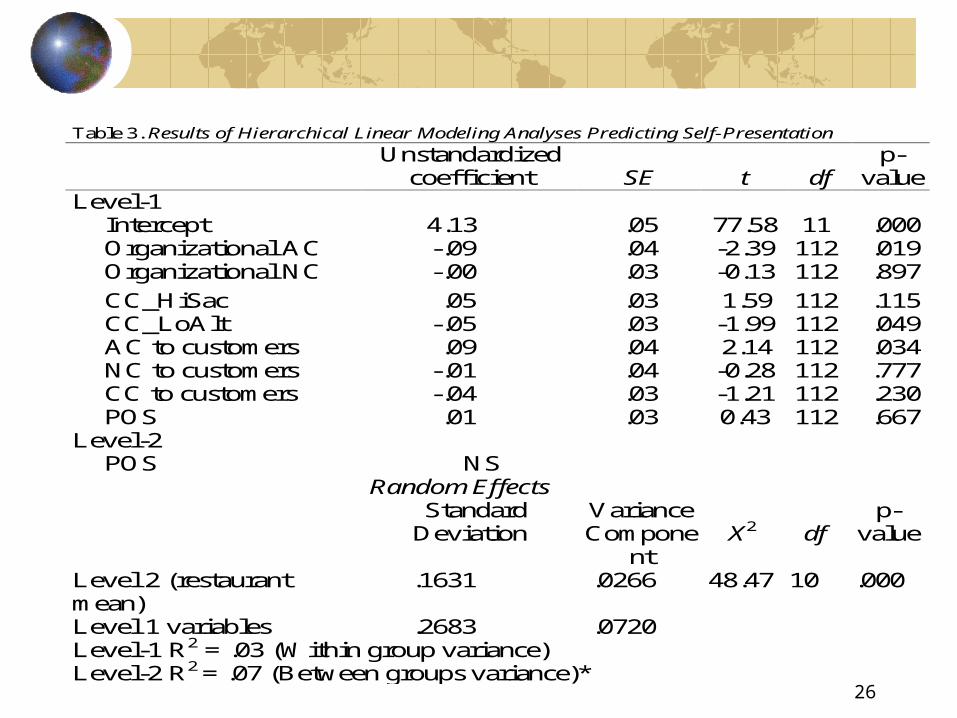
Table 3. Results of Hierarchical Linear Modeling Analyses Predicting Self-Presentation
Unstandardized coefficient
SE
t
df
p-value
Level-1 Intercept 4.13 .05 77.58 11 .000 Organizational AC -.09 .04 -2.39 112 .019 Organizational NC -.00 .03 -0.13 112 .897
CC_HiSac .05 .03 1.59 112 .115 CC_LoAlt -.05 .03 -1.99 112 .049 AC to customers .09 .04 2.14 112 .034 NC to customers -.01 .04 -0.28 112 .777 CC to customers -.04 .03 -1.21 112 .230 POS .01 .03 0.43 112 .667 Level-2 POS NS
Random Effects Standard
Deviation Variance Compone
nt
X2
df
p-value
Level 2 (restaurant mean)
.1631 .0266 48.47 10 .000
Level 1 variables .2683 .0720 Level-1 R2 = .03 (Within group variance) Level-2 R2 = .07 (Between groups variance)*

27
Table 4. Results of Hierarchical Linear Modeling Analyses Predicting Helping Behavior
Unstandardized coefficient
SE
t
df
p-value
Level-1 Intercept 3.33 .28 11.77 10 .000 Organizational AC -.13 .04 -3.25 111 .002 Organizational NC -.03 .03 -0.97 111 .335 CC_HiSac .09 .03 3.15 111 .002 CC_LoAlt -.06 .03 -2.18 111 .031 AC to customers .07 .04 1.81 111 .073 NC to customers -.04 .04 -1.01 111 .316 CC to customers -.03 .04 -0.86 111 .392 POS .06 .03 2.01 111 .046 Level-2 POS .23 .10 2.37 10 .039
Random Effects Standard
Deviation Variance
Component
X2
df p-
value Level 2 (restaurant mean) .099 .0098 23.05 10 .011 Level 1 variables .274 .0752 Level-1 R2 = .10 (Within group variance) Level-2 R2 = .66 (Between groups variance)

28
Conclusion
Conflict between AC to organization and AC to customers Additional research is needed to examine whether the current findings extend to service contexts in which employees engage in long-term service relationships with customers