Embed Size (px)
Citation preview

1
THE NEWS-BASED APPROACH TO EXCHANGE RATES AND THE
ECONOMETRICS OF SHORT-TERM TRADING
University of Greenwich ECON1083 Global Macroeconomics - Module 5
Massimo Tivegna
University of Teramo, Italy
2
COURSE OUTLINE
1. THE €-$ FOREX MARKET - HISTORY AND RECENT TRENDS slides
2. FROM MACROECONOMIC FUNDAMENTALS TO MACRO NEWS p. 1-5
3. MACROECONOMIC SURPRISES – THE SCHEDULED NEWS p. 5-6
4. INFORMATION SOURCES OF SCHEDULED NEWS slides
5. IMPACT ON EXCHANGE RATES OF SCHEDULED NEWS Tab. 2.1
6. UNSCHEDULED NEWS AND THEIR IMPACT ON EXCHANGE RATES p.7-8,Tab.
7. HOW TO MEASURE NEWS slides
8. A 3-ZONES ECONOMETRIC MODEL OF EXCHANGE RATES p. 9-12+slides
9. FROM SIMULATION TO TRADING – OPTIMIZATION p. 12-14 + slides
10.MEASURING AND EVALUATING PERFORMANCE p.14-25+slides
THE €-$ FOREX MARKET – HISTORY AND RECENT TRENDS
A CHECKLIST OF THE FOREX MARKET
• General Features • Instruments exchanged• Trading • Forecasting Techniques for trading• Forex Market Microstructure• The role of Central Banks and their operations

THE €-$ FOREX MARKET – HISTORY AND RECENT TRENDS
GENERAL FEATURES
• Open 24 hours a day • Quoting currency pairs• Number and ranking of currencies• Who trades, where, when, why, how• Postwar history at glance• Instruments exchanged
– Spot, Forward,Swaps,Futures, Options

THE €-$ FOREX MARKET – HISTORY AND RECENT TRENDS
FROM MEDIUM TERM TO DAY-TRADING• Position Trading with a Multicurrency Portfolio (several
days) • Hedging
– On Real and Financial Assets – On Payables and Receivables – For Offsetting Payments Flows – For Asset Management
• Day-trading as a separate asset class

THE €-$ FOREX MARKET – HISTORY AND RECENT TRENDS
Forecasting Techniques for Trading • Technical Analysis• Snooping “professional” Behaviours and Hints (herding
and insider trading) • Rumours and news trading• Econometric Models from Various Theories and
Frequencies• The LONG – SHORT terminology

THE €-$ FOREX MARKET – HISTORY AND RECENT TRENDS
Microstructure • Order flows• Payment and trading circuits (e.g.EBS,www.ebs.com) • Trading over the Internet(e.g.Oanda,IG Markets,
Saxobank, etc.)• High-frequency information (e.g. Bloomberg, Reuters,
Dow Jones, etc.)• Online consulting services, free and fee (e.g.
Forexfactory, Forexpros, RANsquawk, etc.)• Carry trades
THE €-$ FOREX MARKET – HISTORY AND RECENT TRENDS
Role and Operations of Central Banks • European Central Bank• The Federal Reserve System, Fed • Bank of England, The Old Lady• Bank of Japan• Reserve Bank of Australia
THE €-$ FOREX MARKET – HISTORY AND RECENT TRENDS
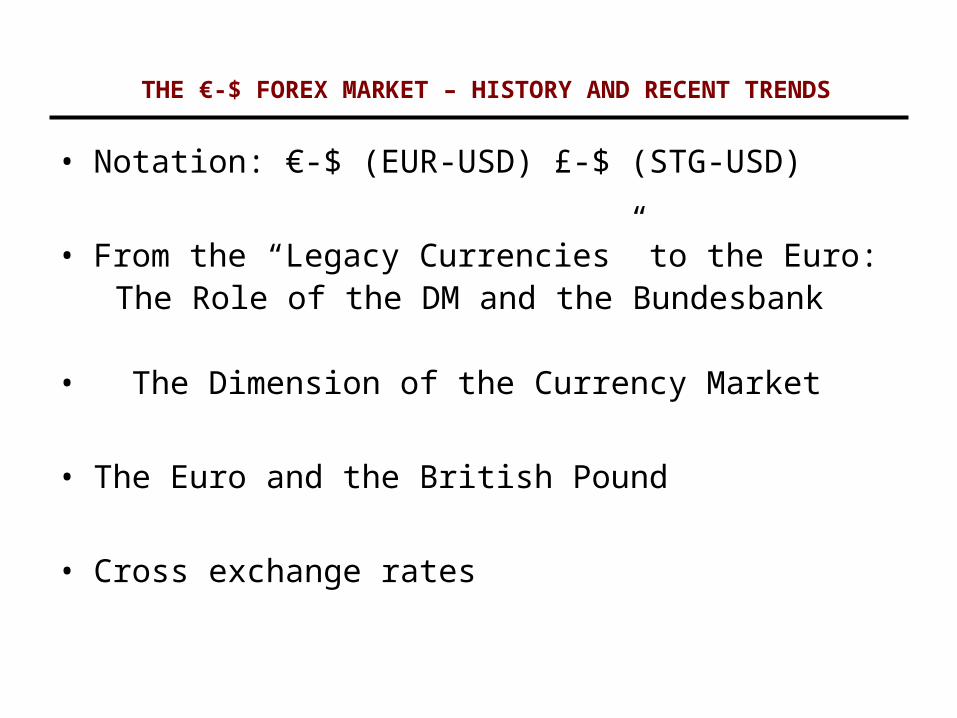
• Notation: €-$ (EUR-USD) £-$ (STG-USD)
• From the “Legacy Currencies” to the Euro: The Role of the DM and the Bundesbank
• The Dimension of the Currency Market
• The Euro and the British Pound
• Cross exchange rates

THE €-$ FOREX MARKET – HISTORY AND RECENT TRENDS
EUR-USD DailyAt 4PM EST (Source Reuters, WSJ) - From Jan. 4,1999 To Present
1999 2000 2001 2002 2003 2004 2005 2006 2007 2008 2009 2010 2011 2012 20130.8
0.9
1.0
1.1
1.2
1.3
1.4
1.5
1.6
THE €-$ FOREX MARKET – HISTORY AND RECENT TRENDS
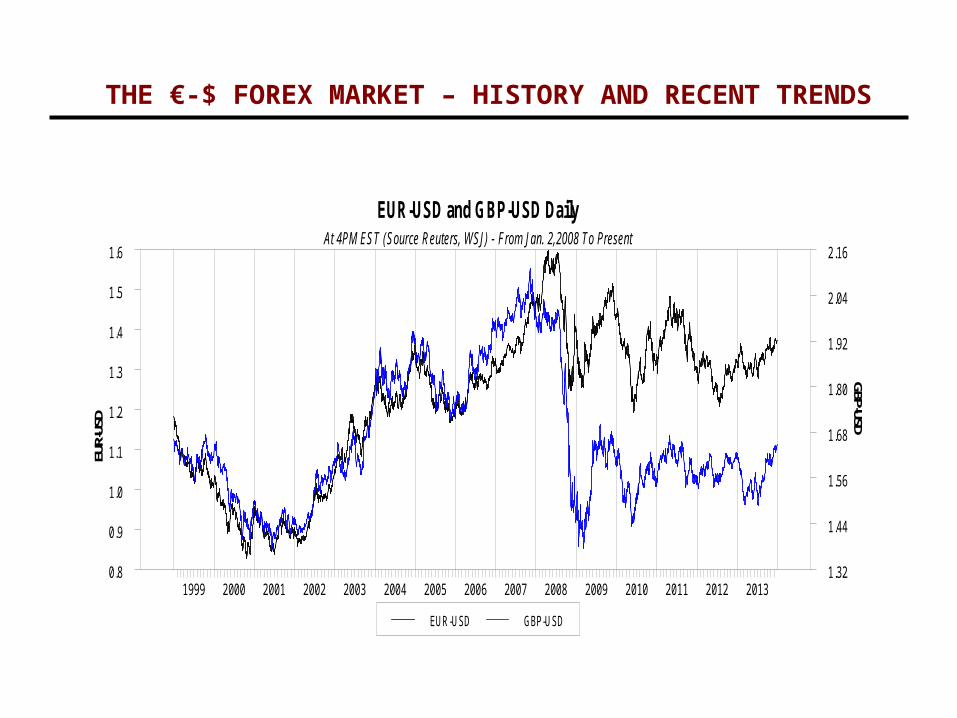
EUR-USD GBP-USD
EUR-USD and GBP-USD DailyAt 4PM EST (Source Reuters, WSJ) - From Jan. 2,2008 To Present
EUR-
USD
GBP-USD
1999 2000 2001 2002 2003 2004 2005 2006 2007 2008 2009 2010 2011 2012 20130.8
0.9
1.0
1.1
1.2
1.3
1.4
1.5
1.6
1.32
1.44
1.56
1.68
1.80
1.92
2.04
2.16

THE €-$ FOREX MARKET – HISTORY AND RECENT TRENDS

THE €-$ FOREX MARKET – HISTORY AND RECENT TRENDS
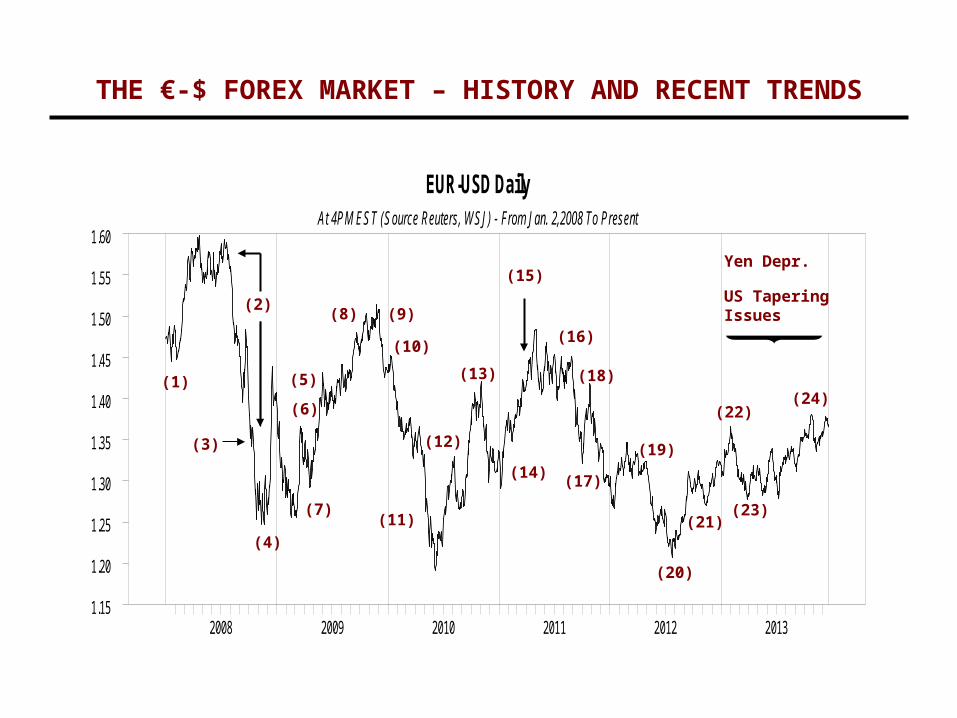
EUR-USD DailyAt 4PM EST (Source Reuters, WSJ) - From Jan. 2,2008 To Present
2008 2009 2010 2011 2012 20131.15
1.20
1.25
1.30
1.35
1.40
1.45
1.50
1.55
1.60
(1)
(2)
(3)
(4)
(6)
(5)
(7)
(8) (9)
(10)
(11)
(12)
(13)
(14)
(15)
(16)
(17)
(18)
(19)
(20)
(21)
(22)
(23)
(24)
Yen Depr.
US TaperingIssues
THE €-$ FOREX MARKET – HISTORY AND RECENT TRENDS
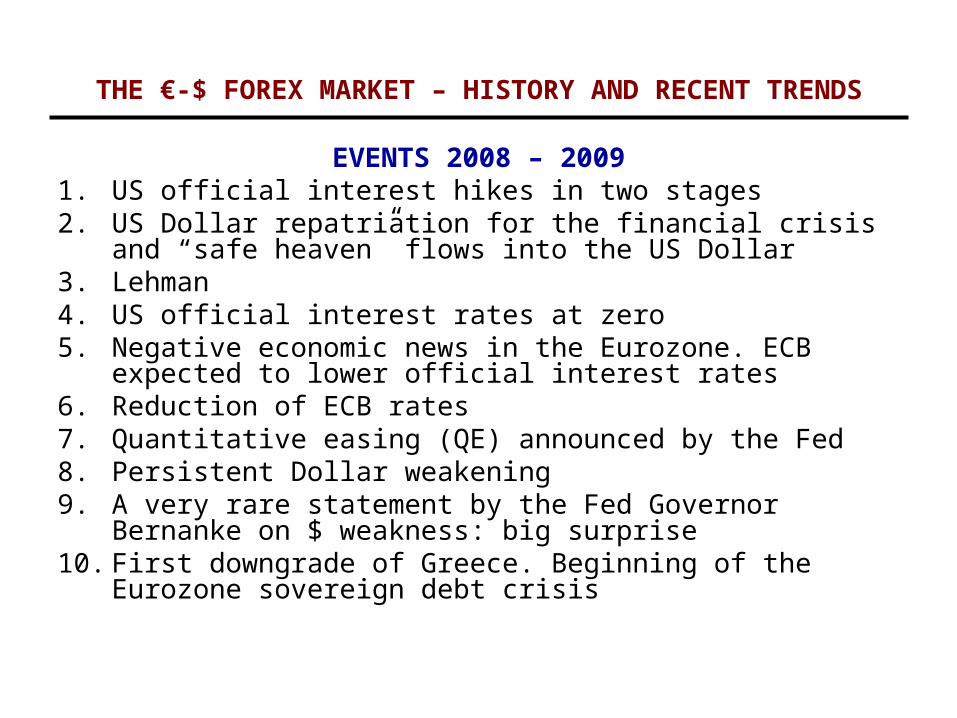
EVENTS 2008 – 20091. US official interest hikes in two stages2. US Dollar repatriation for the financial crisis and “safe
heaven” flows into the US Dollar3. Lehman4. US official interest rates at zero5. Negative economic news in the Eurozone. ECB expected to
lower official interest rates6. Reduction of ECB rates7. Quantitative easing (QE) announced by the Fed8. Persistent Dollar weakening 9. A very rare statement by the Fed Governor Bernanke on $
weakness: big surprise 10. First downgrade of Greece. Beginning of the Eurozone
sovereign debt crisis
THE €-$ FOREX MARKET – HISTORY AND RECENT TRENDS
EUR-USD DailyAt 4PM EST (Source Reuters, WSJ) - From Jan. 2,2008 To Present
2008 2009 2010 2011 2012 20131.15
1.20
1.25
1.30
1.35
1.40
1.45
1.50
1.55
1.60
(1)
(2)
(3)
(4)
(6)
(5)
(7)
(8) (9)
(10)
(11)
(12)
(13)
(14)
(15)
(16)
(17)
(18)
(19)
(20)
(21)
(22)
(23)
(24)
Yen Depr.
US TaperingIssues
THE €-$ FOREX MARKET – HISTORY AND RECENT TRENDS
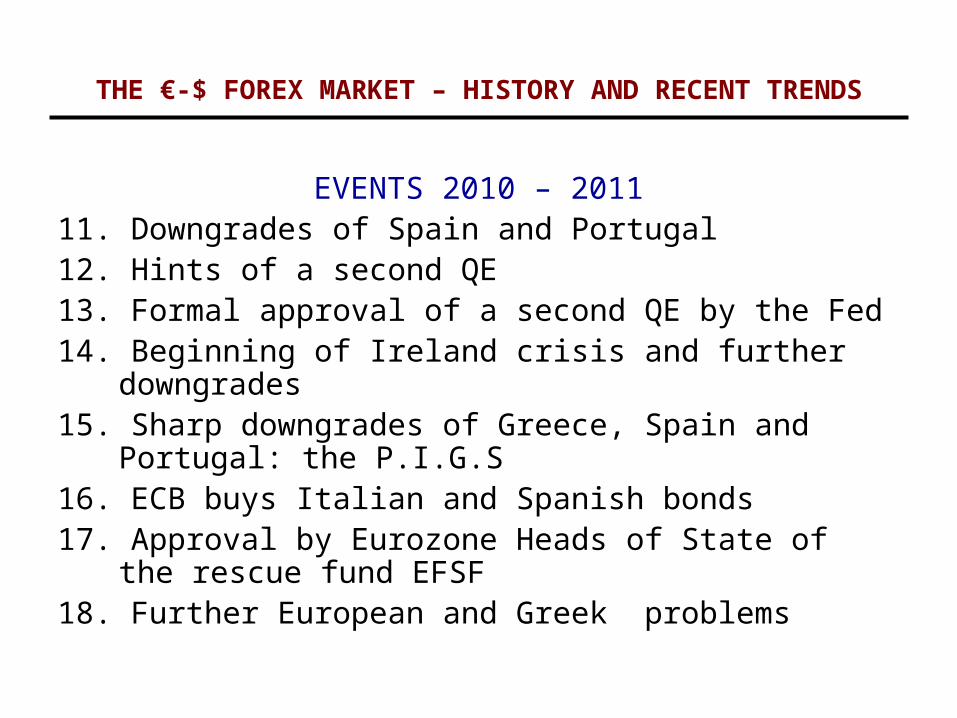
EVENTS 2010 – 201111. Downgrades of Spain and Portugal12. Hints of a second QE13. Formal approval of a second QE by the Fed14. Beginning of Ireland crisis and further downgrades15. Sharp downgrades of Greece, Spain and Portugal: the
P.I.G.S 16. ECB buys Italian and Spanish bonds17. Approval by Eurozone Heads of State of the rescue
fund EFSF18. Further European and Greek problems

THE €-$ FOREX MARKET – HISTORY AND RECENT TRENDS
EUR-USD DailyAt 4PM EST (Source Reuters, WSJ) - From Jan. 2,2008 To Present
2008 2009 2010 2011 2012 20131.15
1.20
1.25
1.30
1.35
1.40
1.45
1.50
1.55
1.60
(1)
(2)
(3)
(4)
(6)
(5)
(7)
(8) (9)
(10)
(11)
(12)
(13)
(14)
(15)
(16)
(17)
(18)
(19)
(20)
(21)
(22)
(23)
(24)
Yen Depr.
US TaperingIssues
THE €-$ FOREX MARKET – HISTORY AND RECENT TRENDS
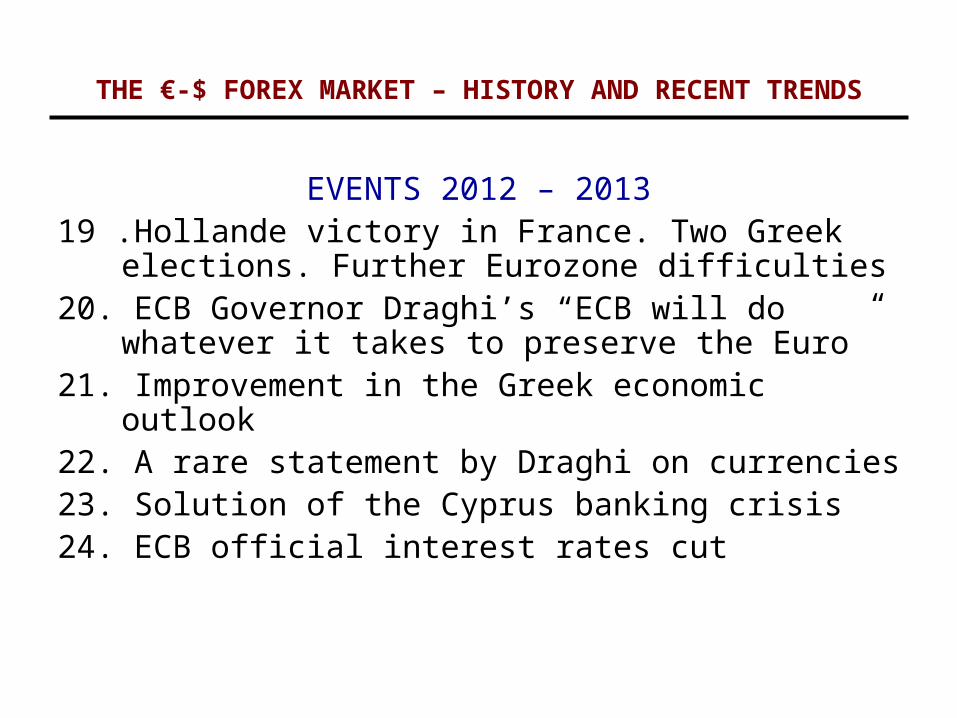
EVENTS 2012 – 201319 .Hollande victory in France. Two Greek elections.
Further Eurozone difficulties20. ECB Governor Draghi’s “ECB will do whatever it takes
to preserve the Euro”21. Improvement in the Greek economic outlook22. A rare statement by Draghi on currencies23. Solution of the Cyprus banking crisis 24. ECB official interest rates cut

THE €-$ FOREX MARKET – HISTORY AND RECENT TRENDS
36
37
38
39
40
41
42
43
44
4546
47
48
49
50
51
THE €-$ FOREX MARKET – HISTORY AND RECENT TRENDS
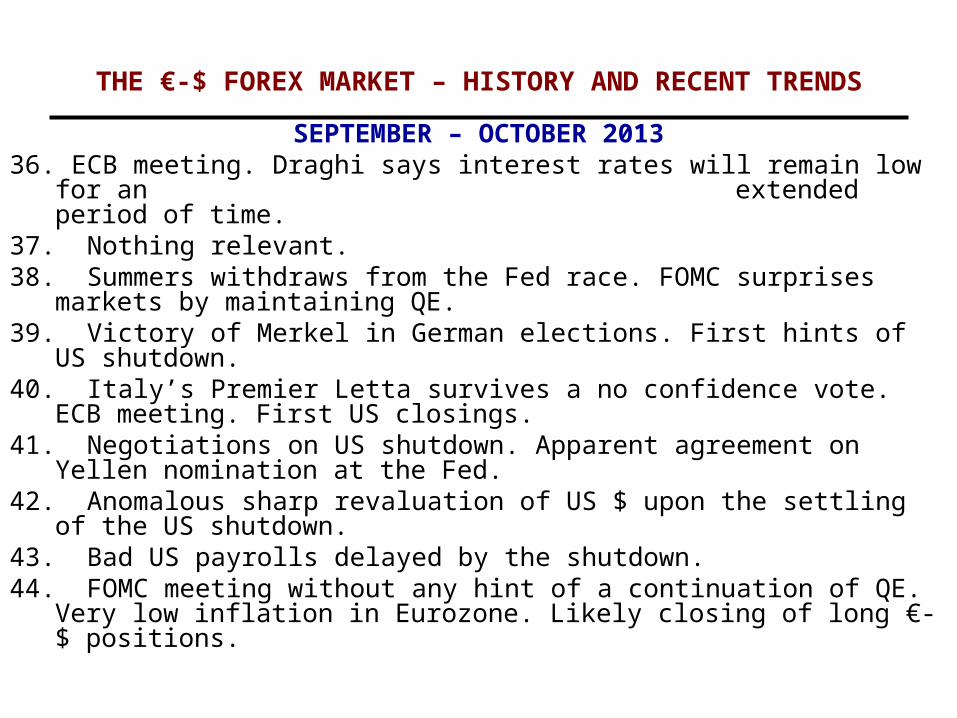
SEPTEMBER – OCTOBER 201336. ECB meeting. Draghi says interest rates will remain low for an
extended period of time.37. Nothing relevant.38. Summers withdraws from the Fed race. FOMC surprises markets
by maintaining QE.39. Victory of Merkel in German elections. First hints of US shutdown.40. Italy’s Premier Letta survives a no confidence vote. ECB meeting.
First US closings.41. Negotiations on US shutdown. Apparent agreement on Yellen
nomination at the Fed.42. Anomalous sharp revaluation of US $ upon the settling of the US
shutdown.43. Bad US payrolls delayed by the shutdown. 44. FOMC meeting without any hint of a continuation of QE. Very low
inflation in Eurozone. Likely closing of long €-$ positions.

THE €-$ FOREX MARKET – HISTORY AND RECENT TRENDS
36
37
38
39
40
41
42
43
44
4546
47
48
49
50
51

THE €-$ FOREX MARKET – HISTORY AND RECENT TRENDS
NOVEMBER – DECEMBER 201345. ECB cuts rates at regular meeting46. Nothing relevant47. Minutes of the of the FOMC with offsetting messages
on tapering QE48. Nothing relevant49. ECB meeting 50. Nothing relevant51. FOMC meeting: first steps away from QE. The Fed will
reduce its monthly buying of US bonds from 85 to 75 billions per month.

23
COURSE OUTLINE
1. THE €-$ FOREX MARKET - HISTORY AND RECENT TRENDS
2. FROM MACROECONOMIC FUNDAMENTALS TO MACRO NEWS
3. MACROECONOMIC SURPRISES – THE SCHEDULED NEWS
4. INFORMATION SOURCES OF SCHEDULED NEWS
5. IMPACT ON EXCHANGE RATES OF SCHEDULED NEWS
6. UNSCHEDULED NEWS AND THEIR IMPACT ON EXCHANGE RATES
7. HOW TO MEASURE NEWS IMPACT ON EXCHANGE RATES
8. A 3-ZONES ECONOMETRIC MODEL OF EXCHANGE RATES
9. FROM SIMULATION TO TRADING - OPTIMIZATION
10.MEASURING AND EVALUATING PERFORMANCE
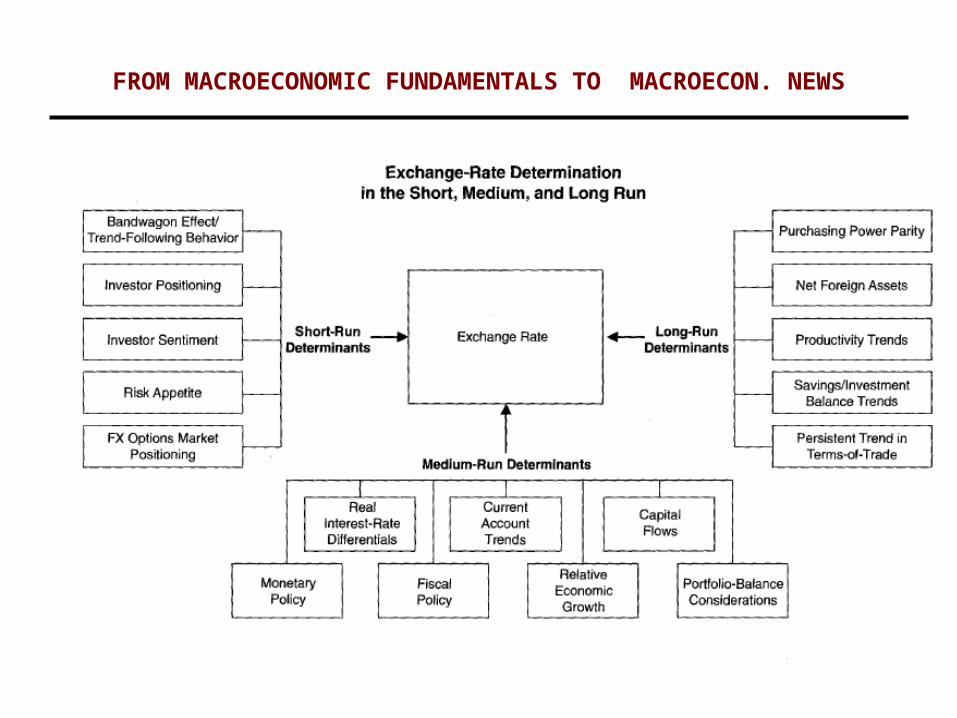
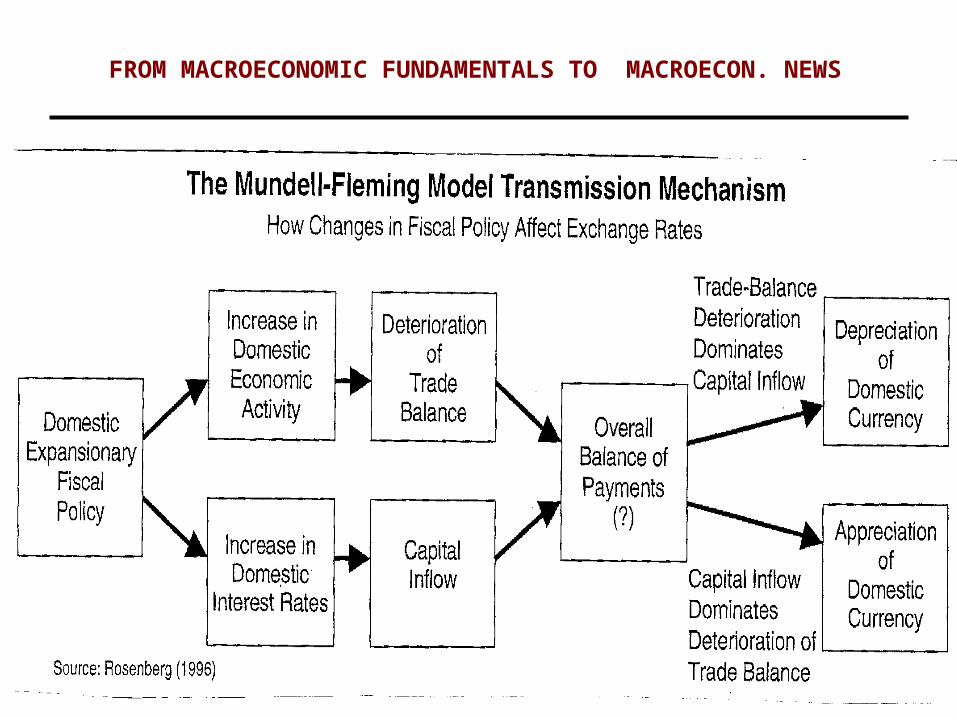
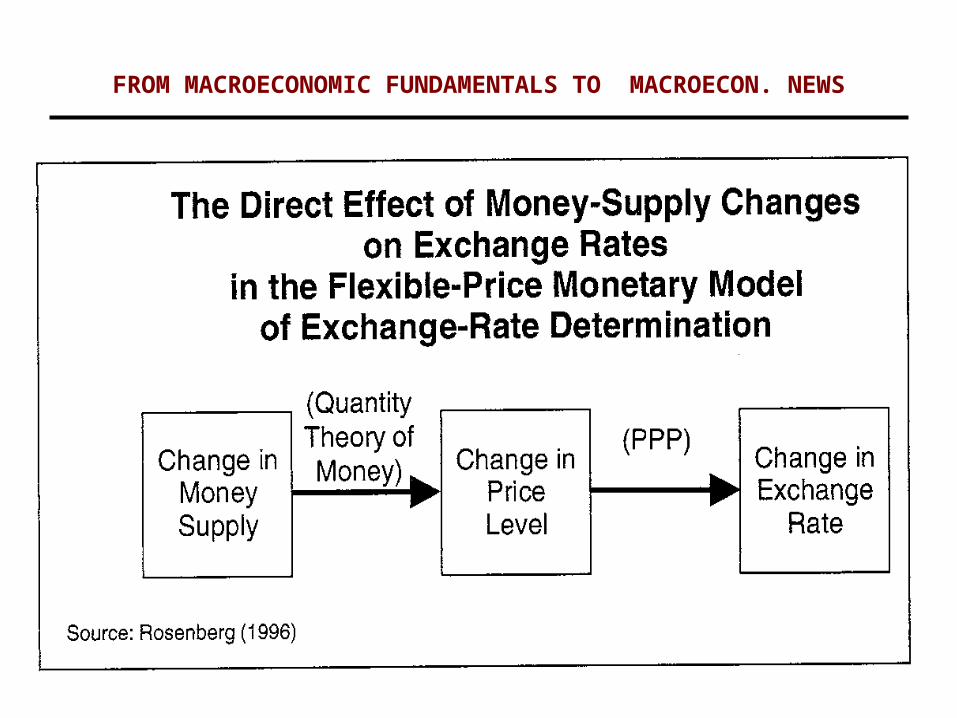
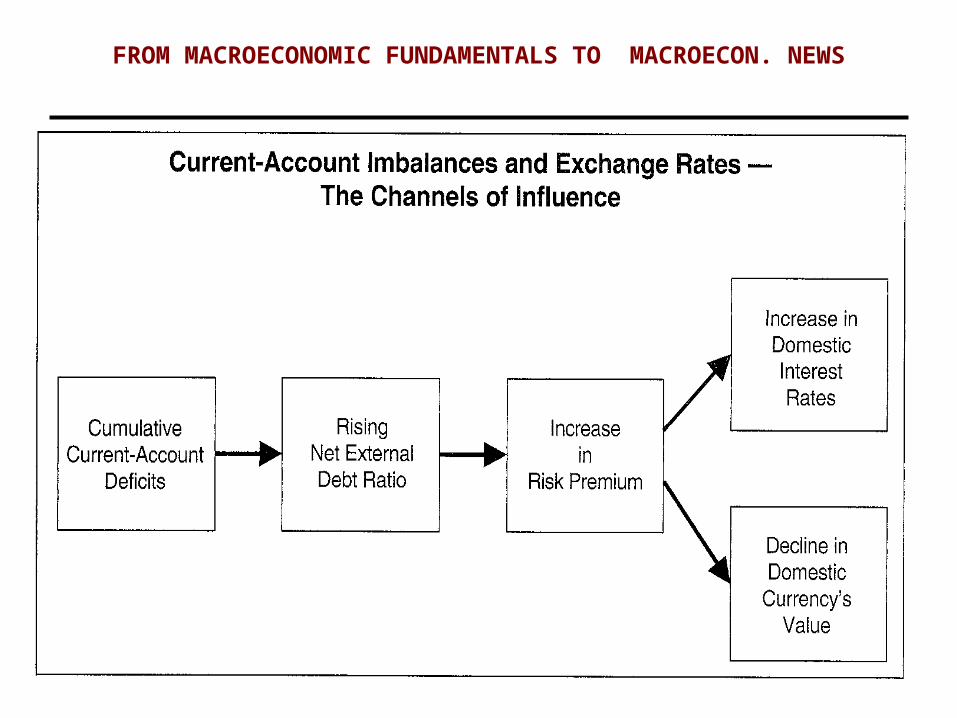
FROM MACROECONOMIC FUNDAMENTALS TO MACROECON. NEWS

FROM MACROECONOMIC FUNDAMENTALS TO MACROECON. NEWS
FROM MACROECONOMIC FUNDAMENTALS TO MACROECON. NEWS
FROM MACROECONOMIC FUNDAMENTALS TO MACROECON. NEWS

FROM MACROECONOMIC FUNDAMENTALS TO MACROECON. NEWS
FROM MACROECONOMIC FUNDAMENTALS TO MACROECON. NEWS
FROM MACROECONOMIC FUNDAMENTALS TO MACROECON. NEWS
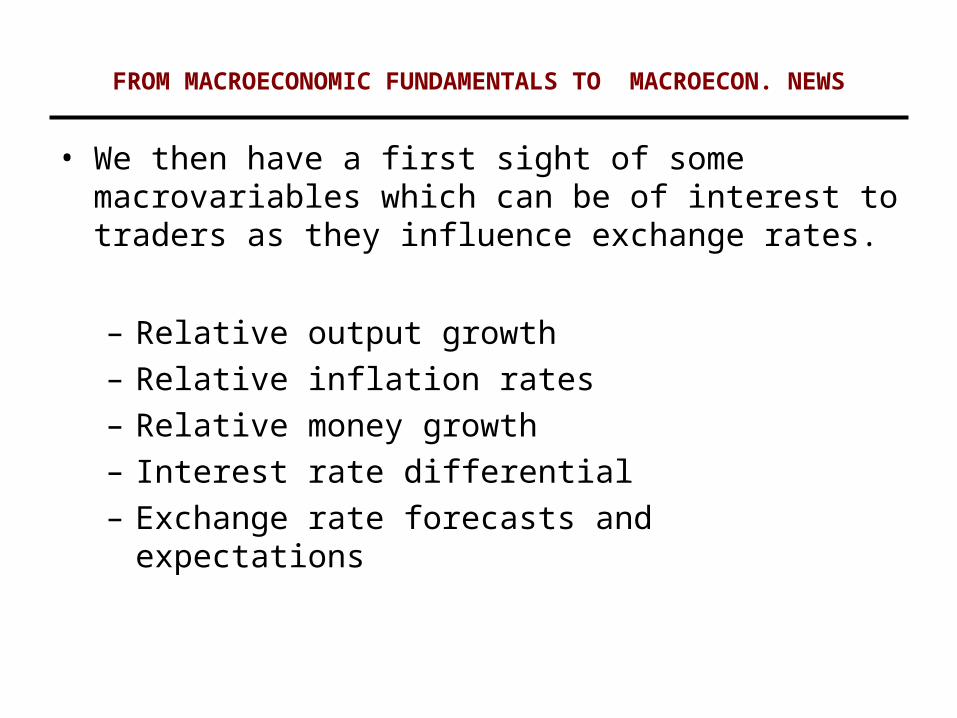
• We then have a first sight of some macrovariables which can be of interest to traders as they influence exchange rates.
– Relative output growth– Relative inflation rates– Relative money growth– Interest rate differential– Exchange rate forecasts and expectations
FROM MACROECONOMIC FUNDAMENTALS TO MACROECON. NEWS
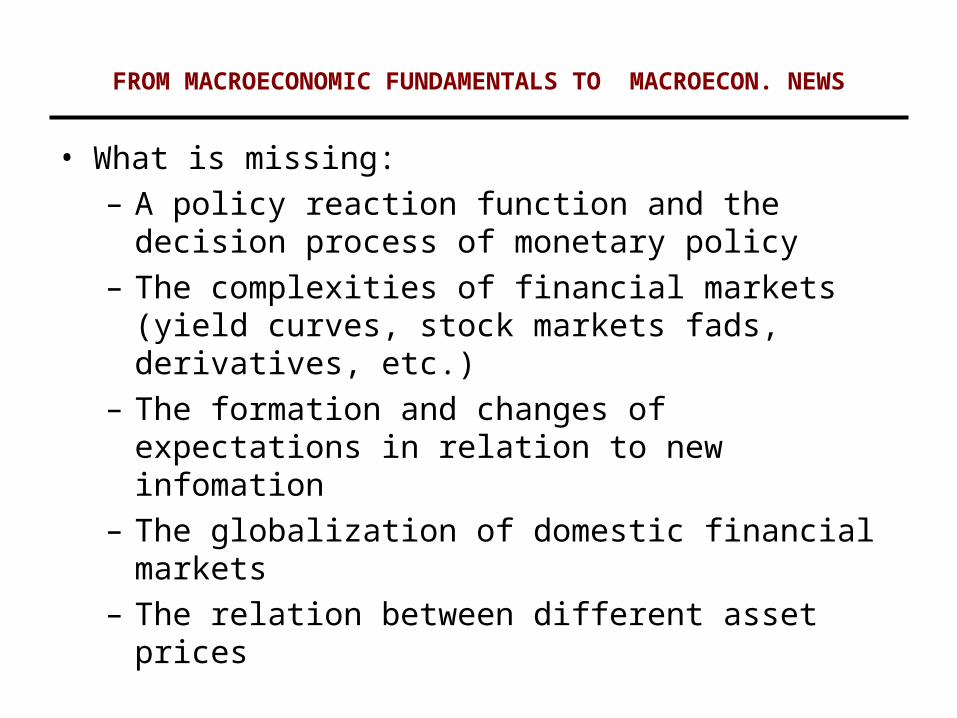
• What is missing:– A policy reaction function and the decision process of
monetary policy– The complexities of financial markets (yield curves,
stock markets fads, derivatives, etc.) – The formation and changes of expectations in relation
to new infomation – The globalization of domestic financial markets– The relation between different asset prices
32
COURSE OUTLINE
1. THE €-$ FOREX MARKET - HISTORY AND RECENT TRENDS
2. FROM MACROECONOMIC FUNDAMENTALS TO MACRO NEWS
3. MACROECONOMIC SURPRISES – THE SCHEDULED NEWS
4. INFORMATION SOURCES OF SCHEDULED NEWS
5. IMPACT ON EXCHANGE RATES OF SCHEDULED NEWS
6. UNSCHEDULED NEWS AND THEIR IMPACT ON EXCHANGE RATES
7. HOW TO MEASURE NEWS
8. IMPACT: A 3-ZONES ECONOMETRIC MODEL OF EXCHANGE RATES
9. FROM SIMULATION TO TRADING - OPTIMIZATION
10.MEASURING AND EVALUATING PERFORMANCE
33
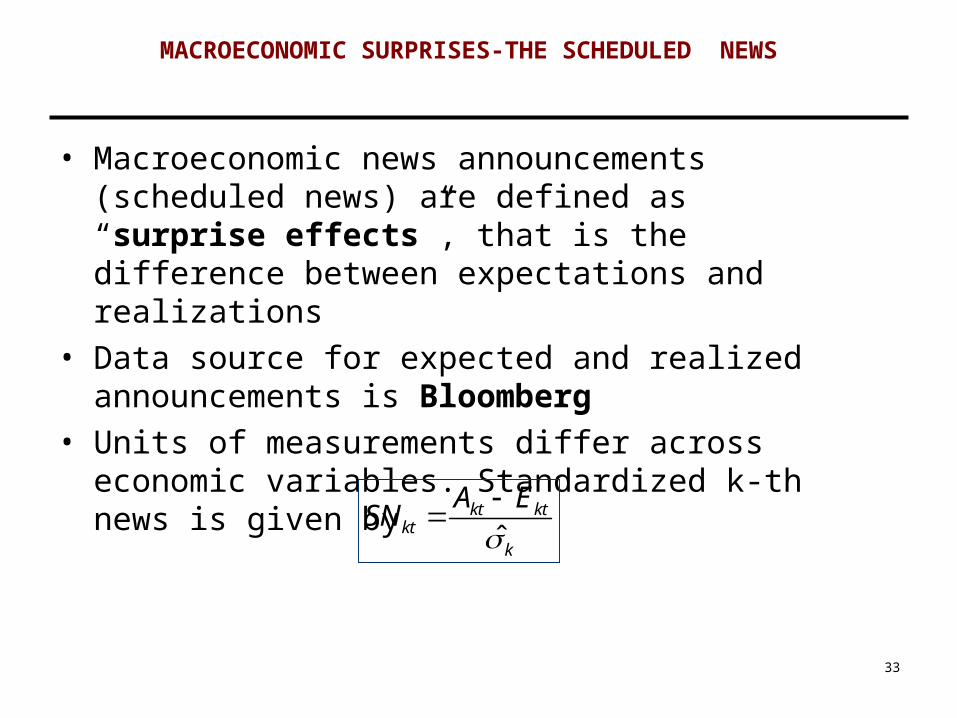
• Macroeconomic news announcements (scheduled news) are defined as “surprise effects”, that is the difference between expectations and realizations
• Data source for expected and realized announcements is Bloomberg
• Units of measurements differ across economic variables. Standardized k-th news is given by
ˆkt kt
ktk
A ESN
MACROECONOMIC SURPRISES-THE SCHEDULED NEWS

34
Scheduled News Frequency Measurement Unit Impact on €-$ Source
1 2 3 4
US Announcements
Forward-Looking Indicators
Non-farm Payrolls Monthly Units Negative Bloomberg
Initial Jobless Claims Monthly Units Negative Bloomberg
ISM (formerly NAPM) Manufatcture Index Monthly Diffusion Index Negative Bloomberg
ISM (formerly NAPM) Services Index Monthly Diffusion Index Negative Bloomberg
ISM (formerly NAPM) Chicago Monthly Diffusion Index Negative Bloomberg
Manufacture Index Philadelphia Fed Monthly Diffusion Index Negative Bloomberg
Consumer Confidence, Conference Board Monthly Weighted Index Negative Bloomberg
Consumer Confidence, Univ. of Michigan Monthly Weighted Index Negative Bloomberg
Leading Indicators Monthly % Var. Monthly Negative Bloomberg
MACROECONOMIC SURPRISES-THE SCHEDULED NEWS MAIN SCHEDULED NEWS IN ETZ ED ATZ

35
Scheduled News Frequency Measurement Unit Impact on €-$ Source
1 2 3 4
US Announcements
Other Indicators
Unemployment Rate Monthly Percentage Positive Bloomberg
Wage Rate, Non Farm Monthly % Var. Monthly Negative Bloomberg
Deflatore del GDP Monthly % Var. Quarterly Negative Bloomberg
Consumer Price Index Monthly % Var. Monthly Negative Bloomberg
Producer Price Index Monthly % Var. Monthly Negative Bloomberg
Producer Price Index,excl. Food&Energy Monthly % Var. Monthly Negative Bloomberg
GDP(advance,preliminary,final) Monthly % Var. Quarterly Negative Bloomberg
MACROECONOMIC SURPRISES-THE SCHEDULED NEWS MAIN SCHEDULED NEWS IN ETZ ED ATZ

36
Scheduled News Frequency Measurement Unit Impact on €-$ Source
1 2 3 4
US Announcements
Other Indicators
Retail Sales Monthly % Var. Monthly Negative Bloomberg
Retail Sales excl. Automobiles Monthly % Var. Monthly Negative Bloomberg
Industrial Production Monthly % Var. Monthly Negative Bloomberg
Durable Goods Monthly % Var. Monthly Negative Bloomberg
Factory Orders Monthly % Var. Monthly Negative Bloomberg
Personal Income Monthly % Var. Monthly Negative Bloomberg
Personal Consumption Monthly % Var. Monthly Negative Bloomberg
Trade Balance Monthly Billions di $ Negative Bloomberg
Current Account Balance Quarterly Billions di $ Negative Bloomberg
MACROECONOMIC SURPRISES-THE SCHEDULED NEWS MAIN SCHEDULED NEWS IN ETZ ED ATZ
37
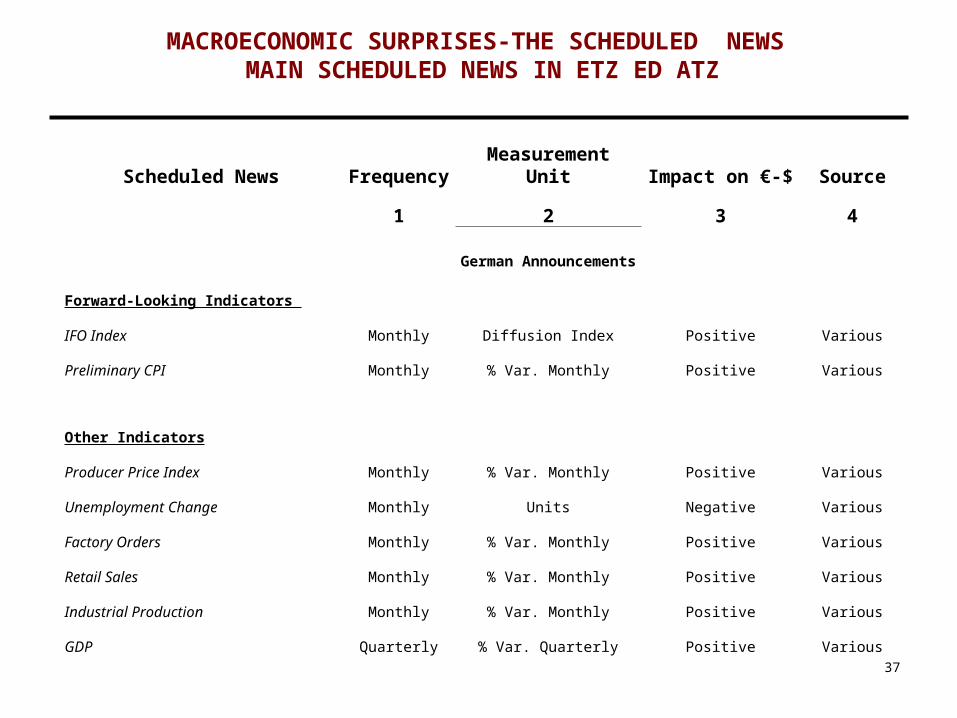
Scheduled News Frequency Measurement Unit Impact on €-$ Source
1 2 3 4
German Announcements
Forward-Looking Indicators
IFO Index Monthly Diffusion Index Positive Various
Preliminary CPI Monthly % Var. Monthly Positive Various
Other Indicators
Producer Price Index Monthly % Var. Monthly Positive Various
Unemployment Change Monthly Units Negative Various
Factory Orders Monthly % Var. Monthly Positive Various
Retail Sales Monthly % Var. Monthly Positive Various
Industrial Production Monthly % Var. Monthly Positive Various
GDP Quarterly % Var. Quarterly Positive Various
MACROECONOMIC SURPRISES-THE SCHEDULED NEWS MAIN SCHEDULED NEWS IN ETZ ED ATZ

38
COURSE OUTLINE
1. THE €-$ FOREX MARKET - HISTORY AND RECENT TRENDS
2. FROM MACROECONOMIC FUNDAMENTALS TO MACRO NEWS
3. MACROECONOMIC SURPRISES – THE SCHEDULED NEWS
4. INFORMATION SOURCES OF SCHEDULED NEWS
5. IMPACT ON EXCHANGE RATES OF SCHEDULED NEWS
6. UNSCHEDULED NEWS AND THEIR IMPACT ON EXCHANGE RATES
7. HOW TO MEASURE NEWS
8. IMPACT: A 3-ZONES ECONOMETRIC MODEL OF EXCHANGE RATES
9. FROM SIMULATION TO TRADING - OPTIMIZATION
10.MEASURING AND EVALUATING PERFORMANCE

INFORMATION SOURCES OF SCHEDULED NEWS
• Bloomberg, Reuters. The most reliable and expensive.• ForexFactory has the best cost-quality ratio (but there
could be equivalent ones)• Find your favoured one and stick to it (but occasionally
checking elsewhere).• Establish (with experience) your metrics of the news
impact as trading is a highly personal business.
40
COURSE OUTLINE
1. THE €-$ FOREX MARKET - HISTORY AND RECENT TRENDS
2. FROM MACROECONOMIC FUNDAMENTALS TO MACRO NEWS
3. MACROECONOMIC SURPRISES – THE SCHEDULED NEWS
4. INFORMATION SOURCES OF SCHEDULED NEWS
5. IMPACT ON EXCHANGE RATES OF SCHEDULED NEWS
6. UNSCHEDULED NEWS AND THEIR IMPACT ON EXCHANGE RATES
7. HOW TO MEASURE NEWS
8. IMPACT: A 3-ZONES ECONOMETRIC MODEL OF EXCHANGE RATES
9. FROM SIMULATION TO TRADING - OPTIMIZATION
10.MEASURING AND EVALUATING PERFORMANCE
IMPACT ON EXCHANGE RATES OF SCHEDULED NEWSTHE NON-FARM PAYROLLS AND THE UNEMPLOYMENT RATE IN
THE US LABOUR MARKET
• The US Non-farm Payrolls has by far the highest impact on world financial markets.
• It is the number of jobs added to the US economy outside the agricultural sector, in a highly flexible labour market.
• The impact is higher than that of Unemployment Rate and the two numbers come from different surveys.

IMPACT ON EXCHANGE RATES OF SCHEDULED NEWSREACTIONS TO THE US NON-FARM PAYROLLS
• In the following two slides we have the €-$ reactions in the last two months:
• The first chart indicates a reaction to a 160.000 Expected and a 236.000 Actual with unemployment rate going down.
• The second chart indicates a reaction to a 165.000 Expected and a 157.000 actual, with unemployment rate going up.

IMPACT ON EXCHANGE RATES OF SCHEDULED NEWS
REACTIONS TO THE US NON-FARM PAYROLLS NFP on March 8: Exp. 160.000 vs 236.000
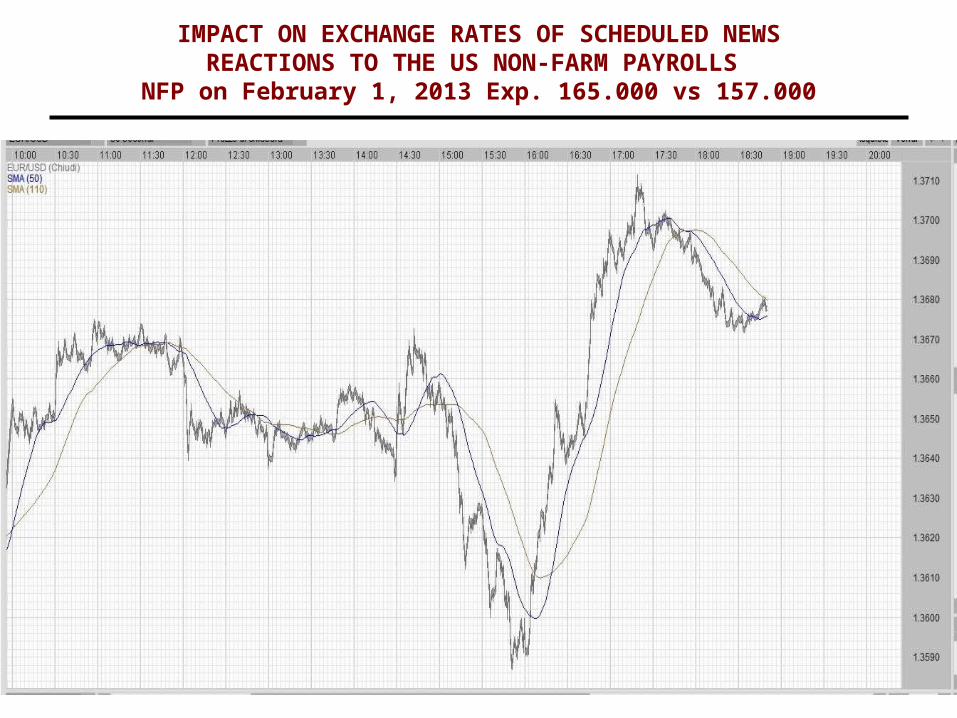
IMPACT ON EXCHANGE RATES OF SCHEDULED NEWSREACTIONS TO THE US NON-FARM PAYROLLS NFP on February 1, 2013 Exp. 165.000 vs 157.000
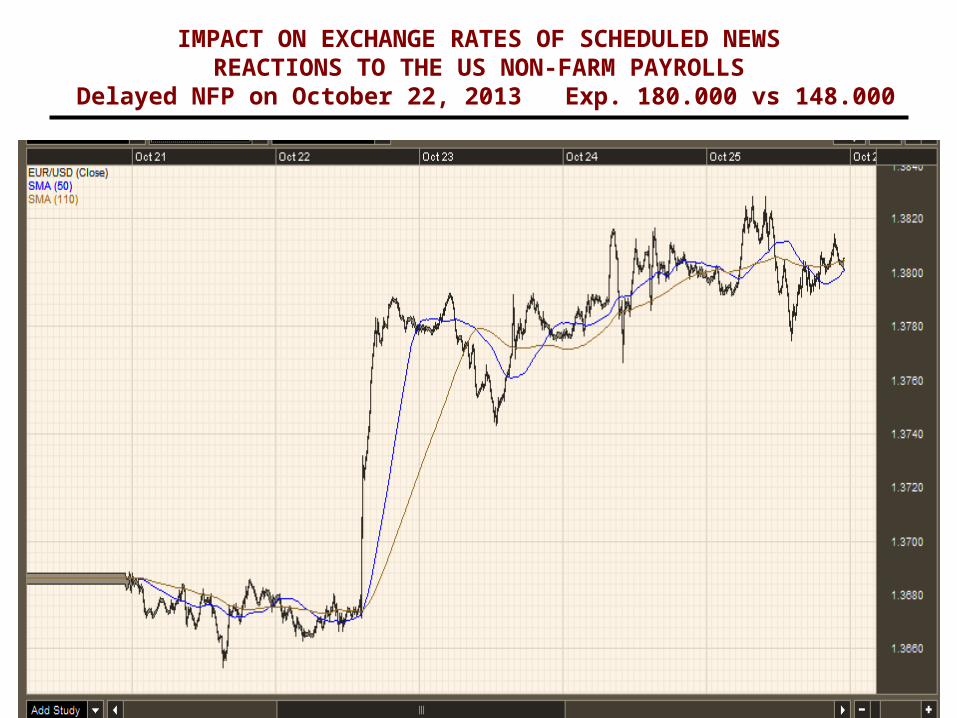
IMPACT ON EXCHANGE RATES OF SCHEDULED NEWSREACTIONS TO THE US NON-FARM PAYROLLS
Delayed NFP on October 22, 2013 Exp. 180.000 vs 148.000

IMPACT ON EXCHANGE RATES OF SCHEDULED NEWSREACTIONS TO THE US NON-FARM PAYROLLS
NFP on November 8, 2013 Exp. 120.000 vs 204.000

47
COURSE OUTLINE
1. THE €-$ FOREX MARKET - HISTORY AND RECENT TRENDS
2. FROM MACROECONOMIC FUNDAMENTALS TO MACRO NEWS
3. MACROECONOMIC SURPRISES – THE SCHEDULED NEWS
4. INFORMATION SOURCES OF SCHEDULED NEWS
5. IMPACT ON EXCHANGE RATES OF SCHEDULED NEWS
6. UNSCHEDULED NEWS AND THEIR IMPACT ON EXCHANGE RATES
7. HOW TO MEASURE NEWS
8. A 3-ZONES ECONOMETRIC MODEL OF EXCHANGE RATES
9. FROM SIMULATION TO TRADING - OPTIMIZATION
10.MEASURING AND EVALUATING PERFORMANCE
UNSCHEDULED NEWS AND THEIR IMPACT ON EXCHANGE RATES
Unscheduled news consists of an economic or institutional event, a declaration or a disclosure, which can be either totally unexpected or - even though expected to occur - has an unknown timing, or an unknown content ( or both ) and a time-varying reaction, frequently producing weird and ex-ante unpredictable movements in financial markets.

UNSCHEDULED NEWS AND THEIR IMPACT ON EXCHANGE RATESGRADUAL RESULTS OF THE ITALIAN ELECTIONS

UNSCHEDULED NEWS AND THEIR IMPACT ON EXCHANGE RATESREACTION (MONDAY, JTZ) TO THE CRISIS OF THE MONTI GOVERNMENT
IN ITALY (ON FRIDAY, IN ATZ)

UNSCHEDULED NEWS AND THEIR IMPACT ON EXCHANGE RATES
Public interventions by Central Banks in the foreign exchange market or statements by the same source announcing or threatening them ( Japanese Authorities is a good example).

UNSCHEDULED NEWS AND THEIR IMPACT ON EXCH. RATESECB RATE SETTING AND PRESS CONFERENCE FEB.7,2013
UNSCHEDULED NEWS AND THEIR IMPACT ON EXCHANGE RATES
Unexpected – or moderately so – changes of official interest rates or strong expectations about their changes whenever they remain invariant after a policy meeting or after policy statements, frequently by lower-ranking policy makers.
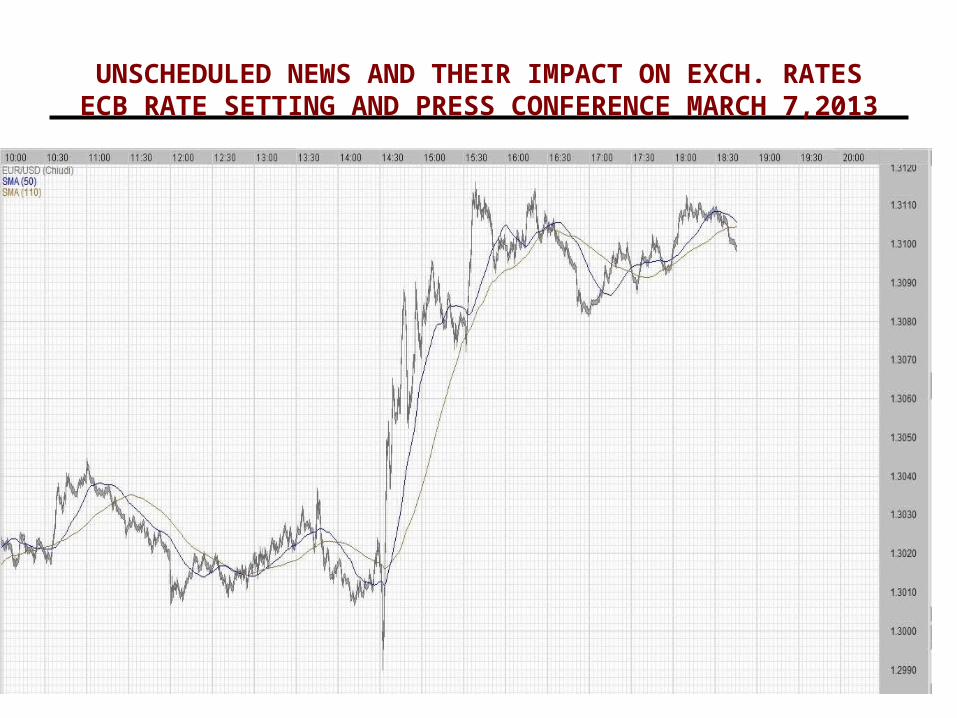
UNSCHEDULED NEWS AND THEIR IMPACT ON EXCH. RATESECB RATE SETTING AND PRESS CONFERENCE MARCH 7,2013
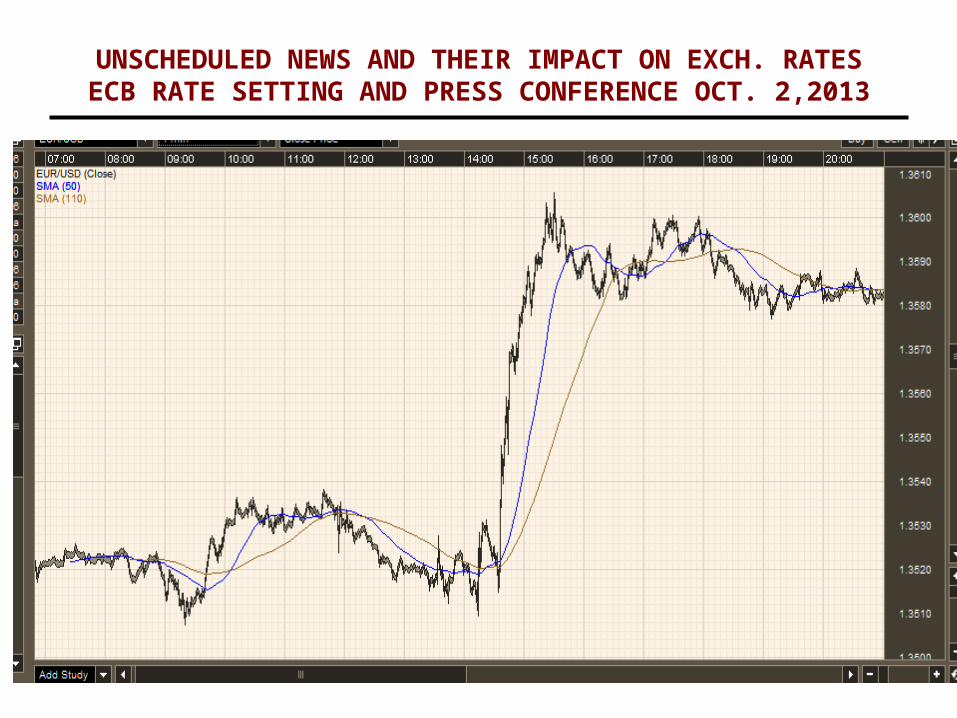
UNSCHEDULED NEWS AND THEIR IMPACT ON EXCH. RATESECB RATE SETTING AND PRESS CONFERENCE OCT. 2,2013
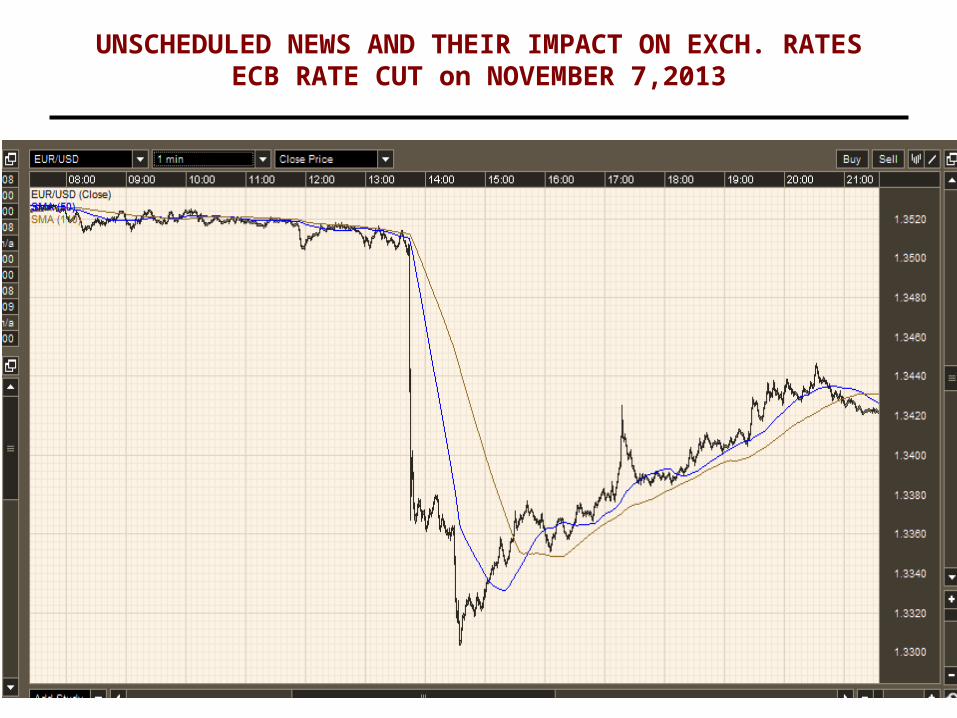
UNSCHEDULED NEWS AND THEIR IMPACT ON EXCH. RATESECB RATE CUT on NOVEMBER 7,2013

UNSCHEDULED NEWS AND THEIR IMPACT ON EXCH. RATESECB RATE SETTING AND PRESS CONFERENCE DEC. 5,2013
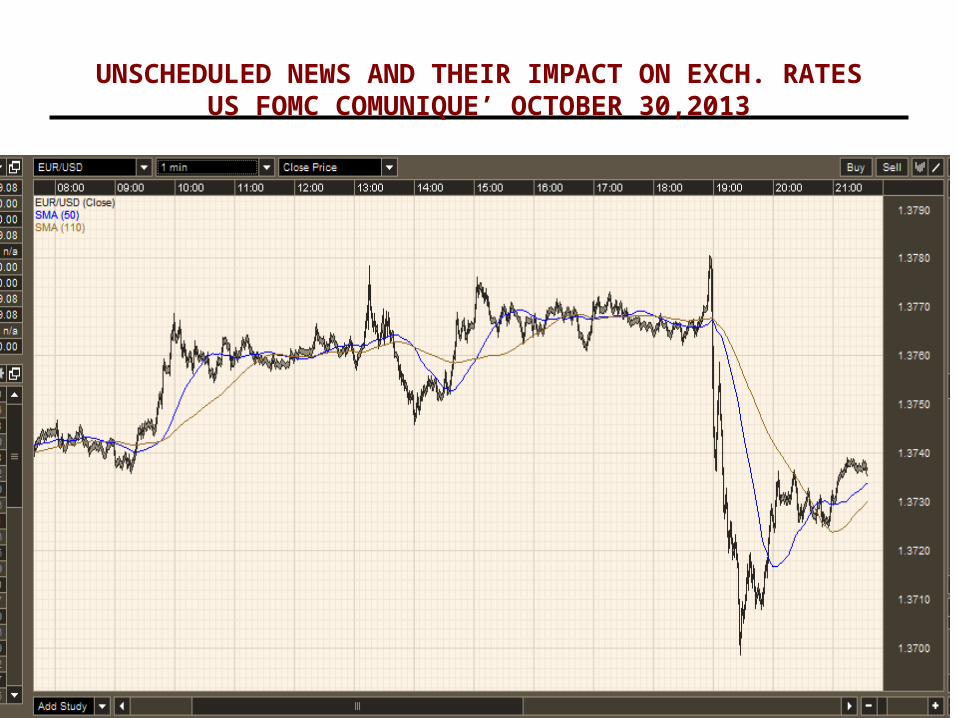
UNSCHEDULED NEWS AND THEIR IMPACT ON EXCH. RATESUS FOMC COMUNIQUE’ OCTOBER 30,2013
UNSCHEDULED NEWS AND THEIR IMPACT ON EXCHANGE RATES
Unexpected – or moderately so - upgrading or downgrading by Rating Agencies or official Institutions of entire countries or important financial Institutions.
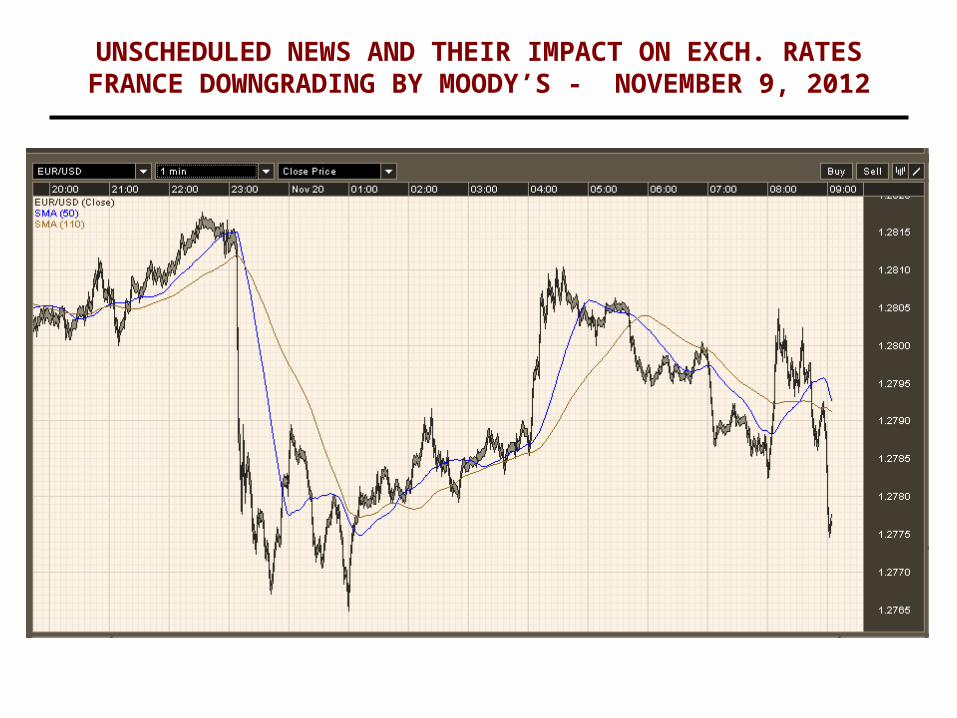
UNSCHEDULED NEWS AND THEIR IMPACT ON EXCH. RATESFRANCE DOWNGRADING BY MOODY’S - NOVEMBER 9, 2012

61
COURSE OUTLINE
1. THE €-$ FOREX MARKET - HISTORY AND RECENT TRENDS
2. FROM MACROECONOMIC FUNDAMENTALS TO MACRO NEWS
3. MACROECONOMIC SURPRISES – THE SCHEDULED NEWS
4. INFORMATION SOURCES OF SCHEDULED NEWS
5. IMPACT ON EXCHANGE RATES OF SCHEDULED NEWS
6. UNSCHEDULED NEWS AND THEIR IMPACT ON EXCHANGE RATES
7. HOW TO MEASURE NEWS
8. IMPACT: A 3-ZONES ECONOMETRIC MODEL OF EXCHANGE RATES
9. FROM SIMULATION TO TRADING - OPTIMIZATION
10.MEASURING AND EVALUATING PERFORMANCE

HOW TO MEASURE NEWS SCHEDULED NEWS
• SCHEDULED NEWS can be measured in 2 metric scales.
• The news scale measured by the standardized difference between ACTUAL VALUE (A) published in the newswires and EXPECTED VALUE (E) as computed by specialized Agencies.
• The impact on exchange rate as measured by the standard. variation over the 3 Time Zones.
ˆkt kt
ktk
A ESN
(€-$)ATZ – (€-$)ETZ
Stand.Error(ATZ-ETZ)

HOW TO MEASURE NEWS – SCHEDULED NEWSACTUAL AND EXPECTED NON-FARM PAYROLLS (NFP)
Date Act.NFP Exp.NFP Act-Exp STAND.(Act-Exp)
2011.01.07 103 160 -57 -0.56272011.02.04 36 140 -104 -1.02672011.03.04 192 200 -8 -0.07892011.04.01 216 200 16 0.15792011.05.06 244 185 59 0.58242011.06.03 54 170 -116 -1.14522011.07.08 18 105 -87 -0.85892011.08.05 117 75 42 0.41462011.09.02 0 60 -60 -0.59232011.10.07 103 65 38 0.37512011.11.04 80 90 -10 -0.09872011.12.02 120 131 -11 -0.10852012.01.06 200 150 50 0.49362012.02.03 243 135 108 1.06622012.03.09 227 204 23 0.2272012.04.06 120 201 -81 -0.79962012.05.04 115 165 -50 -0.49362012.06.01 69 150 -81 -0.79962012.07.06 80 90 -10 -0.09872012.08.03 163 100 63 0.62192012.09.07 96 125 -29 -0.28632012.10.05 114 113 1 0.0098
STANDARD ERROR OF ACTUAL LESS EXPECTED: 101.29
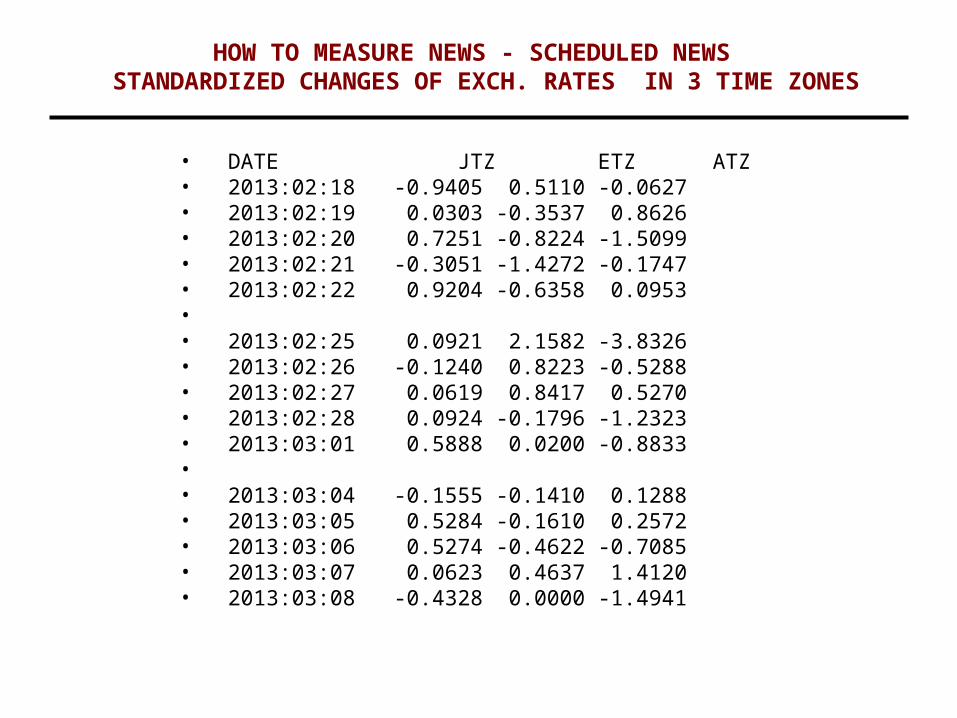
HOW TO MEASURE NEWS - SCHEDULED NEWS STANDARDIZED CHANGES OF EXCH. RATES IN 3 TIME ZONES
• DATE JTZ ETZ ATZ• 2013:02:18 -0.9405 0.5110 -0.0627• 2013:02:19 0.0303 -0.3537 0.8626• 2013:02:20 0.7251 -0.8224 -1.5099• 2013:02:21 -0.3051 -1.4272 -0.1747• 2013:02:22 0.9204 -0.6358 0.0953• • 2013:02:25 0.0921 2.1582 -3.8326• 2013:02:26 -0.1240 0.8223 -0.5288• 2013:02:27 0.0619 0.8417 0.5270• 2013:02:28 0.0924 -0.1796 -1.2323• 2013:03:01 0.5888 0.0200 -0.8833• • 2013:03:04 -0.1555 -0.1410 0.1288• 2013:03:05 0.5284 -0.1610 0.2572• 2013:03:06 0.5274 -0.4622 -0.7085• 2013:03:07 0.0623 0.4637 1.4120• 2013:03:08 -0.4328 0.0000 -1.4941

65
+1 €-$-Positive, $-¥-Negative, £-$-Positive News
- 1 €-$ or £-$ - Negative News, $-¥-Positive
0 No news
HOW TO MEASURE NEWS - UNSCHEDULED NEWS

66
COURSE OUTLINE
1. THE €-$ FOREX MARKET - HISTORY AND RECENT TRENDS
2. FROM MACROECONOMIC FUNDAMENTALS TO MACRO NEWS
3. MACROECONOMIC SURPRISES – THE SCHEDULED NEWS
4. INFORMATION SOURCES OF SCHEDULED NEWS
5. IMPACT ON EXCHANGE RATES OF SCHEDULED NEWS
6. UNSCHEDULED NEWS AND THEIR IMPACT ON EXCHANGE RATES
7. HOW TO MEASURE NEWS
8. IMPACT: A 3-ZONES ECONOMETRIC MODEL OF EXCHANGE RATES
9. FROM SIMULATION TO TRADING - OPTIMIZATION
10.MEASURING AND EVALUATING PERFORMANCE

67
GT Day(t-1)
Global Trading Day
(t)
21:00 5:00 13:00 21:00
JAPANESETIME ZONE
EUROPEANTIME ZONE
AMERICANTIME ZONE
(t-1)
A 3-ZONES ECONOMETRIC MODEL OF EXCHANGE RATES3 TRADING ZONES IN THE GLOBAL TRADING DAY
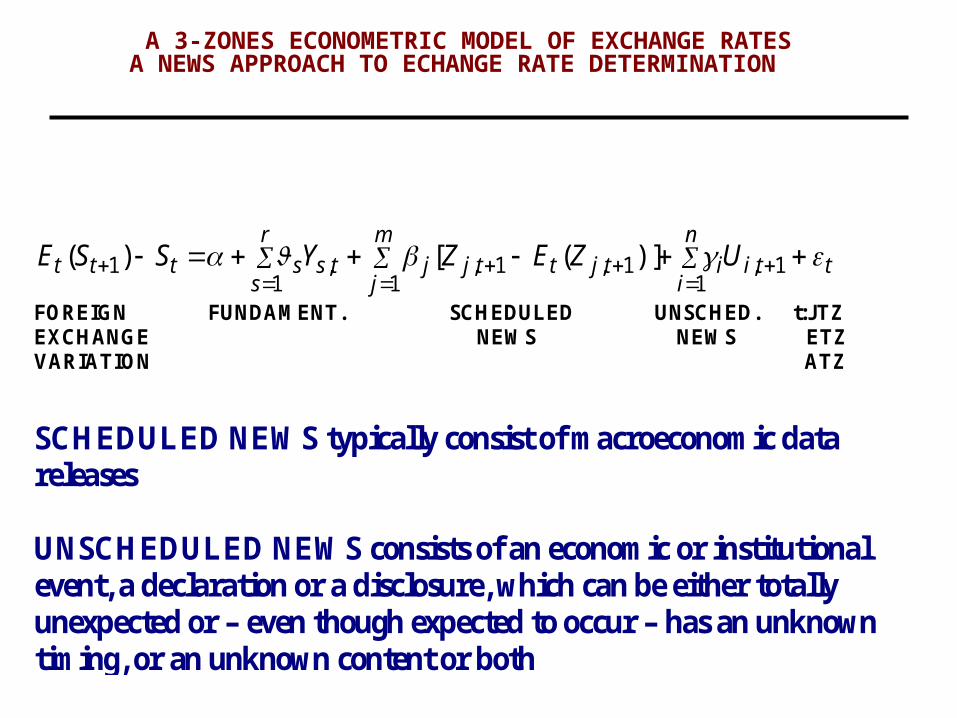
FOREIGN FUNDAMENT. SCHEDULED UNSCHED. t:JTZ EXCHANGE NEWS NEWS ETZ VARIATION ATZ
SCHEDULED NEWS typically consist of macroeconomic data releases UNSCHEDULED NEWS consists of an economic or institutional event, a declaration or a disclosure, which can be either totally unexpected or – even though expected to occur – has an unknown timing, or an unknown content or both
ttin
iitjttj
m
jjts
r
ssttt UZEZYSSE
1,
11,1,
1,
11 )]([)(
A 3-ZONES ECONOMETRIC MODEL OF EXCHANGE RATESA NEWS APPROACH TO ECHANGE RATE DETERMINATION
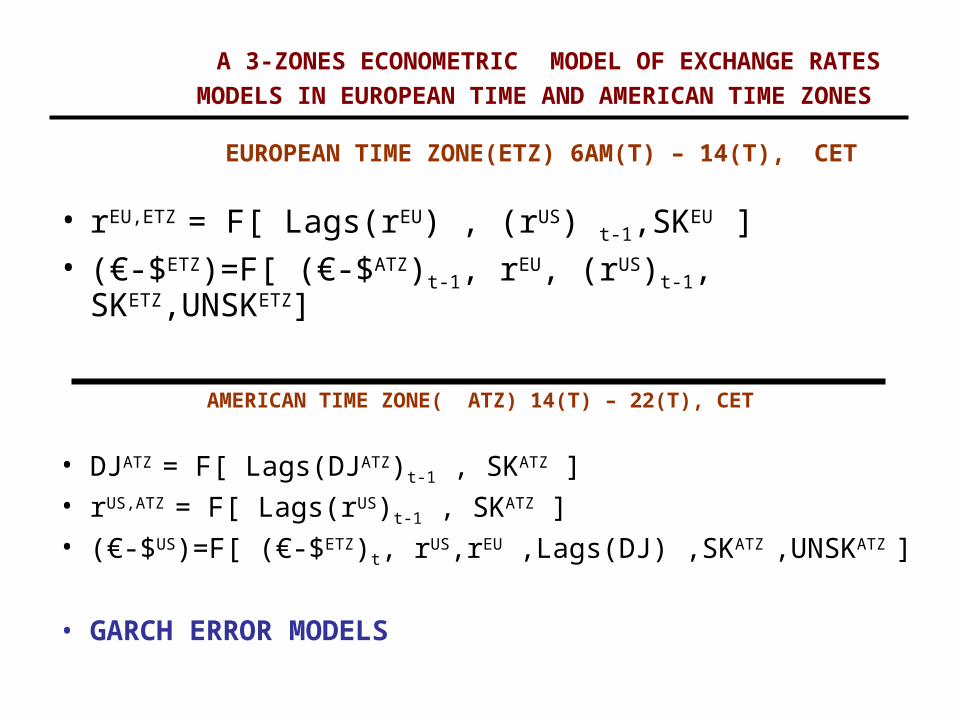
A 3-ZONES ECONOMETRIC MODEL OF EXCHANGE RATES
MODELS IN EUROPEAN TIME AND AMERICAN TIME ZONES
EUROPEAN TIME ZONE(ETZ) 6AM(T) – 14(T), CET
• rEU,ETZ = F[ Lags(rEU) , (rUS) t-1,SKEU ]• (€-$ETZ)=F[ (€-$ATZ)t-1, rEU, (rUS)t-1, SKETZ,UNSKETZ]
AMERICAN TIME ZONE( ATZ) 14(T) – 22(T), CET
• DJATZ = F[ Lags(DJATZ)t-1 , SKATZ ]• rUS,ATZ = F[ Lags(rUS)t-1 , SKATZ ]• (€-$US)=F[ (€-$ETZ)t, rUS,rEU ,Lags(DJ) ,SKATZ ,UNSKATZ ]
• GARCH ERROR MODELS

70
E E,t tN Hε 0
E E E 2 E1 + ( ) t t t H H
3
03 9 3 12
3 3 3 1
23 1 3 1 9 1 12 1
Β Γ
u
Γ u
u
sk
sk ε
sk
$/ ¥,
SK, E UNSK, EE €/ $,
£ / $,
( )
$/$/€/ $ €/ $£/ $ £/ $
i
t
t
t
UK EE
tt itE GE E E
i t tt t iE
US Et tt i
¥¥
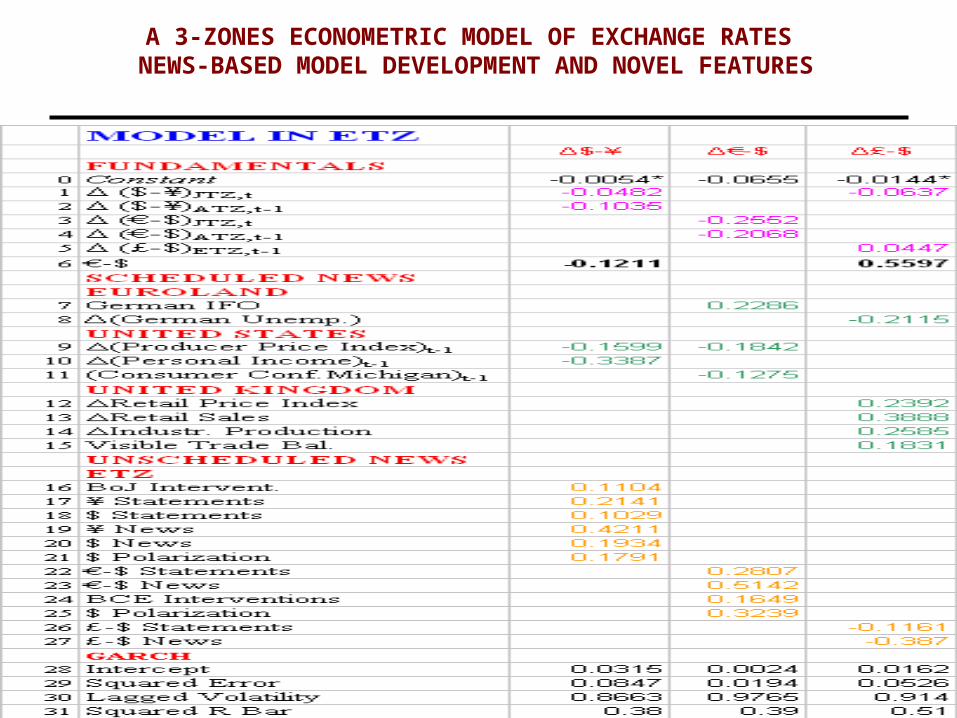
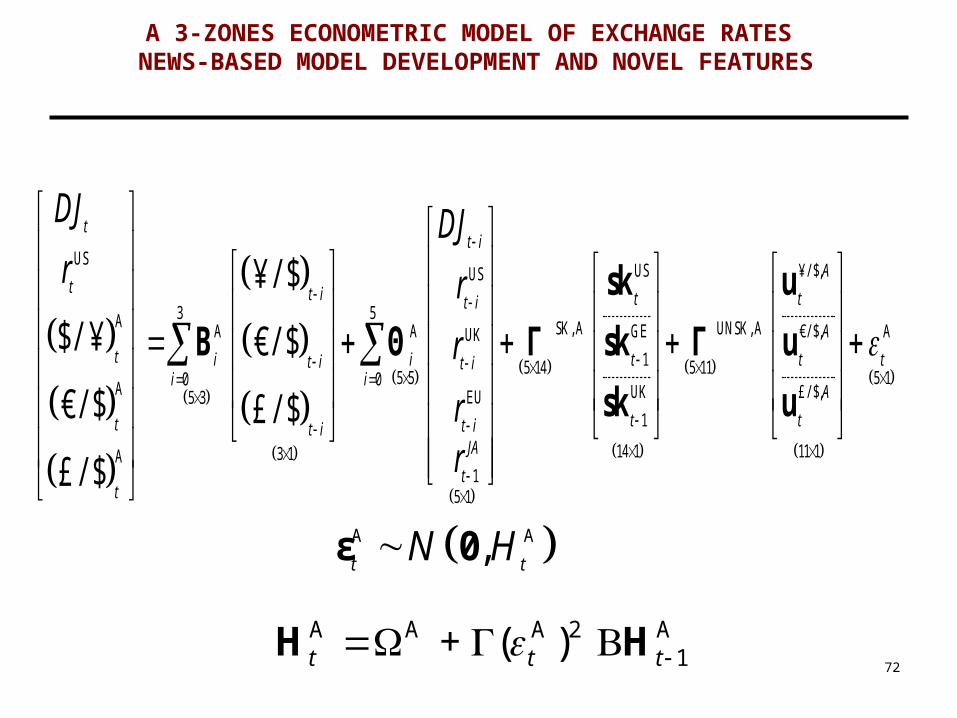
A 3-ZONES ECONOMETRIC MODEL OF EXCHANGE RATES NEWS-BASED MODEL DEVELOPMENT AND NOVEL FEATURES
71
A 3-ZONES ECONOMETRIC MODEL OF EXCHANGE RATES NEWS-BASED MODEL DEVELOPMENT AND NOVEL FEATURES
72
A A,t tN Hε 0
A A A 2 A1 + ( ) t t t H H
USUSUS
3 5A SK, AA A GEUK15 14 55 50 0A UKEU5 31
14 13 1A1
5 1
/ $
$/ €/ $
€/ $ £/ $
£/ $
tt i
t t i tt i
t i i tt i t ii i
tt t it iJA
tt
DJ DJr r
r
rr
¥
¥sk
Β Θ Γ sk Γ
sk
/ $,
UNSK, A €/ $, A
11 5 1£/ $,
11 1
A
t
A
t t
A
t
¥u
u
u
A 3-ZONES ECONOMETRIC MODEL OF EXCHANGE RATES NEWS-BASED MODEL DEVELOPMENT AND NOVEL FEATURES

73
A 3-ZONES ECONOMETRIC MODEL OF EXCHANGE RATES NEWS-BASED MODEL DEVELOPMENT AND NOVEL FEATURES
74
COURSE OUTLINE
1. THE €-$ FOREX MARKET - HISTORY AND RECENT TRENDS
2. FROM MACROECONOMIC FUNDAMENTALS TO MACRO NEWS
3. MACROECONOMIC SURPRISES – THE SCHEDULED NEWS
4. INFORMATION SOURCES OF SCHEDULED NEWS
5. IMPACT ON EXCHANGE RATES OF SCHEDULED NEWS
6. UNSCHEDULED NEWS AND THEIR IMPACT ON EXCHANGE RATES
7. HOW TO MEASURE NEWS
8. IMPACT: A 3-ZONES ECONOMETRIC MODEL OF EXCHANGE RATES
9. FROM SIMULATION TO TRADING - OPTIMIZATION
10.MEASURING AND EVALUATING PERFORMANCE

FROM SIMULATION TO TRADING - OVERVIEW
• In this course we will examine four protocols which can be used with a short-term econometric model:
• Directional Trading
• Contrarian Trading, news-assisted mode
• Contrarian trading, automatic mode
• Mixed Trading: Directional plus “Contrarian” at Stop Loss
• Baseline (for a benchmark)
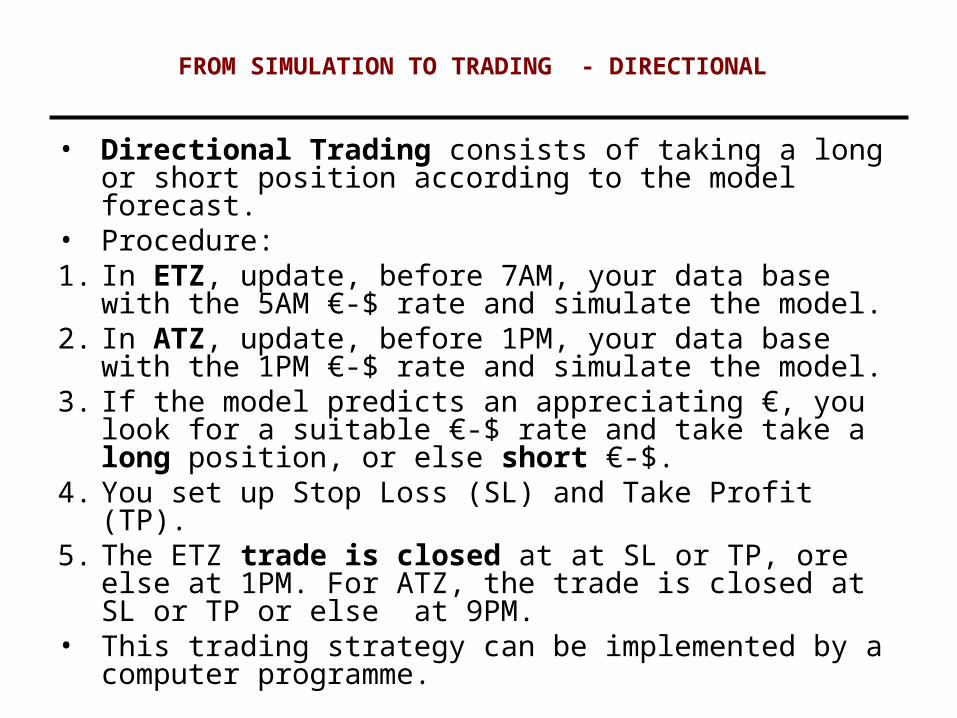
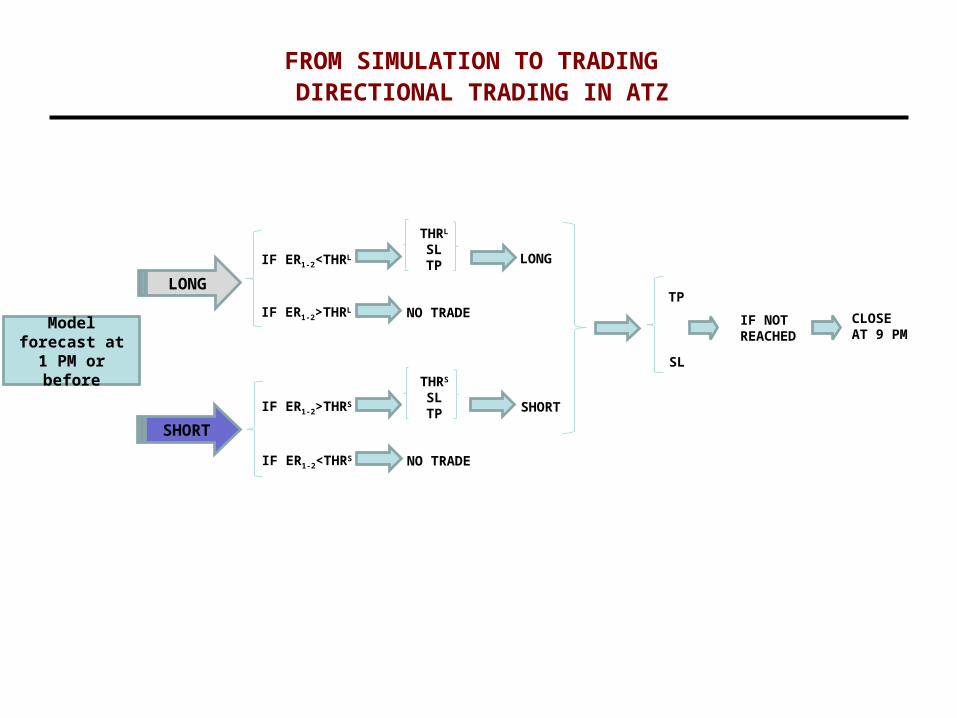
FROM SIMULATION TO TRADING - DIRECTIONAL
• Directional Trading consists of taking a long or short position according to the model forecast.
• Procedure:1. In ETZ, update, before 7AM, your data base with the
5AM €-$ rate and simulate the model.2. In ATZ, update, before 1PM, your data base with the
1PM €-$ rate and simulate the model.3. If the model predicts an appreciating €, you look for a
suitable €-$ rate and take take a long position, or else short €-$.
4. You set up Stop Loss (SL) and Take Profit (TP). 5. The ETZ trade is closed at at SL or TP, ore else at
1PM. For ATZ, the trade is closed at SL or TP or else at 9PM.
• This trading strategy can be implemented by a computer programme.
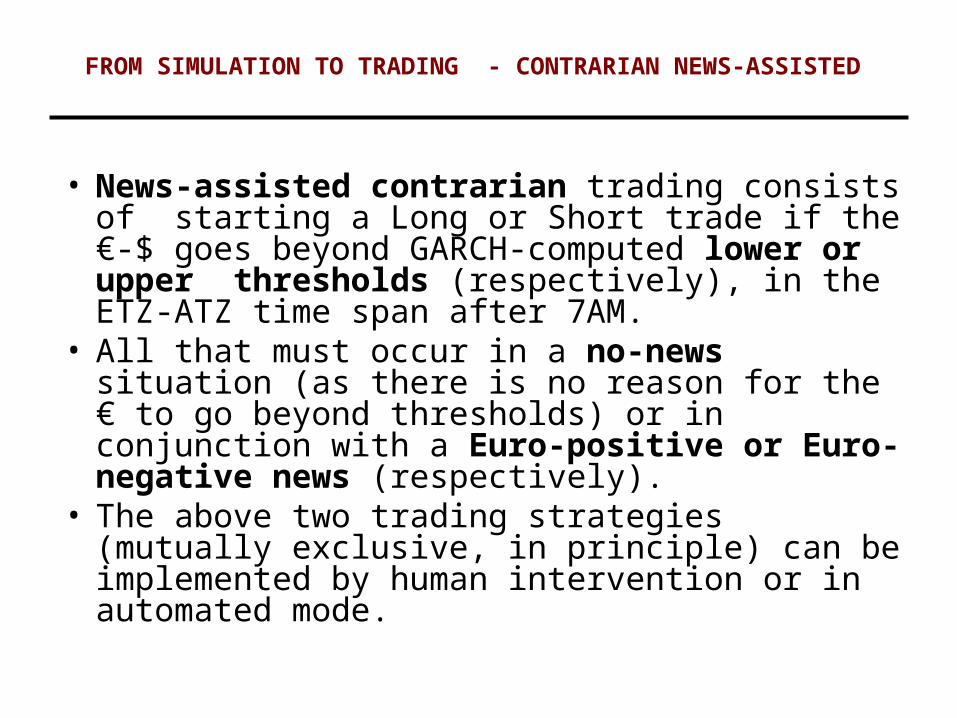
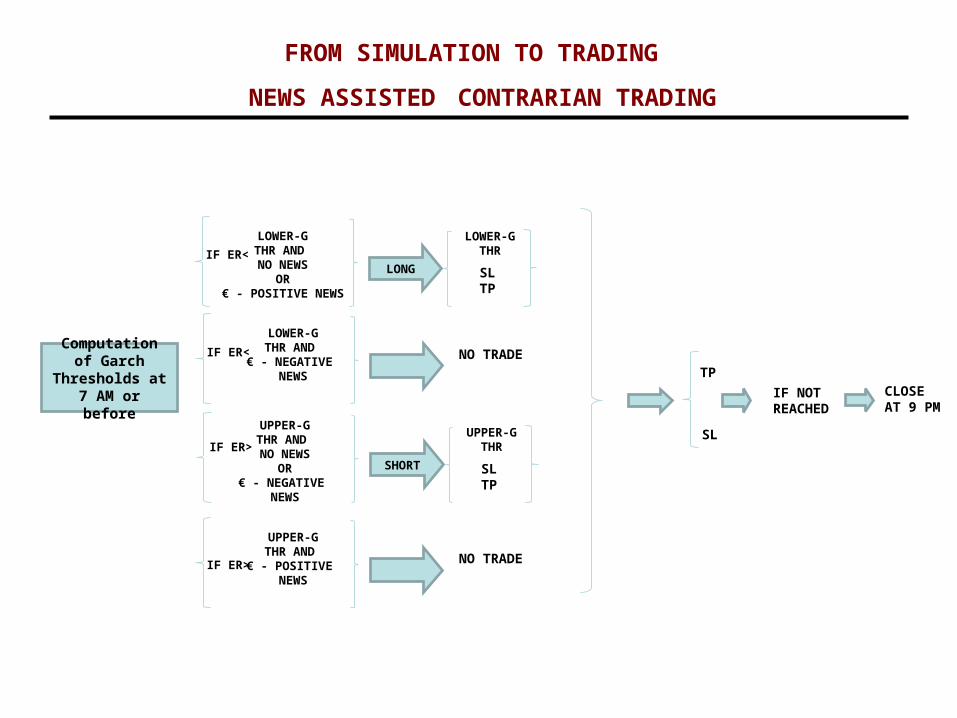
FROM SIMULATION TO TRADING - CONTRARIAN NEWS-ASSISTED
• News-assisted contrarian trading consists of starting a Long or Short trade if the €-$ goes beyond GARCH-computed lower or upper thresholds (respectively), in the ETZ-ATZ time span after 7AM.
• All that must occur in a no-news situation (as there is no reason for the € to go beyond thresholds) or in conjunction with a Euro-positive or Euro-negative news (respectively).
• The above two trading strategies (mutually exclusive, in principle) can be implemented by human intervention or in automated mode.

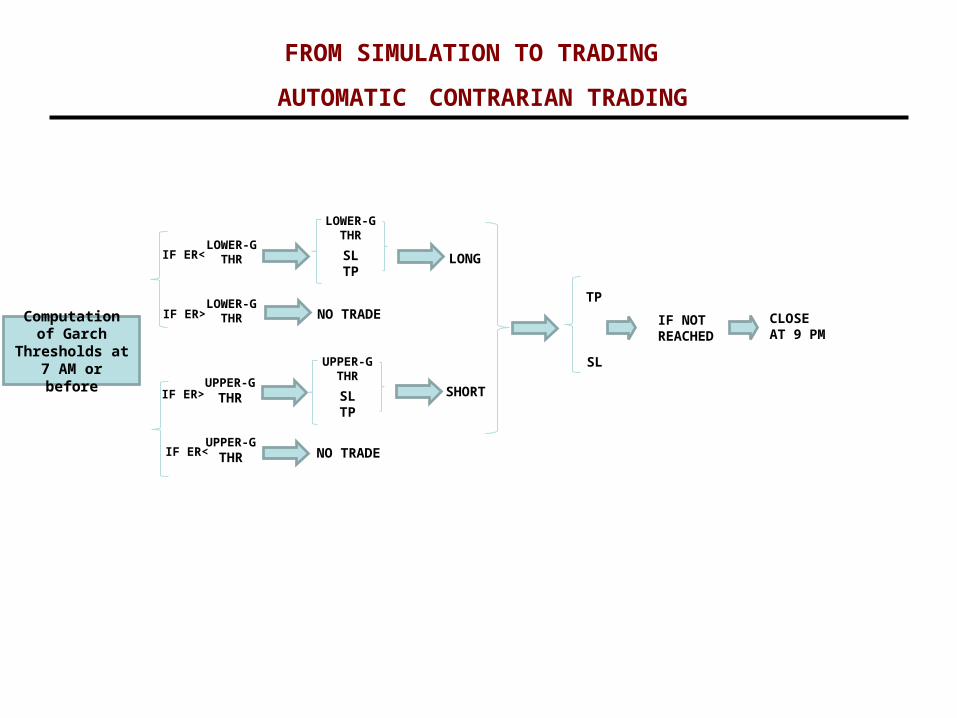
FROM SIMULATION TO TRADING - CONTRARIAN AUTOMATED
• Automated contrarian trading consists of starting a Long or Short trade whenever the €-$ goes beyond GARCH-computed lower or upper thresholds (respectively), in the ETZ-ATZ time span after 7AM.
• Contrary to the news-assisted protocol, the trade begins mechanically if the € goes beyond GARCH thresholds.
• This trading strategy can be implemented by a computer programme.
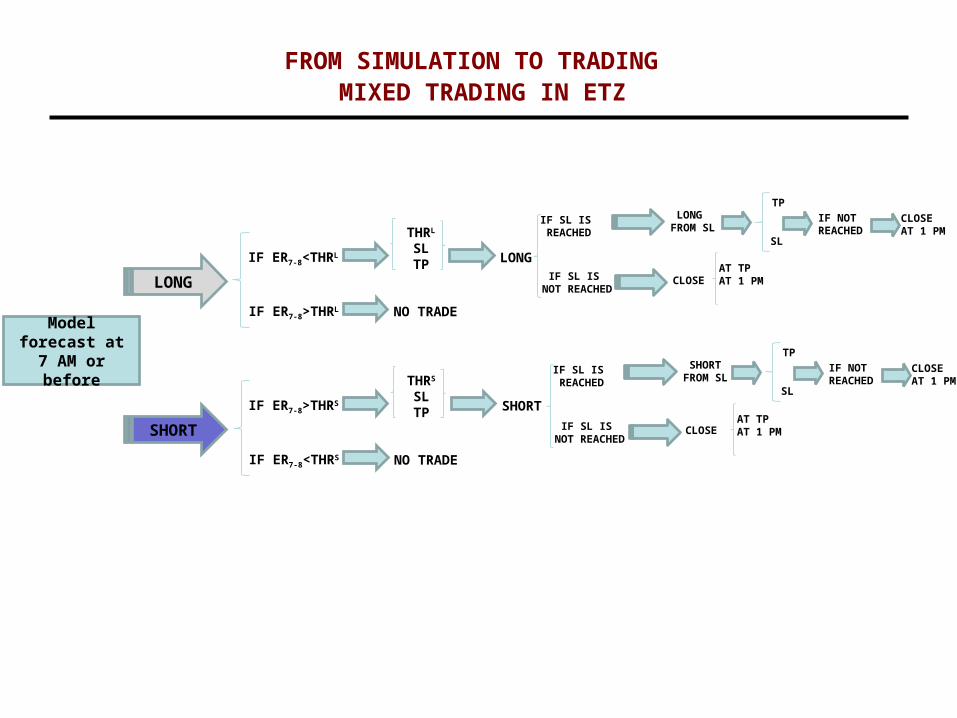
FROM SIMULATION TO TRADING - MIXED
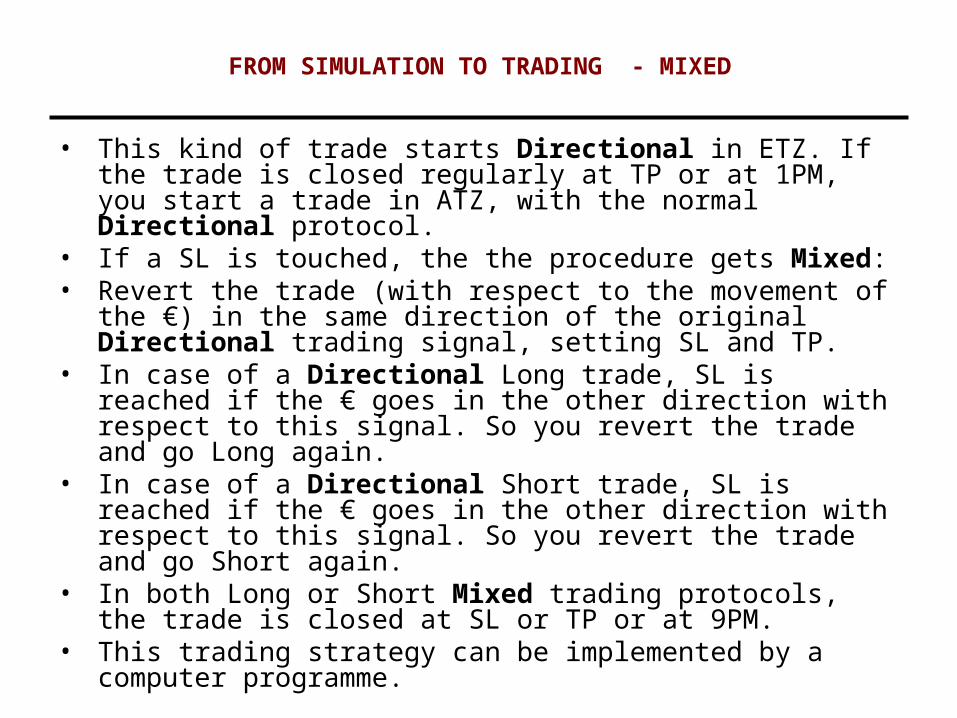
• This kind of trade starts Directional in ETZ. If the trade is closed regularly at TP or at 1PM, you start a trade in ATZ, with the normal Directional protocol.
• If a SL is touched, the the procedure gets Mixed: • Revert the trade (with respect to the movement of the €)
in the same direction of the original Directional trading signal, setting SL and TP.
• In case of a Directional Long trade, SL is reached if the € goes in the other direction with respect to this signal. So you revert the trade and go Long again.
• In case of a Directional Short trade, SL is reached if the € goes in the other direction with respect to this signal. So you revert the trade and go Short again.
• In both Long or Short Mixed trading protocols, the trade is closed at SL or TP or at 9PM.
• This trading strategy can be implemented by a computer programme.
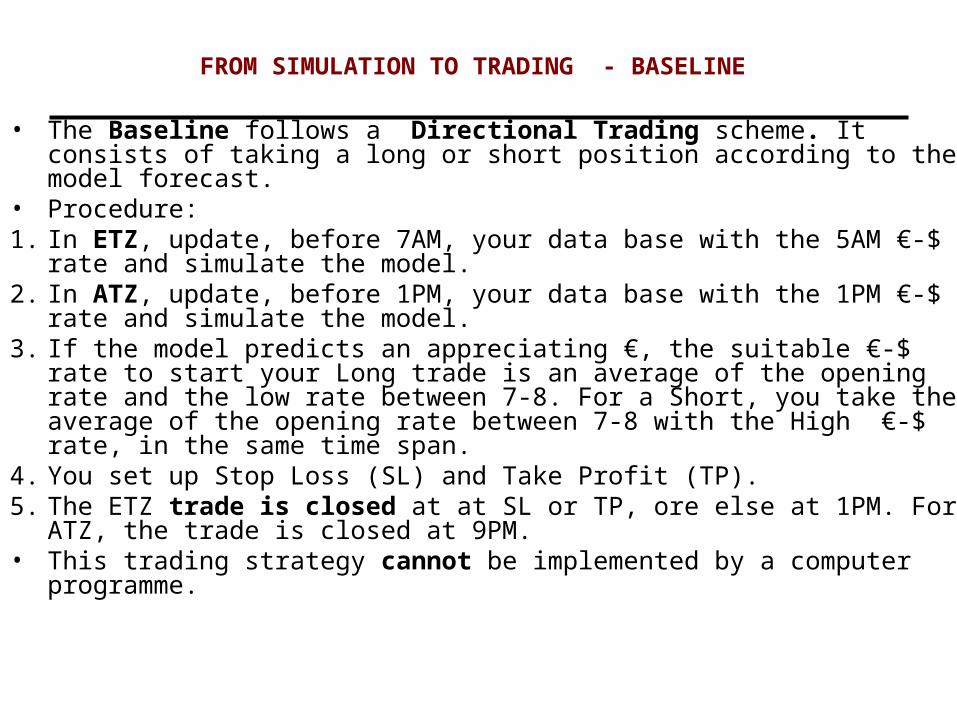
FROM SIMULATION TO TRADING - BASELINE
• The Baseline follows a Directional Trading scheme. It consists of taking a long or short position according to the model forecast.
• Procedure:1. In ETZ, update, before 7AM, your data base with the 5AM €-$ rate and
simulate the model.2. In ATZ, update, before 1PM, your data base with the 1PM €-$ rate and
simulate the model.3. If the model predicts an appreciating €, the suitable €-$ rate to start
your Long trade is an average of the opening rate and the low rate between 7-8. For a Short, you take the average of the opening rate between 7-8 with the High €-$ rate, in the same time span.
4. You set up Stop Loss (SL) and Take Profit (TP). 5. The ETZ trade is closed at at SL or TP, ore else at 1PM. For ATZ, the
trade is closed at 9PM.• This trading strategy cannot be implemented by a computer
programme.
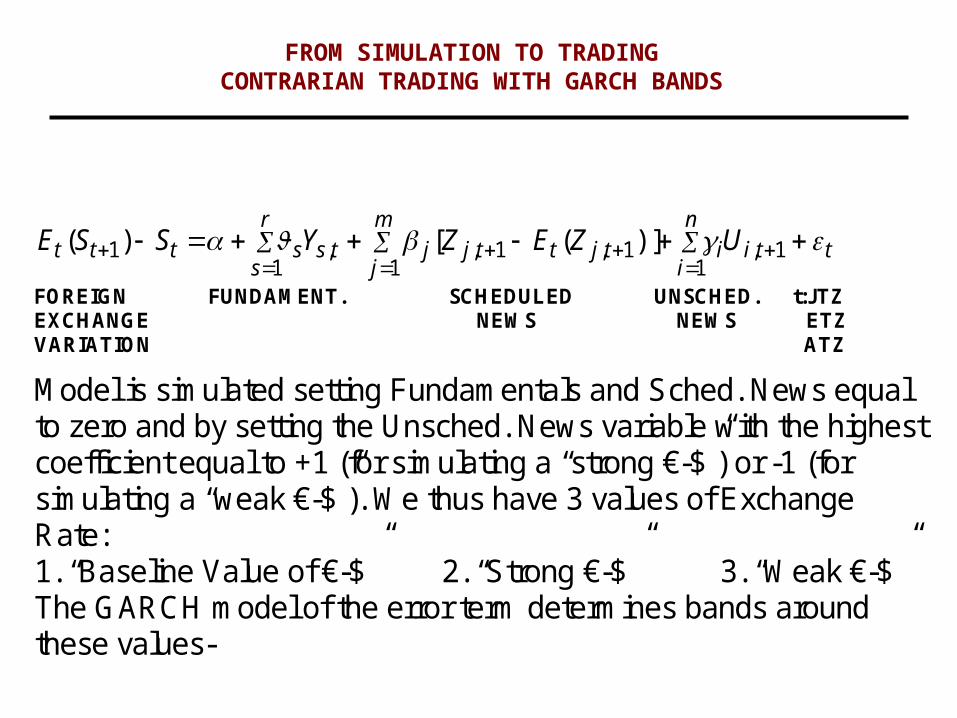
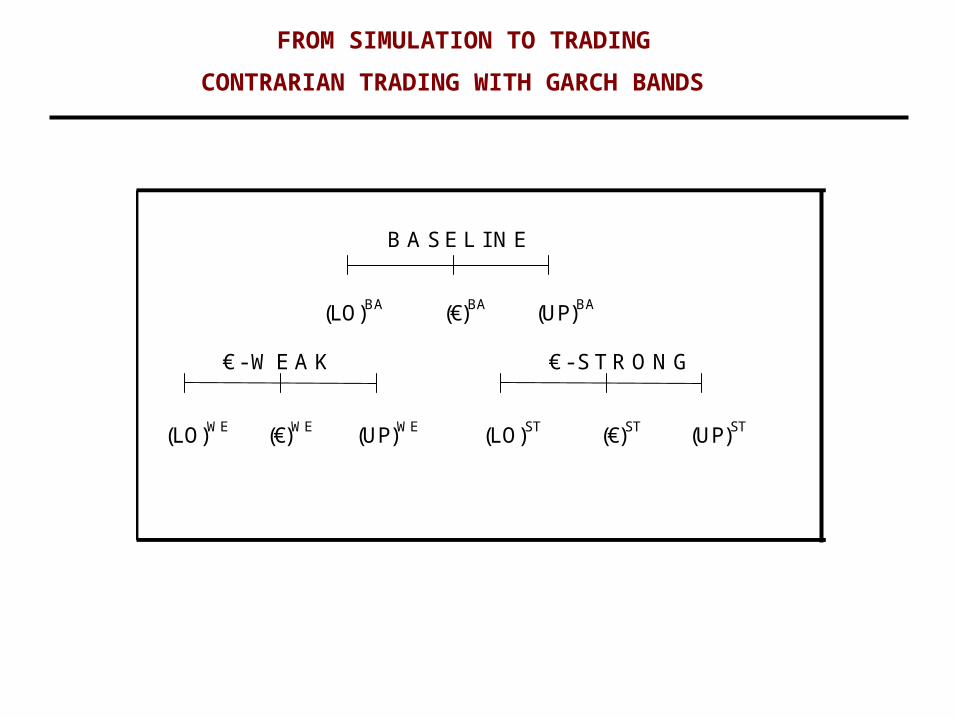
FROM SIMULATION TO TRADING CONTRARIAN TRADING WITH GARCH BANDS
FOREIGN FUNDAMENT. SCHEDULED UNSCHED. t:JTZ EXCHANGE NEWS NEWS ETZ VARIATION ATZ
Model is simulated setting Fundamentals and Sched. News equal to zero and by setting the Unsched. News variable with the highest coefficient equal to +1 (for simulating a “strong €-$”) or -1 (for simulating a “weak €-$”). We thus have 3 values of Exchange Rate: 1. “Baseline Value of €-$” 2. “Strong €-$” 3. “Weak €-$” The GARCH model of the error term determines bands around these values-
ttin
iitjttj
m
jjts
r
ssttt UZEZYSSE
1,
11,1,
1,
11 )]([)(

),0( ,2 it
it N
it
it
it
,21
,21
,2
FROM SIMULATION TO TRADINGCONTRARIAN TRADING WITH GARCH BANDS
i => ETZ ATZ
• GARCH structure of the error term
FROM SIMULATION TO TRADING
CONTRARIAN TRADING WITH GARCH BANDS
B A S E L I N E
(LO)BA (€)BA (UP)BA
€ - W E A K € - S T R O N G
(LO)WE (€)WE (UP)WE (LO)ST (€)ST (UP)ST

Model forecast at 7 AM or
before
LONG
SHORT
IF ER7-8<THRL
THRL
SLTP LONG
IF ER7-8>THRL NO TRADE
IF ER7-8>THRS
THRS
SLTP SHORT
IF ER7-8<THRS NO TRADE
FROM SIMULATION TO TRADING DIRECTIONAL TRADING IN ETZ
TP
SL
IF NOT REACHED
CLOSE AT 1 PM
Model forecast at 1 PM or
before
LONG
SHORT
IF ER1-2<THRL
THRL
SLTP LONG
IF ER1-2>THRL NO TRADE
IF ER1-2>THRS
THRS
SLTP SHORT
IF ER1-2<THRS NO TRADE
FROM SIMULATION TO TRADING DIRECTIONAL TRADING IN ATZ
TP
SL
IF NOT REACHED
CLOSE AT 9 PM
Model forecast at 7 AM or
before
SHORT
IF ER7-8<THRL
THRL
SLTP LONG
IF SL IS REACHED
LONG FROM SL
CLOSEAT TP AT 1 PM
IF ER7-8>THRL NO TRADE
IF ER7-8>THRS
THRS
SLTP SHORT
IF ER7-8<THRS NO TRADE
FROM SIMULATION TO TRADING MIXED TRADING IN ETZ
IF SL IS NOT REACHED
TP
SL
IF NOT REACHED
CLOSE AT 1 PM
LONG
IF SL IS REACHED
SHORTFROM SL
CLOSEAT TP AT 1 PMIF SL IS
NOT REACHED
TP
SL
IF NOT REACHED
CLOSE AT 1 PM

Model forecast at 1 PM or
before
SHORT
IF ER1-2<THRL
THRL
SLTP LONG
IF SL IS REACHED
LONG FROM SL
CLOSEAT TP AT 9 PM
IF ER1-2>THRL NO TRADE
IF ER1-2>THRS
THRS
SLTP SHORT
IF ER1-2<THRS NO TRADE
FROM SIMULATION TO TRADING MIXED TRADING IN ATZ
IF SL IS NOT REACHED
TP
SL
IF NOT REACHED
CLOSE AT 9 PM
LONG
IF SL IS REACHED
SHORTFROM SL
CLOSEAT TP AT 9 PMIF SL IS
NOT REACHED
TP
SL
IF NOT REACHED
CLOSE AT 9 PM
Computation of Garch
Thresholds at 7 AM or before
IF ER< SLTP
LONG
NO TRADE
SHORT
NO TRADE
FROM SIMULATION TO TRADING AUTOMATIC CONTRARIAN TRADING
LOWER-GTHR
LOWER-GTHR
IF ER>LOWER-G
THR
TP
SL
IF NOT REACHED
CLOSE AT 9 PM
IF ER>UPPER-G
THR
UPPER-GTHRIF ER<
SLTP
UPPER-GTHR
Computation of Garch
Thresholds at 7 AM or before
IF ER<
SLTP
LONG
FROM SIMULATION TO TRADING NEWS ASSISTED CONTRARIAN TRADING
LOWER-GTHR AND NO NEWS
OR€ - POSITIVE NEWS
LOWER-GTHR
TP
SL
IF NOT REACHED
CLOSE AT 9 PM
IF ER< NO TRADE
LOWER-GTHR AND
€ - NEGATIVE NEWS
SLTP
SHORT
UPPER-GTHR AND NO NEWS
OR€ - NEGATIVE
NEWS
UPPER-GTHRIF ER>
NO TRADE
UPPER-GTHR AND
€ - POSITIVE NEWS
IF ER>

FROM SIMULATION TO TRADING CUMULATIVE PROFITS IN THE 4 TRADING RULES
E-$ Contrarian-News Contr.Autom. Mixed Directional
Euro-$,Cumulative Total Profits in All Trading RulesJanuary 3, 2011 - November 29, 2013
Exch
ange
Rate
Cumulative Profits
J F M A M J J A S O N D J F M A M J J A S O N D J F M A M J J A S O N2011 2012 2013
1.20
1.25
1.30
1.35
1.40
1.45
1.50
-0.2
0.0
0.2
0.4
0.6
0.8
1.0
33.4%
22.6%
8.5%
6.1%
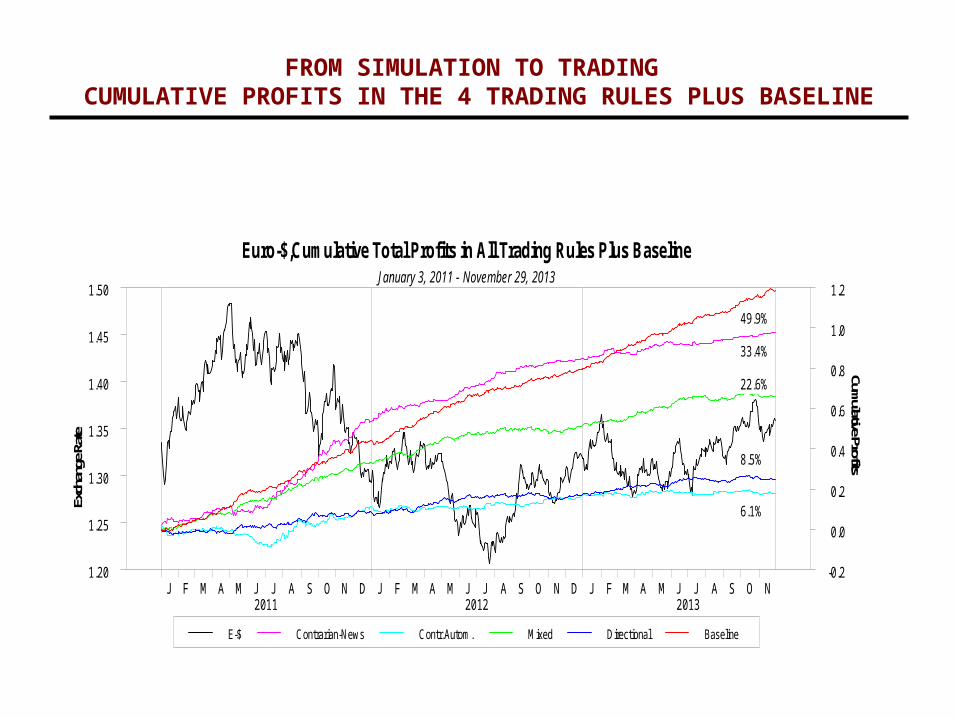
FROM SIMULATION TO TRADING CUMULATIVE PROFITS IN THE 4 TRADING RULES PLUS BASELINE
E-$ Contrarian-News Contr.Autom. Mixed Directional Baseline
Euro-$,Cumulative Total Profits in All Trading Rules Plus BaselineJanuary 3, 2011 - November 29, 2013
Exch
ange
Rat
e
Cumulative Profits
J F M A M J J A S O N D J F M A M J J A S O N D J F M A M J J A S O N2011 2012 2013
1.20
1.25
1.30
1.35
1.40
1.45
1.50
-0.2
0.0
0.2
0.4
0.6
0.8
1.0
1.2
49.9%
33.4%
22.6%
8.5%
6.1%
FROM SIMULATION TO TRADING OPTIMIZING AUTOMATED TRADING VIA A GENETIC ALGORITHM
• Once you are able to devise a protocol which can be automated and you build a computer program able to execute your trading instructions sequentially, you may try to optimize the parameters of our rule which condition the profit performance.
• A widely used optimization technique in finance is the Genetic Algorithm (GA), which is adapted from a “selection of the species” to a “selection of the profit-maximizing parameters”
FROM SIMULATION TO TRADING OPTIMIZING AUTOMATED TRADING VIA A GENETIC ALGORITHM
• It is basically a data mining program which iteratively finds the best set of parameters from a group of numbers within boundary conditions.
• In order to avoid “data snooping” (namely use the same set of numbers to optimize and compute trading results), you will need to split your data set into two parts.
FROM SIMULATION TO TRADING OPTIMIZING AUTOMATED TRADING VIA A GENETIC ALGORITHM
• A Training Set (TNS), made up by the first part of your data set, where you find the optimal parameters.
• A Trading Set (TRS), made up of the second part of your data set still within the sample, where you will compute the performance (generally in terms of cumulative profits, their volatility and their Drawdown)
FROM SIMULATION TO TRADING OPTIMIZING AUTOMATED TRADING VIA A GENETIC ALGORITHM
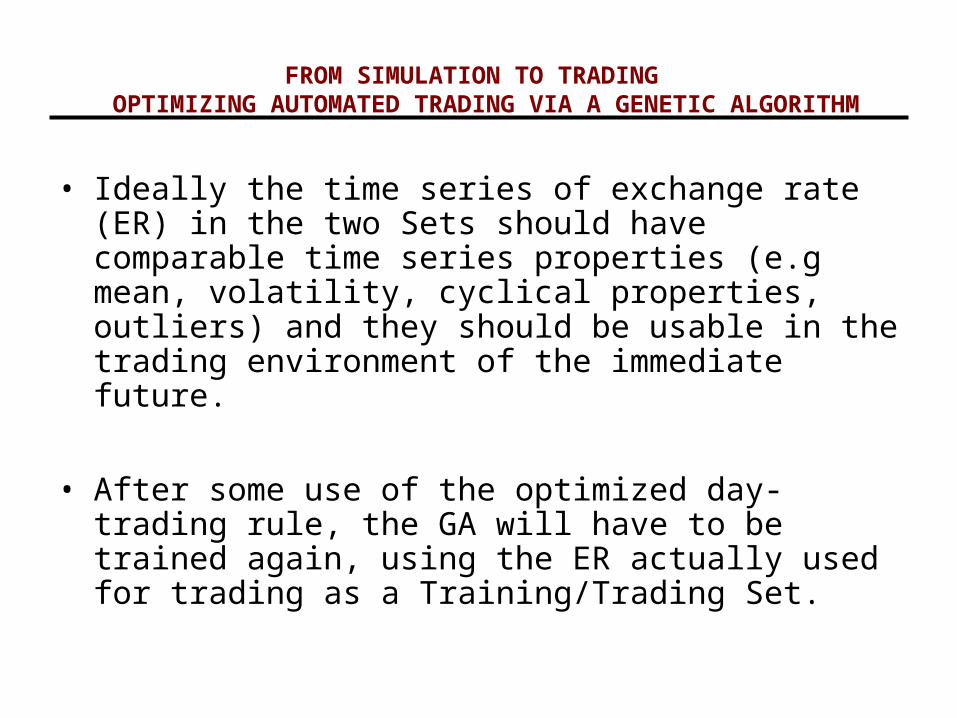
• Ideally the time series of exchange rate (ER) in the two Sets should have comparable time series properties (e.g mean, volatility, cyclical properties, outliers) and they should be usable in the trading environment of the immediate future.
• After some use of the optimized day-trading rule, the GA will have to be trained again, using the ER actually used for trading as a Training/Trading Set.
FROM SIMULATION TO TRADING OPTIMIZING AUTOMATED TRADING VIA A GENETIC ALGORITHM
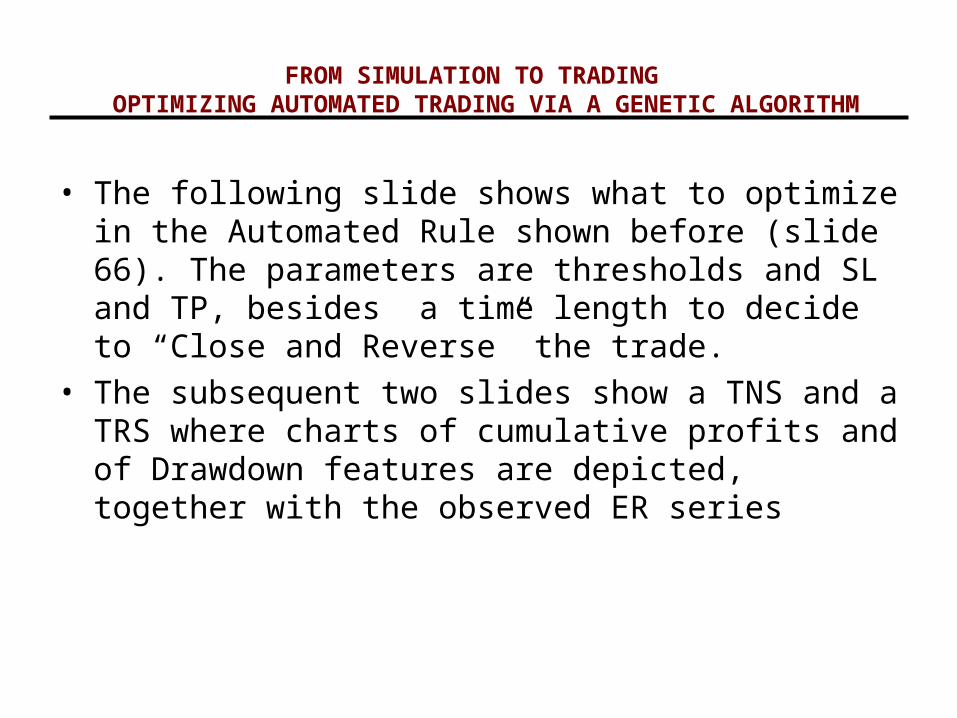
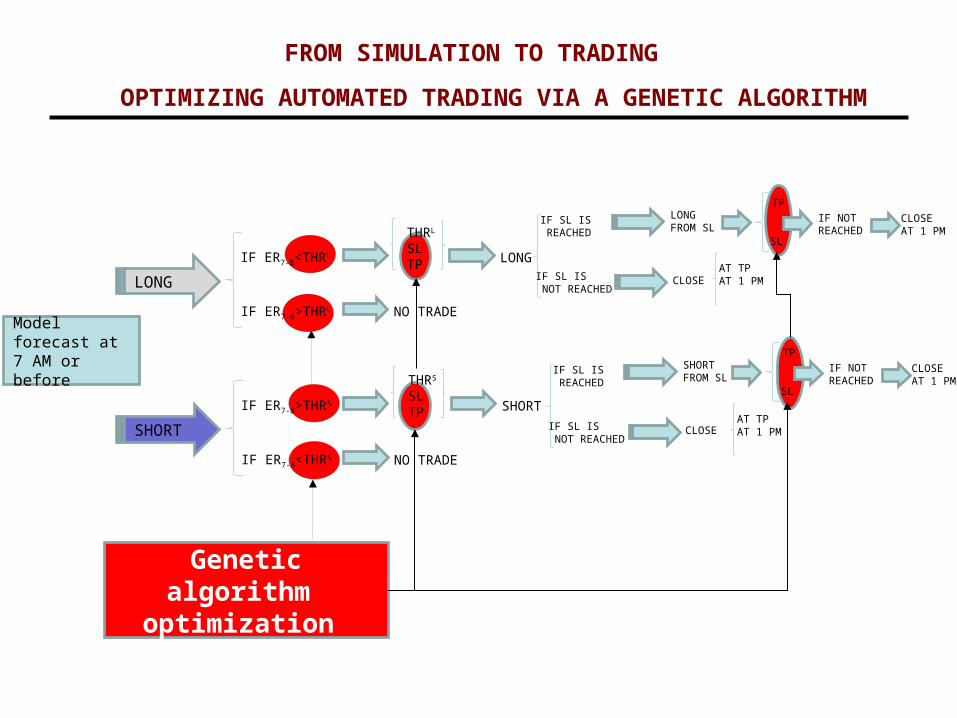
• The following slide shows what to optimize in the Automated Rule shown before (slide 66). The parameters are thresholds and SL and TP, besides a time length to decide to “Close and Reverse” the trade.
• The subsequent two slides show a TNS and a TRS where charts of cumulative profits and of Drawdown features are depicted, together with the observed ER series
Model forecast at 7 AM or before
SHORT
IF ER7-8<THRL
THRL
SLTP LONG
IF SL IS REACHED
LONG FROM SL
CLOSEAT TP AT 1 PM
IF ER7-8>THRL NO TRADE
IF ER7-8>THRS
THRS
SLTP SHORT
IF ER7-8<THRS NO TRADE
FROM SIMULATION TO TRADING OPTIMIZING AUTOMATED TRADING VIA A GENETIC ALGORITHM
IF SL IS NOT REACHED
TP
SL
IF NOT REACHED
CLOSE AT 1 PM
LONG
IF SL IS REACHED
SHORTFROM SL
CLOSEAT TP AT 1 PMIF SL IS
NOT REACHED
TP
SL
IF NOT REACHED
CLOSE AT 1 PM
Genetic algorithm optimization
98
COURSE OUTLINE
1. THE €-$ FOREX MARKET - HISTORY AND RECENT TRENDS
2. FROM MACROECONOMIC FUNDAMENTALS TO MACRO NEWS
3. MACROECONOMIC SURPRISES – THE SCHEDULED NEWS
4. INFORMATION SOURCES OF SCHEDULED NEWS
5. IMPACT ON EXCHANGE RATES OF SCHEDULED NEWS
6. UNSCHEDULED NEWS AND THEIR IMPACT ON EXCHANGE RATES
7. HOW TO MEASURE NEWS
8. IMPACT: A 3-ZONES ECONOMETRIC MODEL OF EXCHANGE RATES
9. FROM SIMULATION TO TRADING - OPTIMIZATION
10.MEASURING AND EVALUATING PERFORMANCE

MEASURING AND EVALUATING PERFORMANCE
• The profitability of a day-trading rule is measured as any standard financial investment.
• Profit Rate over a given time horizon and its standard deviation for evaluating statistical significance and drawing confidence bands. A Sharpe Ratio (i.e. standardized excess return over the risk-free return) is also widely used.
MEASURING AND EVALUATING PERFORMANCE
• But a high-frequency trading rule (as a protocol replicating itself without any change) needs also monitoring indicators for checking the stability of profits and their volatility overtime and, in particular, in turbulent periods.

MEASURING AND EVALUATING PERFORMANCE
The monitoring indicators can be:
1. Equity Line (a Cumulative Profit Line)
2. Moving Standard Deviation of Profit along the Equity Line (Volatility)
3. Drawdown Analysis
4. Policy and event analysis from the perspective of an historical evaluation of quiet and turbulent periods and related policy measures and market sentiment.

MEASURING AND EVALUATING PERFORMANCE
Turbulent periods follow:
1. Unexpected Policy measures (e.g. US ultra expansionary monetary policy after Lehman and QE later)
2. Ongoing financial distress from contagion (e.g. Greece=>Ireland=>Portugal=>Italy and Spain, PIIGS)
3. Rumors, Fads, Myths, Excuses
4. Irrational Exuberance or Irrational Pessimism

MEASURING AND EVALUATING PERFORMANCETURBULENCE POST-LEHMAN
E-$ Cum.Tot.Prof.
Fig. 3.1 - Euro-$,Cumulative Total Profits and Drawdowns2008 - 2010
Exch
ange
Rat
eCum
ulative Profits
J F M A M J J A S O N D J F M A M J J A S O N D J F M A M J J2008 2009 2010
1.15
1.20
1.25
1.30
1.35
1.40
1.45
1.50
1.55
1.60
0.0
0.1
0.2
0.3
0.4
0.5
0.6
0.7
0.8
1 2 3
4 5 6 7 8
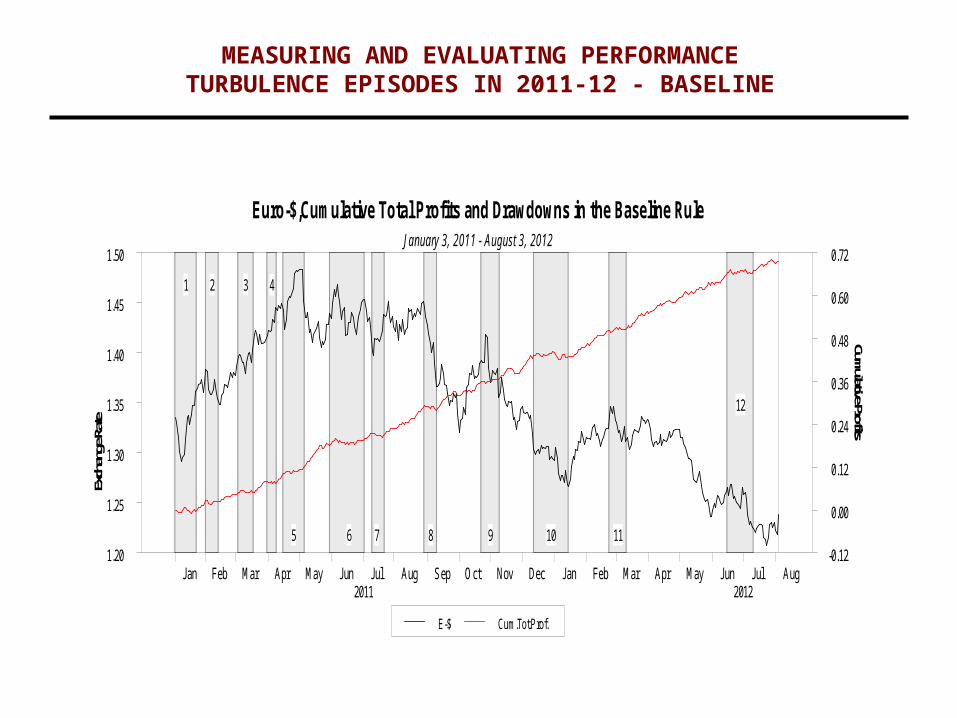
MEASURING AND EVALUATING PERFORMANCETURBULENCE EPISODES IN 2011-12 - BASELINE
E-$ Cum.Tot.Prof.
Euro-$,Cumulative Total Profits and Drawdowns in the Baseline RuleJanuary 3, 2011 - August 3, 2012
Exch
ange
Rate
Cumulative Profits
Jan Feb Mar Apr May Jun Jul Aug Sep Oct Nov Dec Jan Feb Mar Apr May Jun Jul Aug2011 2012
1.20
1.25
1.30
1.35
1.40
1.45
1.50
-0.12
0.00
0.12
0.24
0.36
0.48
0.60
0.72
1 2 3 4
5 6 7 8 9 10 11
12

MEASURING AND EVALUATING PERFORMANCETURBULENCE EPISODES IN 2011-12 – 4 TRADING RULES PLUS BASELINE
E-$ Contrarian-News Contr.Autom. Mixed Directional Baseline
Euro-$,Cumulative Total Profits and Drawdowns in All Trading Rules Plus BaselineJanuary 3, 2011 - August 3, 2012
Exch
ange
Rate
Cumulative Profits
Jan Feb Mar Apr May Jun Jul Aug Sep Oct Nov Dec Jan Feb Mar Apr May Jun Jul Aug2011 2012
1.20
1.25
1.30
1.35
1.40
1.45
1.50
-0.1
0.0
0.1
0.2
0.3
0.4
0.5
0.6
0.7
0.8
1 2 3 4
5 6 7 8 9 10 11
12

MEASURING AND EVALUATING PERFORMANCETURBULENCE EPISODES IN 2012-13 – BASELINE
E-$ Cum.Tot.Prof.
Euro-$,Cumulative Total Profits and Drawdowns in the Baseline RuleJuly 30, 2012 - November 29, 2013
Exch
ange
Rate
Cumulative Profits
Jul Aug Sep Oct Nov Dec Jan Feb Mar Apr May Jun Jul Aug Sep Oct Nov2013
1.20
1.25
1.30
1.35
1.40
-0.08
0.00
0.08
0.16
0.24
0.32
0.40
0.48
0.56
0.64
13 14 15 16 17 18 19 20 21 22 23 24
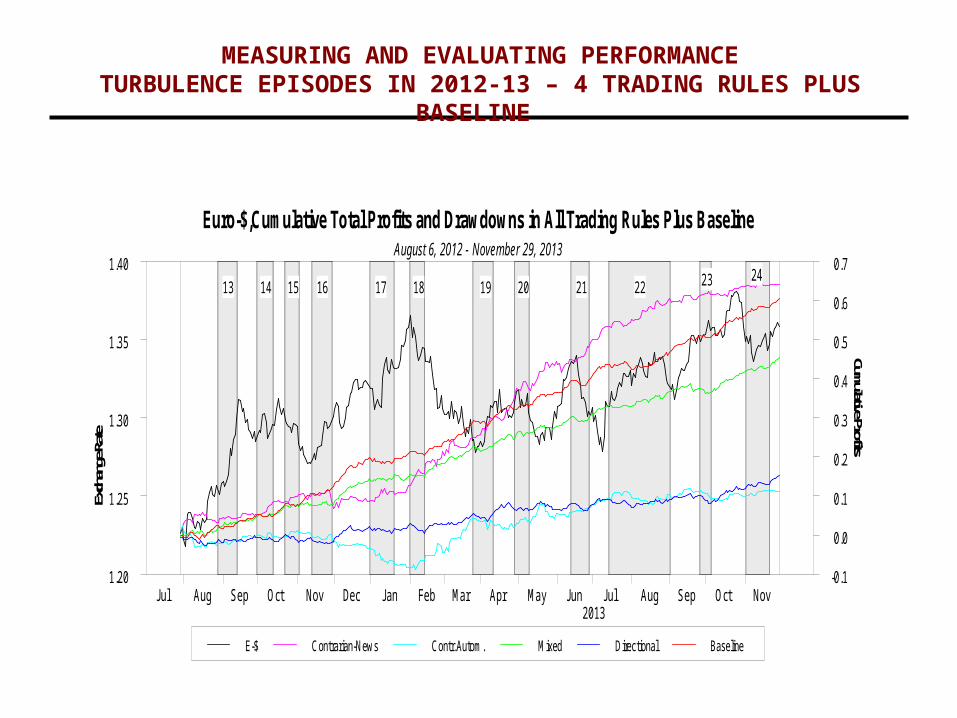
MEASURING AND EVALUATING PERFORMANCETURBULENCE EPISODES IN 2012-13 – 4 TRADING RULES PLUS BASELINE
E-$ Contrarian-News Contr.Autom. Mixed Directional Baseline
Euro-$,Cumulative Total Profits and Drawdowns in All Trading Rules Plus BaselineAugust 6, 2012 - November 29, 2013
Exch
ange
Rate
Cumulative Profits
Jul Aug Sep Oct Nov Dec Jan Feb Mar Apr May Jun Jul Aug Sep Oct Nov2013
1.20
1.25
1.30
1.35
1.40
-0.1
0.0
0.1
0.2
0.3
0.4
0.5
0.6
0.7
13 14 15 16 17 18 19 20 21 22 23 24

THE END
Goodnight
And Good Luck !
Shakespeare “Julius Caesar”
(Brutus)