Embed Size (px)
Citation preview
1
The Economic Implications of The Economic Implications of Corporate Financial ReportingCorporate Financial Reporting
Campbell R. HarveyDuke University, Durham, NC USA
National Bureau of Economic Research, Cambridge, MA USA
Global Finance Conference 2005
27-29 June 2005, Trinity College Dublin, Ireland
2
Corporate Financial Reporting
Based on research with:
John Graham and Shiva Rajgopal
3
Graham/Harvey/Rajgopal: Corporate Reporting
Background
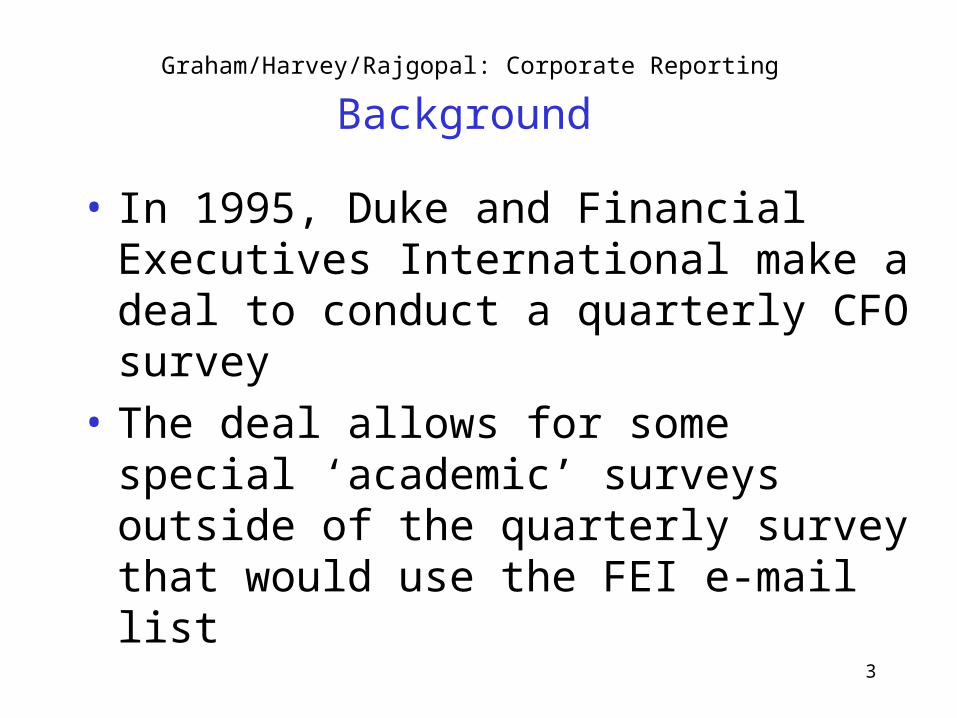
• In 1995, Duke and Financial Executives International make a deal to conduct a quarterly CFO survey
• The deal allows for some special ‘academic’ surveys outside of the quarterly survey that would use the FEI e-mail list
4
Graham/Harvey/Rajgopal: Corporate Reporting
Background
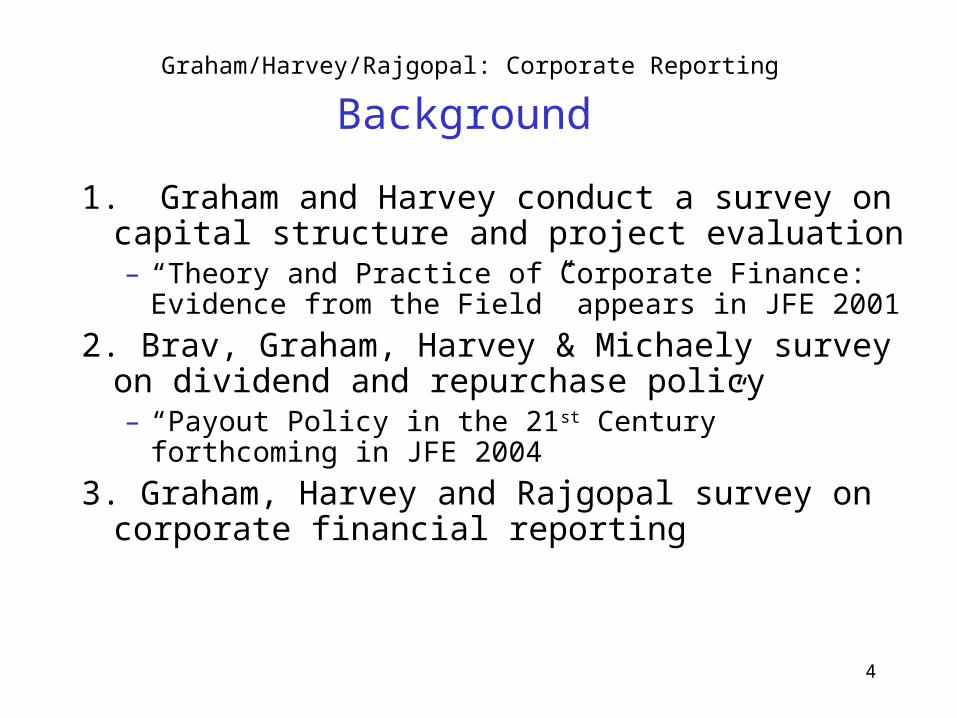
1. Graham and Harvey conduct a survey on capital structure and project evaluation– “Theory and Practice of Corporate Finance: Evidence from
the Field” appears in JFE 2001
2. Brav, Graham, Harvey & Michaely survey on dividend and repurchase policy– “Payout Policy in the 21st Century” forthcoming in JFE
2004
3. Graham, Harvey and Rajgopal survey on corporate financial reporting
5
Graham/Harvey/Rajgopal: Corporate Reporting
Methodology
General goals our research program:
• To examine assumptions
• To learn what people say they believe
• To provide a complement to the usual research methods: archival empirical work and theory
6
Graham/Harvey/Rajgopal: Corporate Reporting
Methodology
Approach contrasts with Friedman’s (1953) “The Methodogy of Positive Economics”
• Goals of positive science are predictive• Don’t reject theory based on “unrealistic
assumptions”• Also, rejects notion that all the predictions of a theory
matter to its validity – goal is “narrow predictive success”
7
Graham/Harvey/Rajgopal: Corporate Reporting
Methodology
Alternative view, Daniel Hausman (1992)
• “No good way to know what to try when a prediction fails or whether to employ a theory in a new application without judging its assumptions.”
8
Graham/Harvey/Rajgopal: Corporate Reporting
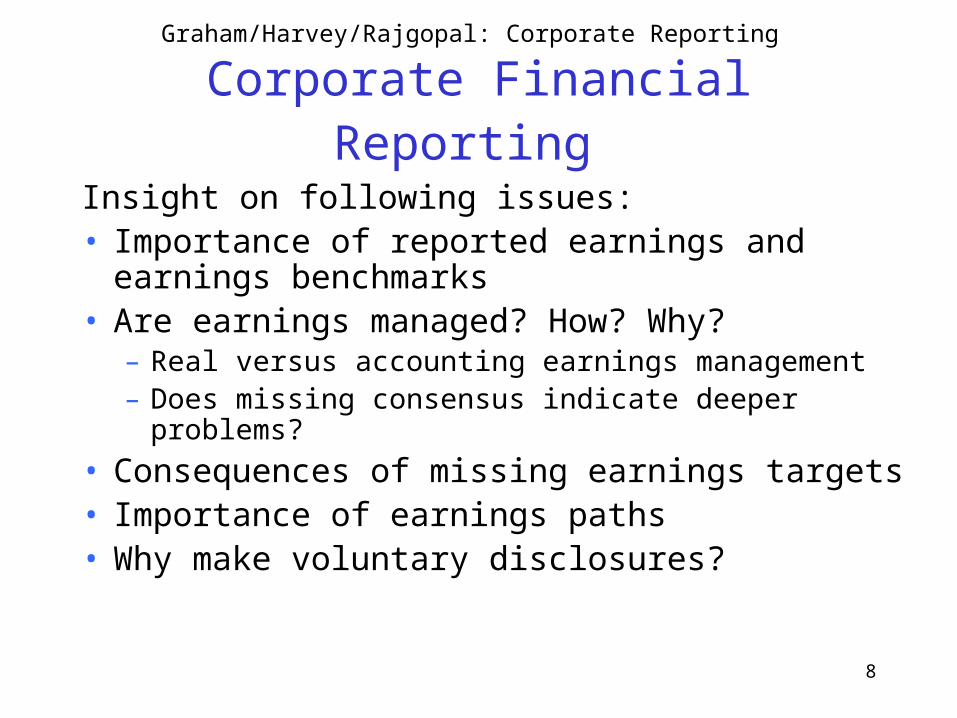
Corporate Financial Reporting
Insight on following issues:• Importance of reported earnings and earnings
benchmarks• Are earnings managed? How? Why?
– Real versus accounting earnings management– Does missing consensus indicate deeper problems?
• Consequences of missing earnings targets• Importance of earnings paths• Why make voluntary disclosures?
9
Graham/Harvey/Rajgopal: Corporate Reporting
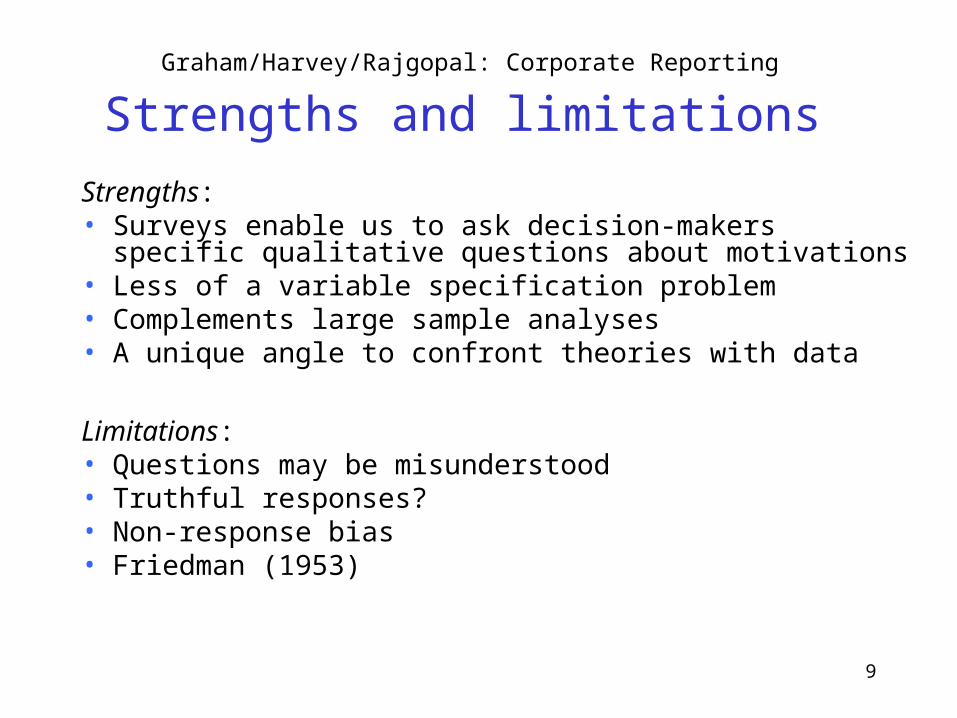
Strengths and limitations Strengths:• Surveys enable us to ask decision-makers specific qualitative
questions about motivations• Less of a variable specification problem• Complements large sample analyses • A unique angle to confront theories with data
Limitations: • Questions may be misunderstood• Truthful responses?• Non-response bias • Friedman (1953)
10
Graham/Harvey/Rajgopal: Corporate Reporting
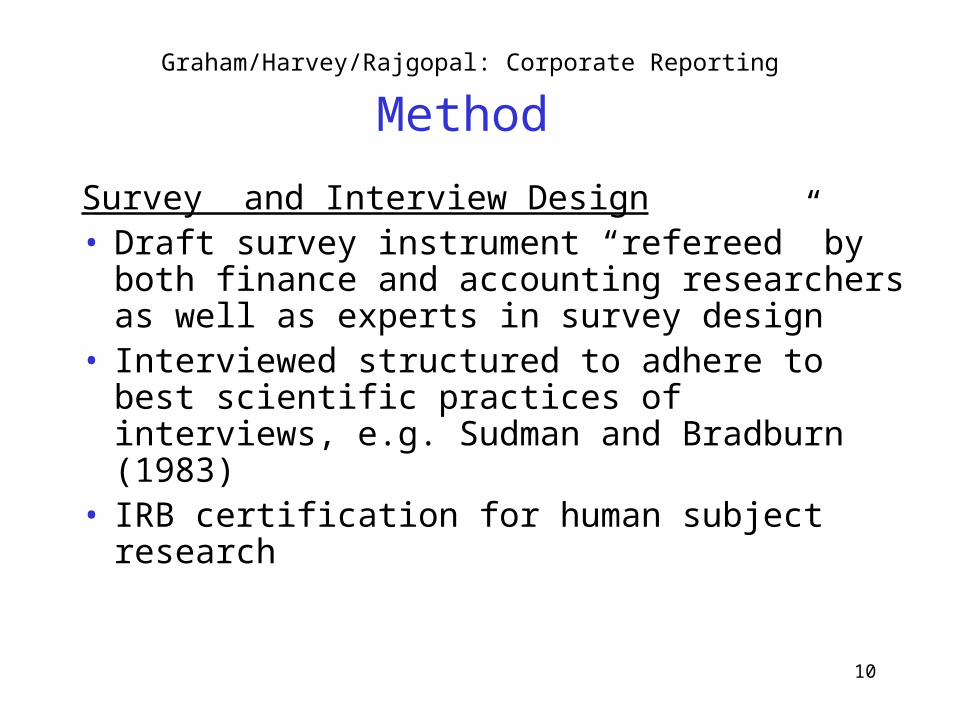
Method
Survey and Interview Design• Draft survey instrument “refereed” by both finance
and accounting researchers as well as experts in survey design
• Interviewed structured to adhere to best scientific practices of interviews, e.g. Sudman and Bradburn (1983)
• IRB certification for human subject research
11
Graham/Harvey/Rajgopal: Corporate Reporting
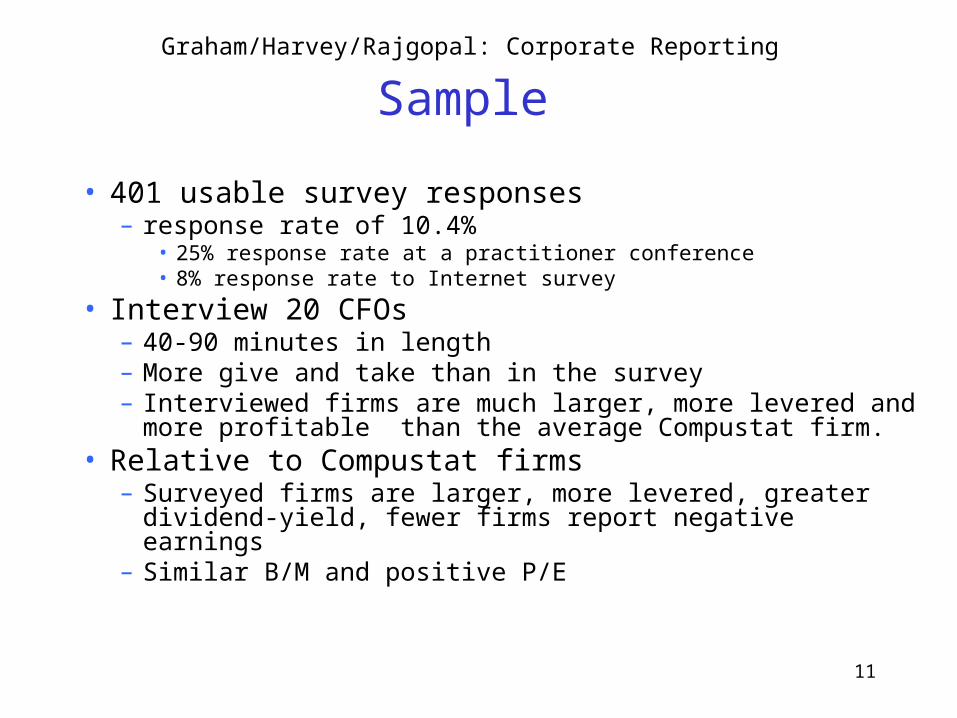
Sample
• 401 usable survey responses– response rate of 10.4%
• 25% response rate at a practitioner conference• 8% response rate to Internet survey
• Interview 20 CFOs– 40-90 minutes in length– More give and take than in the survey– Interviewed firms are much larger, more levered and more
profitable than the average Compustat firm.• Relative to Compustat firms
– Surveyed firms are larger, more levered, greater dividend-yield, fewer firms report negative earnings
– Similar B/M and positive P/E
12
Graham/Harvey/Rajgopal: Corporate Reporting
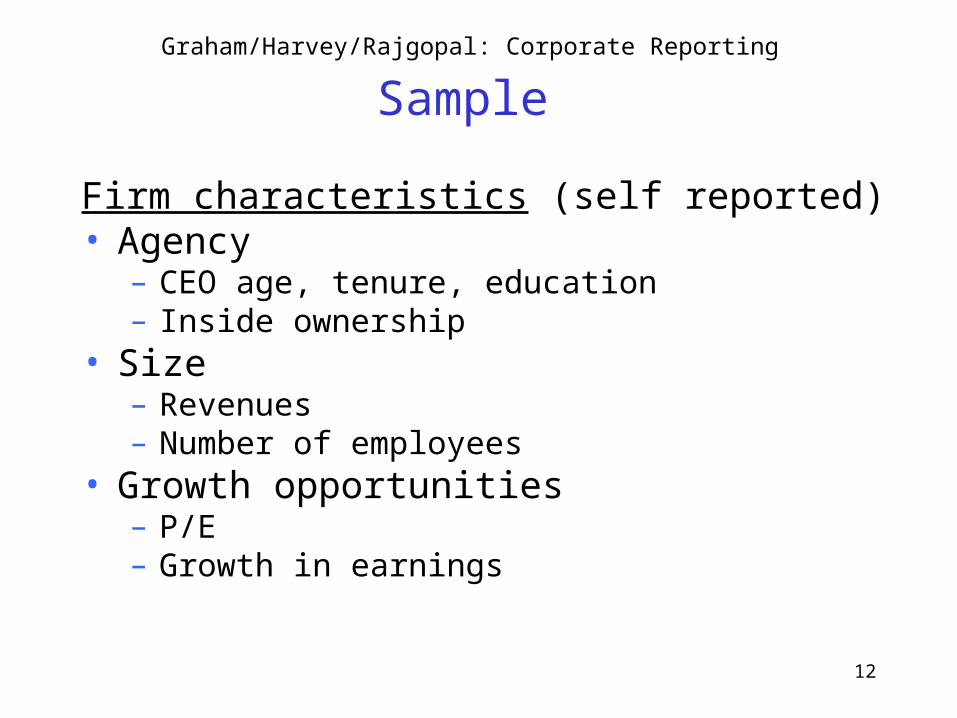
Sample
Firm characteristics (self reported)• Agency
– CEO age, tenure, education– Inside ownership
• Size– Revenues– Number of employees
• Growth opportunities– P/E– Growth in earnings
13
Graham/Harvey/Rajgopal: Corporate Reporting
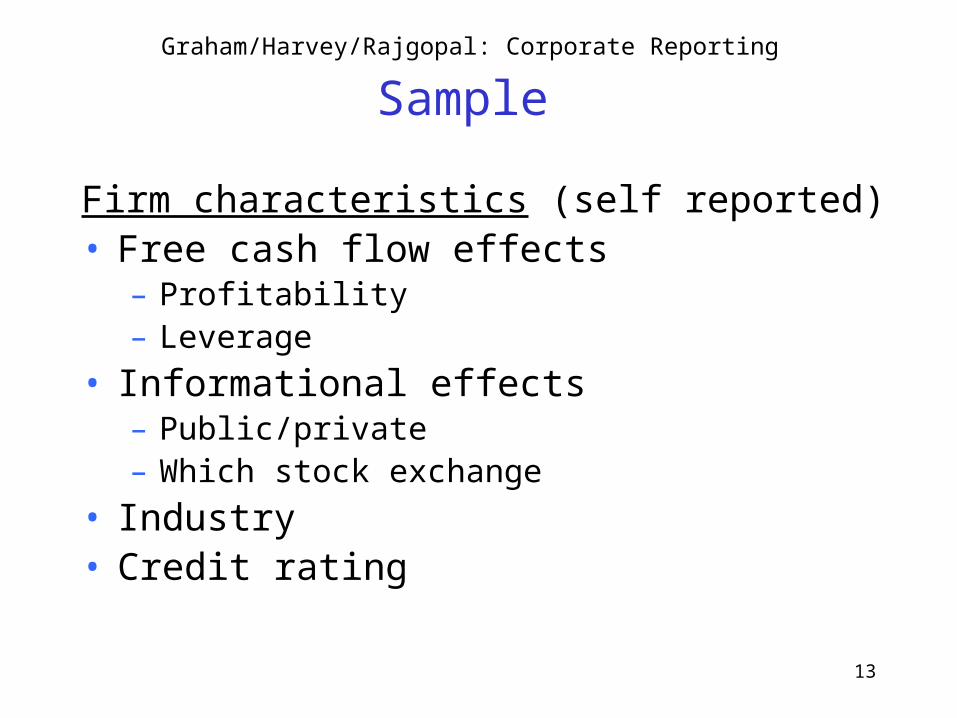
Sample
Firm characteristics (self reported)• Free cash flow effects
– Profitability– Leverage
• Informational effects– Public/private– Which stock exchange
• Industry• Credit rating
14
Graham/Harvey/Rajgopal: Corporate Reporting
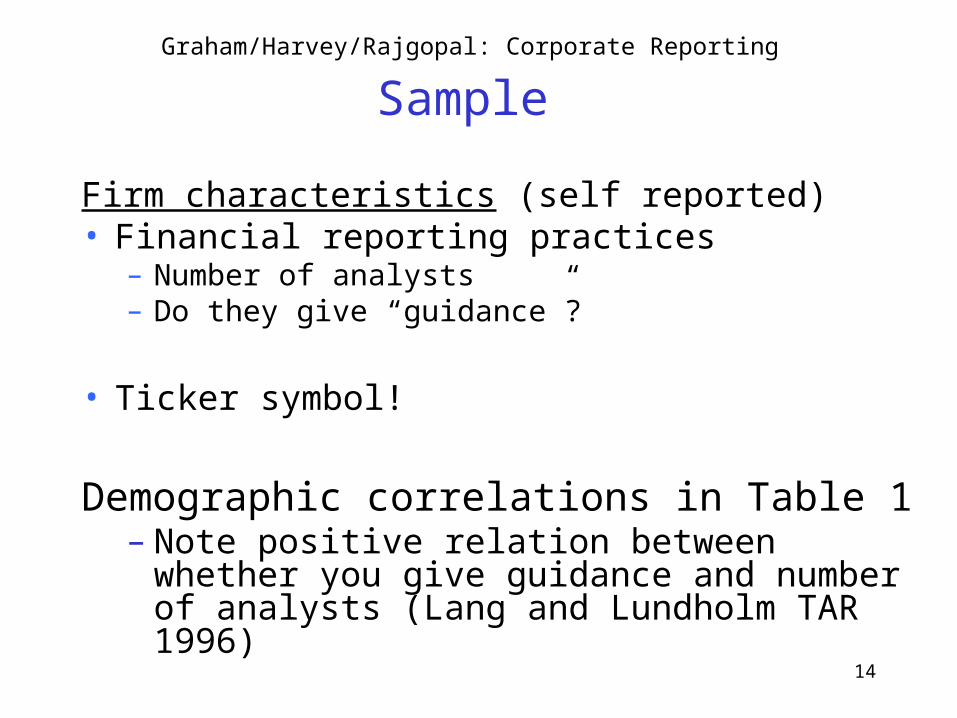
Sample
Firm characteristics (self reported)• Financial reporting practices
– Number of analysts– Do they give “guidance”?
• Ticker symbol!
Demographic correlations in Table 1– Note positive relation between whether you give
guidance and number of analysts (Lang and Lundholm TAR 1996)
15
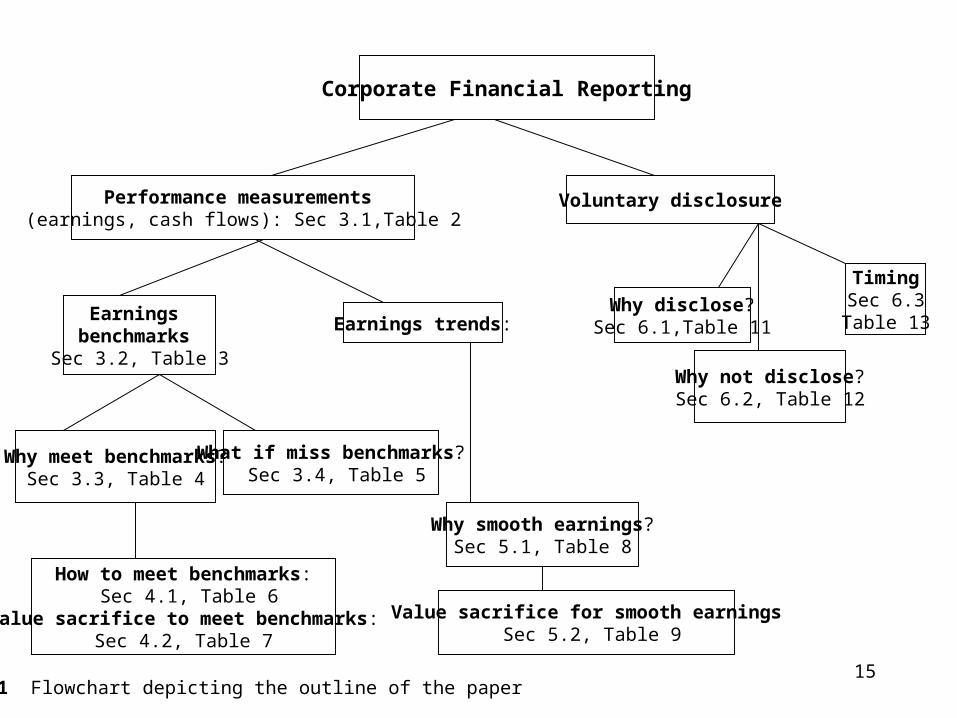
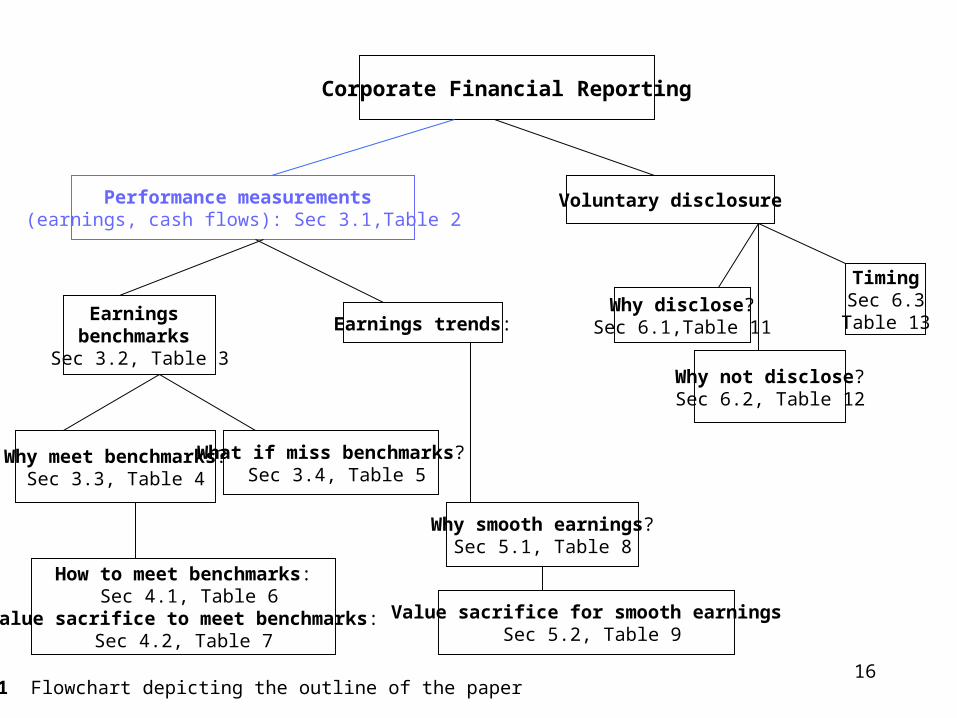
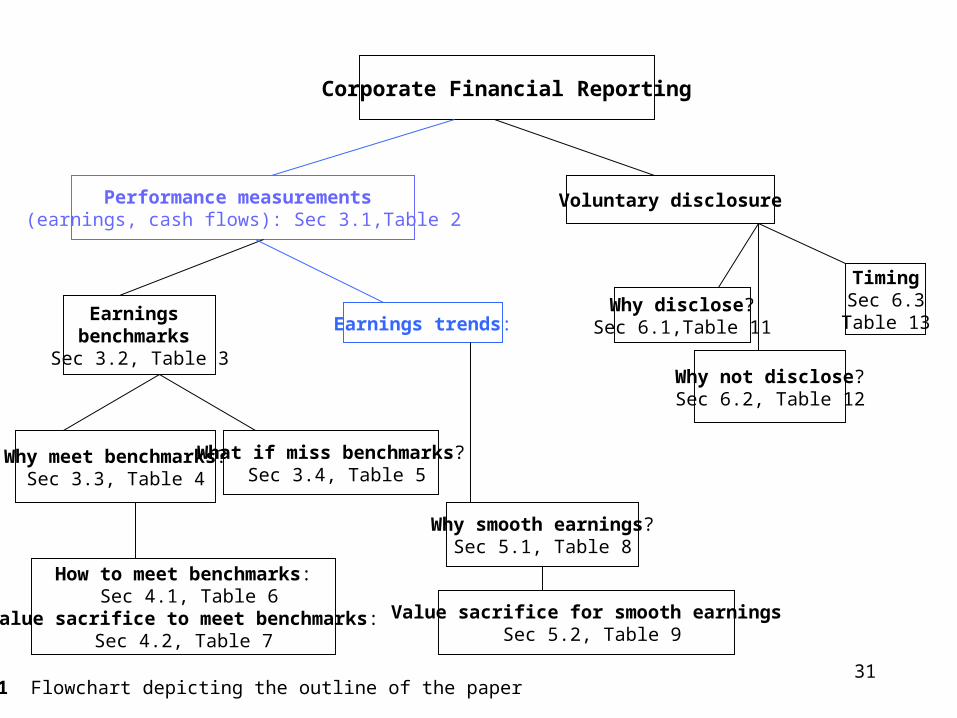
Corporate Financial Reporting
Performance measurements (earnings, cash flows): Sec 3.1,Table 2
Voluntary disclosure
Earnings benchmarks
Sec 3.2, Table 3
Earnings trends:
Why meet benchmarks?Sec 3.3, Table 4
What if miss benchmarks? Sec 3.4, Table 5
How to meet benchmarks: Sec 4.1, Table 6
Value sacrifice to meet benchmarks:Sec 4.2, Table 7
Why smooth earnings?Sec 5.1, Table 8
Value sacrifice for smooth earnings Sec 5.2, Table 9
Why disclose?Sec 6.1,Table 11
Why not disclose?Sec 6.2, Table 12
TimingSec 6.3
Table 13
Fig. 1 Flowchart depicting the outline of the paper
16
Corporate Financial Reporting
Performance measurements (earnings, cash flows): Sec 3.1,Table 2
Voluntary disclosure
Earnings benchmarks
Sec 3.2, Table 3
Earnings trends:
Why meet benchmarks?Sec 3.3, Table 4
What if miss benchmarks? Sec 3.4, Table 5
How to meet benchmarks: Sec 4.1, Table 6
Value sacrifice to meet benchmarks:Sec 4.2, Table 7
Why smooth earnings?Sec 5.1, Table 8
Value sacrifice for smooth earnings Sec 5.2, Table 9
Why disclose?Sec 6.1,Table 11
Why not disclose?Sec 6.2, Table 12
TimingSec 6.3
Table 13
Fig. 1 Flowchart depicting the outline of the paper
17
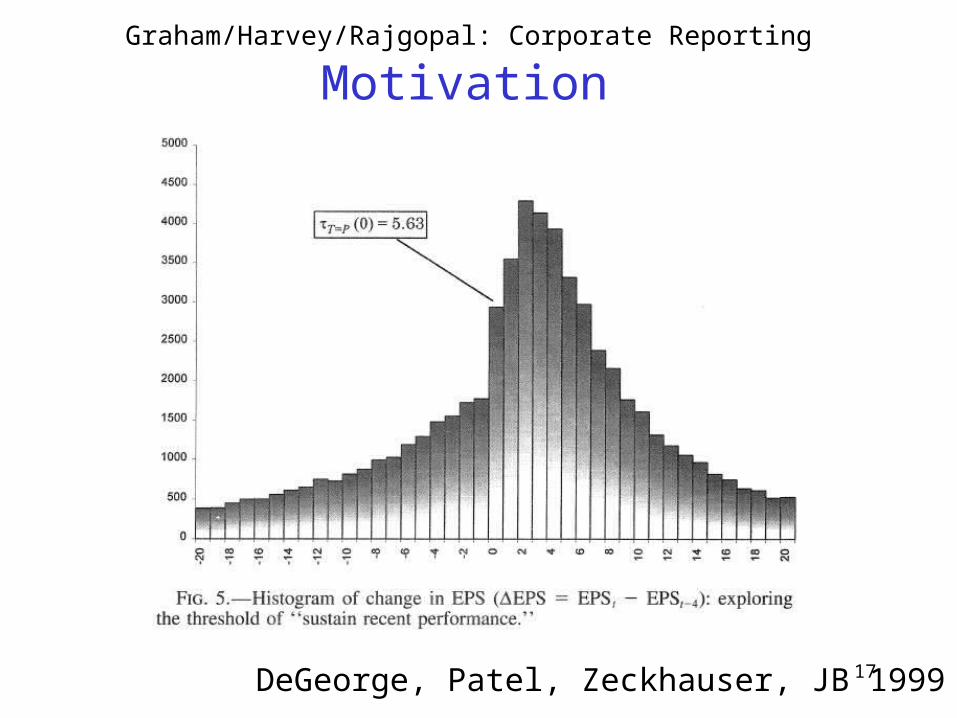
Graham/Harvey/Rajgopal: Corporate Reporting
Motivation
DeGeorge, Patel, Zeckhauser, JB 1999
18
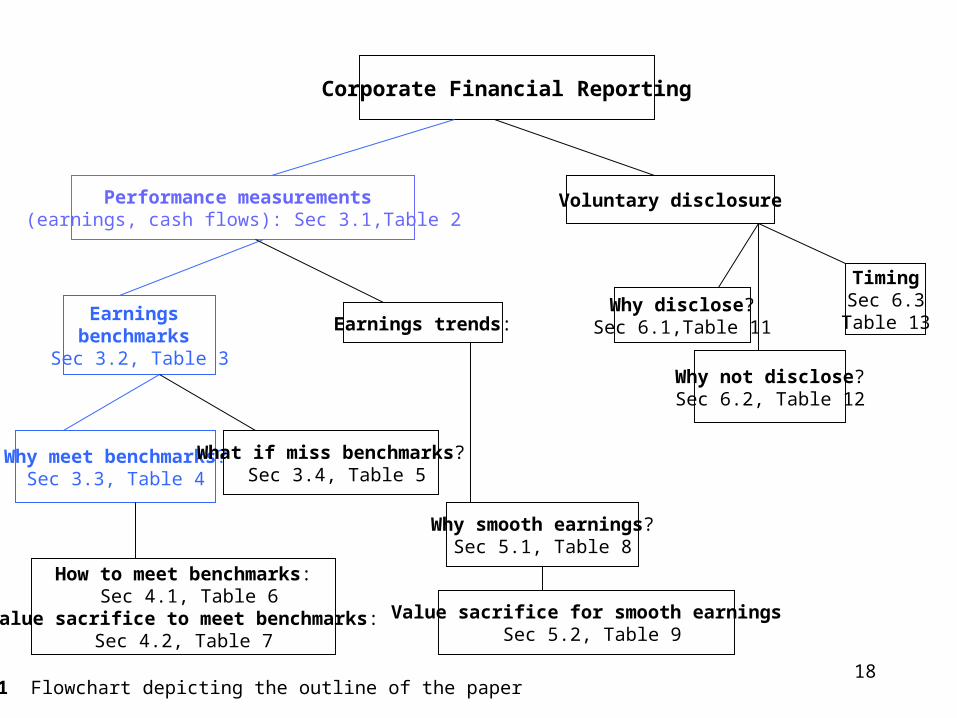
Corporate Financial Reporting
Performance measurements (earnings, cash flows): Sec 3.1,Table 2
Voluntary disclosure
Earnings benchmarks
Sec 3.2, Table 3
Earnings trends:
Why meet benchmarks?Sec 3.3, Table 4
What if miss benchmarks? Sec 3.4, Table 5
How to meet benchmarks: Sec 4.1, Table 6
Value sacrifice to meet benchmarks:Sec 4.2, Table 7
Why smooth earnings?Sec 5.1, Table 8
Value sacrifice for smooth earnings Sec 5.2, Table 9
Why disclose?Sec 6.1,Table 11
Why not disclose?Sec 6.2, Table 12
TimingSec 6.3
Table 13
Fig. 1 Flowchart depicting the outline of the paper
19
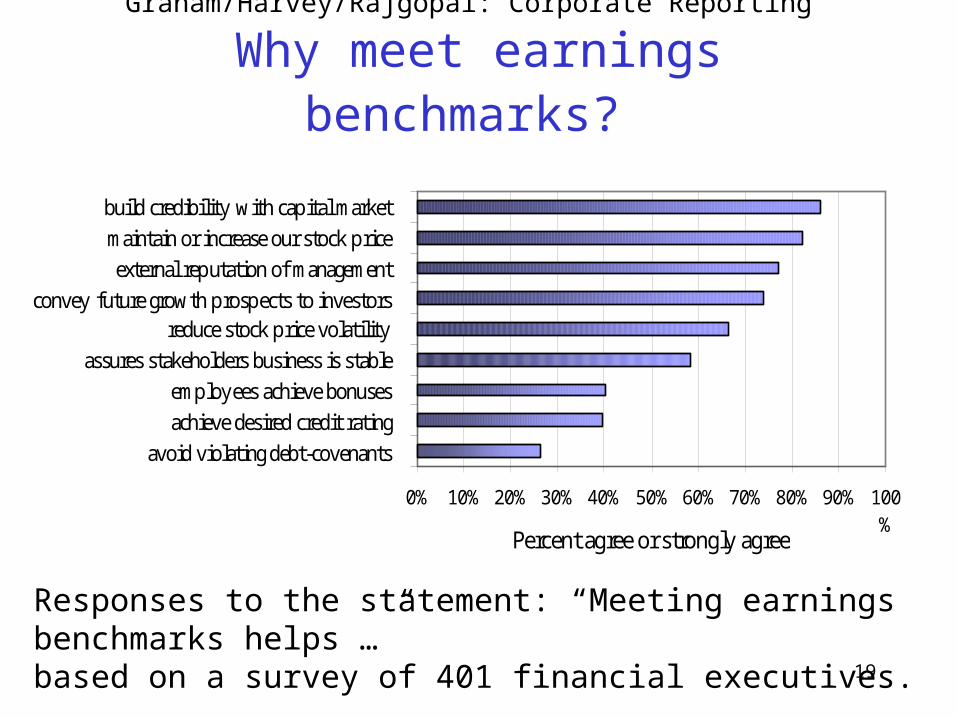
0% 10% 20% 30% 40% 50% 60% 70% 80% 90% 100%
avoid violating debt-covenants
achieve desired credit rating
employees achieve bonuses
assures stakeholders business is stable
reduce stock price volatility convey future growth prospects to investors
external reputation of management
maintain or increase our stock price
build credibility with capital market
Percent agree or strongly agree
Graham/Harvey/Rajgopal: Corporate Reporting
Why meet earnings benchmarks?
Responses to the statement: “Meeting earnings benchmarks helps …” based on a survey of 401 financial executives.
20
0% 10% 20% 30% 40% 50% 60% 70% 80% 90%
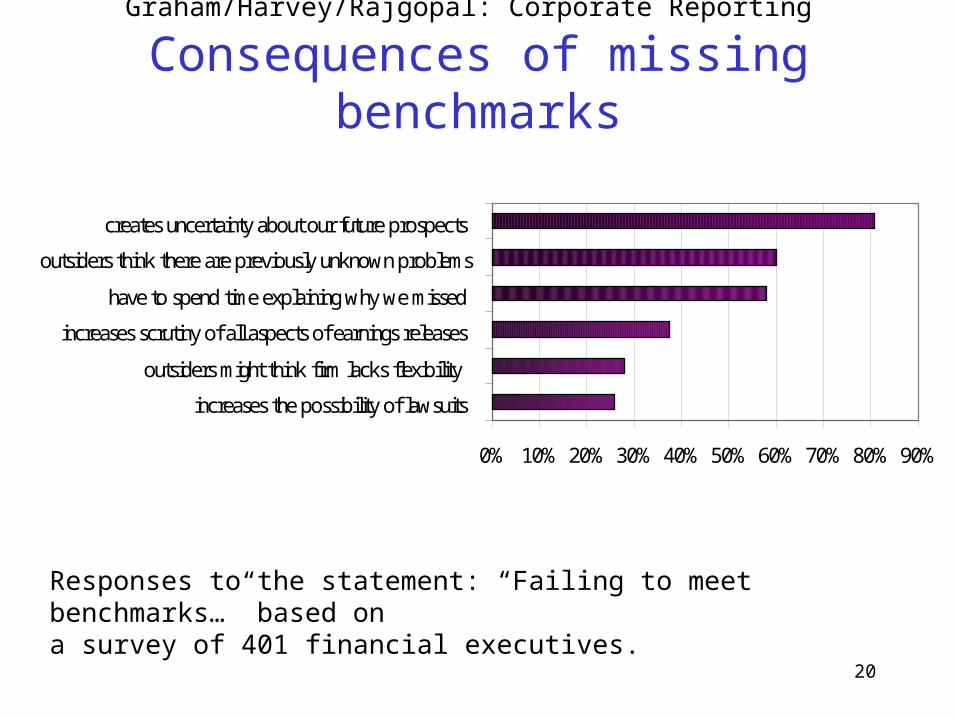
increases the possibility of lawsuits
outsiders might think firm lacks flexibility
increases scrutiny of all aspects of earnings releases
have to spend time explaining why we missed
outsiders think there are previously unknown problems
creates uncertainty about our future prospects
Graham/Harvey/Rajgopal: Corporate Reporting
Consequences of missing benchmarks
Responses to the statement: “Failing to meet benchmarks…” based on a survey of 401 financial executives.
21
Graham/Harvey/Rajgopal: Corporate Reporting
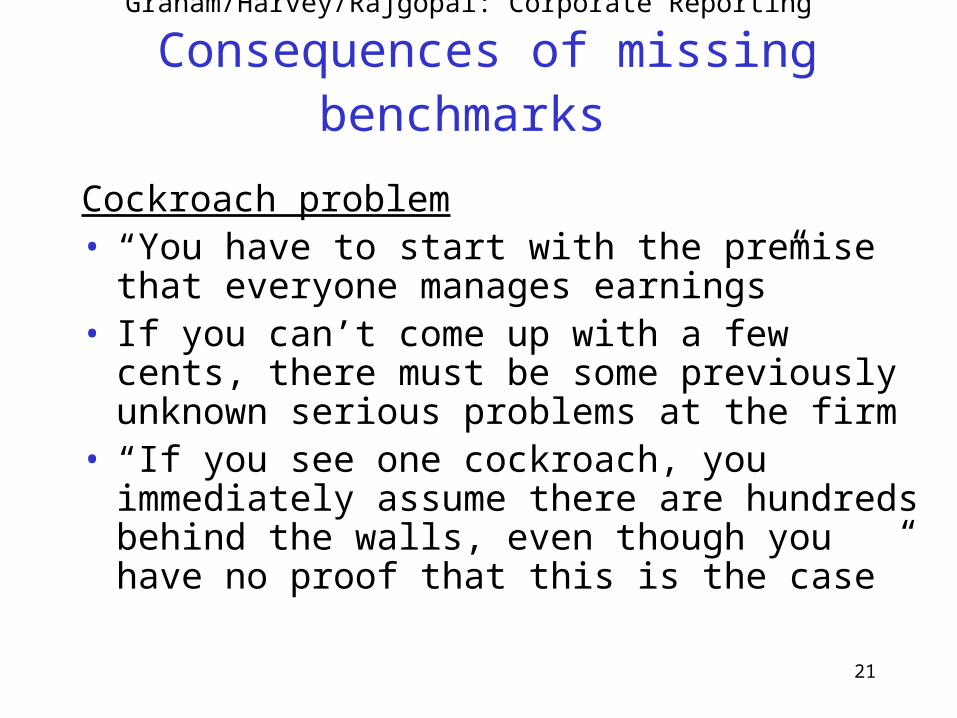
Consequences of missing benchmarks
Cockroach problem• “You have to start with the premise that everyone
manages earnings”• If you can’t come up with a few cents, there must be
some previously unknown serious problems at the firm
• “If you see one cockroach, you immediately assume there are hundreds behind the walls, even though you have no proof that this is the case”
22
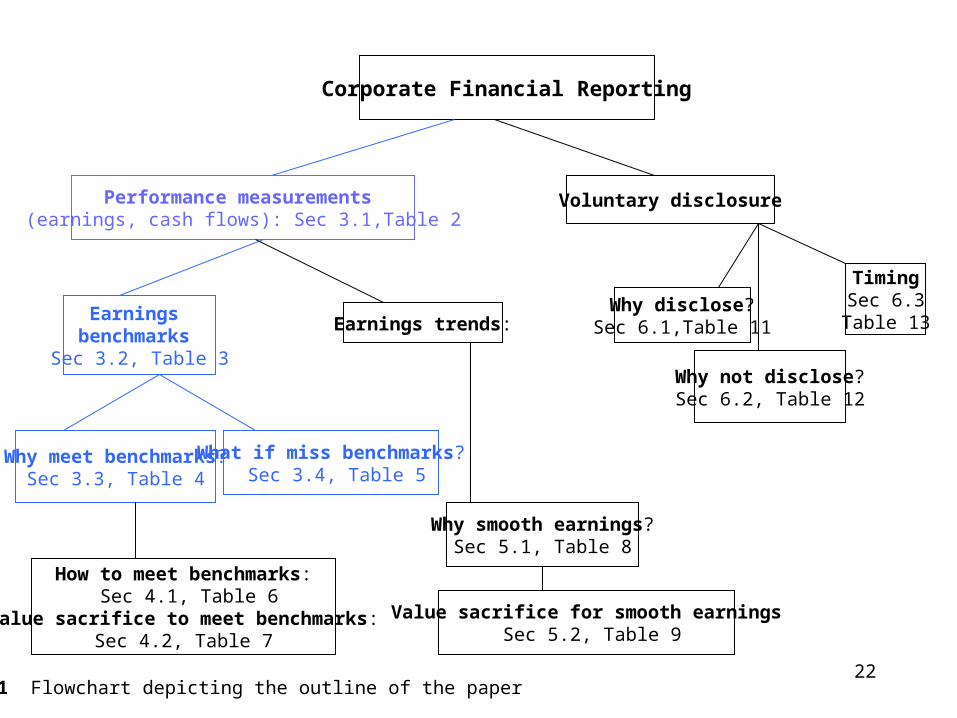
Corporate Financial Reporting
Performance measurements (earnings, cash flows): Sec 3.1,Table 2
Voluntary disclosure
Earnings benchmarks
Sec 3.2, Table 3
Earnings trends:
Why meet benchmarks?Sec 3.3, Table 4
What if miss benchmarks? Sec 3.4, Table 5
How to meet benchmarks: Sec 4.1, Table 6
Value sacrifice to meet benchmarks:Sec 4.2, Table 7
Why smooth earnings?Sec 5.1, Table 8
Value sacrifice for smooth earnings Sec 5.2, Table 9
Why disclose?Sec 6.1,Table 11
Why not disclose?Sec 6.2, Table 12
TimingSec 6.3
Table 13
Fig. 1 Flowchart depicting the outline of the paper
23
Graham/Harvey/Rajgopal: Corporate Reporting
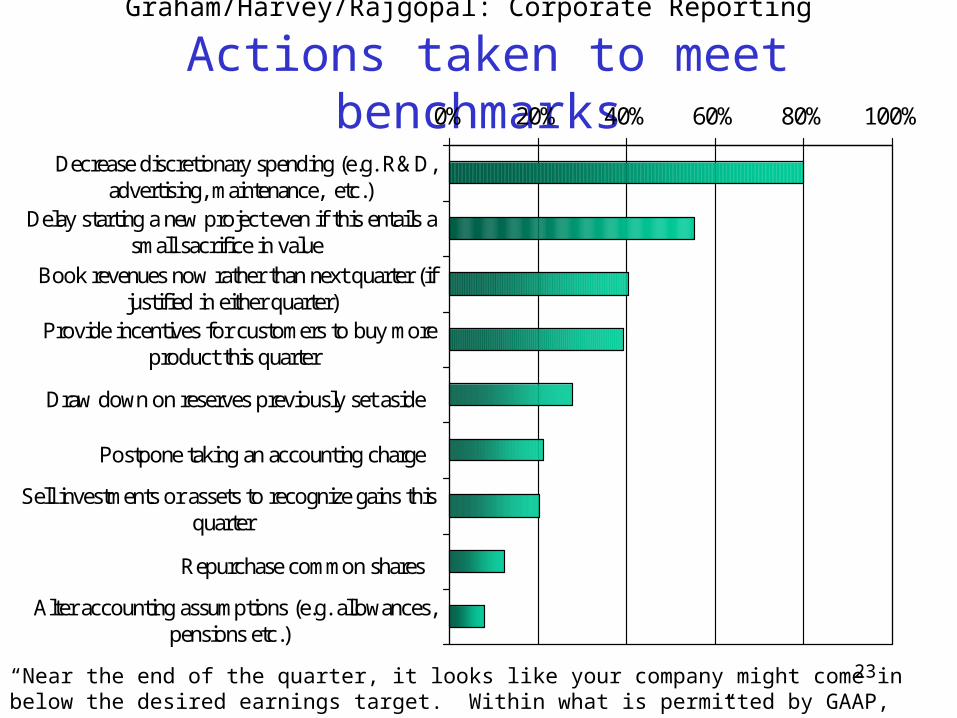
Actions taken to meet benchmarks0% 20% 40% 60% 80% 100%
Decrease discretionary spending (e.g. R&D,advertising, maintenance, etc.)
Delay starting a new project even if this entails asmall sacrifice in value
Book revenues now rather than next quarter (ifjustified in either quarter)
Provide incentives for customers to buy moreproduct this quarter
Draw down on reserves previously set aside
Postpone taking an accounting charge
Sell investments or assets to recognize gains thisquarter
Repurchase common shares
Alter accounting assumptions (e.g. allowances,pensions etc.)
“Near the end of the quarter, it looks like your company might come in below the desired earnings target. Within what is permitted by GAAP, which of the following choices might your company make?”
24
Graham/Harvey/Rajgopal: Corporate Reporting
Sacrificing long-term value
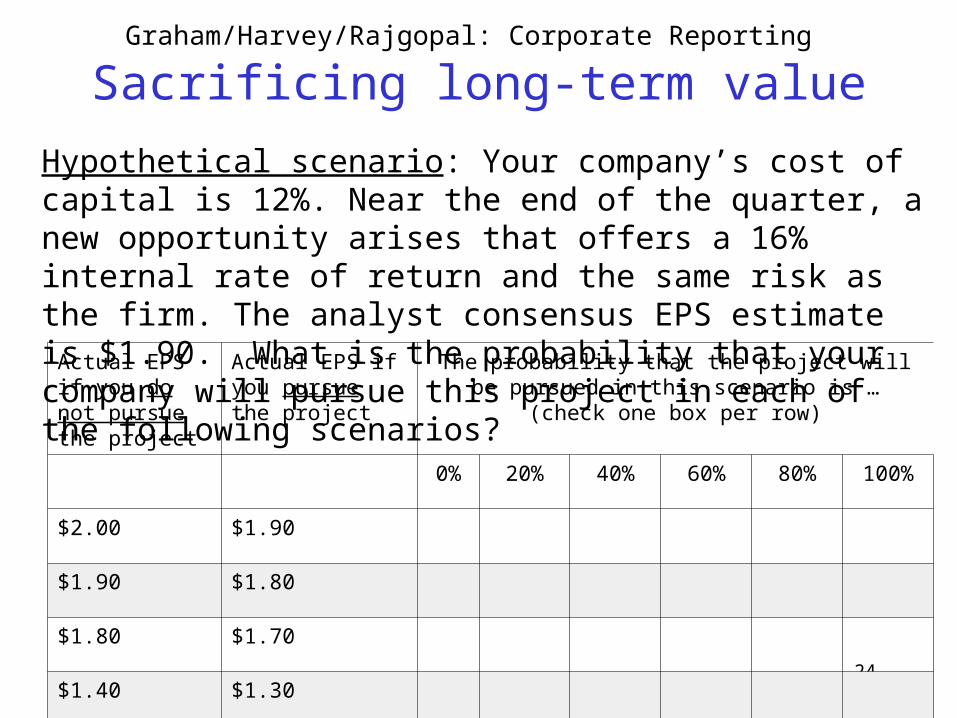
Hypothetical scenario: Your company’s cost of capital is 12%. Near the end of the quarter, a new opportunity arises that offers a 16% internal rate of return and the same risk as the firm. The analyst consensus EPS estimate is $1.90. What is the probability that your company will pursue this project in each of the following scenarios?
Actual EPS if you do not pursue the project
Actual EPS if you pursue the project
The probability that the project will be pursued in this scenario is …
(check one box per row)
0% 20% 40% 60% 80% 100%
$2.00 $1.90
$1.90 $1.80
$1.80 $1.70
$1.40 $1.30
25
Graham/Harvey/Rajgopal: Corporate Reporting
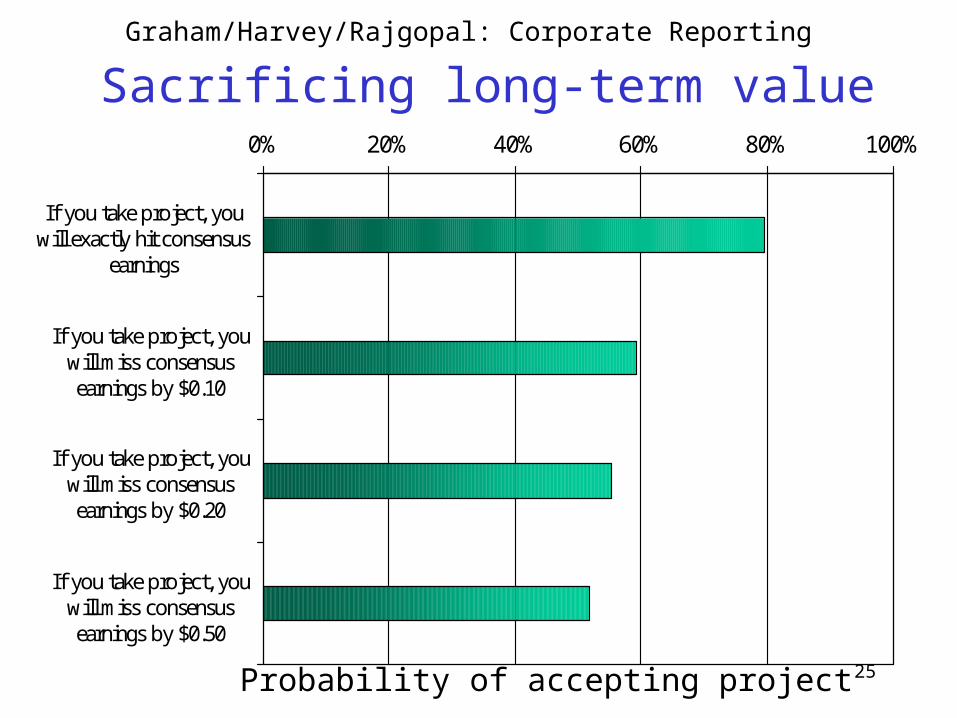
Sacrificing long-term value 0% 20% 40% 60% 80% 100%
If you take project, youwill exactly hit consensus
earnings
If you take project, youwill miss consensusearnings by $0.10
If you take project, youwill miss consensusearnings by $0.20
If you take project, youwill miss consensusearnings by $0.50
Probability of accepting project
26
Graham/Harvey/Rajgopal: Corporate Reporting
Sacrificing long-term value
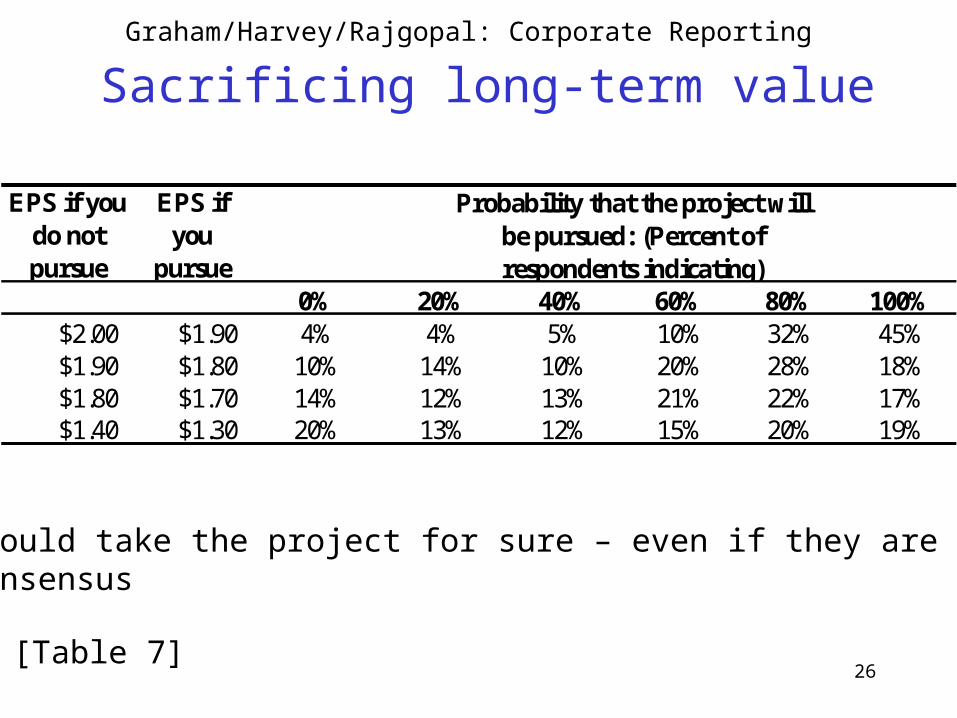
Only 45% would take the project for sure – even if they are projected to meet consensus
EPS if you do not pursue
EPS if you
pursue
Average probability of
pursuing 0% 20% 40% 60% 80% 100%
$2.00 $1.90 4% 4% 5% 10% 32% 45%$1.90 $1.80 10% 14% 10% 20% 28% 18%$1.80 $1.70 14% 12% 13% 21% 22% 17%$1.40 $1.30 20% 13% 12% 15% 20% 19%
Probability that the project will be pursued: (Percent of respondents indicating)
[Table 7]
27
Graham/Harvey/Rajgopal: Corporate Reporting
Sacrificing long-term value
Reminiscent of Brav, Graham, Harvey and Michaely• Sacrifice positive NPV projects before cutting
dividends
28
Graham/Harvey/Rajgopal: Corporate Reporting
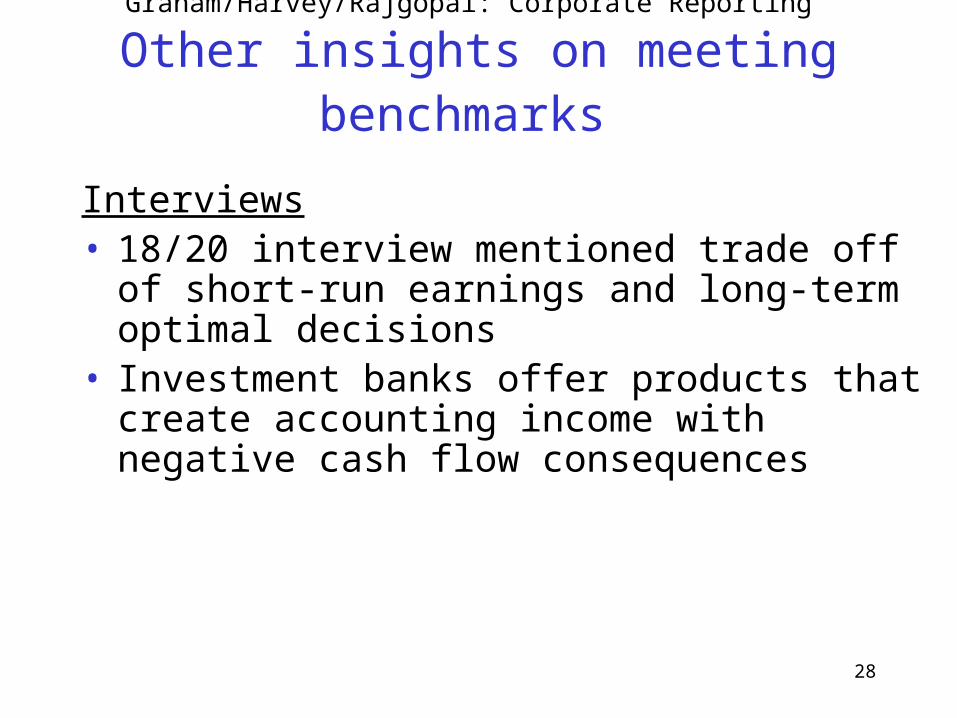
Other insights on meeting benchmarks
Interviews• 18/20 interview mentioned trade off of short-run
earnings and long-term optimal decisions• Investment banks offer products that create
accounting income with negative cash flow consequences
29
Graham/Harvey/Rajgopal: Corporate Reporting
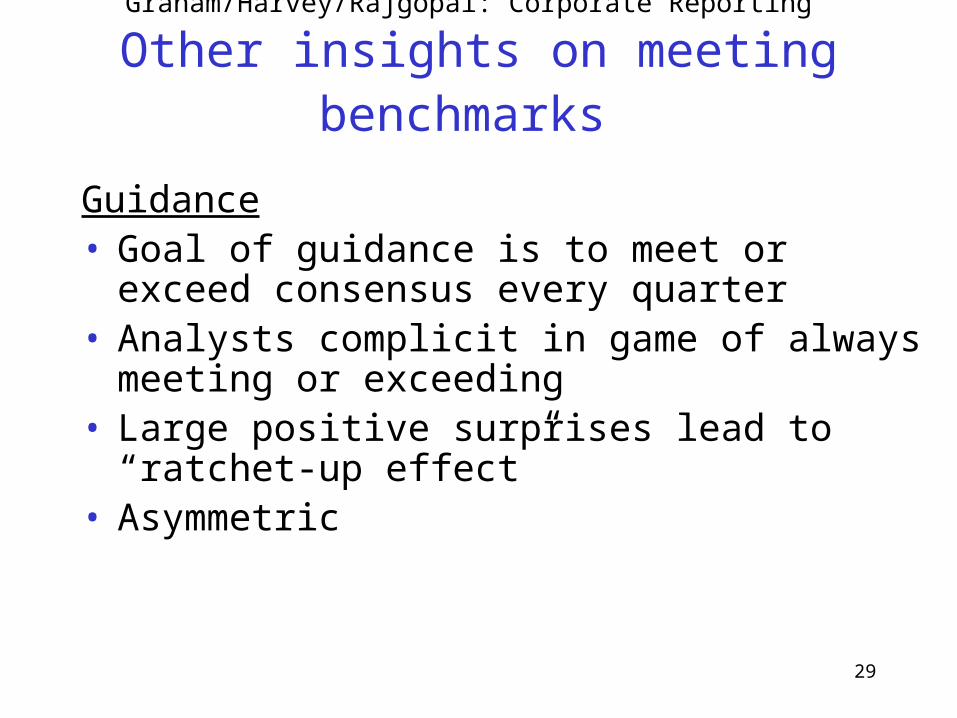
Other insights on meeting benchmarks
Guidance• Goal of guidance is to meet or exceed consensus
every quarter• Analysts complicit in game of always meeting or
exceeding• Large positive surprises lead to “ratchet-up effect”• Asymmetric
30
Graham/Harvey/Rajgopal: Corporate Reporting
Other insights on meeting benchmarks
Break out of the game• Why not declare that you will not play the earnings
management game?
31
Corporate Financial Reporting
Performance measurements (earnings, cash flows): Sec 3.1,Table 2
Voluntary disclosure
Earnings benchmarks
Sec 3.2, Table 3
Earnings trends:
Why meet benchmarks?Sec 3.3, Table 4
What if miss benchmarks? Sec 3.4, Table 5
How to meet benchmarks: Sec 4.1, Table 6
Value sacrifice to meet benchmarks:Sec 4.2, Table 7
Why smooth earnings?Sec 5.1, Table 8
Value sacrifice for smooth earnings Sec 5.2, Table 9
Why disclose?Sec 6.1,Table 11
Why not disclose?Sec 6.2, Table 12
TimingSec 6.3
Table 13
Fig. 1 Flowchart depicting the outline of the paper
32
Graham/Harvey/Rajgopal: Corporate Reporting
Smoothing
96.9% and 20/20 interviews prefer smooth earnings over more volatile holding cash flows constant
33
Graham/Harvey/Rajgopal: Corporate Reporting
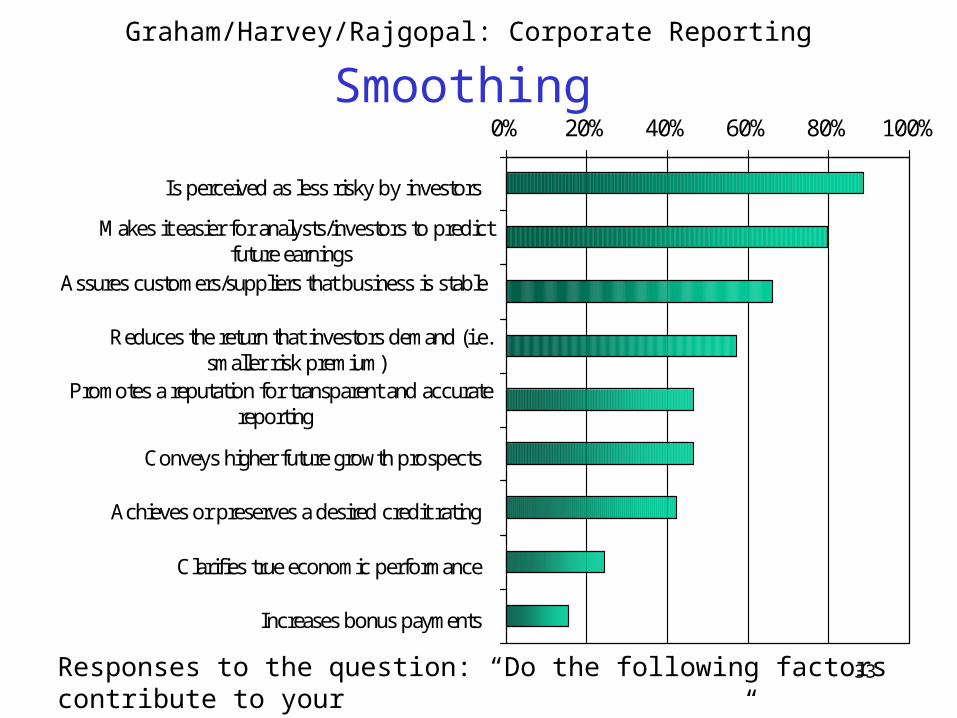
Smoothing 0% 20% 40% 60% 80% 100%
Is perceived as less risky by investors
Makes it easier for analysts/investors to predictfuture earnings
Assures customers/suppliers that business is stable
Reduces the return that investors demand (i.e.smaller risk premium)
Promotes a reputation for transparent and accuratereporting
Conveys higher future growth prospects
Achieves or preserves a desired credit rating
Clarifies true economic performance
Increases bonus payments
Responses to the question: “Do the following factors contribute to your company preferring a smooth earnings path?”
34
Graham/Harvey/Rajgopal: Corporate Reporting
Smoothing
Reasons• Lowers “risk”; increased predictability; lower “risk”
premium• Clear from survey and interviews that CFOs believe
that this risk is priced• Possible link to literature on: estimation error,
disagreement in asset pricing, information risk premium, and behavioral literature on risk versus uncertainty
35
Graham/Harvey/Rajgopal: Corporate Reporting
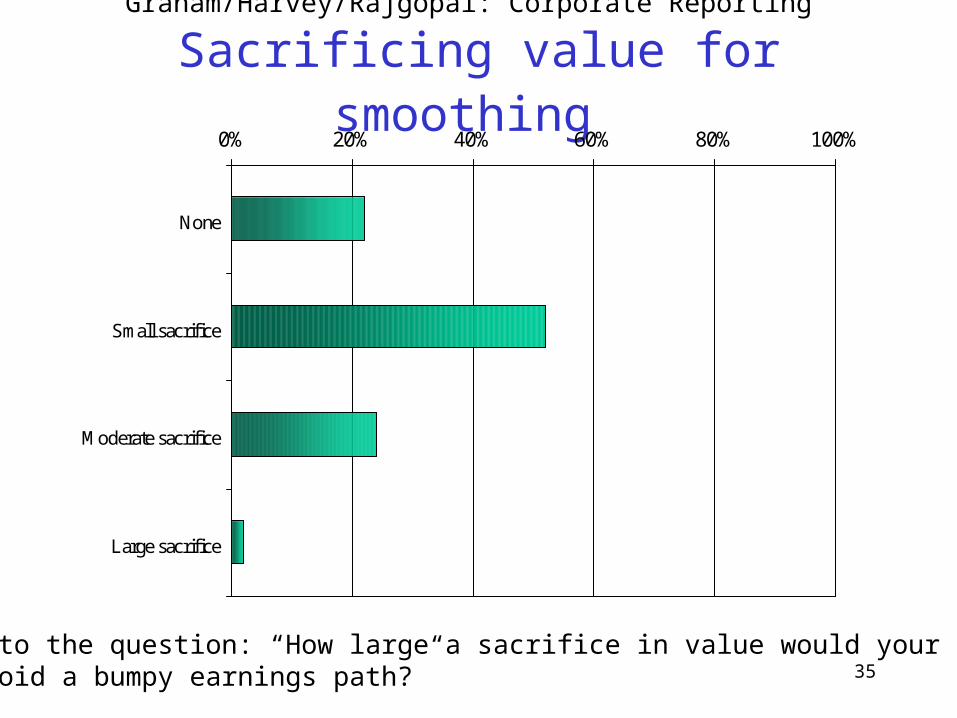
Sacrificing value for smoothing 0% 20% 40% 60% 80% 100%
None
Small sacrifice
Moderate sacrifice
Large sacrifice
Responses to the question: “How large a sacrifice in value would your firm make to avoid a bumpy earnings path?”
36
Graham/Harvey/Rajgopal: Corporate Reporting
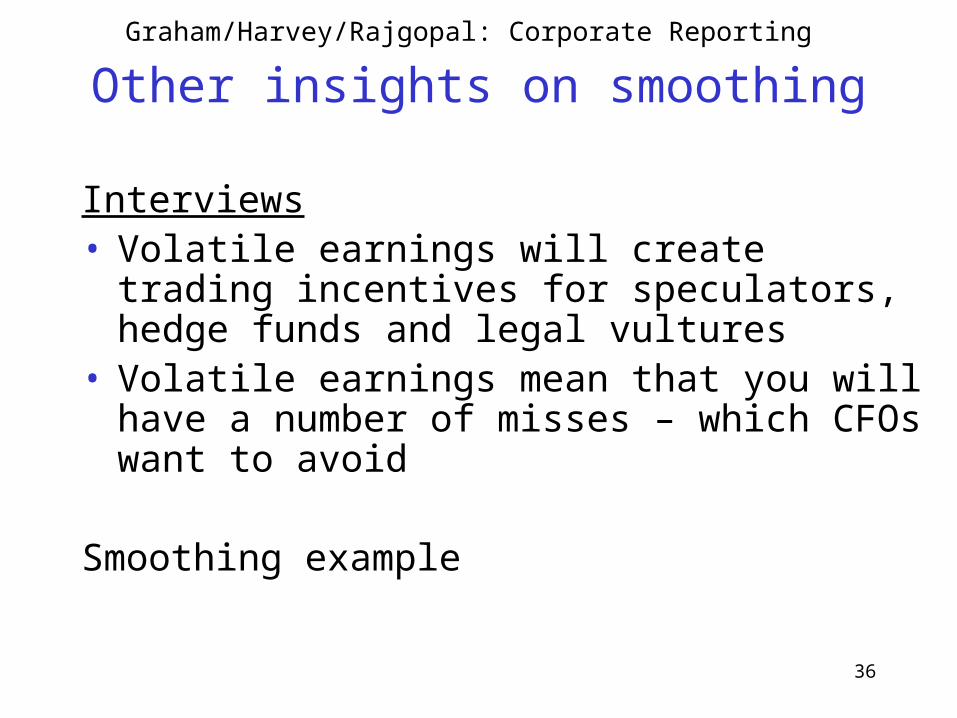
Other insights on smoothing
Interviews• Volatile earnings will create trading incentives for
speculators, hedge funds and legal vultures• Volatile earnings mean that you will have a number
of misses – which CFOs want to avoid
Smoothing example
37
Graham/Harvey/Rajgopal: Corporate Reporting
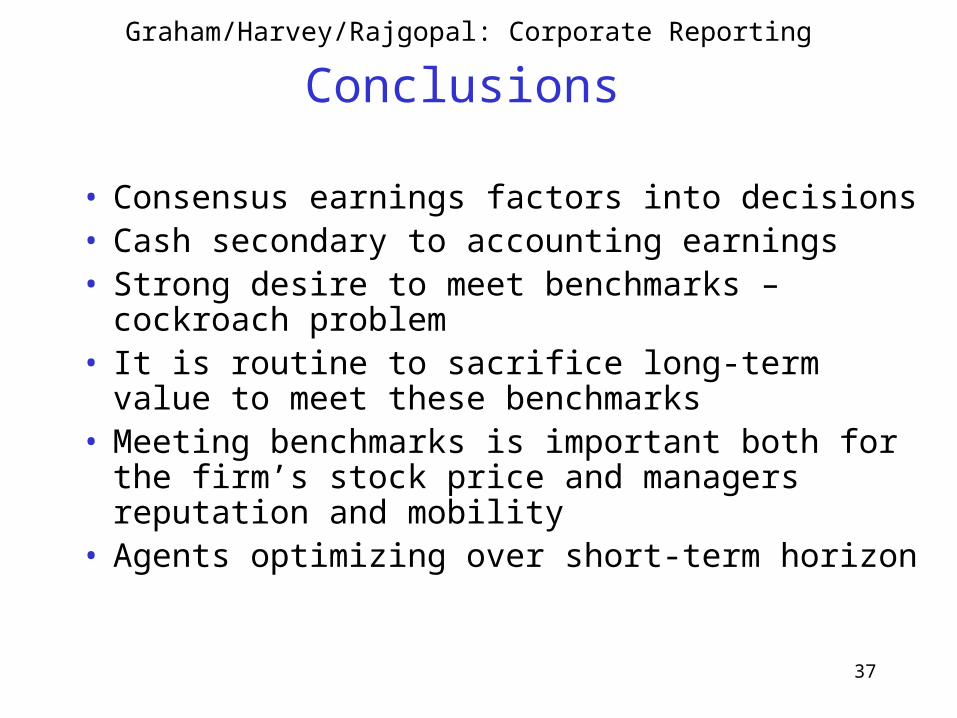
Conclusions
• Consensus earnings factors into decisions• Cash secondary to accounting earnings• Strong desire to meet benchmarks – cockroach
problem• It is routine to sacrifice long-term value to meet these
benchmarks• Meeting benchmarks is important both for the firm’s
stock price and managers reputation and mobility• Agents optimizing over short-term horizon
38
Graham/Harvey/Rajgopal: Corporate Reporting
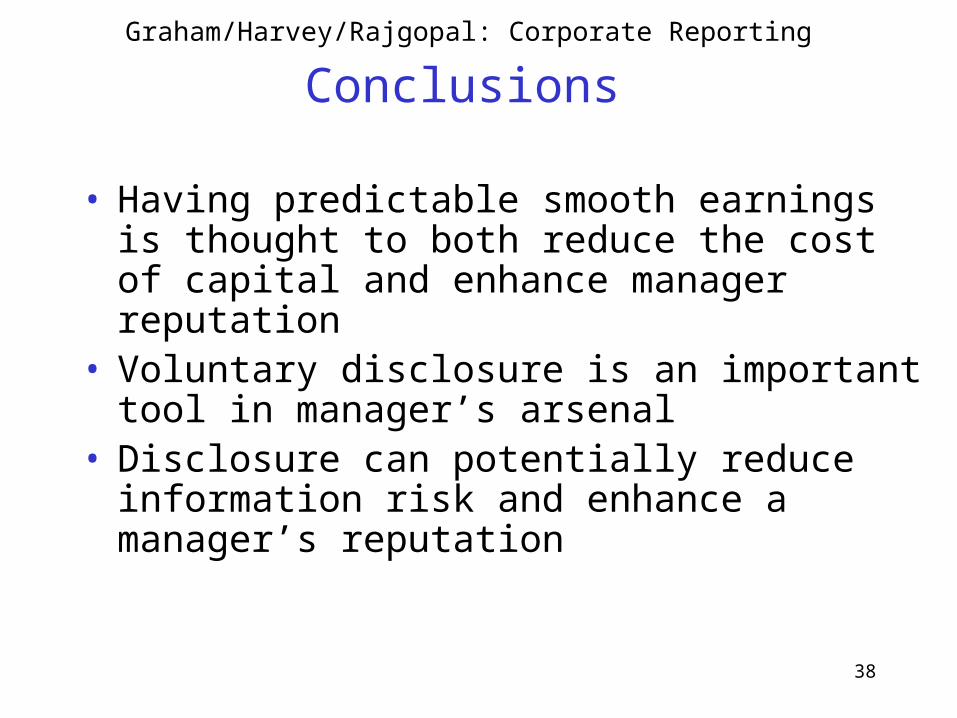
Conclusions
• Having predictable smooth earnings is thought to both reduce the cost of capital and enhance manager reputation
• Voluntary disclosure is an important tool in manager’s arsenal
• Disclosure can potentially reduce information risk and enhance a manager’s reputation
39
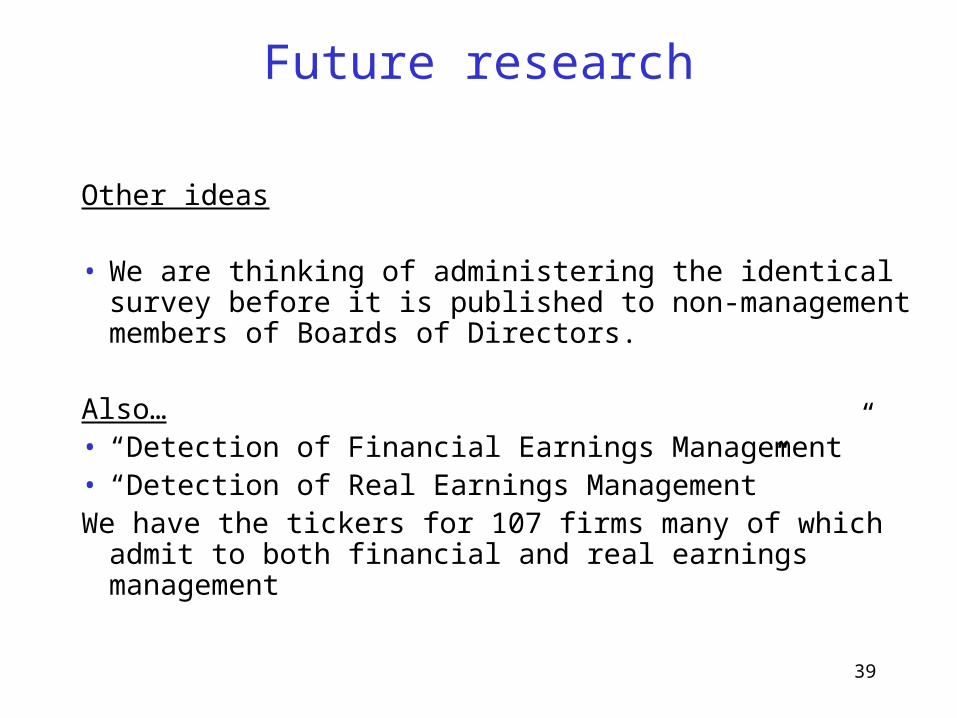
Future research
Other ideas
• We are thinking of administering the identical survey before it is published to non-management members of Boards of Directors.
Also…• “Detection of Financial Earnings Management”• “Detection of Real Earnings Management”We have the tickers for 107 firms many of which admit to both
financial and real earnings management
40
Future research
Other ideas
• Using the quarterly data– We have expected returns, individual volatility, direct
measures of overconfidence
41
Future research
0
1
2
3
4
5
6
7
8
Q2-20
00
Q3-20
00
Q4-20
00
Q1-20
01
Q2-20
01
Q3-20
01
Q3-20
01
Q1-20
02
Q2-20
02
Q3-20
02
Q4-20
02
Q1-20
03
Q2-20
03
Q3-20
03
Q4-20
03
Q1-20
04
Q2-20
04
Q3-20
04
Q4-20
04
Q1-20
05
Q2-20
05
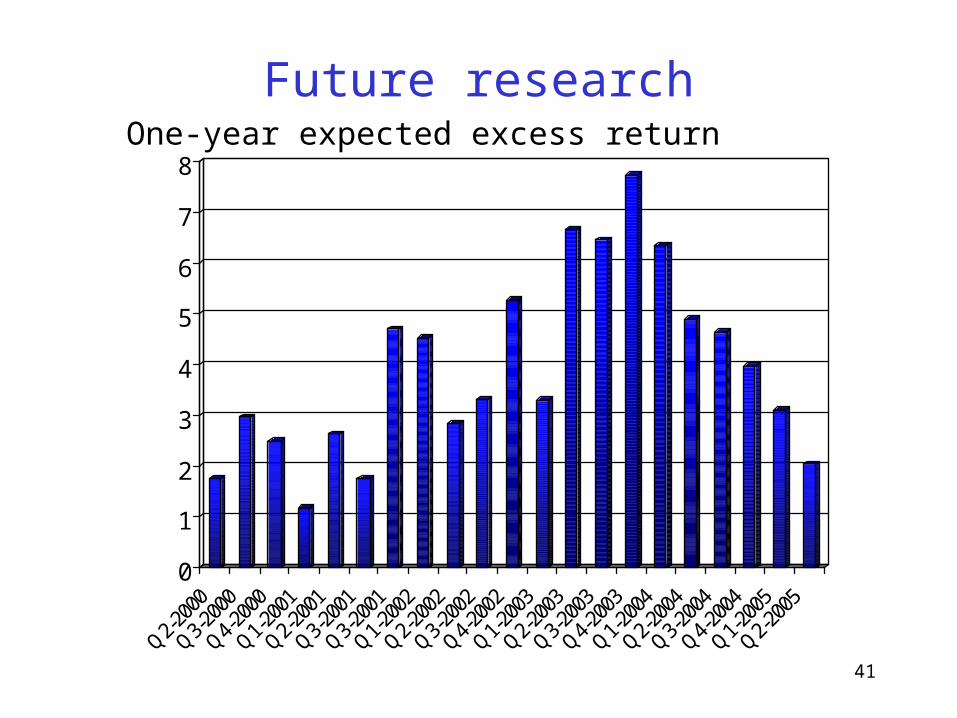
One-year expected excess return
42
Future research
0
1
2
3
4
5
6
7
8
Q2-20
00
Q3-20
00
Q4-20
00
Q1-20
01
Q2-20
01
Q3-20
01
Q3-20
01
Q1-20
02
Q2-20
02
Q3-20
02
Q4-20
02
Q1-20
03
Q2-20
03
Q3-20
03
Q4-20
03
Q1-20
04
Q2-20
04
Q3-20
04
Q4-20
04
Q1-20
05
Q2-20
05
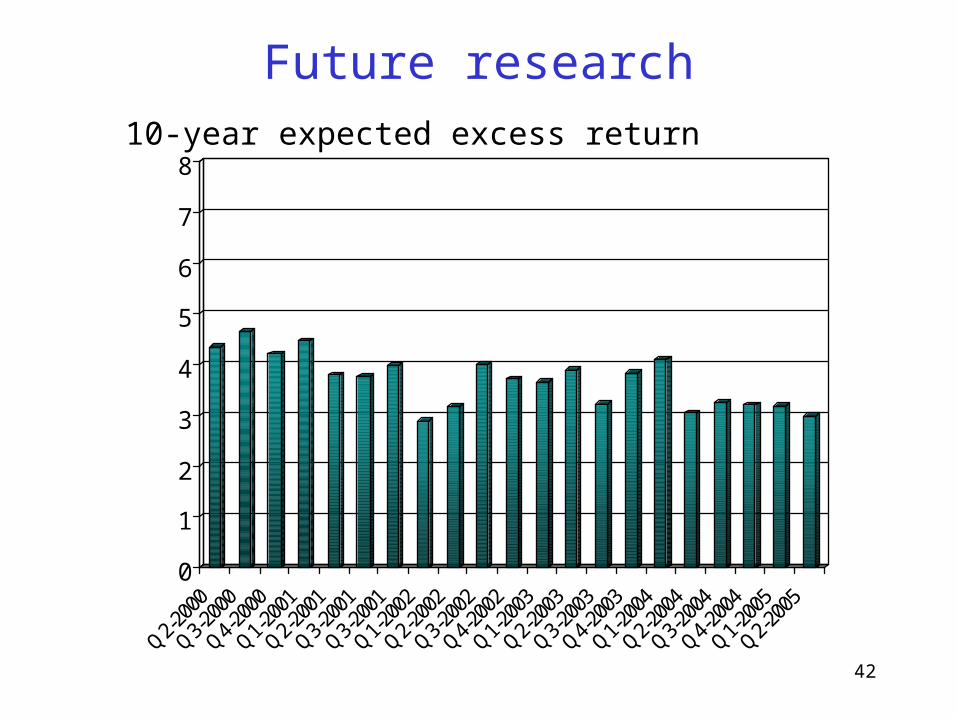
10-year expected excess return
43
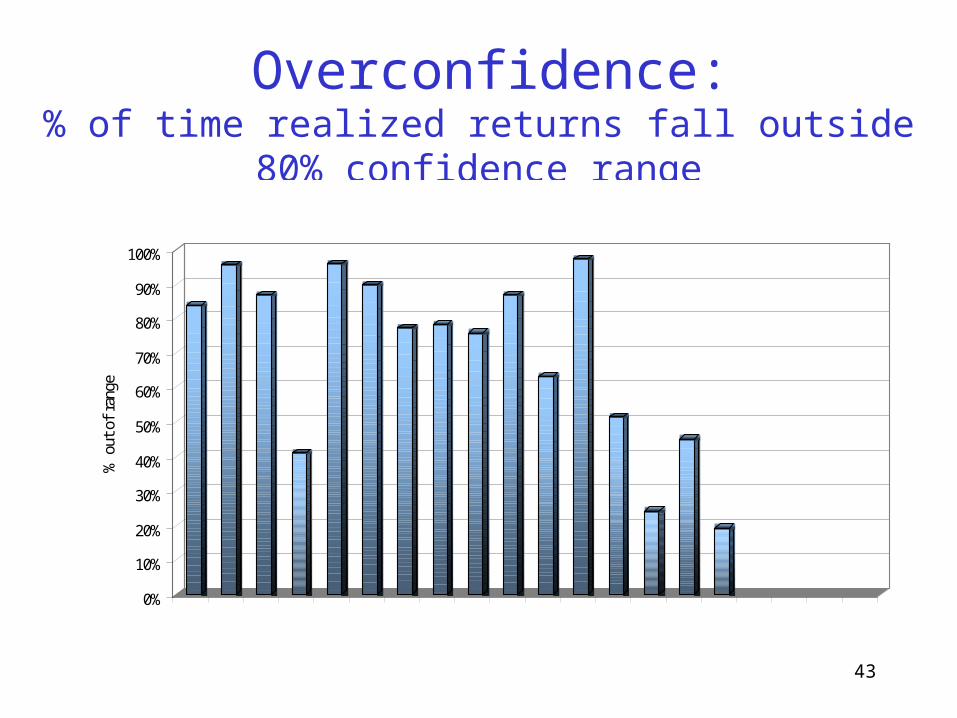
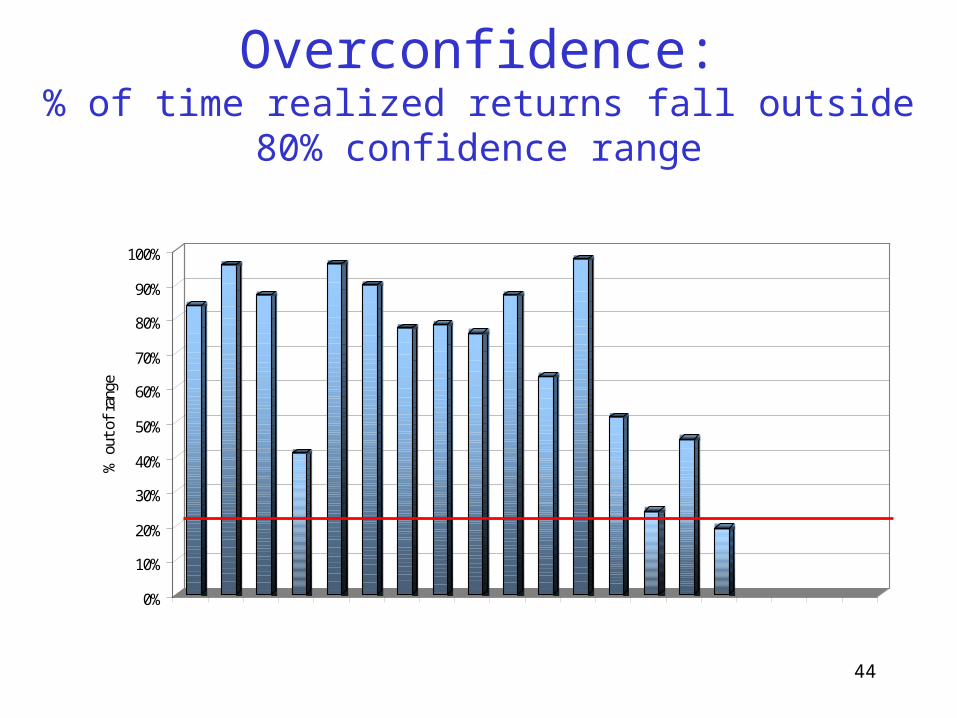
Overconfidence:% of time realized returns fall outside 80% confidence range
0%
10%
20%
30%
40%
50%
60%
70%
80%
90%
100%
% o
ut o
f ra
nge
Jun., Sept., Dec., Mar., Jun., Sept., Dec., Mar., Jun., Sept., Dec., Mar., Jun., Sept., Dec., Mar., Jun., Sept. Dec., Feb., 00 00 00 01 01 01 01 02 02 02 02 03 03 03 03 04 04 04 04 05
44
Overconfidence:% of time realized returns fall outside 80% confidence range
0%
10%
20%
30%
40%
50%
60%
70%
80%
90%
100%
% o
ut o
f ra
nge
Jun., Sept., Dec., Mar., Jun., Sept., Dec., Mar., Jun., Sept., Dec., Mar., Jun., Sept., Dec., Mar., Jun., Sept. Dec., Feb., 00 00 00 01 01 01 01 02 02 02 02 03 03 03 03 04 04 04 04 05
45
Future research
Linking corporate attitudes to actions
• Link overconfidence to corporate actions• Measure optimism and link to corporate actions