Embed Size (px)
Citation preview

1) The Earth heats up as it absorbs radiant energy from the Sun.
2) The warmed Earth re-emits energy as infrared radiation.
3) Greenhouse gases are gases that absorb in the frequencies of IR that the Earth emits and re-emits some of it back to the surface of the earth.
4) They also block the Earth from releasing some of its input energy. Thus the Earth reaches a higher T than before and its released energy matches the solar input and the T stabilizes.
How the greenhouse effect occurs:
So where does the real debate lie?
• We know we are adding greenhouse gases
• The real question is: what is the change in temperature given some change in GHG? i.e. will a 50% increase in GHG cause global temperature to rise by 1oC or 10oC?
• This is something we’re not really sure about, but we have some guesses.
• What causes us to not be sure? Feedbacks!

Example of negative feedback (GOOD CHANCE TO BE ON FINAL)
• 1. Temperature goes up due to GHGs.• 2. This means more evaporation from oceans• 3. This means more clouds• 4. Clouds reflect sunlight, so more sunlight reflected.• 5. Therefore temperature goes down again.• 6. Negative feedback – the initial increase in
temperature in (1) leads to events that cause a reduction in this temperature increase. e.g. GHGs cause an increase in T by 2 K, but the cycle of evaporation and clouds causes a cooling by 1 K, leading to an overall warming of only 1 K.
Example of positive feedback (GOOD CHANCE TO BE ON FINAL)
• 1. Temperature goes up due to GHGs.• 2. This means more sea ice and glaciers melt.• 3. Ice is very reflective.• 4. Therefore, less sunlight is reflected.• 5. Therefore more sunlight is absorbed, causing a
further increase in temperature!• 6. Positive feedback – the initial increase in
temperature in (1) leads to events that cause an amplification of this temperature increase) e.g. GHGs cause an increase in T by 2 K, but the melting ice scenario causes a further warming by 2 K, leading to an overall warming of 4 K.
Predicting Climate Change• The climate system exhibits countless feedback cycles, some
positive and some negative.
• The sum of all of these feedbacks determines what future temperatures will be.
• However, accurately incorporating all of these feedbacks into a computer model is a very large challenge!
• Therefore, there is uncertainty in our predictions of future climate.
• Questions to Think About – Especially for the FINAL• What are some of the uncertainties in predicting what will
happen in the future (over the next 100 years or so)?
• What are predicted consequences of a warming world?
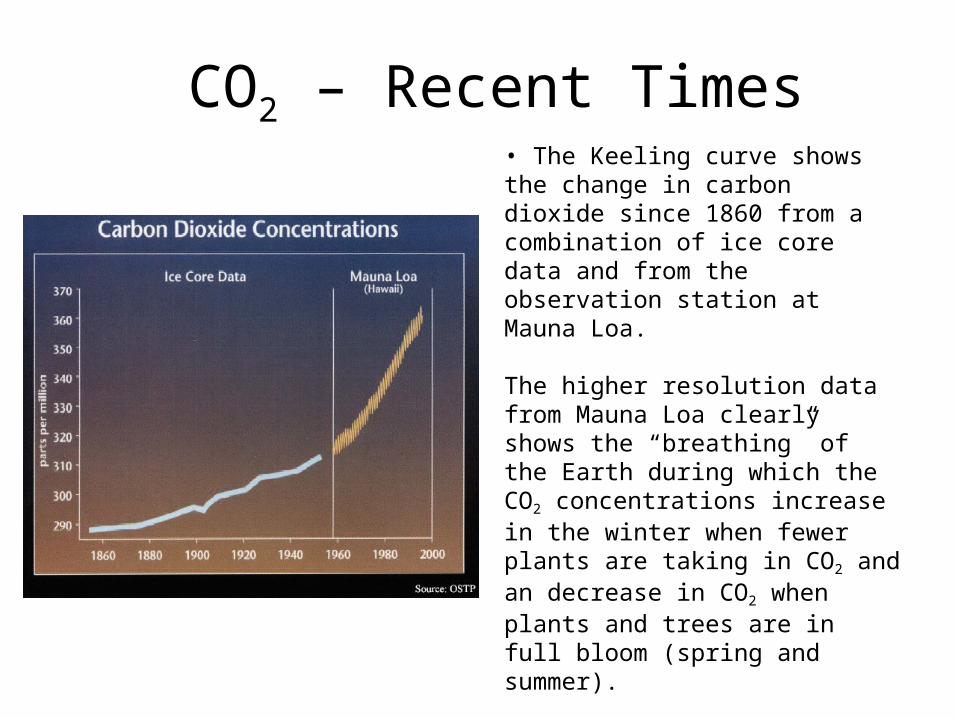
CO2 – Recent Times• The Keeling curve shows the change in carbon dioxide since 1860 from a combination of ice core data and from the observation station at Mauna Loa.
The higher resolution data from Mauna Loa clearly shows the “breathing” of the Earth during which the CO2 concentrations increase in the winter when fewer plants are taking in CO2 and an decrease in CO2 when plants and trees are in full bloom (spring and summer).
Considering both records there has been an indisputable increase in CO2 concentration worldwide.

Temp change – Recent Times• The global Average Temperature
has also increased over the same time period.
• The change has not been as steady and even.
• These temperature fluctuations are due primarily to feedbacks within the climate system that are very difficult to predict.
• Even including all the short term increases and decreases in temperature we see a definite increase in global average temperature between 1860 and 2000 of about 0.9°C.
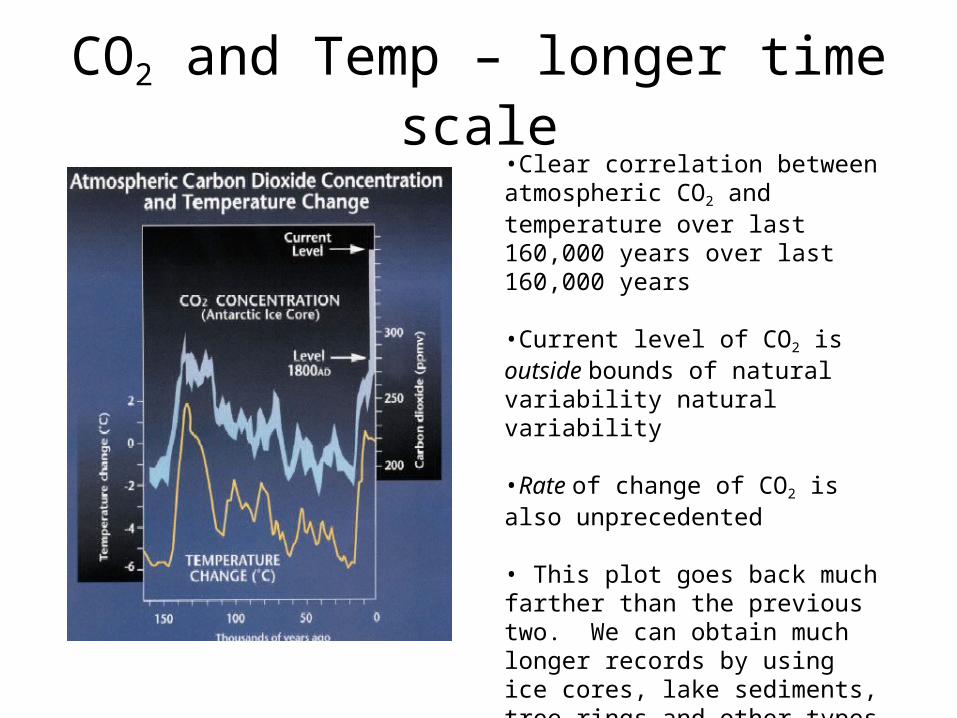
CO2 and Temp – longer time scale•Clear correlation between atmospheric CO2 and temperature over last 160,000 years over last 160,000 years
•Current level of CO2 is outside bounds of natural variability natural variability
•Rate of change of CO2 is also unprecedented
• This plot goes back much farther than the previous two. We can obtain much longer records by using ice cores, lake sediments, tree-rings and other types of proxy records.

CO2 and Temp – longer time scale
•This curve shows how the temperature deviation from the mean is much greater now then it has ever been as far back as 1000 years.
•This says something about how extreme the temperature changes actually are.
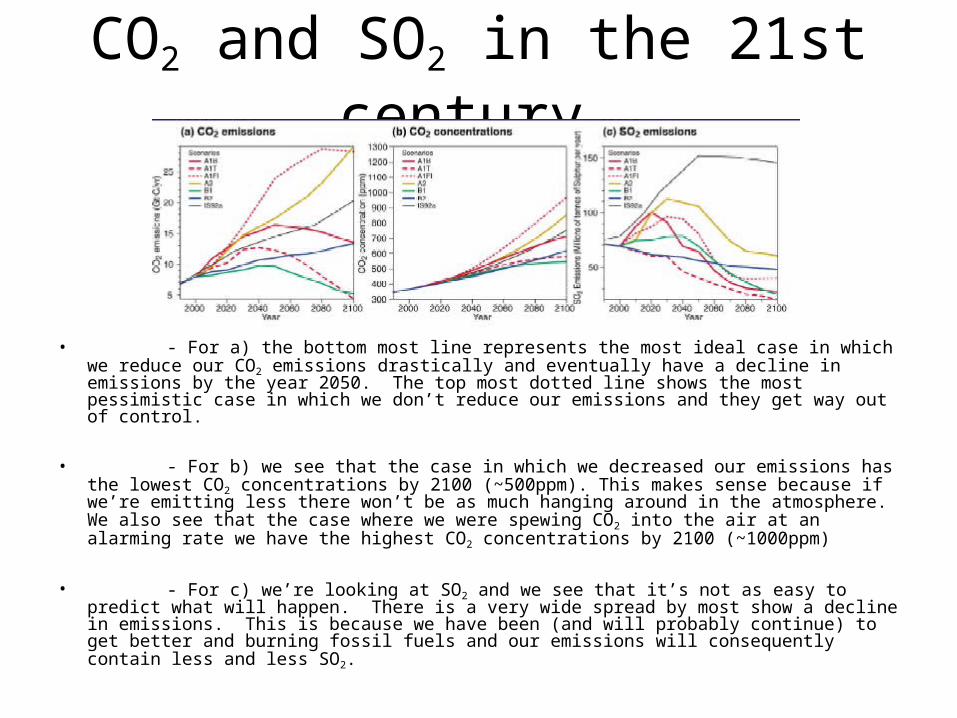
CO2 and SO2 in the 21st century
• - For a) the bottom most line represents the most ideal case in which we reduce our CO2 emissions drastically and eventually have a decline in emissions by the year 2050. The top most dotted line shows the most pessimistic case in which we don’t reduce our emissions and they get way out of control.
• - For b) we see that the case in which we decreased our emissions has the lowest CO2 concentrations by 2100 (~500ppm). This makes sense because if we’re emitting less there won’t be as much hanging around in the atmosphere. We also see that the case where we were spewing CO2 into the air at an alarming rate we have the highest CO2 concentrations by 2100 (~1000ppm)
• - For c) we’re looking at SO2 and we see that it’s not as easy to predict what will happen. There is a very wide spread by most show a decline in emissions. This is because we have been (and will probably continue) to get better and burning fossil fuels and our emissions will consequently contain less and less SO2.

Three other important Gases
Indicators of the Human influence on the atmosphere during the Industrial Era.• We can look at three gases
- Carbon Dioxide – went from 280ppm to approximately 360ppm in 2000 (parts per million).
- Methane – went from 750ppb to 175-ppb (parts per billion)
- Nitrous Oxide – went from 270ppb to 310ppb by 2000 (parts per billion)• All of which has shown a dramatic increase in concentration since the beginning of the industrial revolution.
Temperature Predictions
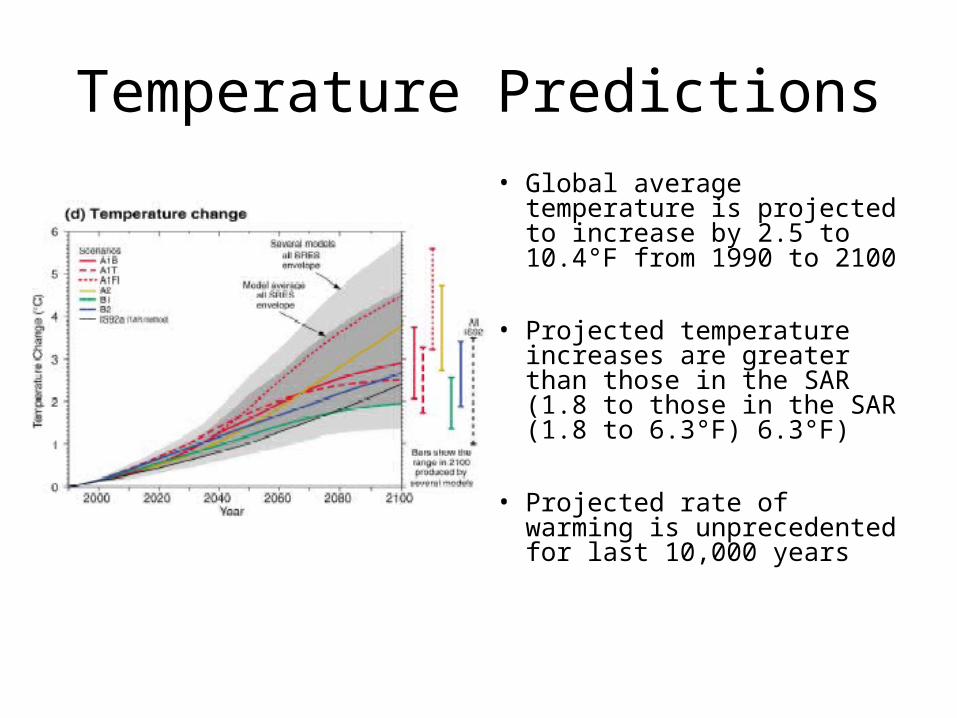
• Global average temperature is projected to increase by 2.5 to 10.4°F from 1990 to 2100
• Projected temperature increases are greater than those in the SAR (1.8 to those in the SAR (1.8 to 6.3°F) 6.3°F)
• Projected rate of warming is unprecedented for last 10,000 years
Variations of the Earth’s Surface Temperature 1000-2100
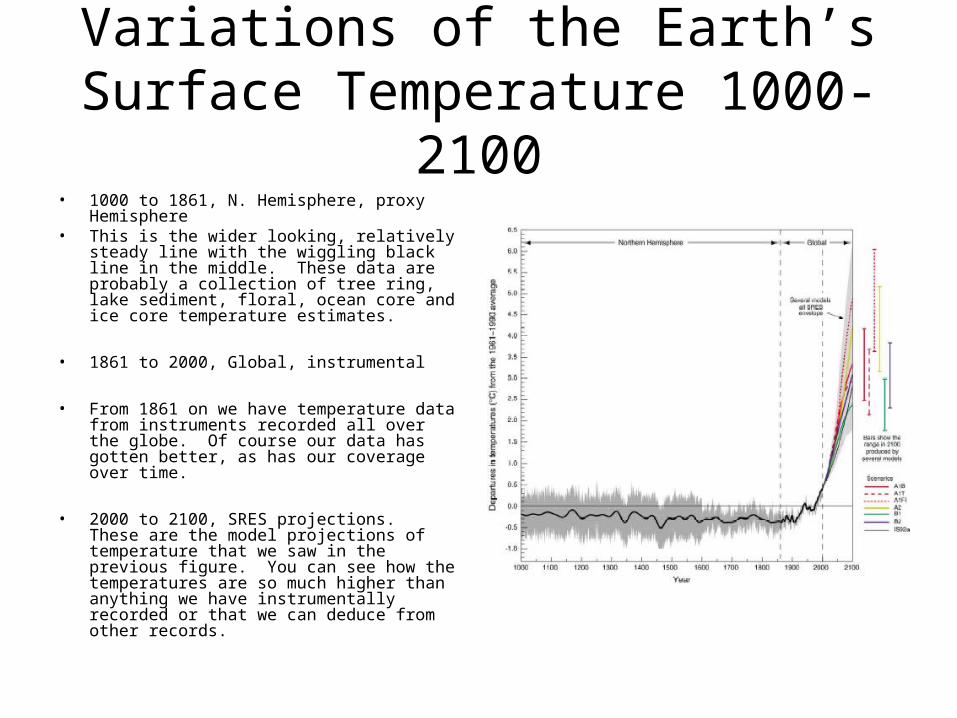
• 1000 to 1861, N. Hemisphere, proxy Hemisphere
• This is the wider looking, relatively steady line with the wiggling black line in the middle. These data are probably a collection of tree ring, lake sediment, floral, ocean core and ice core temperature estimates.
• 1861 to 2000, Global, instrumental
• From 1861 on we have temperature data from instruments recorded all over the globe. Of course our data has gotten better, as has our coverage over time.
• 2000 to 2100, SRES projections. These are the model projections of temperature that we saw in the previous figure. You can see how the temperatures are so much higher than anything we have instrumentally recorded or that we can deduce from other records.
Projected Changes in Annual Temperatures for the 2050s
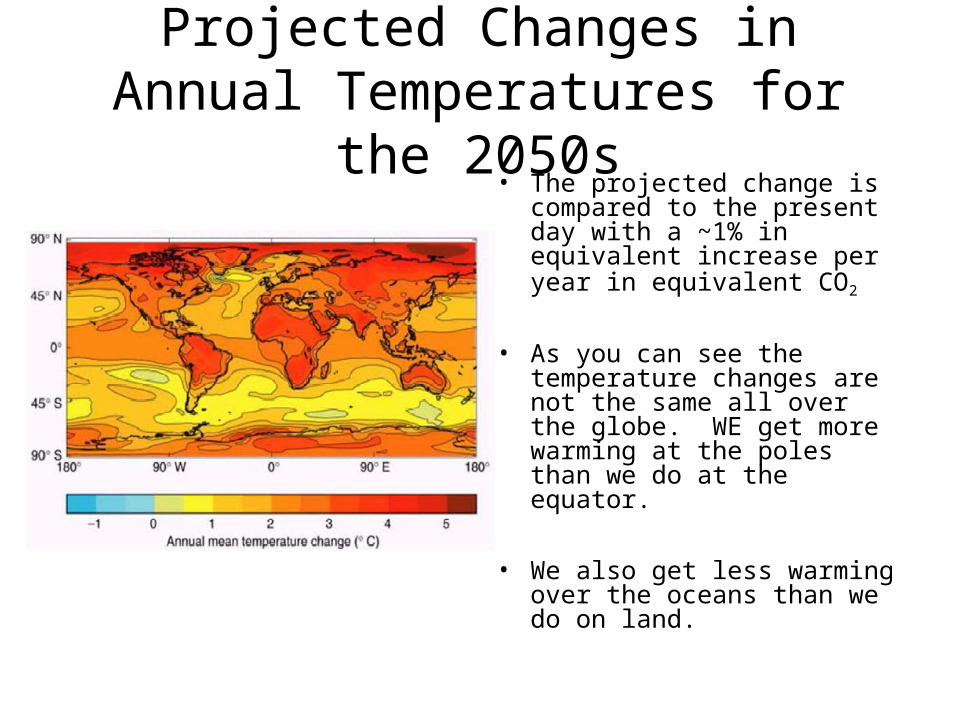
• The projected change is compared to the present day with a ~1% in equivalent increase per year in equivalent CO2
• As you can see the temperature changes are not the same all over the globe. WE get more warming at the poles than we do at the equator.
• We also get less warming over the oceans than we do on land.

Potential Climate Change Impacts due to:
• Temperature, Precipitation and Sea level rise
• Health – Weather-related mortality, infectious diseases, Air-Quality and respiratory illnesses.
• Agriculture – crop yields, Irrigation demands
• Forests – Change in forest composition, shift in geographic range of forests, Forest health and productivity will change.
• Water Resources – Changes in water supply, Water quality, Increases competition for water.
• Coastal Areas – Erosion of beaches, inundation of coastal lands, costs to protect coastal communities.
• Species and Natural Areas – Shift in ecological zones, loss of habitat and species.
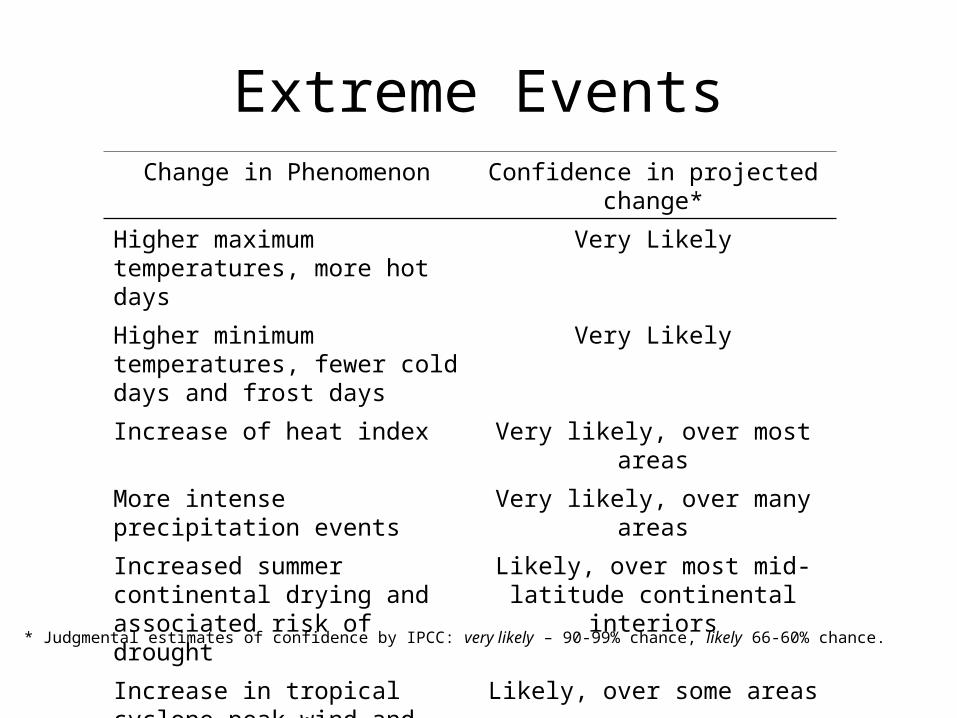
Extreme EventsChange in Phenomenon Confidence in projected change*
Higher maximum temperatures, more hot days
Very Likely
Higher minimum temperatures, fewer cold days and frost days
Very Likely
Increase of heat index Very likely, over most areas
More intense precipitation events Very likely, over many areas
Increased summer continental drying and associated risk of drought
Likely, over most mid-latitude continental interiors
Increase in tropical cyclone peak wind and precipitation intensities
Likely, over some areas
* Judgmental estimates of confidence by IPCC: very likely – 90-99% chance, likely 66-60% chance.
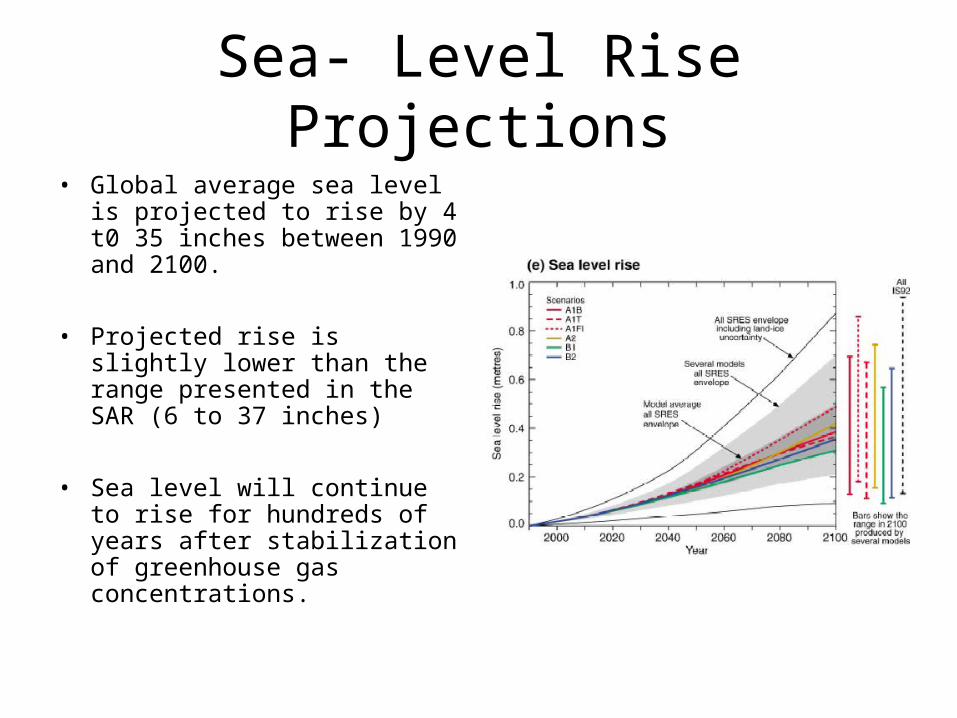
Sea- Level Rise Projections
• Global average sea level is projected to rise by 4 t0 35 inches between 1990 and 2100.
• Projected rise is slightly lower than the range presented in the SAR (6 to 37 inches)
• Sea level will continue to rise for hundreds of years after stabilization of greenhouse gas concentrations.
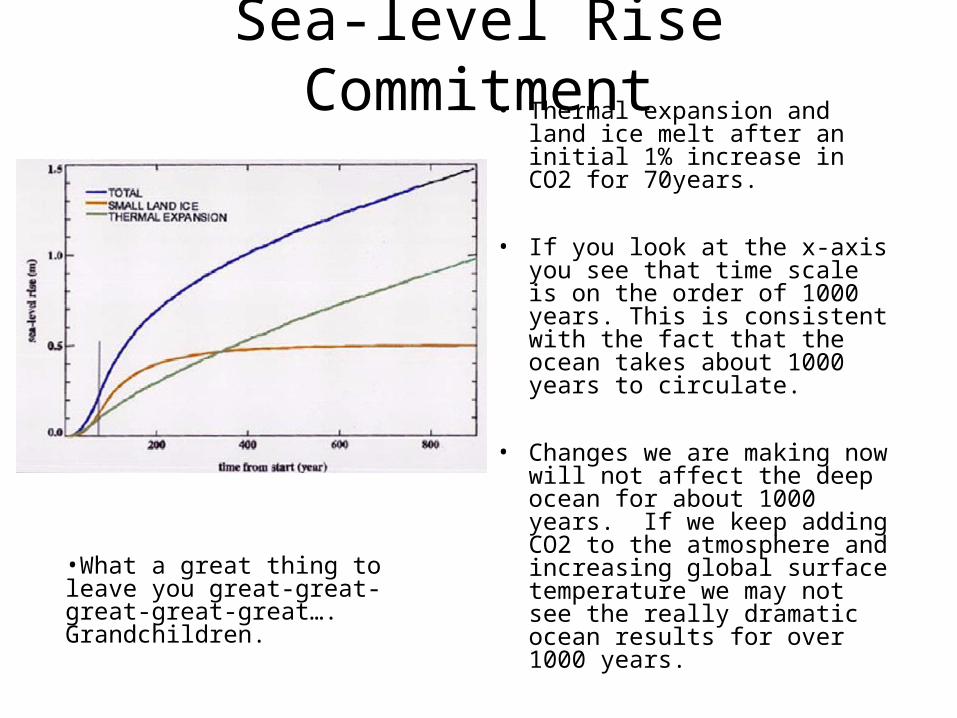
Sea-level Rise Commitment• Thermal expansion and land
ice melt after an initial 1% increase in CO2 for 70years.
• If you look at the x-axis you see that time scale is on the order of 1000 years. This is consistent with the fact that the ocean takes about 1000 years to circulate.
• Changes we are making now will not affect the deep ocean for about 1000 years. If we keep adding CO2 to the atmosphere and increasing global surface temperature we may not see the really dramatic ocean results for over 1000 years.
•What a great thing to leave you great-great-great-great-great…. Grandchildren.

Crop Yield Change• Maps show the percentage change in
average crop yields for the 2020s, 2050s, and 2080s. Effects of CO2 are taken into account. Crops modeled are: wheat, maize and rice.
• • As you can see, most of the world would experience a decrease in crop yield.
• Canada is lucky and experiences an increase in crop yield due to the increased length of the growing season. So Canada is the place to go farming by 2080.
• Areas that are particularly hard hit are Mexico, some African countries, Saudi Arabia, India, Pakistan and other countries in that area.
• You’re basically making dry places even drying and less likely to be able to support crop growth.
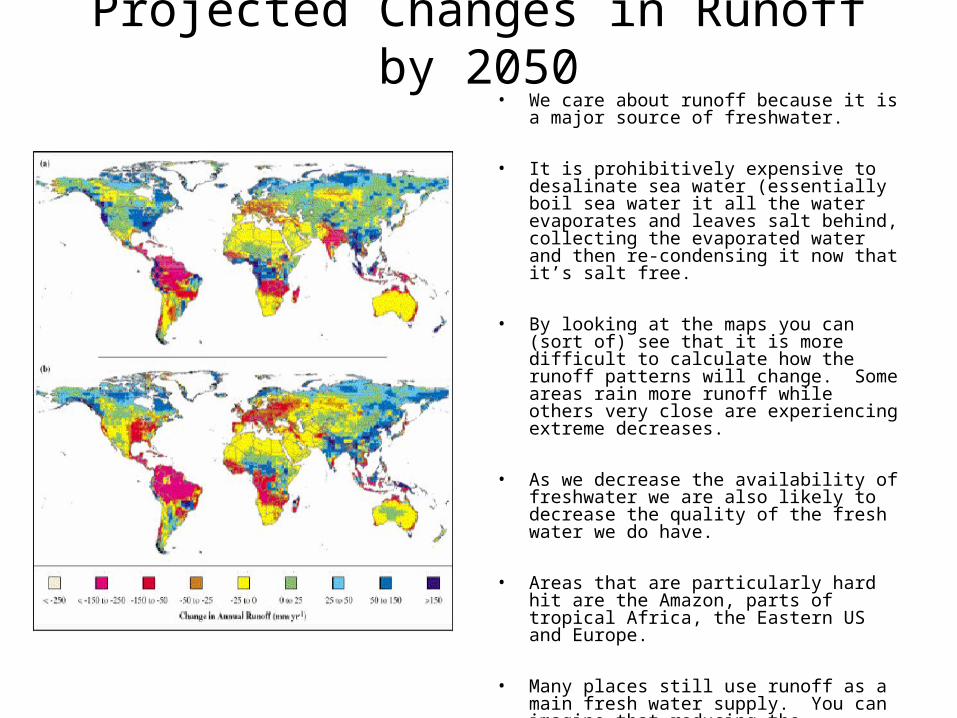
Projected Changes in Runoff by 2050• We care about runoff because it is a
major source of freshwater.
• It is prohibitively expensive to desalinate sea water (essentially boil sea water it all the water evaporates and leaves salt behind, collecting the evaporated water and then re-condensing it now that it’s salt free.
• By looking at the maps you can (sort of) see that it is more difficult to calculate how the runoff patterns will change. Some areas rain more runoff while others very close are experiencing extreme decreases.
• As we decrease the availability of freshwater we are also likely to decrease the quality of the fresh water we do have.
• Areas that are particularly hard hit are the Amazon, parts of tropical Africa, the Eastern US and Europe.
• Many places still use runoff as a main fresh water supply. You can imagine that reducing the availability of fresh water can have many negative impacts.
Impacts of Clime Change on Human Health
• Beneficial- Reduced winter mortality in mid- and high- latitudes
1) Due to warmer winter temps
• Adverse- Increased mortality from heat stress
1) Due to warmer summer temps2) More very hot days
- Wider spread of infectious diseases1) Longer growing seasons2) More very warm areas3) And fewer places that experience frost increase the locations insects
that carry infectious diseases can breed- Worsening air quality
1) Increased atmospheric content of CO2, CH4 and NO2, and O3 probably- Decreased food supply in developing countries
1) Think about the changes in crop yields and remember which countries where going to be hit the hardest, those in the Middle East, Africa and India.- Many impacts from possibly increasing frequency and intensity of storms, floods, droughts, and cyclones.