Embed Size (px)
Citation preview
1
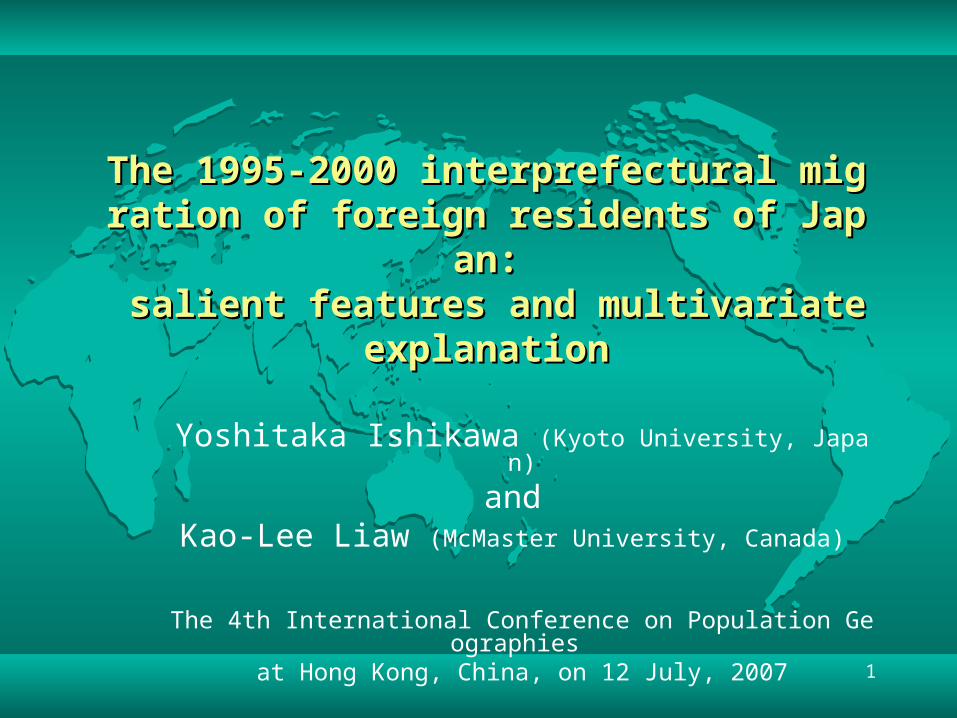
The 1995-2000 interprefectural migration of forThe 1995-2000 interprefectural migration of foreign residents of Japan:eign residents of Japan:
salient features and multivariate explanation salient features and multivariate explanation
Yoshitaka Ishikawa (Kyoto University, Japan)
and Kao-Lee Liaw (McMaster University, Canada)
The 4th International Conference on Population Geographies at Hong Kong, China, on 12 July, 2007
2
Existing literature focused Existing literature focused on foreign residents in Japanon foreign residents in Japan
◆There has been a proliferation of research since the mid-1980s, when massive immigration started.
◆ Foreigner rate is low (1.6% ) , but absolute number is large (approximately 2 million).
◆It is now an important research subject of all social sciences including geography.
3
Difficulty in studying migration Difficulty in studying migration of foreign residents in Japanof foreign residents in Japan
◆ No comprehensive source; general migration patterns have remained unknown.
◆ Published Reports of 2000 Census 1) specific origins are unknown both for immigration and
internal migration
2) detailed migrants’ attributes are unknown
⇒ special application to Japanese Statistics Bureau to obtain micro data samples
4
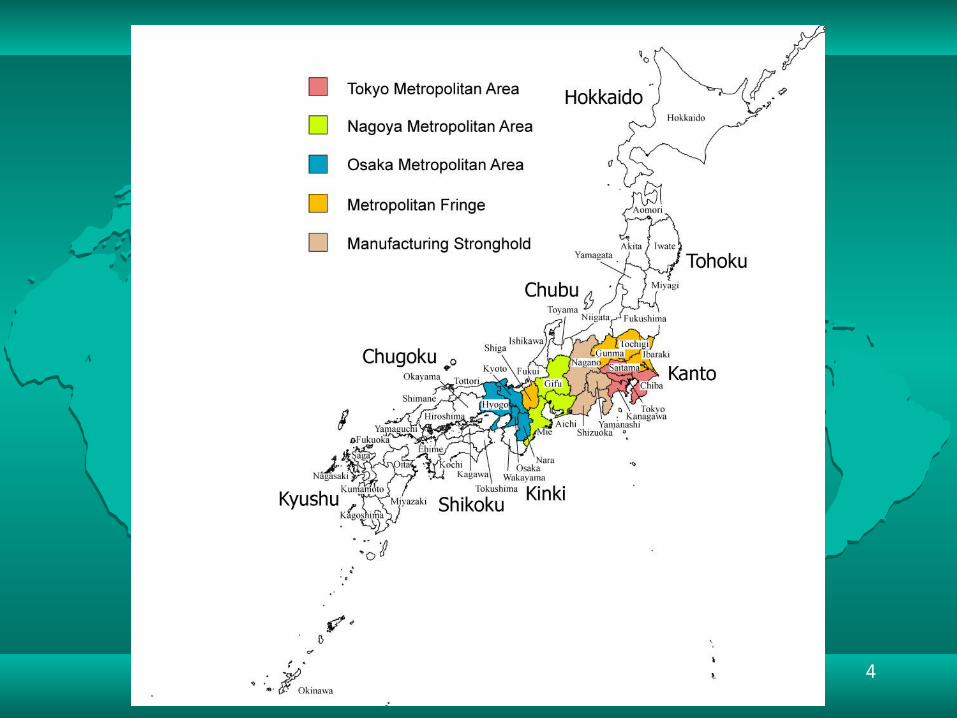
Three perspectives to explain Three perspectives to explain destination choicedestination choice
5
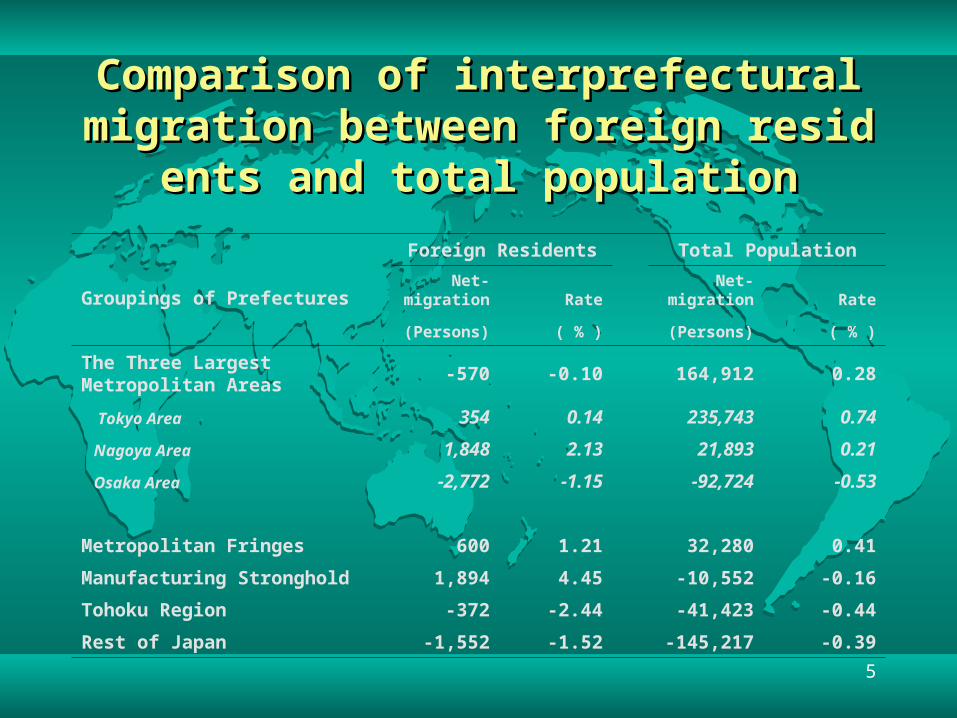
Comparison of interprefectural migration bComparison of interprefectural migration between foreign residents and total populatetween foreign residents and total populat
ionion
Foreign Residents Total Population
Groupings of Prefectures
Net-migration Rate
Net-migration Rate
(Persons) ( % ) (Persons) ( % )
The Three Largest Metropolitan Areas
-570 -0.10 164,912 0.28
Tokyo Area 354 0.14 235,743 0.74
Nagoya Area 1,848 2.13 21,893 0.21
Osaka Area -2,772 -1.15 -92,724 -0.53
Metropolitan Fringes 600 1.21 32,280 0.41
Manufacturing Stronghold 1,894 4.45 -10,552 -0.16
Tohoku Region -372 -2.44 -41,423 -0.44
Rest of Japan -1,552 -1.52 -145,217 -0.39
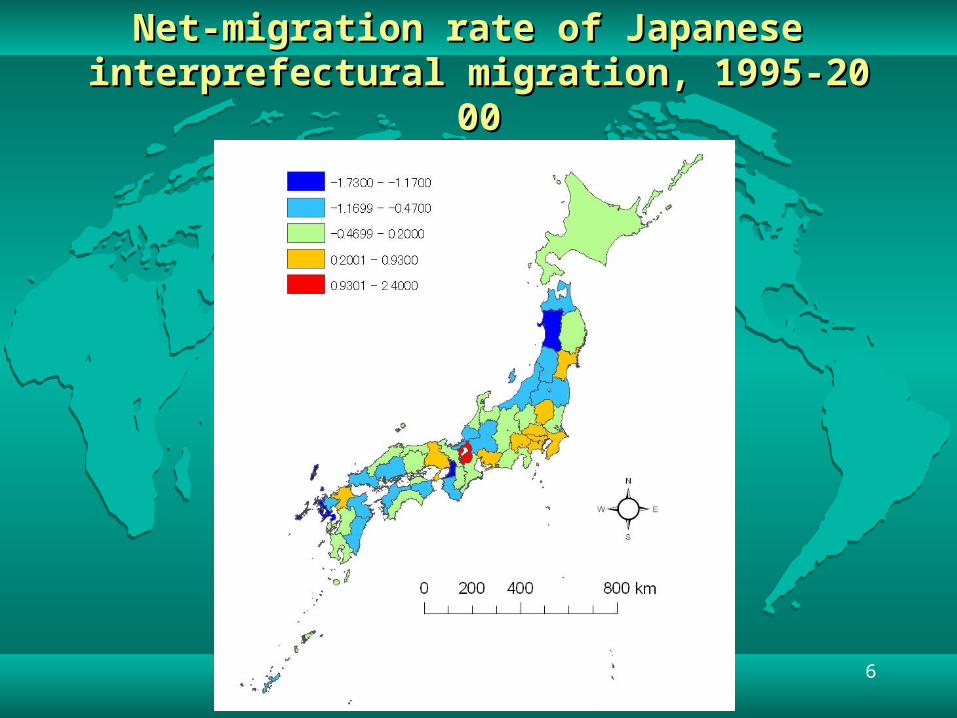
6
Net-migration rate of Japanese Net-migration rate of Japanese interprefectural migration, 1995-2000interprefectural migration, 1995-2000
7
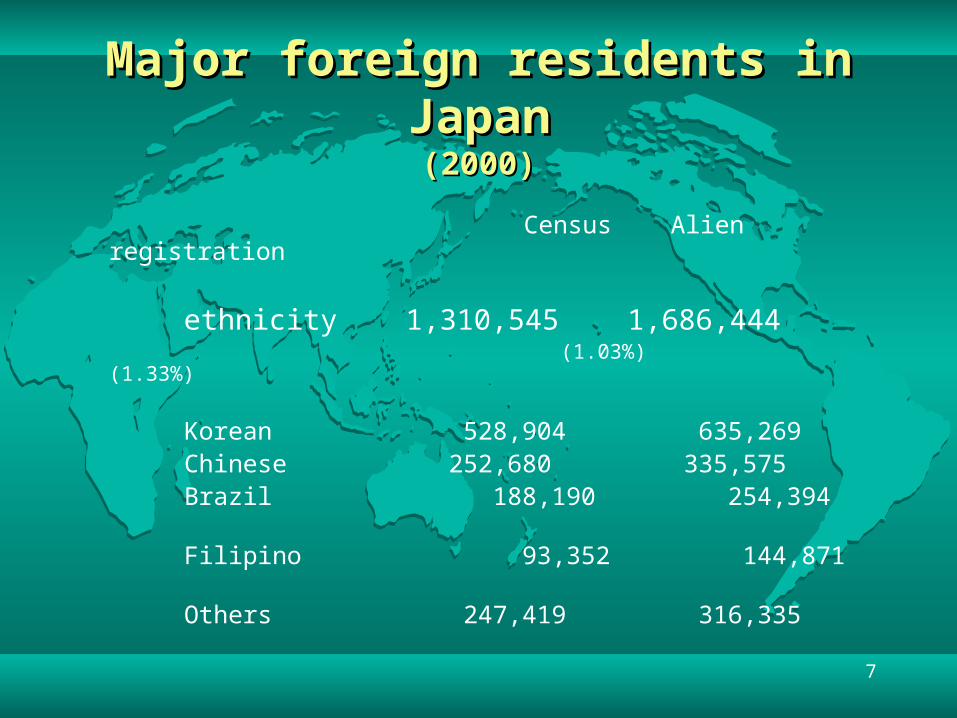
Major foreign residents in Major foreign residents in JapanJapan(2000)(2000)
Census Alien registration
ethnicity 1,310,545 1,686,444 (1.03%) (1.33%)
Korean 528,904 635,269 Chinese 252,680 335,575 Brazil 188,190 254,394 Filipino 93,352 144,871 Others 247,419 316,335
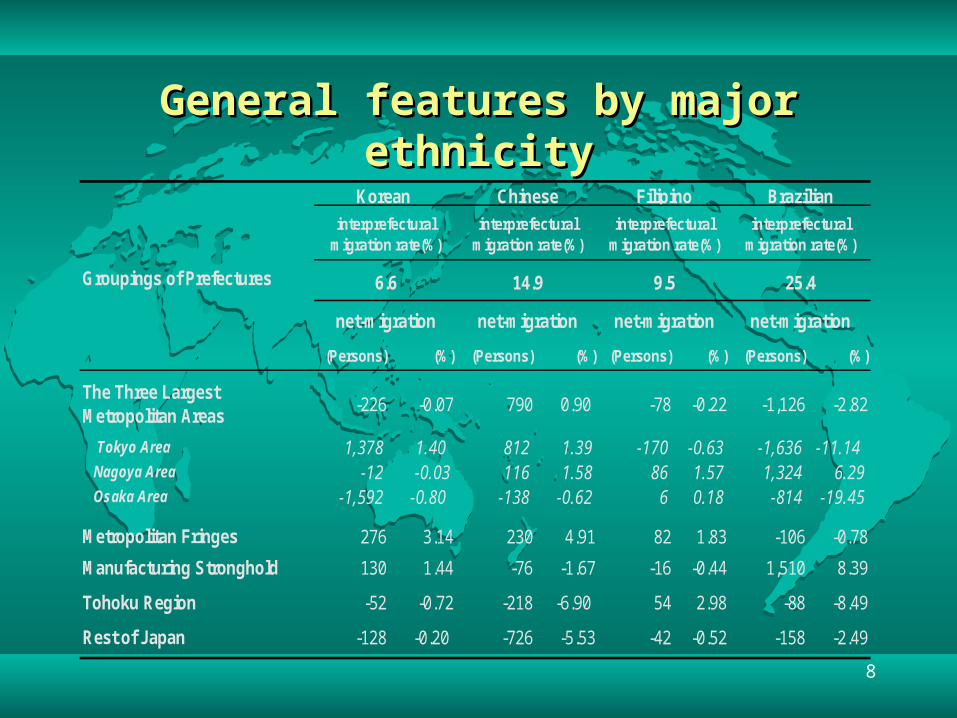
8
General features by major General features by major ethnicityethnicity
(Persons) (%) (Persons) (%) (Persons) (%) (Persons) (%)
The Three LargestMetropolitan Areas
-226 -0.07 790 0.90 -78 -0.22 -1,126 -2.82
Tokyo Area 1,378 1.40 812 1.39 -170 -0.63 -1,636 -11.14 Nagoya Area -12 -0.03 116 1.58 86 1.57 1,324 6.29 Osaka Area -1,592 -0.80 -138 -0.62 6 0.18 -814 -19.45
Metropolitan Fringes 276 3.14 230 4.91 82 1.83 -106 -0.78
Manufacturing Stronghold 130 1.44 -76 -1.67 -16 -0.44 1,510 8.39
Tohoku Region -52 -0.72 -218 -6.90 54 2.98 -88 -8.49
Rest of Japan -128 -0.20 -726 -5.53 -42 -0.52 -158 -2.49
interprefecturalmigration rate(%)
net-migration net-migration net-migration net-migration
6.6 14.9 9.5 25.4Groupings of Prefectures
interprefecturalmigration rate(%)
interprefecturalmigration rate(%)
interprefecturalmigration rate(%)
Korean Chinese Filipino Brazilian
9
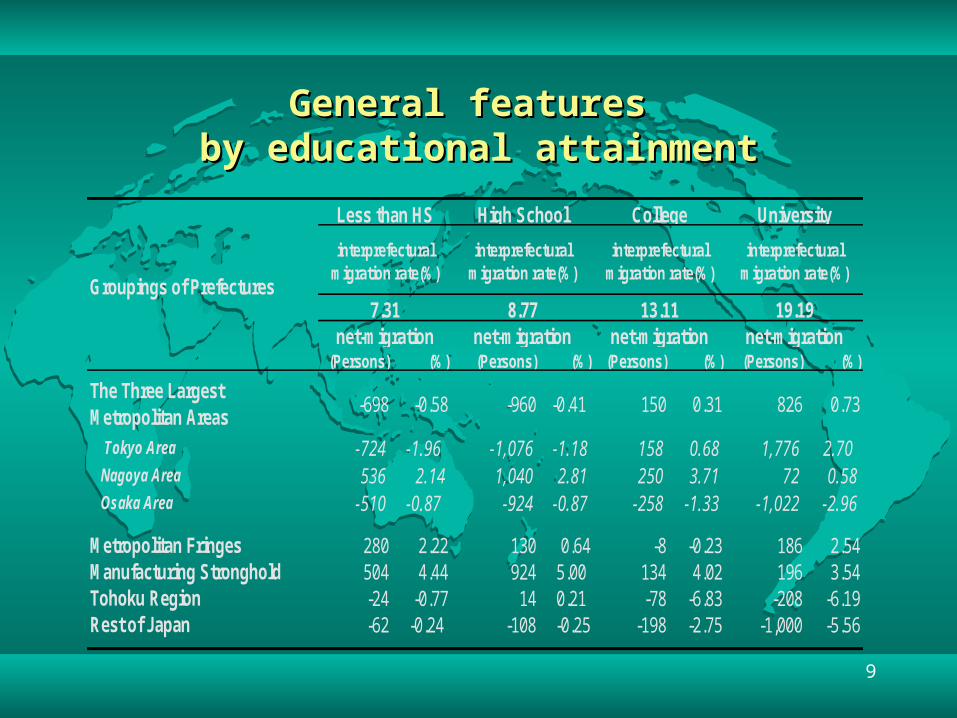
General features General features by educational attainmentby educational attainment
(Persons) (%) (Persons) (%) (Persons) (%) (Persons) (%)
The Three LargestMetropolitan Areas
-698 -0.58 -960 -0.41 150 0.31 826 0.73
Tokyo Area -724 -1.96 -1,076 -1.18 158 0.68 1,776 2.70 Nagoya Area 536 2.14 1,040 2.81 250 3.71 72 0.58 Osaka Area -510 -0.87 -924 -0.87 -258 -1.33 -1,022 -2.96
Metropolitan Fringes 280 2.22 130 0.64 -8 -0.23 186 2.54Manufacturing Stronghold 504 4.44 924 5.00 134 4.02 196 3.54Tohoku Region -24 -0.77 14 0.21 -78 -6.83 -208 -6.19Rest of Japan -62 -0.24 -108 -0.25 -198 -2.75 -1,000 -5.56
19.19net-migration net-migration net-migration net-migration
University
interprefecturalmigration rate(%)
interprefecturalmigration rate(%)
interprefecturalmigration rate(%)
interprefecturalmigration rate(%)
Groupings of Prefectures
Less than HS High School College
7.31 8.77 13.11
10
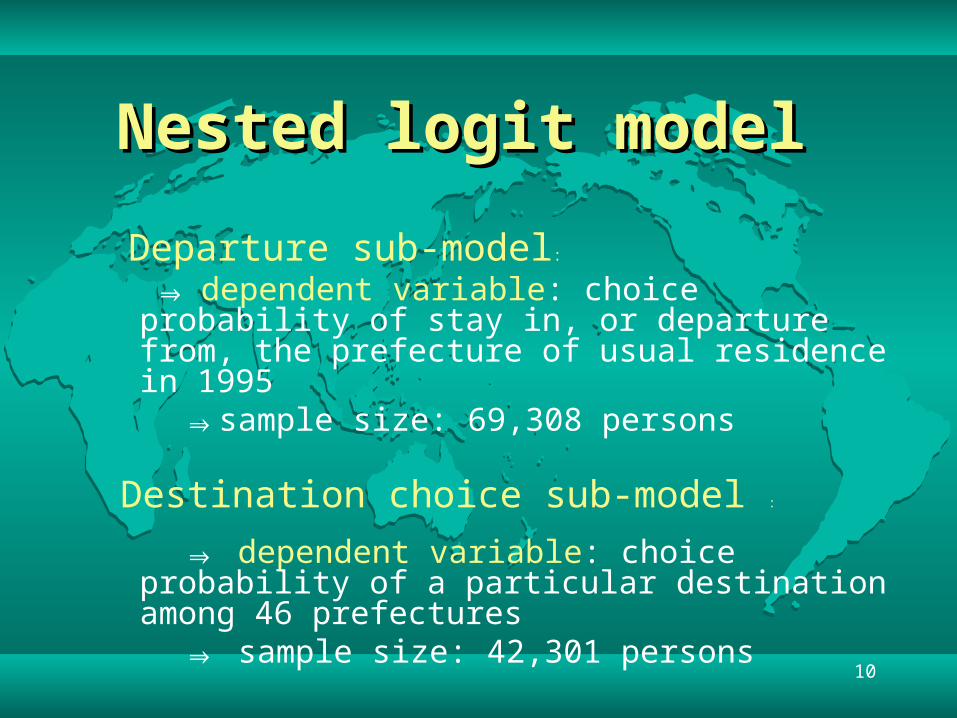
Nested logit modelNested logit model
Departure sub-model:
⇒ dependent variable: choice probability of stay in, or departure from, the prefecture of usual residence in 1995
⇒sample size: 69,308 persons
Destination choice sub-model :
⇒ dependent variable: choice probability of a particular destination among 46 prefectures
⇒ sample size: 42,301 persons
11
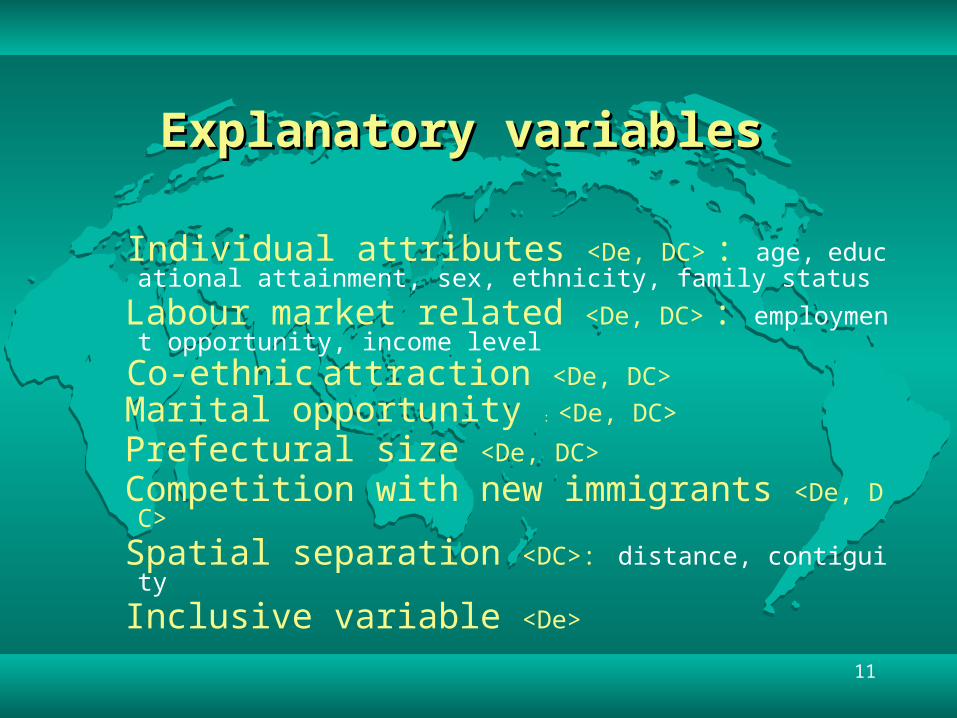
Explanatory variablesExplanatory variables
Individual attributes <De, DC> : age, educational attainment, sex, ethnicity, family status
Labour market related <De, DC> : employment opportunity, income level
Co-ethnic attraction <De, DC>
Marital opportunity : <De, DC>
Prefectural size <De, DC>
Competition with new immigrants <De, DC>
Spatial separation <DC>: distance, contiguity
Inclusive variable <De>
12
Why is international marriage in Why is international marriage in Tohoku region important?Tohoku region important?
● The stem family system is dominant in such region as Tohoku. To maintain this system, marriage is essential for household head’s son as successor.
●Due to imbalanced sex ratio, the issue of marriage squeeze for male population is serious in eastern half of Japan.
⇒Tohoku has both the first and second conditions. Unless household head’s son find Japanese new bride, he tends to look for his bride with foreign nationality.
13
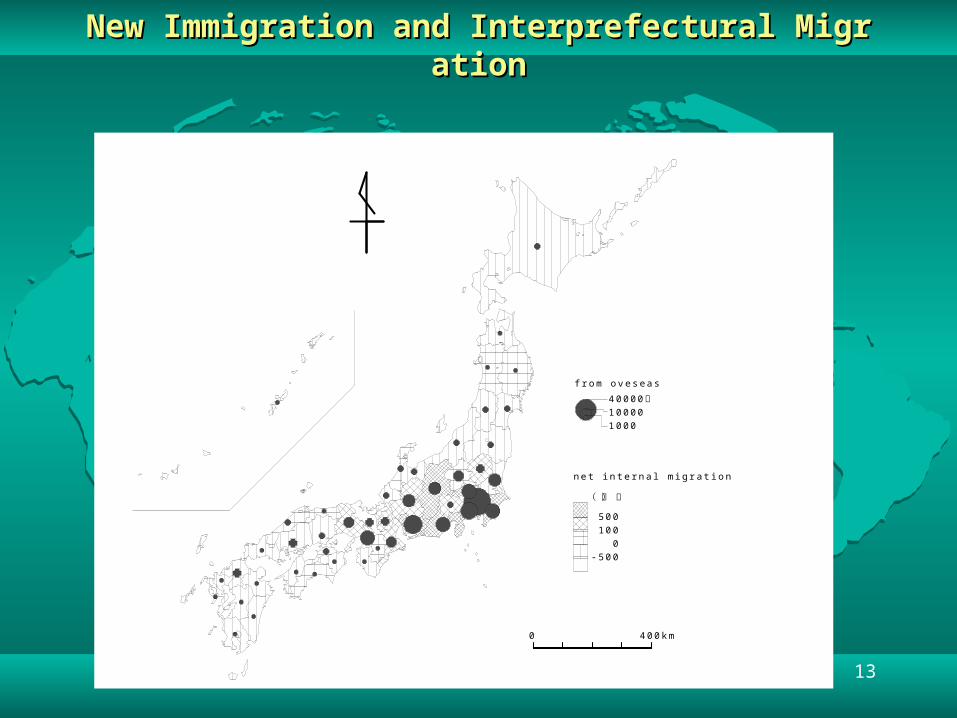
New Immigration and Interprefectural MigrationNew Immigration and Interprefectural Migration
0 400km
都 道 府 県 別 に み た 外 国 人 の 国 外 か ら の 転 入 と 転 入 超 過
( 人 )
500 100 0- 500
net i nt er nal mi gr at i on
40000人100001000
f r om oveseas
14
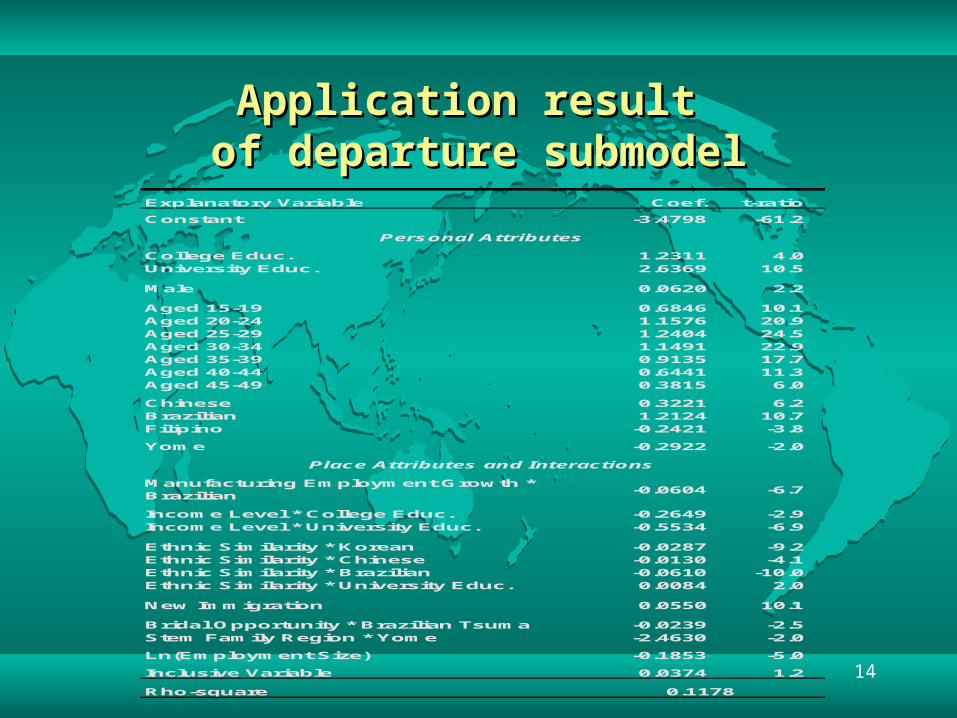
Application result Application result of departure submodelof departure submodel
Explanatory Variable Coef. t-ratio
Constant -3.4798 -61.2
Personal Attributes College Educ. 1.2311 4.0University Educ. 2.6369 10.5 Male 0.0620 2.2 Aged 15-19 0.6846 10.1Aged 20-24 1.1576 20.9Aged 25-29 1.2404 24.5Aged 30-34 1.1491 22.9Aged 35-39 0.9135 17.7Aged 40-44 0.6441 11.3Aged 45-49 0.3815 6.0 Chinese 0.3221 6.2Brazilian 1.2124 10.7Filipino -0.2421 -3.8 Yome -0.2922 -2.0
Place Attributes and Interactions Manufacturing Employment Growth *Brazilian
-0.0604 -6.7 Income Level * College Educ. -0.2649 -2.9Income Level * University Educ. -0.5534 -6.9 Ethnic Similarity * Korean -0.0287 -9.2Ethnic Similarity * Chinese -0.0130 -4.1Ethnic Similarity * Brazilian -0.0610 -10.0Ethnic Similarity * University Educ. 0.0084 2.0 New Immigration 0.0550 10.1 Bridal Opportunity * Brazilian Tsuma -0.0239 -2.5Stem Family Region * Yome -2.4630 -2.0 Ln(Employment Size) -0.1853 -5.0 Inclusive Variable 0.0374 1.2
Rho-square 0.1178
15
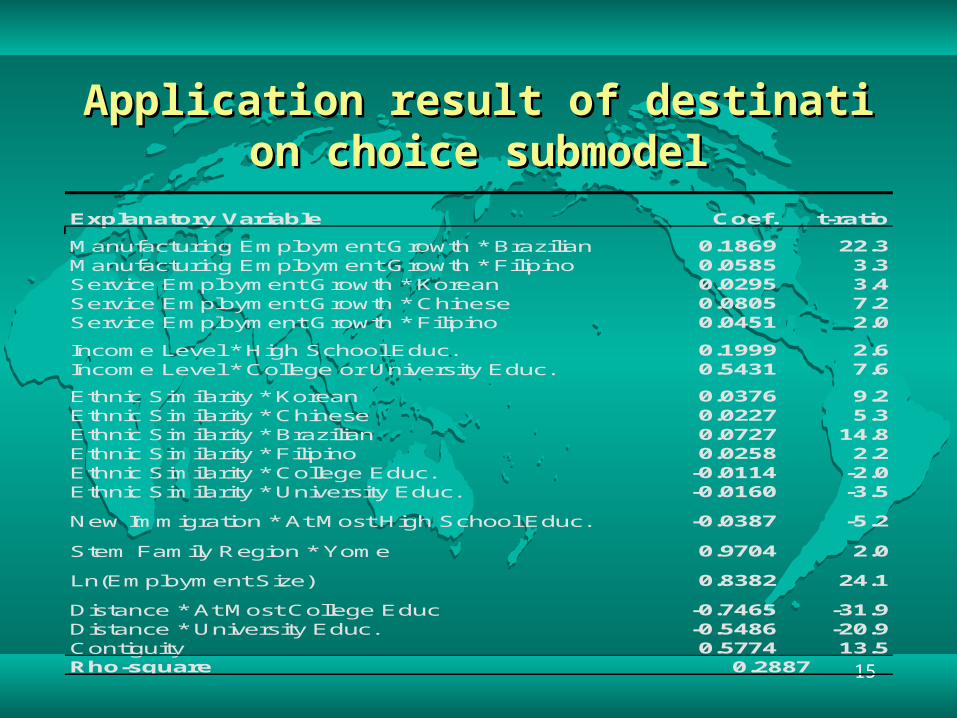
Application result of destination choice suApplication result of destination choice submodelbmodel
Explanatory Variable Coef. t-ratio Manufacturing Employment Growth * Brazilian 0.1869 22.3Manufacturing Employment Growth * Filipino 0.0585 3.3Service Employment Growth * Korean 0.0295 3.4Service Employment Growth * Chinese 0.0805 7.2Service Employment Growth * Filipino 0.0451 2.0 Income Level * High School Educ. 0.1999 2.6Income Level * College or University Educ. 0.5431 7.6 Ethnic Similarity * Korean 0.0376 9.2Ethnic Similarity * Chinese 0.0227 5.3Ethnic Similarity * Brazilian 0.0727 14.8Ethnic Similarity * Filipino 0.0258 2.2Ethnic Similarity * College Educ. -0.0114 -2.0Ethnic Similarity * University Educ. -0.0160 -3.5 New Immigration * At Most High School Educ. -0.0387 -5.2 Stem Family Region * Yome 0.9704 2.0 Ln(Employment Size) 0.8382 24.1 Distance * At Most College Educ -0.7465 -31.9Distance * University Educ. -0.5486 -20.9Contiguity 0.5774 13.5Rho-square 0.2887
16
ConclusionConclusion
Major destinations: Nagoya metropolitan area, manufacturing stronghold (not Tokyo metropolitan area)
Highly mobile persons: Brazilian, graduates from university
Application result of nested logit model <departure sub-model> ethnicity, age, educational attainment, c
ompetition with new immigrants, co-ethnic attraction <destination choice sub-model> spatial separation, prefectural si
ze, employment opportunity, co-ethnic attraction
17
Implications of the Implications of the findingsfindings
Comparison of explanatory power of international marraige between new immigration and interprefectural migration: Role of international marriage in the former is larger than that in the latter.
Comparison of migration pattern between foreigner and Japanese: Net inflow to Tokyo metropolitan area for Japanese is much larger than that for foreigner.
⇒Interprefectural migration by foreign residents has contributed to a reduction of “monopolar concentration in Tokyo”.
”⇒ hollowization” of manufacturing employment opportunity may lead to an intensification of “monopolar concentration in Tokyo”.