Embed Size (px)
Citation preview

1
Tetrad: Machine Learning and
Graphcial Causal Models
Richard Scheines
Joe Ramsey
Carnegie Mellon University
Peter Spirtes, Clark Glymour

Goals
1) Convey rudiments of graphical causal models
2) Basic working knowledge of Tetrad IV
2

Tetrad IV: Complete Causal Modeling Tool
3
Tetrad
1) Main website: http://www.phil.cmu.edu/projects/tetrad/
2) Download site: http://www.phil.cmu.edu/projects/tetrad_download/
3) Data files:
www.phil.cmu.edu/projects/tetrad_download/download/workshop/Data
/
4

Topic Outline
1) Motivation
2) Representing/Modeling Causal Systems
3) Estimation and Updating
4) Model Search
5) Linear Latent Variable Models
6) Case Study: fMRI
5

Statistical Causal Models: Goals
1) Policy, Law, and Science: How can we use data to answer
a) subjunctive questions (effects of future policy interventions), or
b) counterfactual questions (what would have happened had things
been done differently (law)?
c) scientific questions (what mechanisms run the world)
2) Rumsfeld Problem: Do we know what we do and don’t know: Can we
tell when there is or is not enough information in the data to answer
causal questions?
6

Causal Inference Requires More than Probability
In general: P(Y=y | X=x, Z=z) ≠ P(Y=y | Xset=x, Z=z)
Prediction from Observation ≠ Prediction from Intervention
P(Lung Cancer 1960 = y | Tar-stained fingers 1950 = no)
Causal Prediction vs. Statistical Prediction:
Non-experimental data(observational study)
Background Knowledge
P(Y,X,Z)
P(Y=y | X=x, Z=z)
Causal Structure
P(Y=y | Xset=x, Z=z)
≠ P(Lung Cancer 1960 = y | Tar-stained fingers 1950 set = no)
7
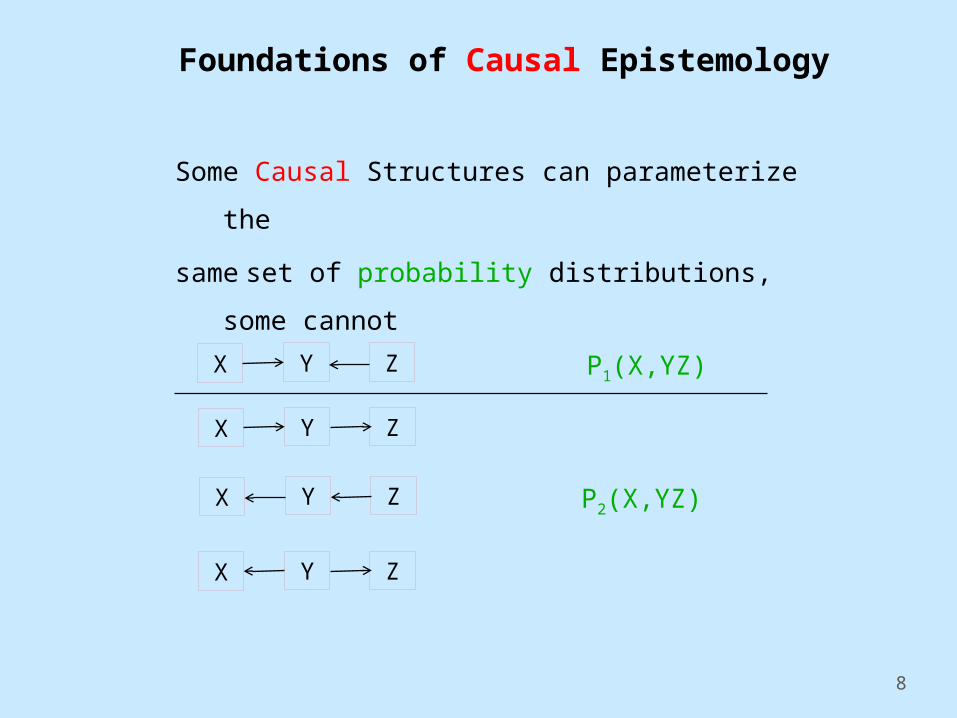
Foundations of Causal Epistemology
Some Causal Structures can parameterize the
same set of probability distributions, some cannot
8
X ZY
X ZY
X ZY
X ZY
P2(X,YZ)
P1(X,YZ)

Causal Search
9
Causal Search:
1. Find/compute all the causal models that are
indistinguishable given background knowledge and data
2. Represent features common to all such models
Multiple Regression is often the wrong tool for Causal Search:
Example: Foreign Investment & Democracy

10
Foreign Investment
Does Foreign Investment in 3rd World Countries inhibit Democracy?
Timberlake, M. and Williams, K. (1984). Dependence, political exclusion, and government repression: Some cross-national evidence. American Sociological Review 49, 141-146.
N = 72
PO degree of political exclusivity
CV lack of civil liberties
EN energy consumption per capita (economic development)
FI level of foreign investment

11
Correlations
po fi en fi -.175 en -.480 0.330 cv 0.868 -.391 -.430
Foreign Investment

12
Regression Results
po = .227*fi - .176*en + .880*cv
SE (.058) (.059) (.060)
t 3.941 -2.99 14.6
Interpretation: foreign investment increases political repression
Case Study 1: Foreign Investment

Alternatives
.217
FI
PO
CV En
Regression
.88 -.176
FI
PO
CV En
Tetrad - FCI
FI
PO
CV En
Fit: df=2, 2=0.12, p-value = .94
.31 -.23
.86 -.48
Case Study 1: Foreign Investment
There is no model with testable constraints (df > 0) in which FI has a positive effect on PO that is not rejected by the data.

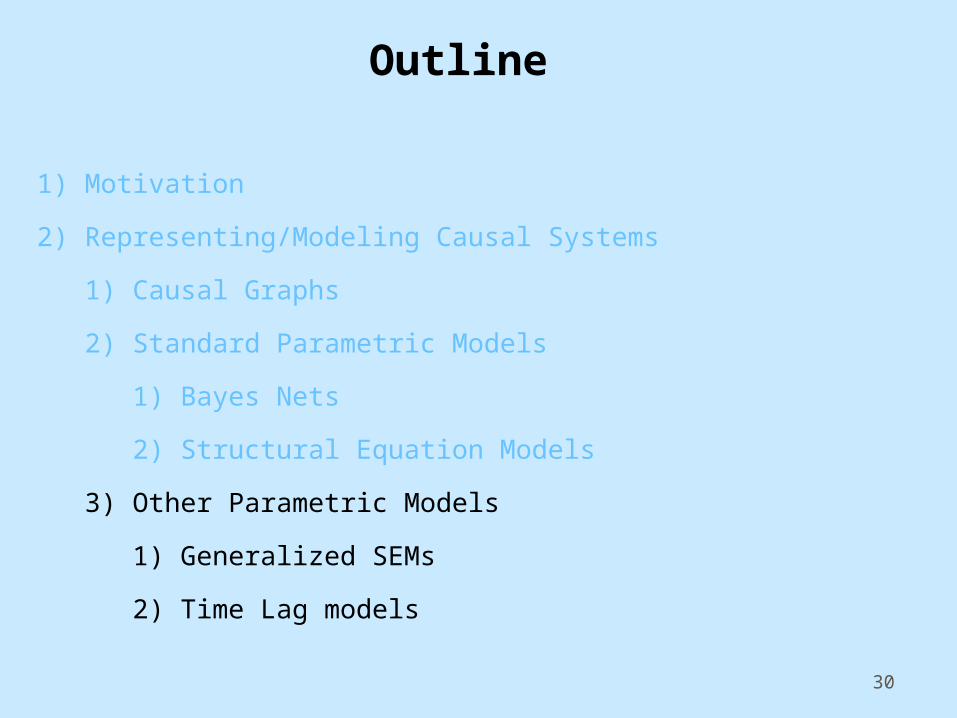
Outline
1) Motivation
2) Representing/Modeling Causal Systems
1) Causal Graphs
2) Standard Parametric Models
1) Bayes Nets
2) Structural Equation Models
3) Other Parametric Models
1) Generalized SEMs
2) Time Lag models
14

15
Causal Graph G = {V,E}
Each edge X Y represents a direct causal claim:
X is a direct cause of Y relative to V
Causal Graphs
Years of Education
Income
IncomeSkills and Knowledge
Years of Education

16
Causal Graphs
Not Cause Complete
Common Cause Complete
Education Income Happiness
Omitted Causes
Omitted
Common Causes
Education Income Happiness

17
Sweaters On
Room Temperature
Pre-experimental SystemPost
Modeling Ideal Interventions
Interventions on the Effect

18
Modeling Ideal Interventions
SweatersOn
Room Temperature
Pre-experimental SystemPost
Interventions on the Cause

19
Interventions & Causal GraphsModel an ideal intervention by adding an “intervention” variable
outside the original system as a direct cause of its target.
Education Income Taxes Pre-intervention graph
Intervene on Income
“Soft” Intervention
Education Income Taxes
I
“Hard” Intervention
Education Income Taxes
I

20
Tetrad Demo
Build and Save an acyclic causal graph:
1) with 3 measured variables, no latents
2) with at least 3 measured variables, and at least 1 latent

21
Parametric Models

22
Causal Bayes Networks
Smoking [0,1]
Lung Cancer[0,1]
Yellow Fingers[0,1]
P(S,YF, L) = P(S) P(YF | S) P(LC | S)
The Joint Distribution Factors
According to the Causal Graph,
))(_|()(
Vx
XcausesDirectXVP P

23
Causal Bayes Networks
P(S = 0) = 1
P(S = 1) = 1 - 1
P(YF = 0 | S = 0) = 2 P(LC = 0 | S = 0) = 4
P(YF = 1 | S = 0) = 1- 2 P(LC = 1 | S = 0) = 1- 4
P(YF = 0 | S = 1) = 3 P(LC = 0 | S = 1) = 5
P(YF = 1 | S = 1) = 1- 3 P(LC = 1 | S = 1) = 1- 5
Smoking [0,1]
Lung Cancer[0,1]
Yellow Fingers[0,1]
P(S) P(YF | S) P(LC | S) = f()
The Joint Distribution Factors
According to the Causal Graph,
))(_|()(
Vx
XcausesDirectXVP P
All variables binary [0,1]: = {1, 2,3,4,5, }

24
Tetrad Demo

25
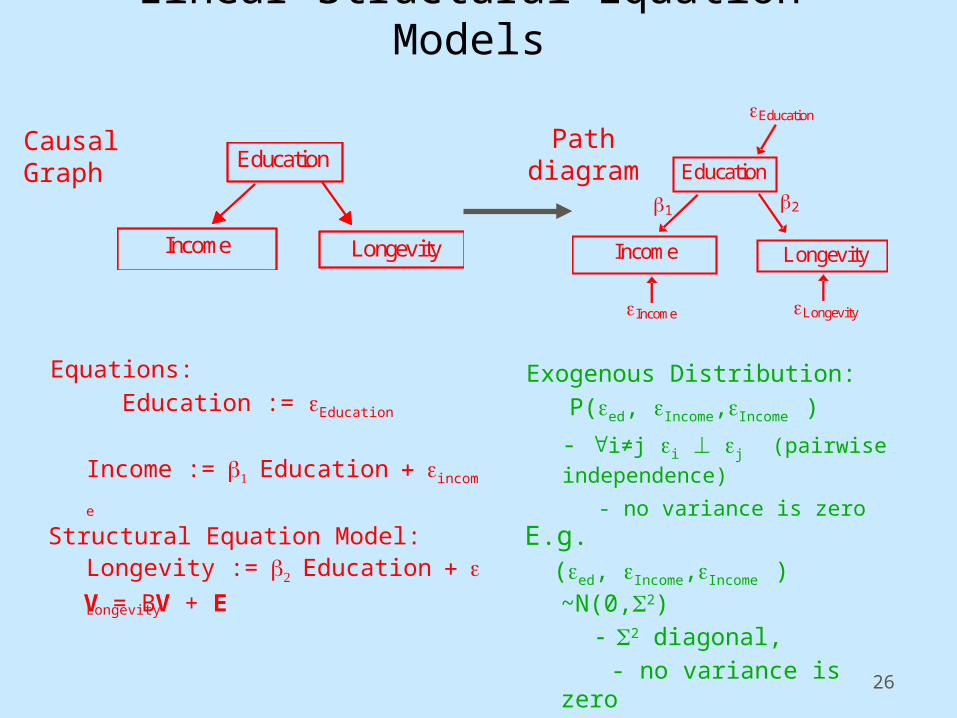
Structural Equation Models
Structural EquationsFor each variable X V, an assignment equation:
X := fX(immediate-causes(X), eX)
Education
LongevityIncome
Causal Graph
Exogenous Distribution: Joint distribution over the exogenous vars : P(e)
26
Equations: Education := Education
Income :=Educationincome
Longevity :=EducationLongevit
y
Education
LongevityIncome
Causal Graph
Education
Income Longevity
1 2
Longevity Income
Education
Path diagram
Linear Structural Equation Models
E.g. (ed, Income,Income ) ~N(0,2)
2 diagonal,
- no variance is zero
Exogenous Distribution: P(ed, Income,Income )
- i≠j ei ej (pairwise independence)
- no variance is zero
Structural Equation Model:
V = BV + E

27
Tetrad Demo
1) Interpret your causal graph with 3 measured variables with at
least 2 parametric models:
a) Bayes Parametric Model
b) SEM Parametric Model
2) Interpret your other graph with a parametric model of your
choice

28
Instantiated Models

29
Tetrad Demo
1) Instantiate at least one Bayes PM with a Bayes IM
2) Instantiate at least one SEM PM with a SEM IM
3) Instantiate at least one SEM PM with a Standardized SEM IM
4) Generate two data sets (N= 50, N=5,000) for each
Outline
1) Motivation
2) Representing/Modeling Causal Systems
1) Causal Graphs
2) Standard Parametric Models
1) Bayes Nets
2) Structural Equation Models
3) Other Parametric Models
1) Generalized SEMs
2) Time Lag models
30
Generalized SEM
1) The Generalized SEM is a generalization of the linear SEM model.
2) Allows for arbitrary connection functions
3) Allows for arbitrary distributions
4) Simulation from cyclic models supported.

Hands On
1) Create a DAG.
2) Parameterize it as a Generalized SEM.
3) Open the Generalized SEM and select Apply Templates from the
Tools menu.
4) Apply the default template to variables, which will make them all
linear functions.
5) For errors, select a non-Gaussian distribution, such as U(0, 1).
6) Save.

Time Series Simulation (Hands On)
1) Tetrad includes support for doing time series simulations.
2) First, one creates a time series graph.
3) Then one parameterizes the time series graph as a SEM.
4) Then one instantiates the SEM.
5) Then one simulates data from the SEM Instantiated Model.

Time Series Simulation
• One can, e.g., calculate a vector auto-regression for it. (One can
do this as well from time series data loaded in.)
• Attach a data manipulation box to the data.
• Select vector auto-regression.
• One can create staggered time series data
• Attach a data manipulation box.
• Select create time series data.
• Should give the time lag graph with some extra edges in the
highest lag.

35
Estimation
36
Tetrad Demo
1) Estimate one Bayes PM for which you have an IM and data
2) Estimate one SEM PM for which you have an IM and data
3) Import data from charity.txt, and build and estimate model two
models to estimate on those data

Hypothesis 1
37
Hypothesis 2

38
Updating

39
Tetrad Demo
1) Pick one of your Bayes IMs
2) Find a variable X to update conditional on Y such that:
The marginal on X changes when Y is passively observed = y, but
does not change when Y is manipulated = y
3) Find a variable Z to update conditional on W such that:
The marginal on Z changes when W is passively observed = w, and
changes in exactly the same way when W is manipulated = w


![[Clark Glymour] the Mind's Arrows Bayes Nets and (BookZZ.org)](https://img.pdfslide.us/doc/110x75/55cf8f37550346703b9a0df2/clark-glymour-the-minds-arrows-bayes-nets-and-bookzzorg.jpg)