Embed Size (px)
Citation preview

1 of 16
x
COVERAGE INITIATION 24 August 2018
Favelle Favco Bhd
Price : RM2.68
Market Cap : RM593.4 mln
Listing : Main Market
Sector : Industrial Products
Bursa / Bloomberg Code: FAVCO / FFB MK Stock is Shariah-compliant.
Recommendation : Hold
Source: Bursa Marketplace
Key Financials
(FYE Dec) FY16A FY17A FY18F
Revenue (RM m) 582.3 526.5 429.6
EBITDA (RM m) 97.6 98.8 91.1
Net Profit (RM m) 74.6 63.1 51.8
Net Profit Growth (%) -21.2 -15.5 -17.9
FD EPS (sen) 33.7 28.5 23.4
Div/share (sen) 15.0 13.5 10.0
Payout ratio 44.5% 47.4% 42.7%
BV/share (RM) 2.67 2.84 3.09
Cash flow/share (sen) 78.3 53.2 54.2
Key Valuation Metrics
P/E (x) 7.9 9.3 11.3
P/BV (x) 1.0 0.9 0.9
P/cash flow (x) 3.4 5.0 4.9
Dividend yield 5.7% 5.1% 3.8%
ROE 12.6% 10.0% 7.6%
Net gearing (x) Net Cash Net Cash Net Cash
Shares outstanding (m) 221.4
52-week Hi-Low (RM) 2.94-2.2.36
Major Shareholders
Muhibah Engineering (M) Bhd 59.3%
Mac Ngan Boon 4.1%
Kumpulan Wang Persaraan 3.2%
1. Summary
• Niche integrated international crane specialist, with history tracing back to over 90 years including over 50 years in the crane industry. Favco manufactures four major types of cranes – tower crane, offshore crane, crawler crane and wharf crane.
• Established worldwide presence, comprising of five manufacturing facilities in Malaysia, Denmark, U.S., Australia and China coupled with eleven sales agents/offices worldwide.
• Involved in mega scale infrastructure projects undertaking some of the tallest skyscrapers in the world, having been involved in the construction of Burj Khalifa on the global scale as well as the Petronas Twin Towers on the local front.
• Growth catalysts include revival in the oil & gas work flows, rising skyscrapers and diversification into industrial automation. The underlying crane industry’s market share is projected to grow at 6 year-CAGR of 5.2% until 2023.
• Financials. Remain profitable since listing on Bursa Malaysia in 2006, but delivered 5-year revenue and net profit CAGR of -8.9% and -1.5% respectively in FY17, dragged down by the slowdown in orderbook replenishment. Healthy balance sheet with net cash position per share of RM1.44 as of end-March 2018.
• Risks include fluctuations in commodity prices (crude oil) and foreign currency exchange, as well as shortage of skilled labour.
• Initiate coverage with a Hold recommendation and a fair value of RM2.83, derived from pegging the projected FY19 earnings against a target PER multiple of 11.0x. Prospective dividend yield is attractive at 3.8%.
ZJ Research Investment Report for Mid & Small Cap Research Scheme
12-month share price chart
- 2.36

Favelle Favco Bhd
2 of 16
ZJ Research
2. Background
Corporate profile. Manufacture, supply and rental of cranes. Favelle Favco Berhad (“Favco”) is an investment holding company while its subsidiaries are principally involved in the designing, manufacturing, supplying, servicing, trading and renting of cranes. Favco was listed on the then Second Board of Bursa Malaysia back in August 2006. A year later in August 2007, the Group has successfully transferred its listing to the Main Board (now known as the Main Market) of Bursa Malaysia after delivering commendable financial performance whilst complying Bursa Malaysia’s listing guidelines. From the Land Down Under to Malaysia. The history of Favco traced back to 1923 in Australia when Edward Arthur Favelle and Harry Cole founded Favelle and Cole as an automotive repair and oxy car structure welder. Subsequently in 1955, the third generation of Edward Arthur Favelle – Ted Favelle took over Morts Dock and Engineering and renamed it as Favelle Mort. Favelle Mort then commenced operations to manufacture cranes in 1962 and made a breakthrough in 1968 by penetrating into the U.S. market, having delivered eight units of cranes for the construction of World Trade Centre, New York. In 1975, Favelle Mort was acquired by the Aquila group and was subsequently renamed as “Aquila Favco Cranes”. In 1980, Ted Favelle left the company to start his own company, EH Favelle Cranes. Both EH Favelle Cranes and Favco later merged in 1990 into Favelle Favco. The Group marked its presence in Malaysia after Muhibbah Engineering (M) Bhd (“Muhibah”) bought over Favco in 1995 as well as Krøll Cranes A/S in 1997. Favco commissioned its largest work order, the Petronas Twin Towers in 1998 and in the same year, introduced the Crawler crane range. Backed by largest shareholder and institutional investors. Muhibbah is the single largest shareholder in Favco with 59.3% equity stake. This allows Favco to leverage onto Muhibbah’s construction projects. In the meantime, the Group also counts several institutional funds such as Kumpulan Wang Persaraan, Valuecap Sdn Bhd and Employees Provident Fund Board as shareholders. The inclusions of those funds are a testament of the Group’s position as one of the top market players in the crane industry. Established geographical presence. To-date, Favco owns five manufacturing plants with a combined built-up area of over 450,000 sq. ft. and eleven sales agents/offices across the U.S., Europe and Asia, with an aggregate workforce of 700-800 people. This allows the Group to establish its network across different regions in the world. Board of Directors. Out of the 8-person Board of Directors, 4 are Independent Directors, fulfilling Bursa Malaysia’s listing requirement of having 1/3 or minimum of 2 Independent Directors. The Board is led by Tan Sri A. Razak bin Ramli who is the Chairman and Senior Independent Non-Executive Director.

Favelle Favco Bhd
3 of 16
ZJ Research
Exhibit 1. Corporate structure.
Source: Company, ZJ Research.
3. Business
Manufacturing Plants. Favco currently owns five plants located in i) Seremban, Malaysia, ii) Lynge, Denmark, iii) Texas, USA, iv) Sydney, Australia and v) Shanghai, China with a combined built-up area of over 450,000 sq. ft. The Group manufactures its cranes under the brand names of Favelle Favco and Krøll. To-date, Favco is able to manufacture cranes with lifting capability of 20,000 tonnes, under the K-20,000 series.

Favelle Favco Bhd
4 of 16
ZJ Research
Exhibit 2. Favelle Favco’s Worldwide Geographical Presence
Source: Company, ZJ Research
Products. Cranes are designed to carry or lift heavy objects from one place to another. Favco manufactures four types of cranes, namely: tower cranes, offshore cranes, crawler cranes and wharf cranes. Each type of cranes is designed to accommodate different industries. Tower Cranes. Tower cranes are one of the most commonly used cranes in the construction of medium to tall buildings. Tower cranes are fixed onto the ground on a concrete slab. Major components of a tower crane consist of the mast which is the main support of the crane. A slewing unit is also attached on top of the mast that allows the crane to rotate. At the top of the slewing unit, there are three major components (i) long horizontal jib that carries the load, (ii) short counter jib that provides support to counter weights lifted by the long horizontal jib and (iii) operating cabin that allows operational controls of the tower crane. The Group’s K-series Krøll crane has the capability to lift up to 20,000 tonnes whilst the M-series Favelle Favco crane could lift up to 2,000 tonnes. Some construction works that require the usage of tower cranes include construction of dams, bridges, shipyards, power plants and high rise structures. Exhibit 3. Tower Crane
Source: Favco, Krøll

Favelle Favco Bhd
5 of 16
ZJ Research
Offshore cranes. Offshore cranes are commonly used in the oil and gas sector to transfer materials and personnel. Offshore cranes rotate on pedestals that possess abnormal strength requirements to ensure the crane does not overturn or easily separate from the pedestal. Favco is one of the leading offshore crane manufacturers that command lifting capacities of between 5 and 2,000 tonnes and have been delivering approximately 80-100 offshore cranes per annum. The Group has the capability to manufacture both diesel-hydraulic and electro-hydraulic systems that are used on offshore platforms, jack-up barges, vessels and large submersibles. Exhibit 4. Offshore Crane
Source: Favco
Crawler Cranes. Crawler cranes are mounted on an undercarriage that is fitted with a set of crawler tracks that provide both stability and mobility. A key advantage of a crawler crane is mobility as the crane is able to operate on sites that require minimal time and activities during pre-setup. However, considering the weight and size of a crawler crane, it is inconvenient and expensive to transport the crawler crane from one site to another. Favco crawler crane sizes range from 30 ton to 60 tons with a telescopic boom and 60 ton with a lattice boom. This range of crane was jointly developed with Caterpillar Industrial Products Inc. that combined Favco lifting technology and Caterpillar technology. The Group’s crawler cranes are used for general construction worksites and pipe laying work. Exhibit 5. Crawler Crane
Source: Favco

Favelle Favco Bhd
6 of 16
ZJ Research
Wharf Cranes. Wharf cranes are mainly used in port terminals for shipyards, bulk handling and general purpose. Favco offers both luffing (revolves around the movement of the hook inwards and outwards to move objects closer to the base) and hammerhead (generally constructed in large sizes to move heavy objects) cranes with diesel hydraulic and fully electric setups. The Group’s wharf cranes under Favelle Favco and Krøll brands have the capability of lifting moments up to 20,000 lbs. Exhibit 6. Wharf Crane
Source: Dreamstimes
Clientele The Group is positioned as a niche integrated international crane specialist. Having numerous years of experience in the crane industry, Favco’s clientele include multinational companies such as Royal Dutch Shell, BP, ExxonMobil, Hyundai, Samsung, Keppel, Petronas, Marr Contracting and COSCO Shipyard. As of end-May 2018, Favco’s top 10 customers account for 54.0% of the Group’s outstanding orderbook of RM398.0 mln. Projects Notable projects undertaken by Favco include some of the tallest skyscrapers in the world such as Burj Khalifa in Dubai, Taipei 101 and the Shanghai World Financial Centre. The Group's cranes were also used in 1967 to construct the World Trade Center in New York that was, unfortunately, destroyed in the 9/11 incident.

Favelle Favco Bhd
7 of 16
ZJ Research
Exhibit 7. Favco’s Contribution to Notable Buildings In The World
Source: Company
Exhibit 8. 1-4: Burj Khalifa, One World Trade Center, Taipei 101, Shanghai World Financial Center
Source: Various
On the local front, Favco was involved in the construction of Petronas Twin Towers – the tallest building in the world from 1998 to 2004. In the meantime, the Group has also bagged a contract to supply tower cranes to Samsung C&T Corporation UEM Construction JV Sdn Bhd for the construction of PNB 118 back in January 2016. Already, piling works have been completed in September 2016 while construction of the tower has begun in January 2018. Exhibit 9. 1-2: Petronas Twin Towers, PNB 118’s Illustration
Source: Various
Buildings Country Meters Completion
Burj Khalifa United Arab Emirates 828 2009
Wuhan Greenland Centre China 636 2018E
PNB 118 Tower Malaysia 635 2020E
Shanghai Tower China 632 2015
Ping An International Finance Centre China 600 2017
Lotte World Tower South Korea 555 2016
One World Trade Centre United States 541 2014
CTF Finance Centre China 530 2016
Taipei 101 Taiwan 509 2004
Shanghai World Financial Center China 492 2007
International Commerce Centre Hong Kong 484 2010
Petronas Twin Tower 1 & 2 Malaysia 452 x 2 1998

Favelle Favco Bhd
8 of 16
ZJ Research
Diversifying Income Stream With the prevailing uncertainties in the oil & gas industry, Favco embarks beyond its bread and butter business into industrial automation and specialised oil & gas equipment segment via the proposed acquisition of four engineering companies, namely Exact Automation Sdn Bhd, Sedia Teguh Sdn Bhd, Exact Analytical Sdn Bhd and Exact Oil & Gas Sdn Bhd. The proposed acquisition of approximately RM90.7 mln will be funded entirely in cash. The combined four entities had delivered net profits of RM22.7 mln, RM14.9 mln and RM16.2 mln in FY14, FY15 and FY16 respectively.
4. Financial highlights Maintained profitability since its listing in 2006. The Group is profitable and has consistently delivered net profit since its listing on Bursa Malaysia back in 2006. After peaking in FY14, the Group’s revenue, however, has been on a downward trend, recording a four-year Compounded Annual Growth Rate (“CAGR”) of -8.9% between FY13 and FY17. Meanwhile, net profit also contracted from a peak of RM94.7 mln recorded in FY15 to RM63.1 mln in FY17, registering a CAGR of -1.6% during the same period. The subdued performance was largely dragged down by the slowdown in orderbook replenishment and execution in crane orders from the oil & gas industry amid the slump in crude oil prices since mid-2014. Exhibit 10. Historical financial performance
Source: Company, ZJ Research.
Declining revenue since FY14. With the slump in crude oil prices arising from the shale oil revolution, Favco’s revenue peaked at RM797.9 mln in FY15, and has since been declining over the past 3 consecutive years. In FY17, the Group’s net profit fell 9.6% year-on-year (“YoY”). The decline in revenue was attributed by the slowdown in orderbook replenishment in its crane orders, particularly for offshore cranes. Slowdown in profit in FY17 from record year in FY15. Favco registered a record high net profit of RM94.7 mln in FY15 from the execution of high outstanding orderbook that was secured in FY13 and FY14. In FY16, the Group’s net profit slipped 21.1% YoY in tandem with the decline in orderbook replenishment. With the prolonged slump in crude oil prices, the Group’s profitability continued to deteriorate in FY17, falling 15.5% YoY to RM63.1 mln, mainly due to higher depreciation

Favelle Favco Bhd
9 of 16
ZJ Research
charges coupled with lower interest income. Net profit margin upward trending. Despite the decline in both revenue and net profit, Favco’s net profit margin has been on an uptrend, rising from 8.8% in FY13 to 12.8% in FY16. Although FY17 net profit margin declined to 12.0%, it remains on the upper end of the 5-year range between FY13 and FY17. Exhibit 11. Profit margins trend
Source: Company, ZJ Research.
Major cost component: Steel accounts for the largest crane raw materials cost, making up approximately 60-65% of a crane’s manufacturing cost. Nevertheless, the Group traditionally is able to adopt cost-pass-through mechanism, locking in certain prices ahead of the cranes delivery. Overseas contribution to dominate. The Group’s revenue contribution from overseas operations as a percentage of total turnover has been steadily increasing over the years, rising to a high of 76.6% in FY17 (from a low of 46.5% recorded in FY14). We reckon that the abovementioned trend to remain unchanged over the foreseeable future in view that the Group’s latest contract wins are predominantly from overseas (80% of RM398.0 mln outstanding orderbook are derived from overseas). Exhibit 12. Revenue contribution by geographical segment
Source: Company, ZJ Research.

Favelle Favco Bhd
10 of 16
ZJ Research
Net cash/share of RM1.44. Favco has been maintaining a lean balance sheet with net cash position since 2010. It is sitting on a net cash per share position of RM1.44 as of end-March 2018 with net assets per share of RM2.81. The Group also generated a positive net operating cash flow (“NOCF”) of RM84.6 mln in FY17, against NOCF of RM147.1 mln in FY16. The lower NOCF in FY17 was largely due to replenishment of inventories in contrast to the decrease in inventories in FY16 and higher allowance for impairment losses on trade receivables. Consistent dividend pay-out. Although Favco does not adopt a formal dividend policy, the Group has been consistently rewarding shareholders with dividends since its listing on Bursa Malaysia in 2006. Over the past five years, Favco has declared dividends with an average dividend pay-out ratio of 37.7%. For FY17, Favco declared a total dividend of 13.5 sen per share, translating to a decent dividend yield of 5.4%. We expect the Group to maintain regular dividend payments, backed by is relatively massive war chest of RM350.4 mln. Exhibit 13. Dividend per share & pay-out track record
Source: Company, ZJ Research.
5. Industry landscape Crane market to surpass US$44.7 bln by 2023. According to an independent market researcher – Markets And Markets, the rising construction spending of new development plans and projects are expected to propel the crane market to grow to US$44.7 bln by 2023, from US$32.9 bln registered in 2017. In the meantime, the increasing demand for handling objects in the shipping industry and for material handling equipment in the aerospace & defense industry will also serve as a platform for growth for players in the crane market. Recovery of crude oil prices after three-year slump. Crude oil prices appear to have found its footing after three consecutive years of decline following the oversupply disorder arising from the United States’ shale oil revolution. For 1H18, the average Brent oil prices hovered at US$71.03 per barrel vs. U$54.75 per barrel recorded in 2017 is largely on track for a strong performance in 2018. The recovery in crude oil prices will eventually translate into increase in capex for oil & gas players and thus improve the demand for offshore cranes.

Favelle Favco Bhd
11 of 16
ZJ Research
Despite the recovery in crude oil prices, industry data shows the oversupply condition remains, suggesting limited further upside to oil prices at least in the near future. According to the U.S. Energy Information Administration, U.S. crude oil production will average 10.7 mln barrels per day in 2018, up from 9.4 mln barrels per day in 2017. In the meantime, global production to come at an average of 100.4 mln barrels per day vs. global consumption of 100.3 mln barrels per day – implying the oversupply condition is likely to persist. Exhibit 14. World liquid fuels production and consumption
Source: Energy Information Administration
Global construction activities accelerating. The global construction industry is regaining its momentum post global financial crisis. Construction Intelligence Center (“CIC”) expects the global construction industry to expand at an annual growth rate of 3.4%, reaching US$10.0 trillion in 2020. This will be supported by i) global infrastructure renewals/refurbishments, ii) urbanisation and development of megacities, iii) large scale infrastructure transportation projects in the Middle East and Africa, iv) improved economic activity in U.S. and v) new building projects in South East Asia. Among the upcoming skyscrapers that would require the usage of tower cranes are as follows: Exhibit 15. Future World Tallest Skyscrapers Under Construction
Source: Skyscraper Center
Buildings Country MetersEstimated
Completion
Jeddah Tower Saudi Arabia 1,008 2021
Grand Rama 9 Tower Thailand 615 2021
Global Financial Center Tower 1 China 568 2020
Skyfame Center Landmark Tower China 528 2021
Evergrande International Financial Center T1 China 518 2021
Central Park Tower United States 472 2020
Chengdu Greenland Tower China 468 2020
Riverview Plaza A1 China 436 2019
111 West 57th Street United States 435 2020
Diamond Tower Saudi Arabia 432 2020
Favelle Favco Bhd
12 of 16
ZJ Research
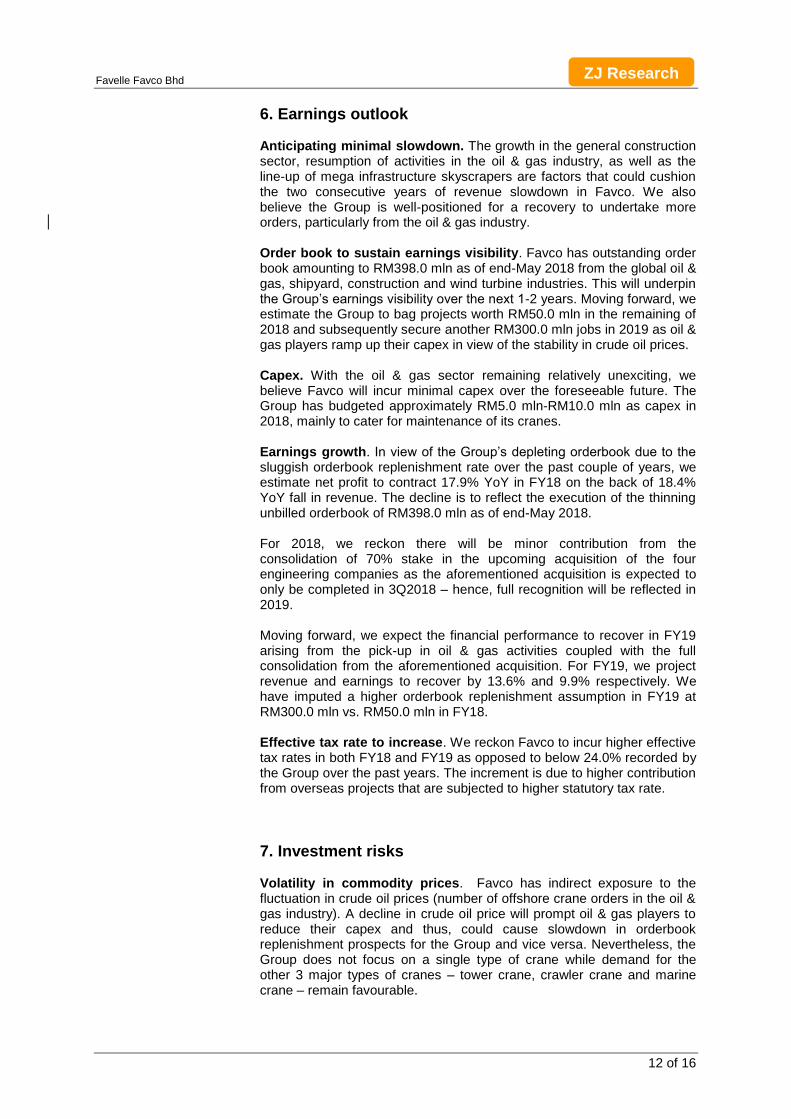
6. Earnings outlook Anticipating minimal slowdown. The growth in the general construction sector, resumption of activities in the oil & gas industry, as well as the line-up of mega infrastructure skyscrapers are factors that could cushion the two consecutive years of revenue slowdown in Favco. We also believe the Group is well-positioned for a recovery to undertake more orders, particularly from the oil & gas industry. Order book to sustain earnings visibility. Favco has outstanding order book amounting to RM398.0 mln as of end-May 2018 from the global oil & gas, shipyard, construction and wind turbine industries. This will underpin the Group’s earnings visibility over the next 1-2 years. Moving forward, we estimate the Group to bag projects worth RM50.0 mln in the remaining of 2018 and subsequently secure another RM300.0 mln jobs in 2019 as oil & gas players ramp up their capex in view of the stability in crude oil prices. Capex. With the oil & gas sector remaining relatively unexciting, we believe Favco will incur minimal capex over the foreseeable future. The Group has budgeted approximately RM5.0 mln-RM10.0 mln as capex in 2018, mainly to cater for maintenance of its cranes. Earnings growth. In view of the Group’s depleting orderbook due to the sluggish orderbook replenishment rate over the past couple of years, we estimate net profit to contract 17.9% YoY in FY18 on the back of 18.4% YoY fall in revenue. The decline is to reflect the execution of the thinning unbilled orderbook of RM398.0 mln as of end-May 2018. For 2018, we reckon there will be minor contribution from the consolidation of 70% stake in the upcoming acquisition of the four engineering companies as the aforementioned acquisition is expected to only be completed in 3Q2018 – hence, full recognition will be reflected in 2019. Moving forward, we expect the financial performance to recover in FY19 arising from the pick-up in oil & gas activities coupled with the full consolidation from the aforementioned acquisition. For FY19, we project revenue and earnings to recover by 13.6% and 9.9% respectively. We have imputed a higher orderbook replenishment assumption in FY19 at RM300.0 mln vs. RM50.0 mln in FY18. Effective tax rate to increase. We reckon Favco to incur higher effective tax rates in both FY18 and FY19 as opposed to below 24.0% recorded by the Group over the past years. The increment is due to higher contribution from overseas projects that are subjected to higher statutory tax rate.
7. Investment risks Volatility in commodity prices. Favco has indirect exposure to the fluctuation in crude oil prices (number of offshore crane orders in the oil & gas industry). A decline in crude oil price will prompt oil & gas players to reduce their capex and thus, could cause slowdown in orderbook replenishment prospects for the Group and vice versa. Nevertheless, the Group does not focus on a single type of crane while demand for the other 3 major types of cranes – tower crane, crawler crane and marine crane – remain favourable.

Favelle Favco Bhd
13 of 16
ZJ Research
Fluctuations in foreign currency. The bulk of Favco’s revenue are derived from overseas, mainly denominated in Euro and USD, and hence, is exposed to fluctuations in foreign currency that would affect the Group’s profitability. Nevertheless, the Group’s raw materials (i.e. electrical systems, mechanical parts and spare parts) are also imported from overseas, and therefore provide a natural hedge in its crane manufacturing business. Dependent on skilled labour. Favco’s operations are commanded by staff strength of 700-800 workers across the globe. The lack of skilled and experienced manpower to undertake large number of job orders may pose a threat that could delay crane delivery timeline. Construction mishaps. Any construction mishaps arising from Favco’s crane operation would not only incur penalties but also damage the Group’s reputation as a niche integrated international crane specialist. To-date, the Group has not experienced any major damages from its projects, while its cranes go for scheduled periodical maintenance.
8. Peer Comparison and Valuation
Peers. Apart from Favco, the only public listed crane manufacturer in Malaysia is Handal Resources Bhd (Handal). However, we note that Handal is not a suitable comparison as the latter’s market capitalisation is much smaller and has been loss-making in the past two quarters. Due to limited number of local peers, we have imputed in the companies that provide support services to the oil & gas companies. From the table below, the average trading PER of the peers are at 11.3x. Exhibit 16: Selected companies in oil & gas-related sector
TTM = trailing twelve months ^based on latest quarterly results Source: Company data, ZJ Research
Favco vs. Handal. While Favco manufactures 4 major types of cranes, Handal focuses on manufacturing or fabrication of offshore pedestal cranes and provision of support services to the oil & gas industry. Additionally, majority of Favco’s projects are overseas with a small portion of local jobs while Handal’s operations are predominantly based in the local market. Hence, there will be minor competition between both parties in relation to the offshore crane jobs in Malaysia. Valuation-wise, as mentioned earlier, we are unable to compare them due to Handal’s loss-making position.
Favelle Favco Dec 2.66 10.5 0.9 586.7 Net Cash 3.8%
Handal Dec 0.395 N.A. 0.7 63.2 0.03 N.A.
Coastal Contracts Jun 1.12 13.1 0.4 595.4 0.05 0.9%
Pantech Feb 0.495 8.7 0.7 369.9 0.19 5.1%
Deleum Dec 0.94 10.9 1.2 377.1 Net Cash 4.8%
Hibiscus Petroleum Dec 0.98 12.5 1.8 1556.2 Net Cash N.A.
Avg excl. Favelle Favco 11.3
Net
Gearing
(x)^
TTM
Div.
Yield
TTM
PER
(x)
P/BV
(x)^
Mkt Cap
(RM mln)Company FYE
Share Price
(RM)

Favelle Favco Bhd
14 of 16
ZJ Research
Regional peers. There are 2 European large-scale public listed companies which are involved in the production of cranes – Koncranes OYJ listed in Helsinki Stock Exchange since 1996 and Plafinger AG listed in Vienna Stock Exchange since 1999. As both companies are based in the Eurozone, the market fundamentals and dynamics as well as investors’ sentiments are vastly different from that of Bursa Malaysia. Therefore, we reckon that they are also not a suitable benchmark for Favco in terms of valuation. Valuation. We have ascribed a peer-benchmarked target PER of 11x against our FY19 net profit forecast of RM56.9 mln, translating into a fair value of RM2.83. Our target PER multiple is broadly in line with the average local peers of 11x. We note that although Favco does not adopt any dividend policy, the Group has been distributing an average of 37.4% of their net profit over the past 5 years as dividends to shareholders. Based on our estimate, the prospective net yield in FY18 and FY19 is relatively attractive at about 3.8% and 4.2% respectively.
8. Recommendation We initiate our coverage on Favco with a Hold recommendation and a fair value of RM2.83, reflecting potential share price upside of 5.6%, backed by an expected healthy net dividend yield of 3.8%. We like Favco for its i) resilient operations, having withstood the oil & gas downcycle, ii) potential to benefit from the revival in oil & gas job flows on the back of recovery in crude oil prices, iii) improving prospects in the global construction workflow, with works focusing on skyscrapers due to land scarcity, iv) new income stream from diversification into industrial automation and v) healthy balance sheet that is in a net cash position over the years. Nevertheless, near-term excitement may be muted as it would take time for the improving macro environment to translate into sufficient job flows that would bring earnings back to pre-FY17 level. The consistent dividend payment over the years, however, would provide support for the share price.

Favelle Favco Bhd
15 of 16
ZJ Research
Analyst: Nicole Tan [email protected] 03-2032 2328
P&L Summary
Balance Sheet Summary
FYE Dec (RM m) FY15A FY16A FY17A FY18F FY19F
Revenue 792.4 582.3 526.5 429.6 487.9
Revenue growth -0.7% -26.5% -9.6% -18.4% 13.6%
EBITDA 128.3 97.6 98.8 91.1 103.4
EBITDA margin 16.2% 16.8% 18.8% 21.2% 21.2%
Depreciation (17.2) (19.1) (20.5) (22.6) (25.2)
EBIT 111.1 78.5 78.2 68.5 78.2
Net interest exp. 7.2 1.3 5.1 3.6 3.2
Pretax income 118.3 79.8 83.3 72.1 81.4
Tax exp. (24.4) (7.7) (19.3) (19.1) (19.5)
Eff. tax rate 20.6% 9.7% 23.2% 26.5% 24.0%
Minority interests (0.8) (2.6) 0.9 1.2 4.9
Net Profit 94.7 74.6 63.1 51.8 56.9
Net profit growth 8.1% -21.2% -15.5% -17.9% 9.9%
Net profit margin 12.0% 12.8% 12.0% 12.1% 11.7%
FYE Dec (RM m) FY15A FY16A FY17A FY18F FY19F
Cash/near cash 334.0 366.8 372.1 320.0 373.5
A/c receivables 287.4 241.1 200.0 206.0 213.9
Inventories 185.0 141.1 156.5 168.3 155.8
Other current assets 176.9 147.7 190.7 214.8 207.3
Total current assets 983.3 896.8 919.3 909.1 950.5
Net fixed assets 194.4 215.2 241.8 235.6 247.0
Other long-term assets 42.0 48.5 46.3 49.4 53.5
Total long-term assets 236.4 263.8 288.1 285.0 300.5
Total assets 1219.7 1160.5 1207.4 1194.1 1250.9
Liabilities & Shareholders' Equity
A/c payables 231.1 228.1 232.9 185.9 198.5
Short-term borrowings 64.0 14.4 15.1 19.1 19.6
Other short-term liab. 368.8 305.5 301.2 273.0 246.5
Total current liab. 663.9 548.1 549.3 478.0 464.6
Long-term borrowings 0.0 11.6 18.8 21.3 23.8
Other long-term liab. 8.2 9.1 11.2 11.7 10.6
Total non-current liab. 8.2 20.7 30.0 33.0 34.3
Total liabilities 672.1 568.8 579.2 511.1 499.0
Share capital 109.6 110.7 110.7 110.7 110.7
Retained earnings 366.3 407.9 437.7 501.3 576.8
Other reserves 71.3 75.4 81.1 73.1 74.5
Minority interests 0.5 (2.2) (1.3) (2.0) (10.0)
Total equity 547.6 591.8 628.2 683.1 752.0
Total liabilities & equity 1219.7 1160.5 1207.4 1194.1 1250.9

Favelle Favco Bhd
16 of 16
ZJ Research
RATING GUIDE
BUY Price appreciation expected to exceed 15% within the next 12 months
SELL Price depreciation expected to exceed 15% within the next 12 months
HOLD Price movement expected to be between -15% and +15% over the next 12 months from current level
DISCLAIMER
This report has been prepared by ZJ Advisory Sdn Bhd pursuant to the Mid and Small Cap Research Scheme (“MidS”) administered by Bursa Malaysia Berhad. This report has been produced independent of any influence from Bursa Malaysia Berhad or the subject company. Bursa Malaysia Berhad and its group of companies disclaims any and all liability, howsoever arising, out of or in relation to the administration of MidS and/or this report.
This report is for information purposes only and has been prepared by ZJ Advisory based on sources believed to be reliable at the time of issue of this report. We however do not give any guarantee as to the accuracy or completeness of the information provided. Any opinions or estimates in this report are that of ZJ Advisory as of this date and are subject to change without notice. ZJ Advisory has no obligation to update its opinion or the information in this report beyond the scope of participation under MidS.
This report is under no circumstances to be construed as an offer to sell or a solicitation of an offer to buy any securities. Investors should seek financial regarding the appropriateness of investing in any securities discussed or opined in this report. Investors should understand that statements regarding future prospects may not materialize. This report may contain forward looking statement and forecasts, which are based on assumptions that are subject to uncertainties. Any deviation from the expectations may have adverse effect on the projections and prospects contained herein. ZJ Advisory accepts no liability for any direct, indirect or consequential loss arising from the use of this report.
ZJ Advisory and/or its directors and staff may have an interest in the securities mentioned herein. Furthermore, ZJ Advisory and its related companies may, from time to time, provide or seek to provide advisory and/or other services for the company(ies) mentioned in this report, and may be involved in share placement exercise involving securities mentioned herein. In reviewing this research report, investors should be aware that any or all of the foregoing, may among other things, give rise to real or potential conflicts of interest.
This research report is available at MidS’ website. For more information on MidS and for other research reports, please visit www.bursamids.com.
ZJ Advisory Sdn Bhd (Co No: 645449-V) (An investment adviser licensed by the Securities Commission) Suite 27, 27th Floor, Sunway Tower, No 86, Jalan Ampang, 50450 Kuala Lumpur Tel (603) 2032 2328 Facsimile (603) 2032 1328


![eLd]Zj/ gu/kflnsf, cfly{s P]g@)&& eLd]Zj/ gu/kflnsf](https://img.pdfslide.us/doc/110x75/62833498132d5a321a51fa43/eldzj-gukflnsf-cflys-pgampamp-eldzj-gukflnsf.jpg)