Embed Size (px)
Citation preview
1
Studying with Technology
Microsoft Excel
By Ian Cole
Lecturer in Information & Communication Technology
Presentation modified by Ian Cole Dec 2006, from work created by Nancy Clark. original available at: http://med.fsu.edu/informatics/Spreadsheets.ppt

2
Before we start…….
Please turn off your mobile phone

3
MathematicsMathematics
4
Session Plan Mathematics or Statistics
The Median, the Mean, the Mode Introduction to Microsoft Excel
Presentation Excel Workbook 1
5
Mathematical Terms Average:
It usually refers to the (arithmetic) mean, but it can also signify the median, the mode, the geometric mean, and weighted means, and other things
It is better to avoid it as it a bit vague. Mean or arithmetic mean:
The sum of a list of numbers, divided by the total number of numbers in the list. Also called arithmetic mean
Histogram: a histogram is a graphical display of tabulated
frequencies.
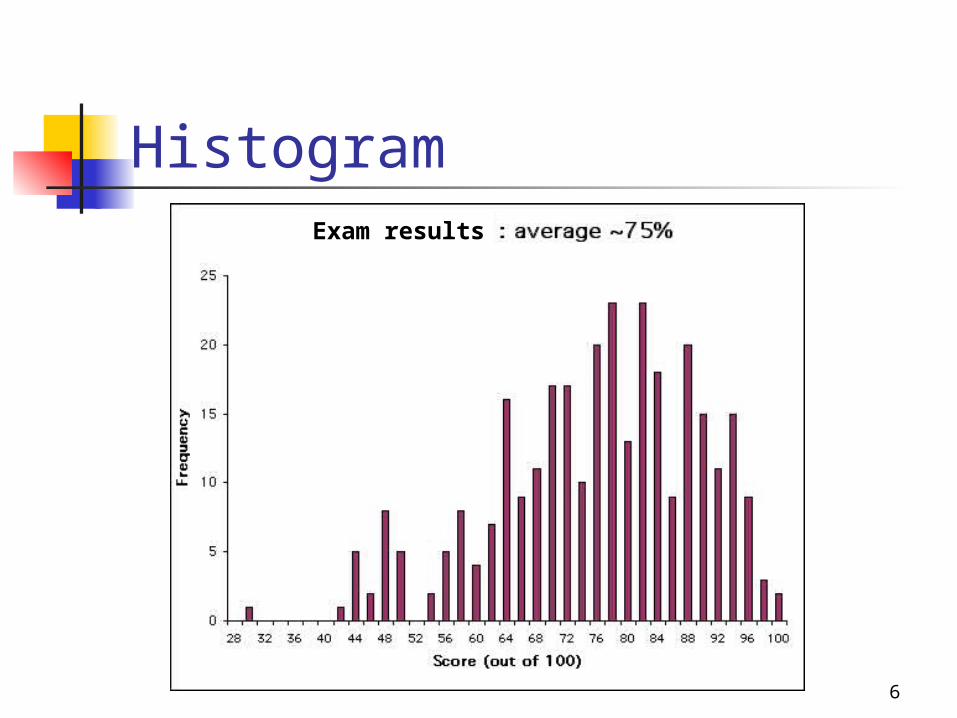
6
Histogram Exam results
7
Mathematical Terms Median:
The statistical median is the middle number of a group of numbers that have been arranged in order by size. If there is an even number of terms, the median is the mean of the two middle numbers:
Mode: For lists, the mode is the most common
(frequent) value. A list can have more than one mode. For histograms, a mode is a relative maximum
8
Mathematical Terms Range:
The range is a set of numbers where the largest value in the set minus the smallest value in the set. Note that the range is a single number, not many numbers
Total: A total is determining the overall sum of numbers or a
quantity Multimodal distribution:
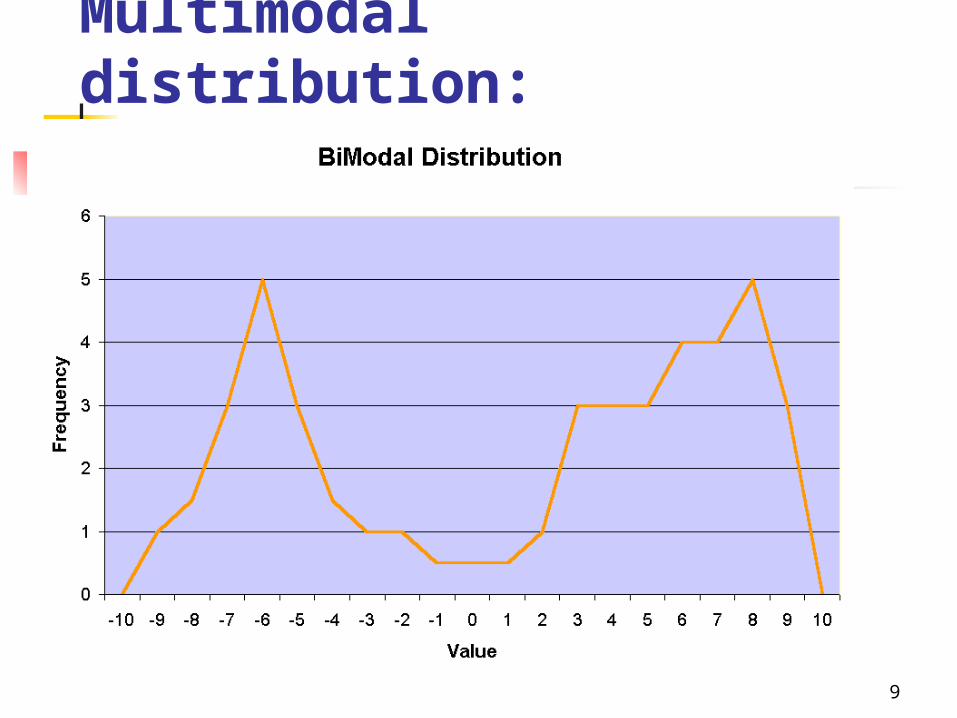
A distribution with more than one mode. The histogram of a multimodal distribution has more than one "bump“
9
Multimodal distribution:
10
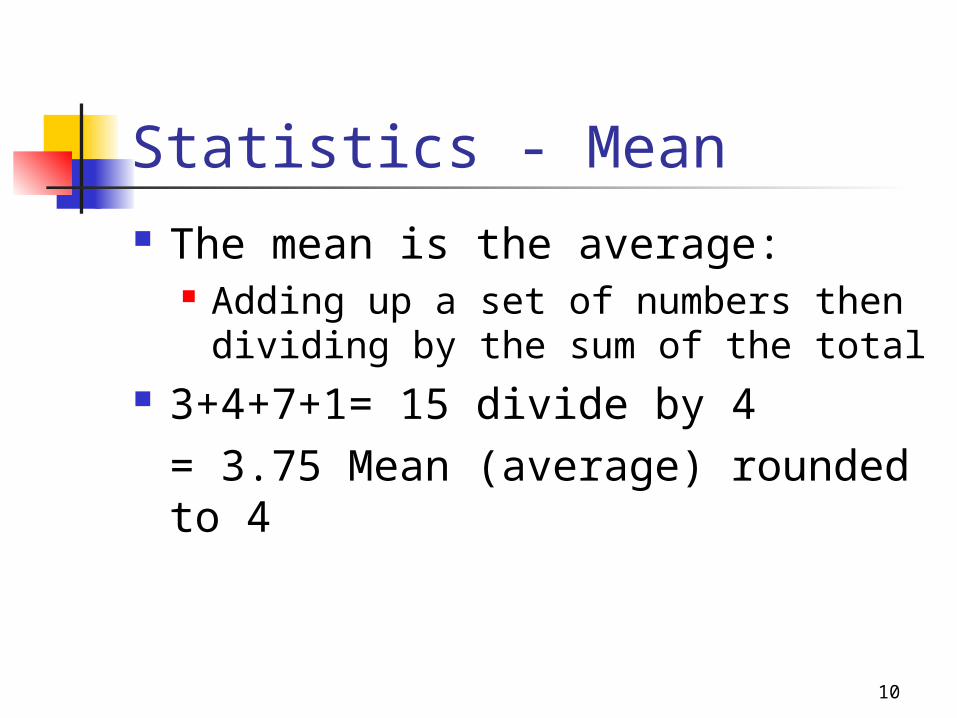
Statistics - Mean The mean is the average:
Adding up a set of numbers then dividing by the sum of the total
3+4+7+1= 15 divide by 4 = 3.75 Mean (average) rounded to 4
11
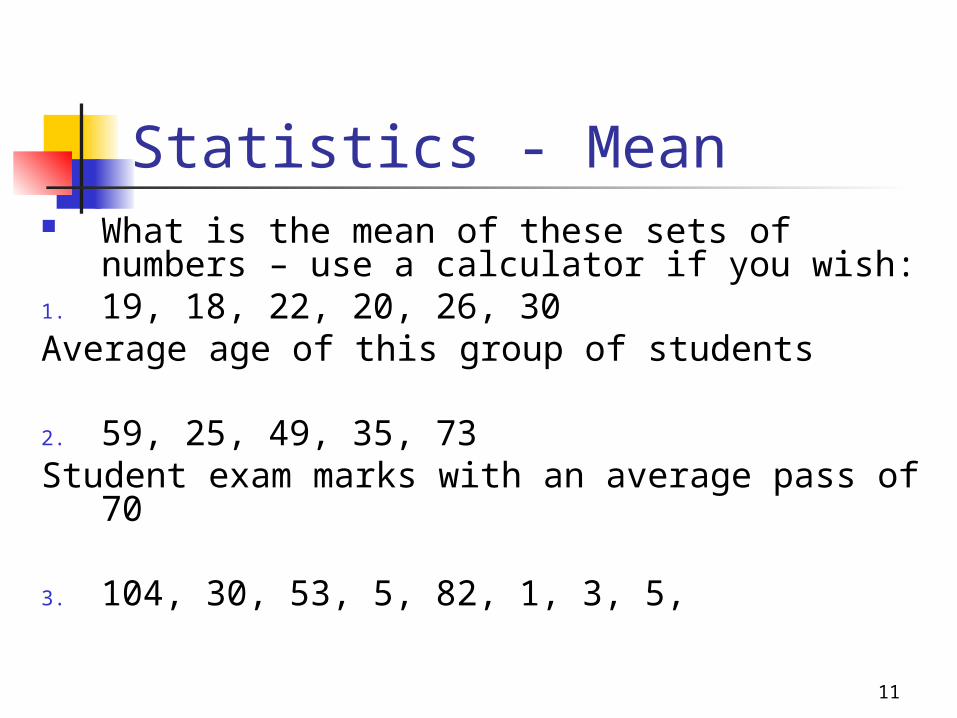
Statistics - Mean What is the mean of these sets of numbers
– use a calculator if you wish:1. 19, 18, 22, 20, 26, 30Average age of this group of students
2. 59, 25, 49, 35, 73Student exam marks with an average pass of
70 3. 104, 30, 53, 5, 82, 1, 3, 5,
12
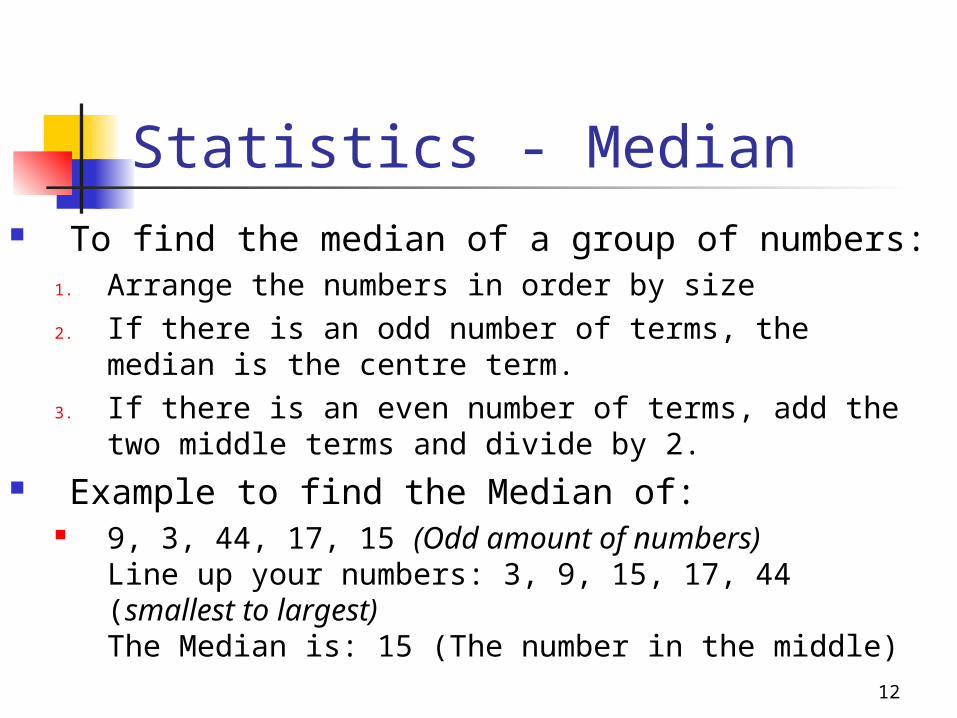
Statistics - Median To find the median of a group of numbers:
1. Arrange the numbers in order by size 2. If there is an odd number of terms, the median is
the centre term. 3. If there is an even number of terms, add the two
middle terms and divide by 2. Example to find the Median of:
9, 3, 44, 17, 15 (Odd amount of numbers)Line up your numbers: 3, 9, 15, 17, 44 (smallest to largest)The Median is: 15 (The number in the middle)
13
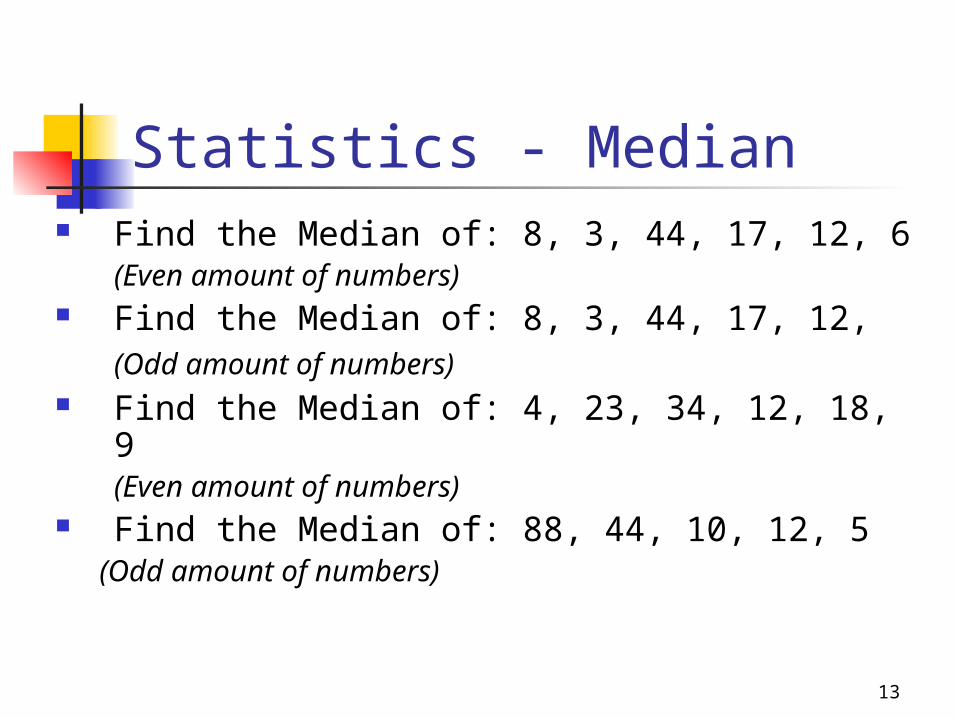
Statistics - Median Find the Median of: 8, 3, 44, 17, 12, 6
(Even amount of numbers) Find the Median of: 8, 3, 44, 17, 12,
(Odd amount of numbers) Find the Median of: 4, 23, 34, 12, 18, 9
(Even amount of numbers) Find the Median of: 88, 44, 10, 12, 5
(Odd amount of numbers)
14
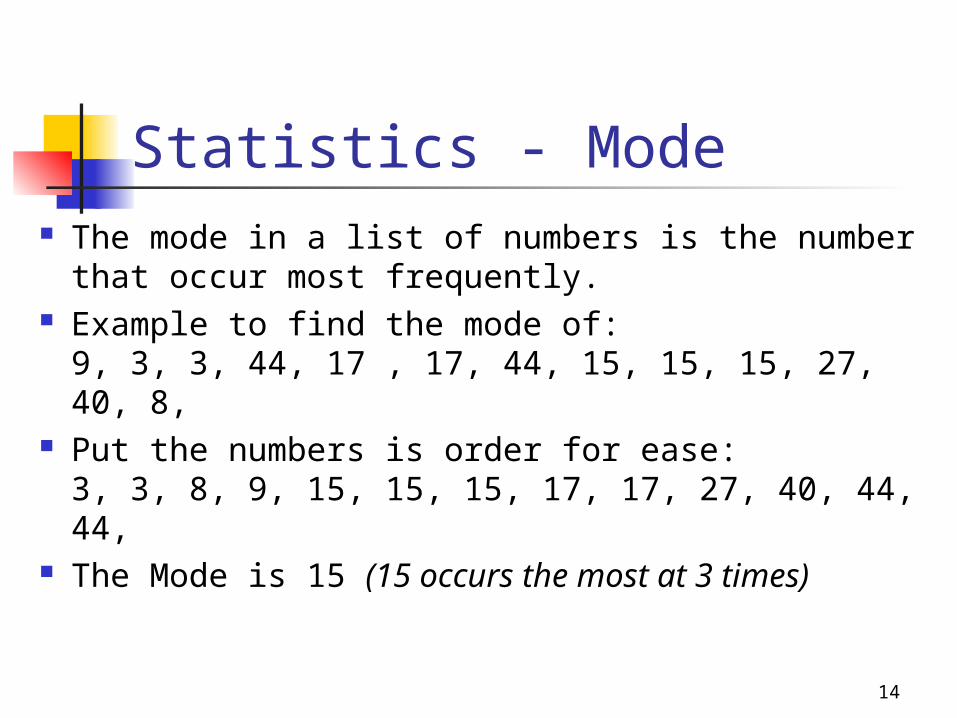
Statistics - Mode The mode in a list of numbers is the number
that occur most frequently. Example to find the mode of:
9, 3, 3, 44, 17 , 17, 44, 15, 15, 15, 27, 40, 8, Put the numbers is order for ease:
3, 3, 8, 9, 15, 15, 15, 17, 17, 27, 40, 44, 44, The Mode is 15 (15 occurs the most at 3
times)
15
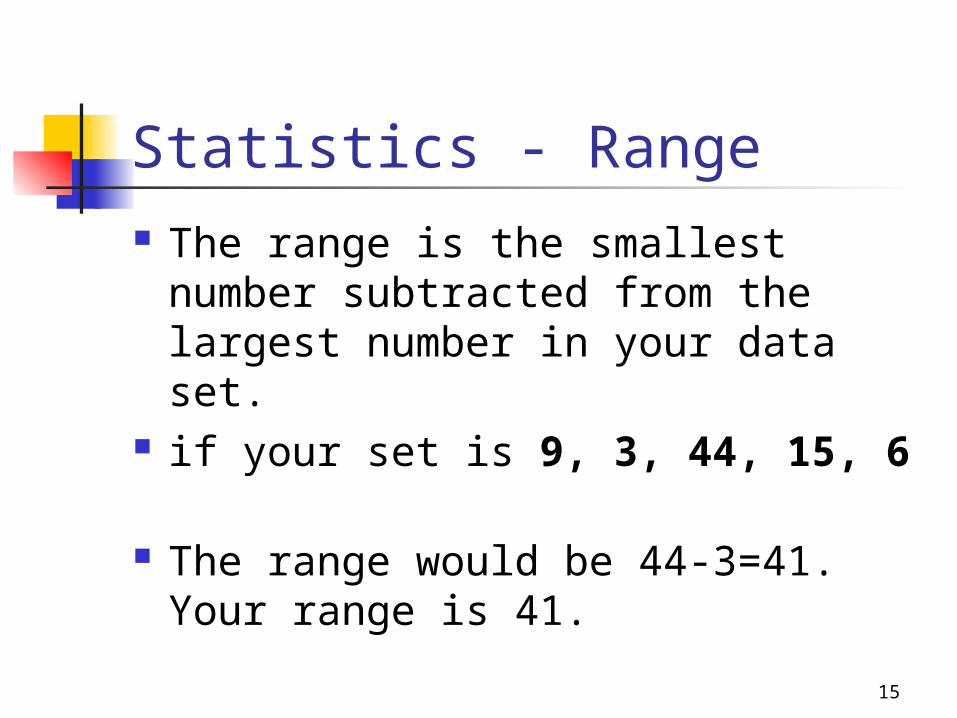
Statistics - Range The range is the smallest number
subtracted from the largest number in your data set.
if your set is 9, 3, 44, 15, 6 The range would be 44-3=41. Your
range is 41.
16
What are Excel spreadsheets used for?
Financial forecasting Statistical analysis Data collection Data manipulation Summarizing data Communicating data
Budgets Research Assignment
results Charts Student
timetables In assignments
17
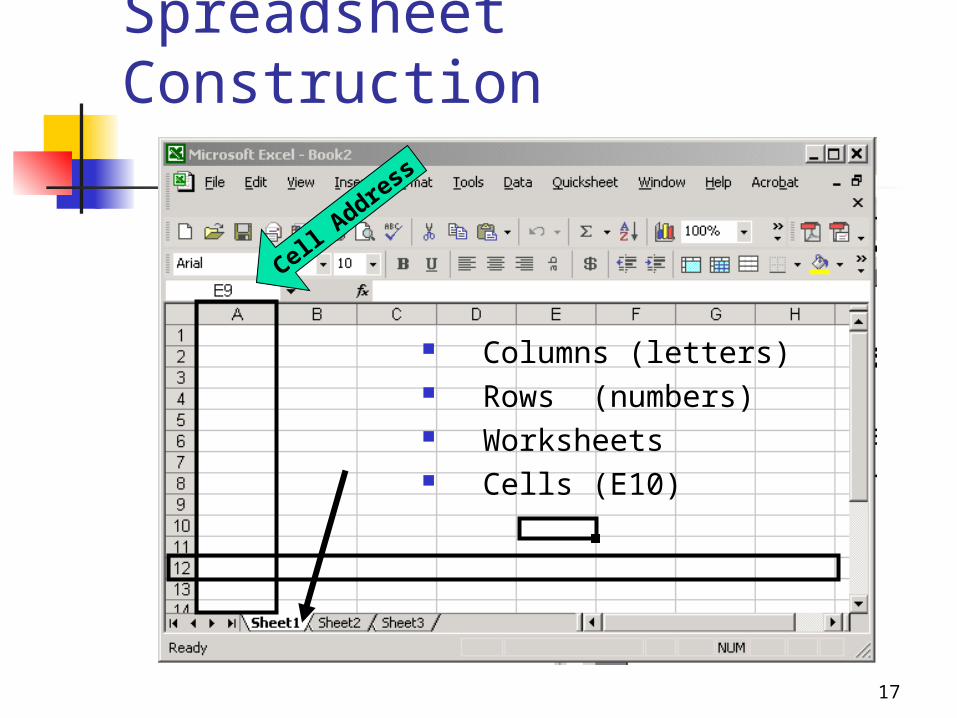
Spreadsheet Construction
Columns (letters) Rows (numbers) Worksheets Cells (E10)
Cell Addre
ss
18
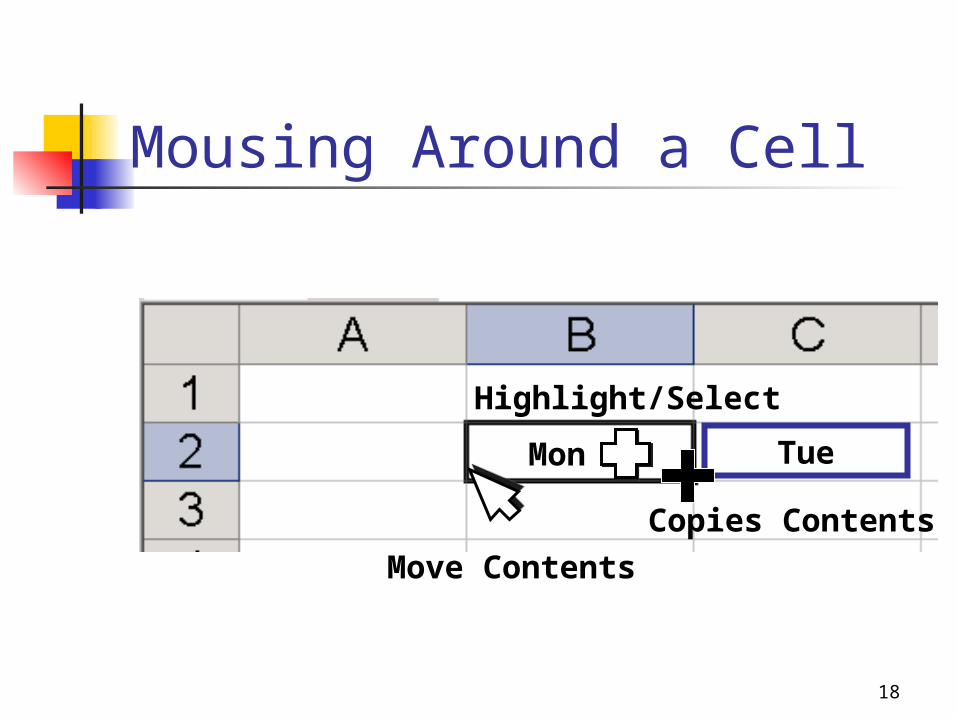
Mousing Around a Cell
Highlight/Select
Move Contents
Copies Contents
Mon Tue
19
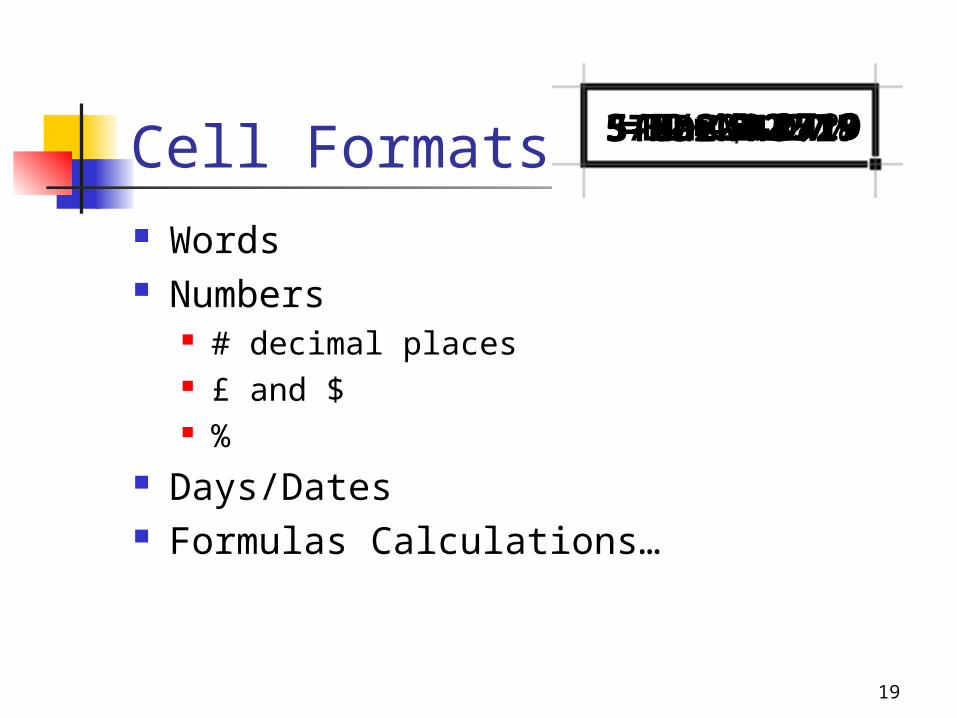
Cell Formats Words Numbers
# decimal places £ and $ %
Days/Dates Formulas Calculations…
45.271945.3$45.27.271927%5-Mar-025-Mar3/5/2002STUDENT=B2+C2-D4
20
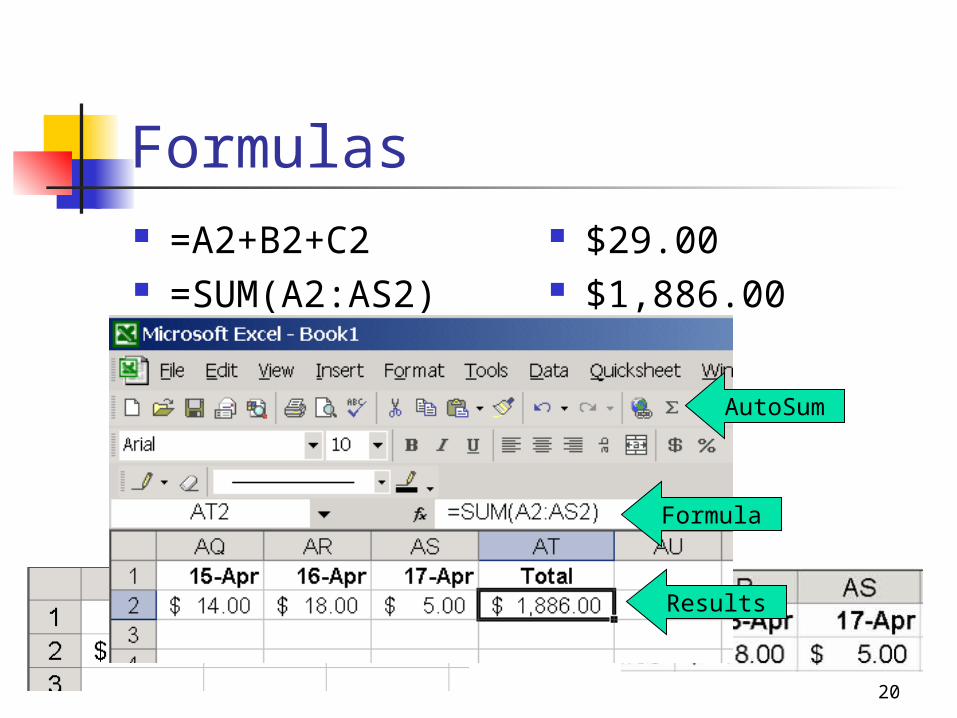
Formulas =A2+B2+C2 =SUM(A2:AS2)
$29.00 $1,886.00
Formula
Results
AutoSum
21
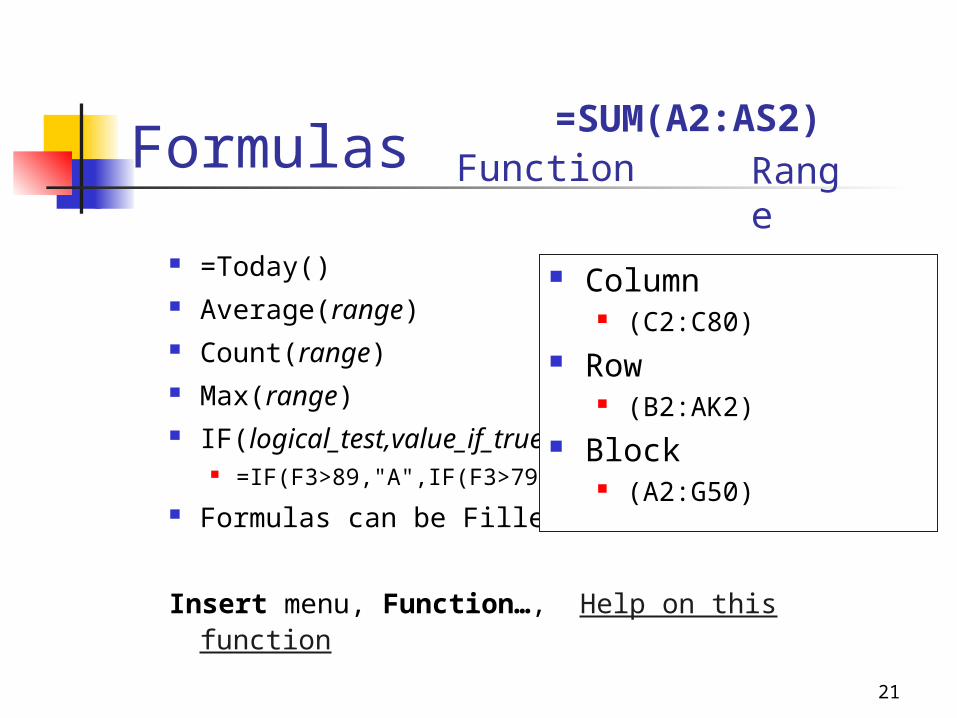
Formulas
=Today() Average(range) Count(range) Max(range) IF(logical_test,value_if_true,value_if_false)
=IF(F3>89,"A",IF(F3>79,"B",IF(F3>69,"C","F")))
Formulas can be Filled Down
Insert menu, Function…, Help on this function
Column (C2:C80)
Row (B2:AK2)
Block (A2:G50)
=SUMFunction Range
(A2:AS2)
22
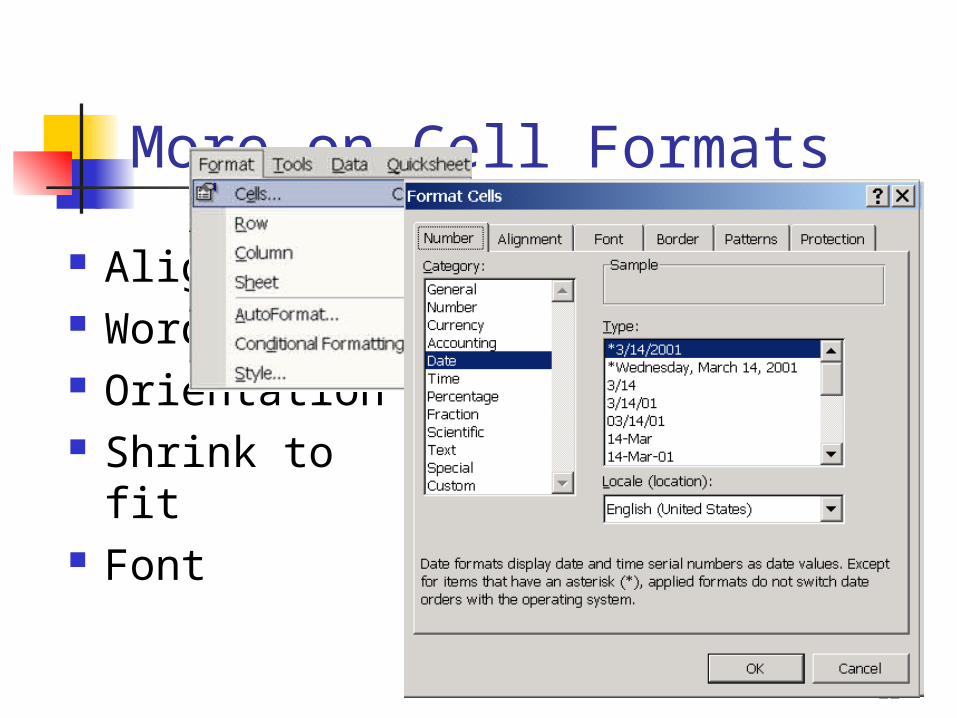
More on Cell Formats
Alignment Word wrap Orientation Shrink to fit Font
23
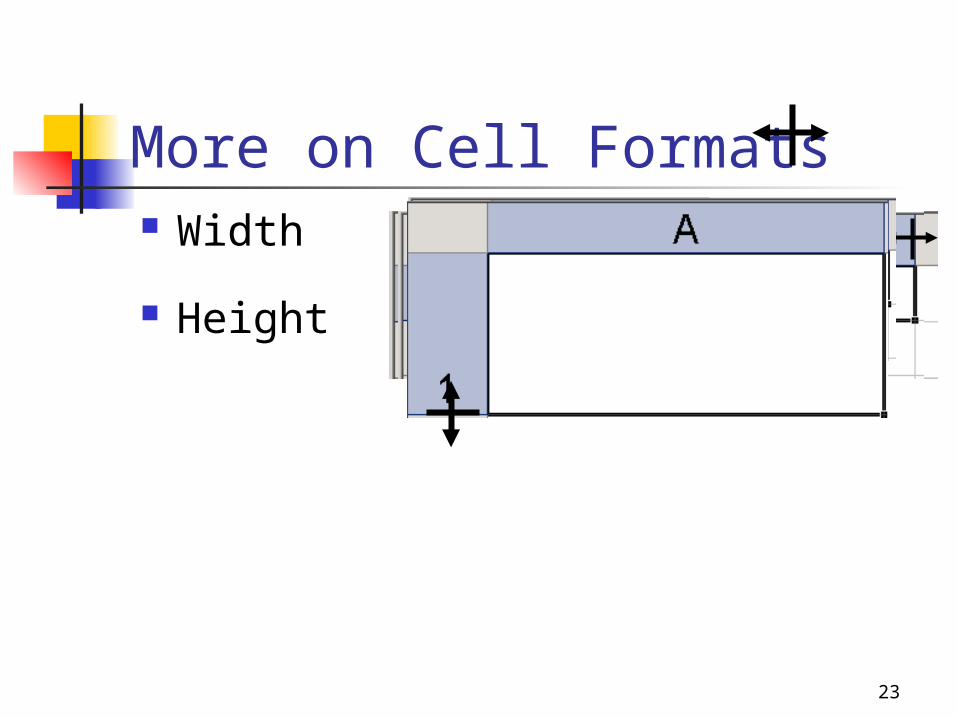
More on Cell Formats Width
Height
24
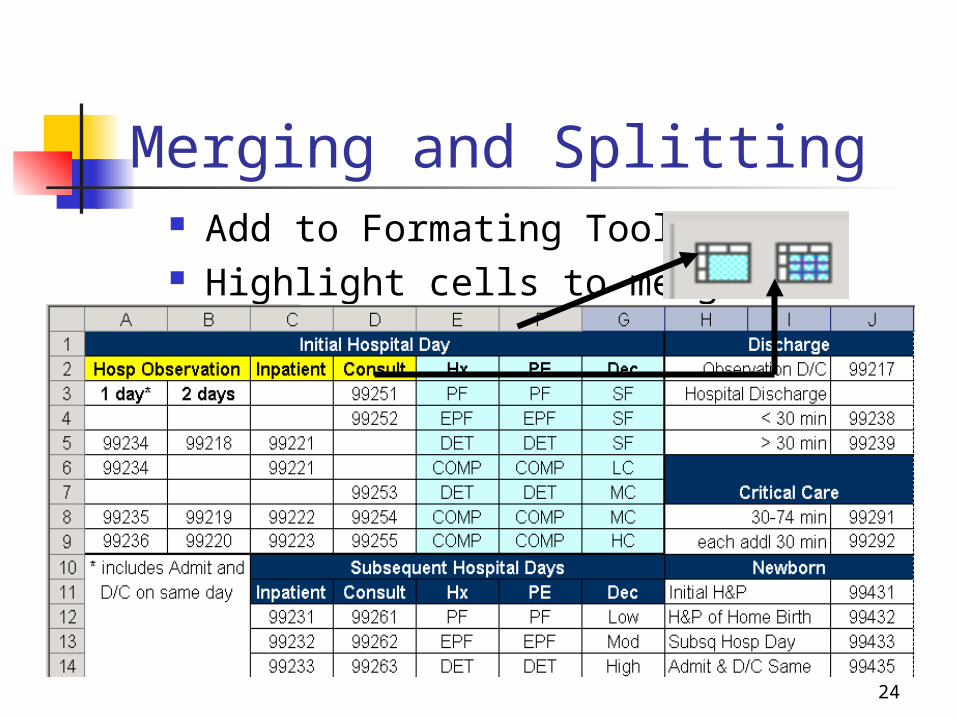
Merging and Splitting Add to Formating Toolbar Highlight cells to merge Click Merge Button Unmerge
25
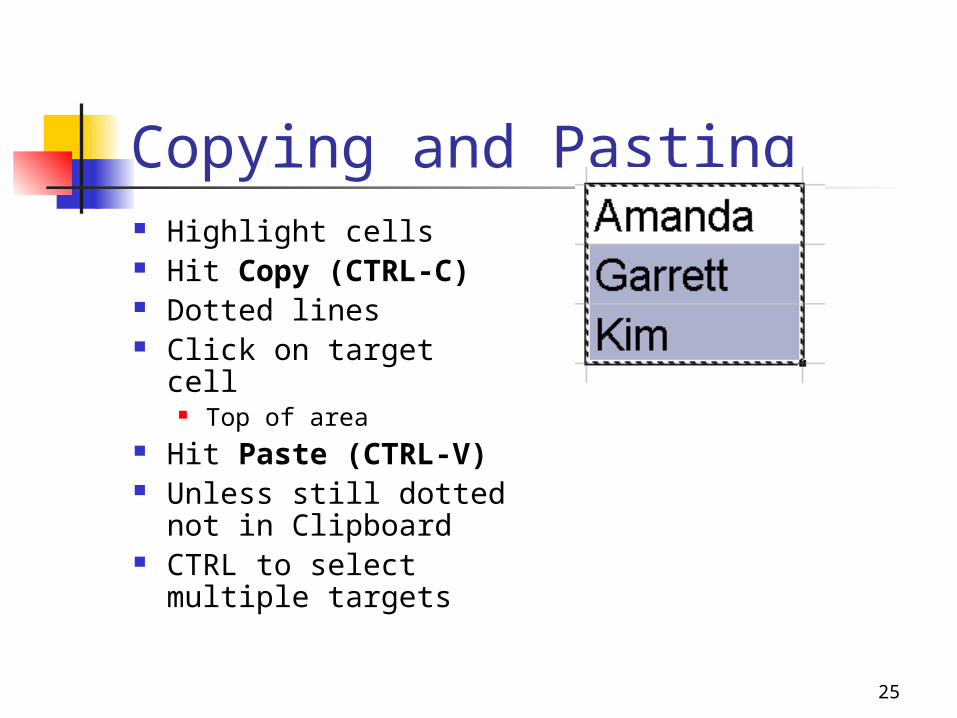
Copying and Pasting Highlight cells Hit Copy (CTRL-C) Dotted lines Click on target cell
Top of area Hit Paste (CTRL-V) Unless still dotted
not in Clipboard CTRL to select
multiple targets
26
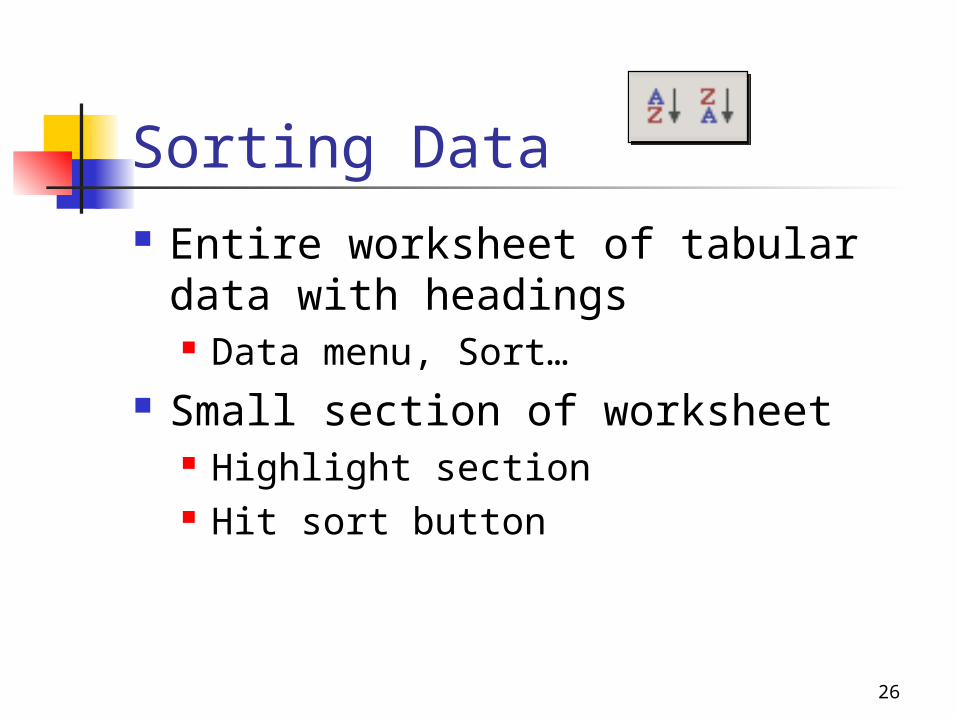
Sorting Data Entire worksheet of tabular data
with headings Data menu, Sort…
Small section of worksheet Highlight section Hit sort button
27
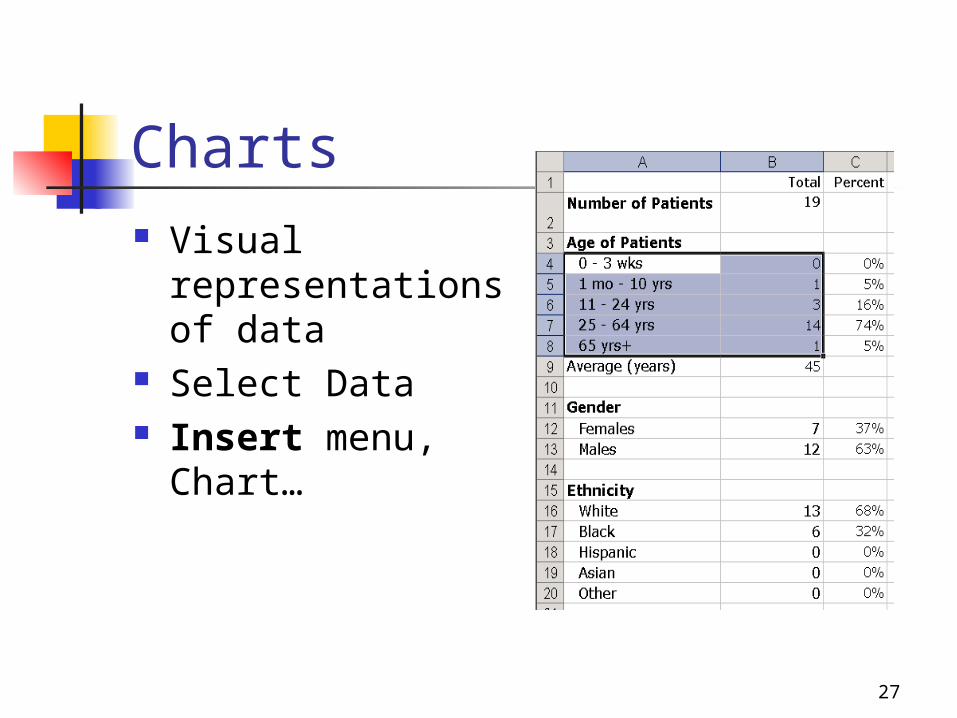
Charts Visual
representations of data
Select Data Insert menu,
Chart…
28
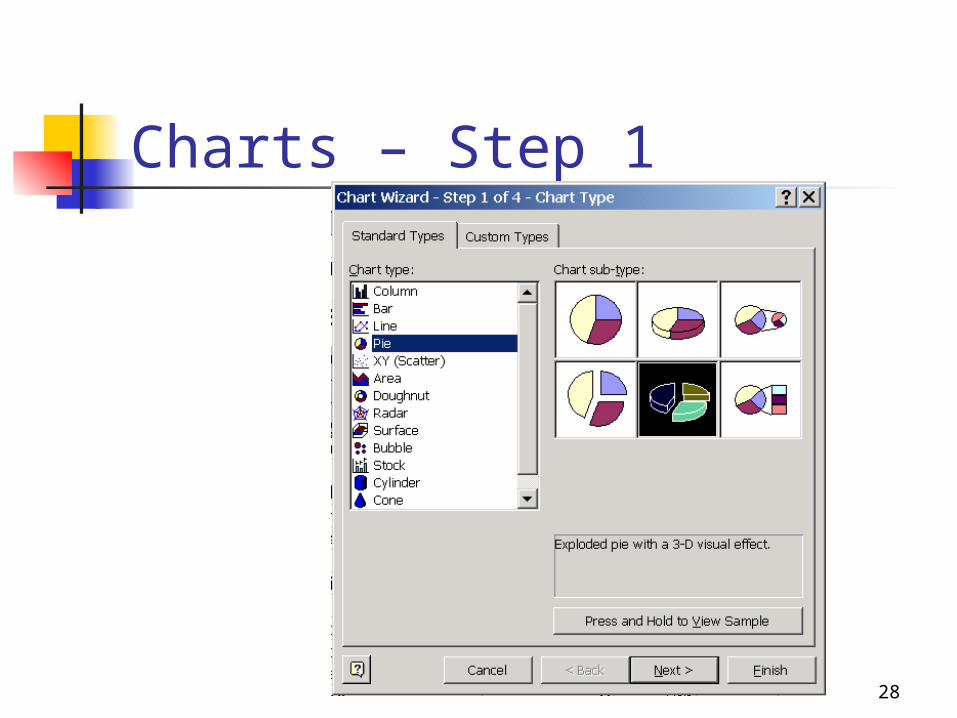
Charts – Step 1
29
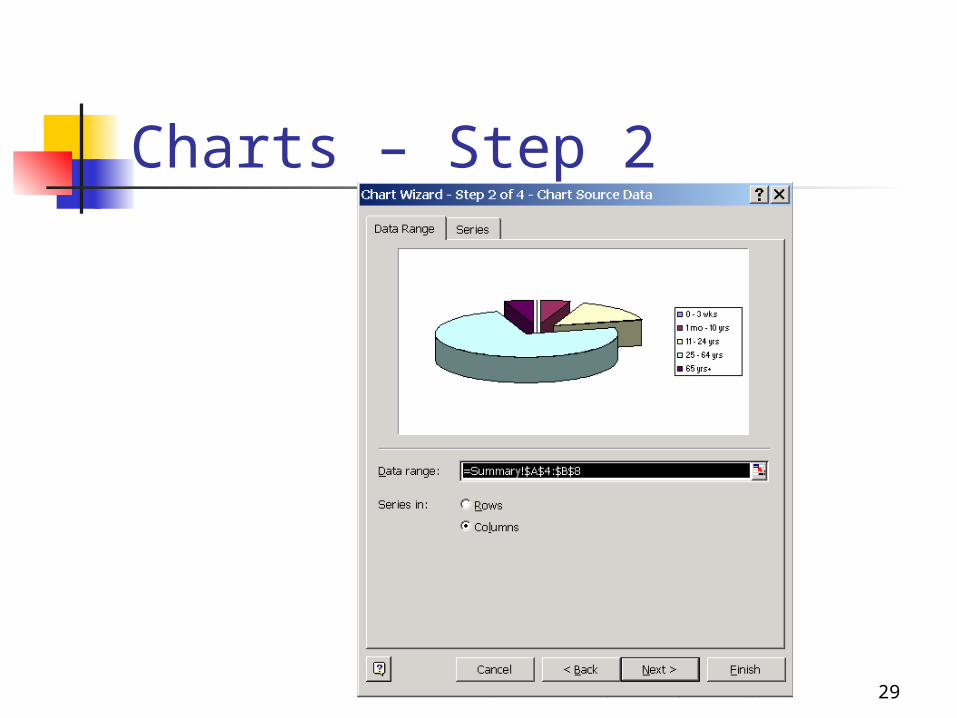
Charts – Step 2
30
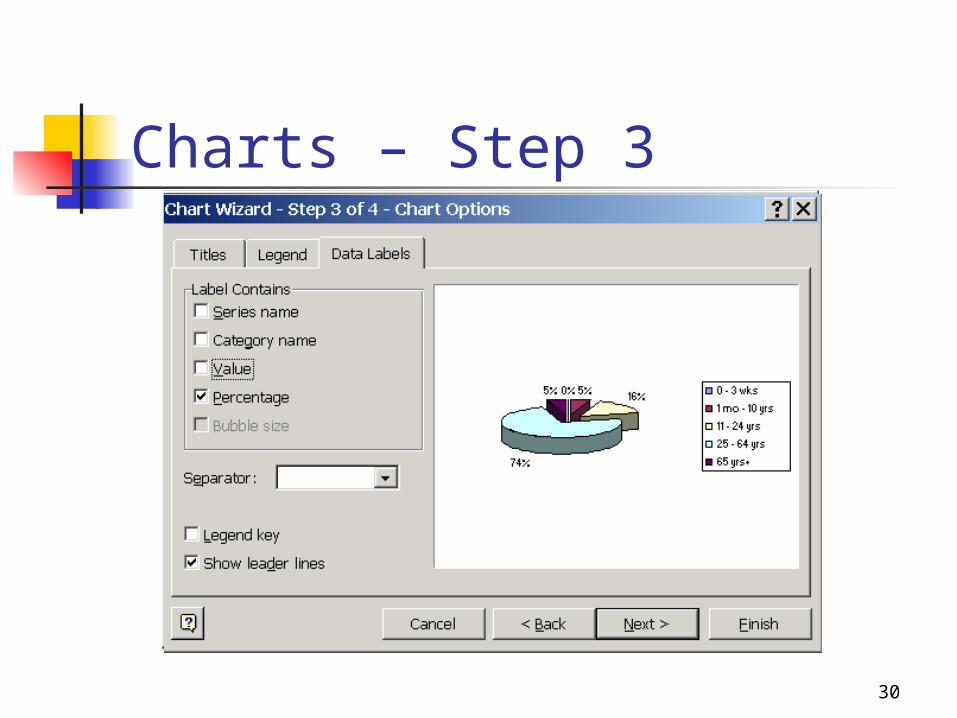
Charts – Step 3
31
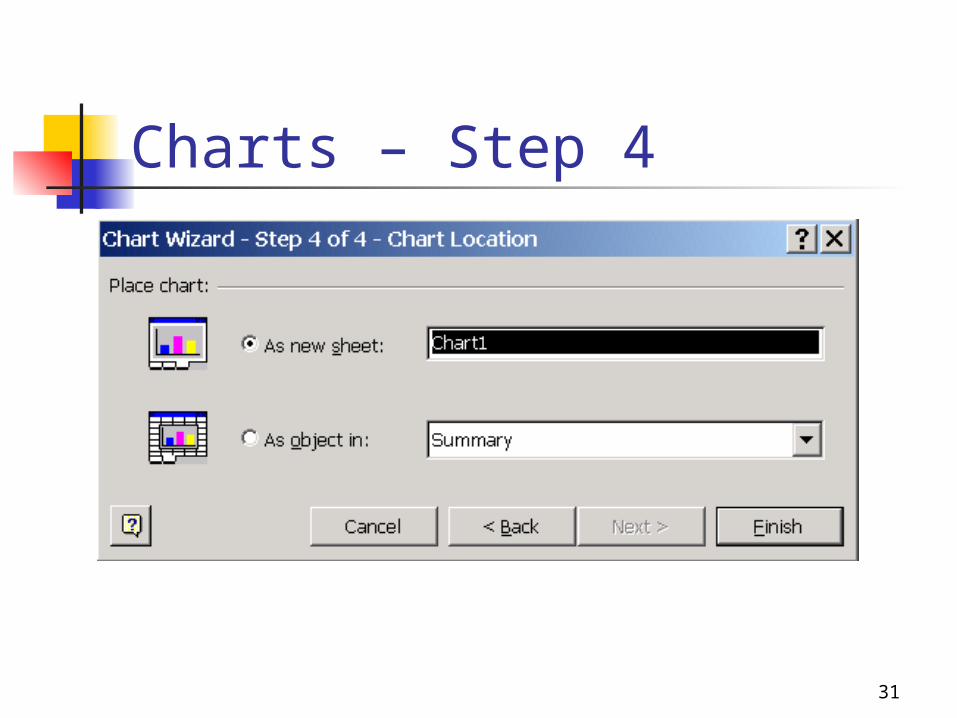
Charts – Step 4
32
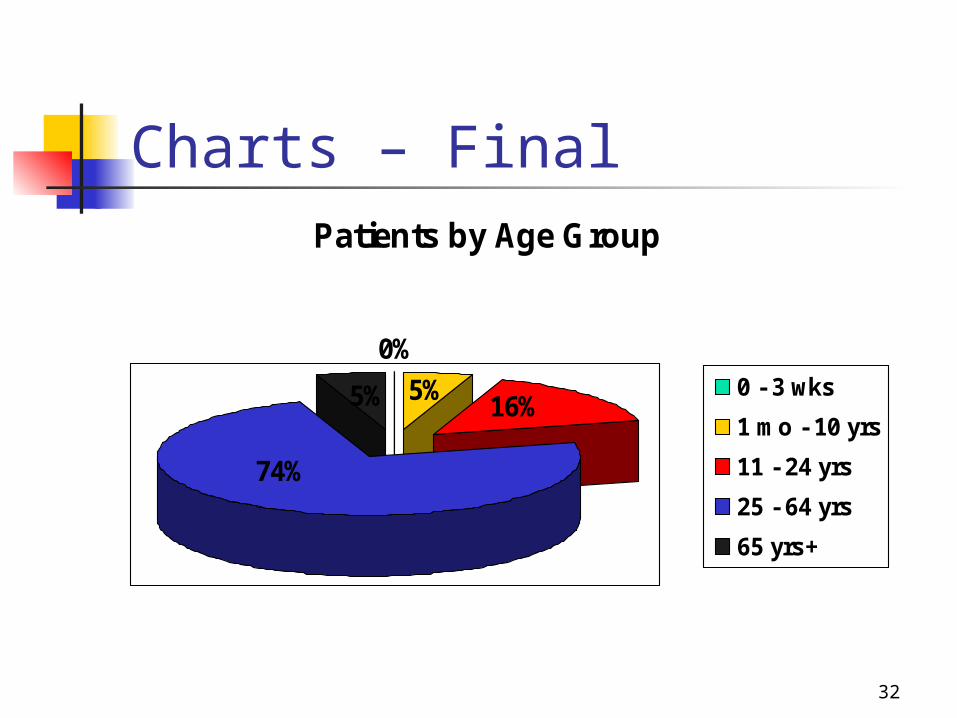
Charts – FinalPatients by Age Group
0%
5% 5%
74%
16%0 - 3 wks
1 mo - 10 yrs
11 - 24 yrs
25 - 64 yrs
65 yrs+
33
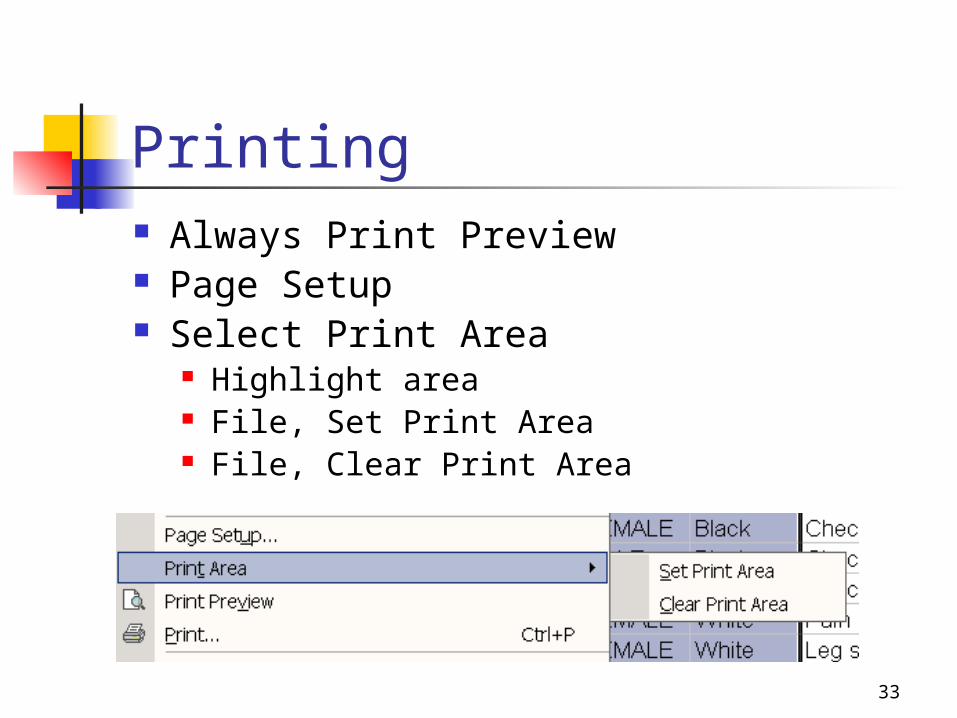
Printing Always Print Preview Page Setup Select Print Area
Highlight area File, Set Print Area File, Clear Print Area
34
Insert Excel Spreadsheets Word or PowerPoint Copy and Paste Use Insert Microsoft Excel
Worksheet button Double click on table or chart Calls up Excel
35
What happens next This afternoon
‘Excel’ workbook 1. Next session
Excel Formulas and Functions ‘Excel workbook 2.
Presentation modified by Ian Cole Dec 2006, from work created by Nancy Clark. original available at: http://med.fsu.edu/informatics/Spreadsheets.ppt