Embed Size (px)
Citation preview
7/30/2019 1 Strain Profiling of Fatigue Crack Overload Effects
http://slidepdf.com/reader/full/1-strain-profiling-of-fatigue-crack-overload-effects 1/12
Strain profiling of fatigue crack overload effects
using energy dispersive X-ray diffraction
M. Crofta,b,*, Z. Zhongb, N. Jisrawic, I. Zakharchenkoc, R.L. Holtzd, J. Skaritkab,T. Fastc, K. Sadanandad, M. Lakshmipathye, T. Tsakalakosc
a Department of Physics, Rutgers University, Piscataway, NJ 08854, USA
b National Synchrotron Light Source, Brookhaven National Laboratory, Upton, NY 11973, USA
cCeramics Department, Rutgers University, Piscataway, NJ 08854, USA
d Naval Research Laboratory, Materials Science and Technology Division, Code 6323, Washington, DC 20375, USA
e Zygo Corporation, Laurel Brook Road, Middlefield, CT 06455, USA
Available online 2 August 2005
Abstract
Synchrotron based energy dispersive X-ray diffraction has been used to profile the strains around fatigue cracks in 4140 steel test
specimens. In particular strain field comparisons were made on specimens prepared: with initial constant stress intensity fatigue; with this
initial fatigue followed by a single overload cycle; and with this fatigue-overload sequence followed by an additional constant stress intensity
fatigue. The strain profiles behind, at and in-front-of the crack tip are discussed in detail. Selected strain profiles measurements under in situ
applied tensile stress are also presented. The technique of optical surface height profiling reveals surface depression effects which can be
correlated with the interior strain profiles.
q 2005 Elsevier Ltd. All rights reserved.
Keywords: Fatigue; Strain; X-ray; Synchrotron; Overload
1. Introduction
Empirical understanding of fatigue crack growth is of
tremendous importance and has therefore been the focus of
a commensurately large research effort [1]. The goals of this
intense effort are: to enable proper design of structural
members with reliable predicted lifetimes, under general
duty-cycle-loading; and, to reliably assess the lifetimes of
key structural components currently in the field. The growth
of the fatigue crack intrinsically involves the local fracture
of material under stress/damage conditions amplified by thecrack geometry. The understanding of the local internal
strain/stress conditions in the vicinity of the fatigue crack tip
consequently is central to constructing models of fatigue
crack growth. Key to successful and reliable life prediction
is the incorporation into the basic physics of this problem
the total driving force parameters, which contain both the
applied and internal stress contributions. Unfortunately the
ability to measure the important local, internal strain/stress
fields about the crack tip has been a difficult experimental
problem, especially in the interior of specimens. This paper
discusses the successful application of energy dispersive
X-ray diffraction (EDXRD) to the profiling of the local
strain fields around the crack/crack-tip of fatigue cracks in
4140 steel specimens with interplaying fatigue and single
cycle overloading.
The ability to build up models that can deal reliably with
variable load amplitude fatigue requires a knowledge of the
effects of specific load-cycle variations on the local strain
fields around the crack tip. One such variation is a single a
tensile overload cycle which is known: to inhibit the crack
growth rate; to create greater retardation effects with
greater numbers or amplitudesof the overload; and to increase
fatigue life [2–5]. This ongoing work focused specifically on
local strain field modifications due to such an overload.
The organization of this paper is as follows. After this
introduction, previous X-ray based local strain studies will
International Journal of Fatigue 27 (2005) 1408–1419
www.elsevier.com/locate/ijfatigue
0142-1123/$ - see front matter q 2005 Elsevier Ltd. All rights reserved.
doi:10.1016/j.ijfatigue.2005.06.022
* Corresponding author. Address: Department of Physics, Rutgers
University, Piscataway, NJ 08854, USA. Tel.: C1 732 322 4644; fax:
C1 732 445 4343.
E-mail address: [email protected] (M. Croft).
7/30/2019 1 Strain Profiling of Fatigue Crack Overload Effects
http://slidepdf.com/reader/full/1-strain-profiling-of-fatigue-crack-overload-effects 2/12
be briefly reviewed. In the following experimental sections,
first the EDXRD technique will be reviewed and thereafter
the fatigue sample preparation. The coordinate choice,
strain component measured (3 yy) and strain profile directions
will be discussed in this latter section. In Section 4.1
the strain field results for the region of up to several mm
behind the crack tip are discussed. Although this is not themain thrust of this work, these at-crack results are important
for two reasons: because some models for fatigue crack
growth have hypothesized a strong role for crack surface
interactions behind the crack tip; and because our results do
indeed show non-trivial (albeit rather constant) effects in
this range. In Section 4.2 the strain field profile results
paralleling the crack plane (both in the plane and below it)
are presented for several mm behind and in front of the
crack tip. The behavior near the tip is emphasized, as are the
important modifications observed between a fatigued,
fatigued overloaded and fatigued-overloaded-fatigued con-
ditions. The results will be summarized in Section 5. It
should be noted that in the course of the experiments and
their discussion the valuable ancillary technique of optical
height profiling of the specimen surface (carried out in
collaboration with Zygo Corp.) has provided essential
information. This optical technique is discussed in
Appendix to this article and its results are included where
relevant in the discussion.
2. Background
The measurement and model prediction of the strain field
distribution both under load and without load (the residualstrain) is central to the design and life cycle prediction of all
structural components. Understandably a host of ingenious
techniques for probing such strain fields have been
developed [6–8]. As direct, local measures of lattice
parameters changes X-ray and neutron scattering are
probably the most fundamental of the nondestructive
techniques for strain field measurements [6–8]. The
limitations of the large scattering volume required in
neutron scattering for local strain profiling have been
discussed elsewhere [6]. In conventional X-ray scattering
measurements the penetration depth of the X-rays limits
their use to the near surface region only (within less than
0.01 mm) [6]. Never-the-less there have been some notable
near surface X-ray strain profiling studies in the past as
reviewed below.
Allison [9] performed a conventional X-ray strain study
of crack tip strain profiles with varying overload and applied
stress in compact tension (CT) 1045 steel specimens. This
work provided an excellent study of the near-surface (by
virtue of the low energy Cr-tube X-ray source) stresses in
the crack plane. The existence (on the surface) of a zone of
residual compressive stresses at the crack tip, and its
increase in spatial extent with increasing overload was
clearly demonstrated in this paper.
Wang et al. [10] performed finite element (FE)
calculations and surface X-ray diffraction on low-alloy,
high-strength structural steel (in a compact tension shear
geometry). This work involved steady state growth with no
overload. This work reports extensive FE calculations
and selected stress distributions in the vicinity of the crack
tip. One unusual point to note is that their experimental stressprofiles lie in the crack plane (i.e. yZ0) for xO0 (in front of
the crack tip) but are displaced away from the crack plane by
0.2 mm in the region behind the tip ( x!0). As will be seen
below this experimental profile choice fails to detect
nontrivial effects in the near-crack-plane behind the tip.
Ramos et al. [11] studied low carbon structural steel
in the CT geometry with overloads to 200 and 300% levels.
A Cr X-ray source was used with a rather large 1 mm2 spot
size and a less than 10 mm surface sampling depth. The two
surface residual stress profiles (in the crack plane at and
beyond the tip) inferred from this study showed the growth
of the tip-compression in magnitude and spatial extent with
increasing overload. The increased fatigue life of the
overloaded samples was also demonstrated.
Finally, it should be noted that James et al. [12] recently
reported selected proof of principal measurements using a
25 keV synchrotron X-ray beam to profile the strain
field distribution for a fatigue crack in a fatigue cracked
CT-geometry aluminum alloy specimen.
3. Experimental
3.1. Synchrotron EDXRD
Synchrotron based energy dispersive X-ray diffraction
(EDXRD) has emerged as a promising new method for
residual stress analysis due to its high intensity, its high
parallelism, and its simultaneous collection of many Bragg
lines [6]. Our group has been applying the EDXRD
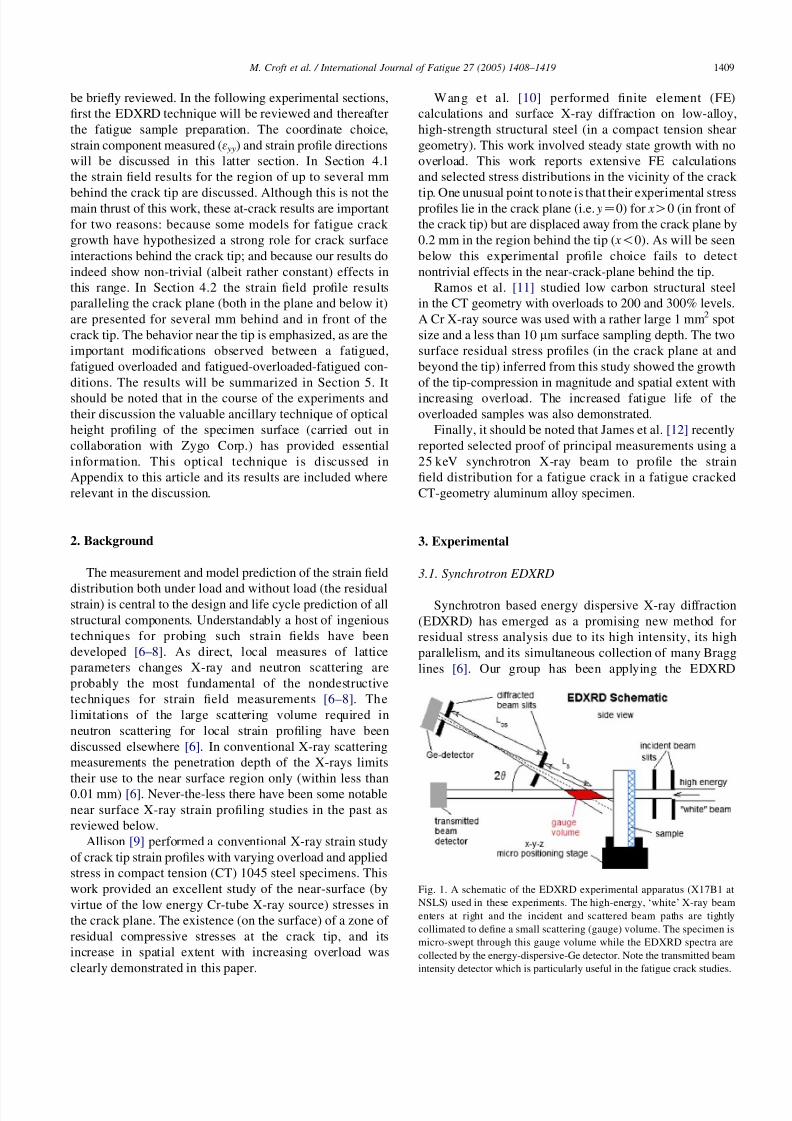
Fig. 1. A schematic of the EDXRD experimental apparatus (X17B1 at
NSLS) used in these experiments. The high-energy, ‘white’ X-ray beam
enters at right and the incident and scattered beam paths are tightly
collimated to define a small scattering (gauge) volume. The specimen is
micro-swept through this gauge volume while the EDXRD spectra are
collected by the energy-dispersive-Ge detector. Note the transmitted beam
intensity detector which is particularly useful in the fatigue crack studies.
M. Croft et al. / International Journal of Fatigue 27 (2005) 1408–1419 1409
7/30/2019 1 Strain Profiling of Fatigue Crack Overload Effects
http://slidepdf.com/reader/full/1-strain-profiling-of-fatigue-crack-overload-effects 3/12
technique to the profiling of fatigue crack strain fields at the
Brookhaven National Synchrotron Light Source (NSLS) at
beam line X17-B1. A schematic for of the X17-B1
experimental apparatus is shown in Fig. 1. Several parts
of the apparatus should be noted. The wiggler high energy
white beam enters from the right. (Here, it should be noted
that the superconducting wiggler insertion device at X17produces high intensity X-rays in the 30–150 keV energy
range which is essential to these EDXRD measurements.)
The incident and diffracted beams are tightly collimated by
two slits each, thereby defining the small-size of the gauge
volume.
The beam intensity transmitted through the sample is
monitored by a detector so that a radiographic profile
(referred to as a transmission profile, TP) of the sample can
be constructed for precise positioning with respect to local
structures, like a fatigue crack in the present study. The
curial crack-locus and -tip position, in the studies reported
here, were mapped out using a set of transmission profiles.In EDXRD, the incident beam and detector remain fixed
at the desired fixed scattering angle 2q (2qZ128 in these
experiments). Polychromatic radiation is incident on the
sample and the high resolution solid state Ge detector
analyzes the energy of the resulting diffraction.
A representative diffraction spectrum for a fatigued-over-
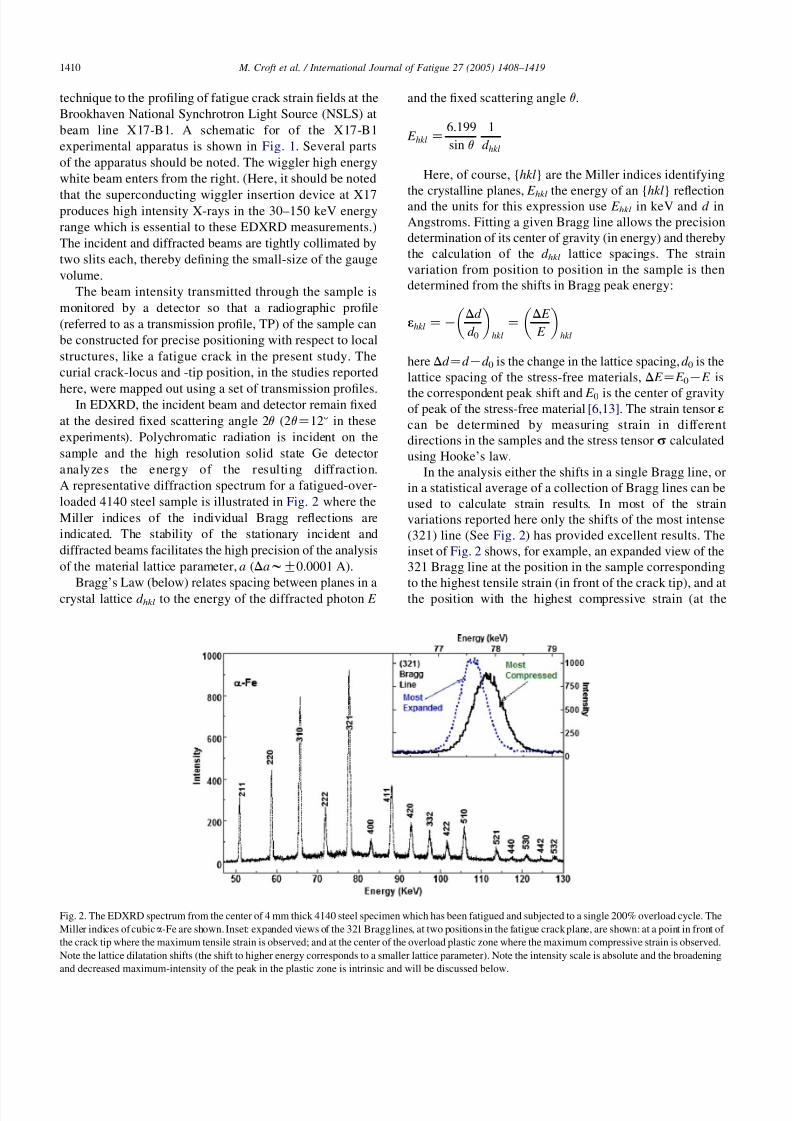
loaded 4140 steel sample is illustrated in Fig. 2 where the
Miller indices of the individual Bragg reflections are
indicated. The stability of the stationary incident and
diffracted beams facilitates the high precision of the analysis
of the material lattice parameter, a (DawG0.0001 A).
Bragg’s Law (below) relates spacing between planes in acrystal lattice d hkl to the energy of the diffracted photon E
and the fixed scattering angle q.
E hklZ6:199
sin q
1
d hkl
Here, of course, {hkl} are the Miller indices identifying
the crystalline planes, E hkl the energy of an {hkl} reflectionand the units for this expression use E hkl in keV and d in
Angstroms. Fitting a given Bragg line allows the precision
determination of its center of gravity (in energy) and thereby
the calculation of the d hkl lattice spacings. The strain
variation from position to position in the sample is then
determined from the shifts in Bragg peak energy:
3hklZKDd
d 0
hkl
Z
DE
E
hkl
here Dd Zd Kd 0 is the change in the lattice spacing, d 0 is the
lattice spacing of the stress-free materials, DE ZE 0KE is
the correspondent peak shift and E 0 is the center of gravityof peak of the stress-free material [6,13]. The strain tensor 3
can be determined by measuring strain in different
directions in the samples and the stress tensor s calculated
using Hooke’s law.
In the analysis either the shifts in a single Bragg line, or
in a statistical average of a collection of Bragg lines can be
used to calculate strain results. In most of the strain
variations reported here only the shifts of the most intense
(321) line (See Fig. 2) has provided excellent results. The
inset of Fig. 2 shows, for example, an expanded view of the
321 Bragg line at the position in the sample corresponding
to the highest tensile strain (in front of the crack tip), and atthe position with the highest compressive strain (at the
Fig. 2. The EDXRD spectrum from the center of 4 mm thick 4140 steel specimen which has been fatigued and subjected to a single 200% overload cycle. The
Miller indices of cubica-Fe are shown. Inset: expanded views of the 321 Bragg lines, at two positions in the fatigue crack plane, are shown: at a point in front of
the crack tip where the maximum tensile strain is observed; and at the center of the overload plastic zone where the maximum compressive strain is observed.
Note the lattice dilatation shifts (the shift to higher energy corresponds to a smaller lattice parameter). Note the intensity scale is absolute and the broadening
and decreased maximum-intensity of the peak in the plastic zone is intrinsic and will be discussed below.
M. Croft et al. / International Journal of Fatigue 27 (2005) 1408–14191410
7/30/2019 1 Strain Profiling of Fatigue Crack Overload Effects
http://slidepdf.com/reader/full/1-strain-profiling-of-fatigue-crack-overload-effects 4/12
center of the compressive plastic zone). The difference in
strain between the two points is D3w0.003.
3.2. Samples and stain profiles
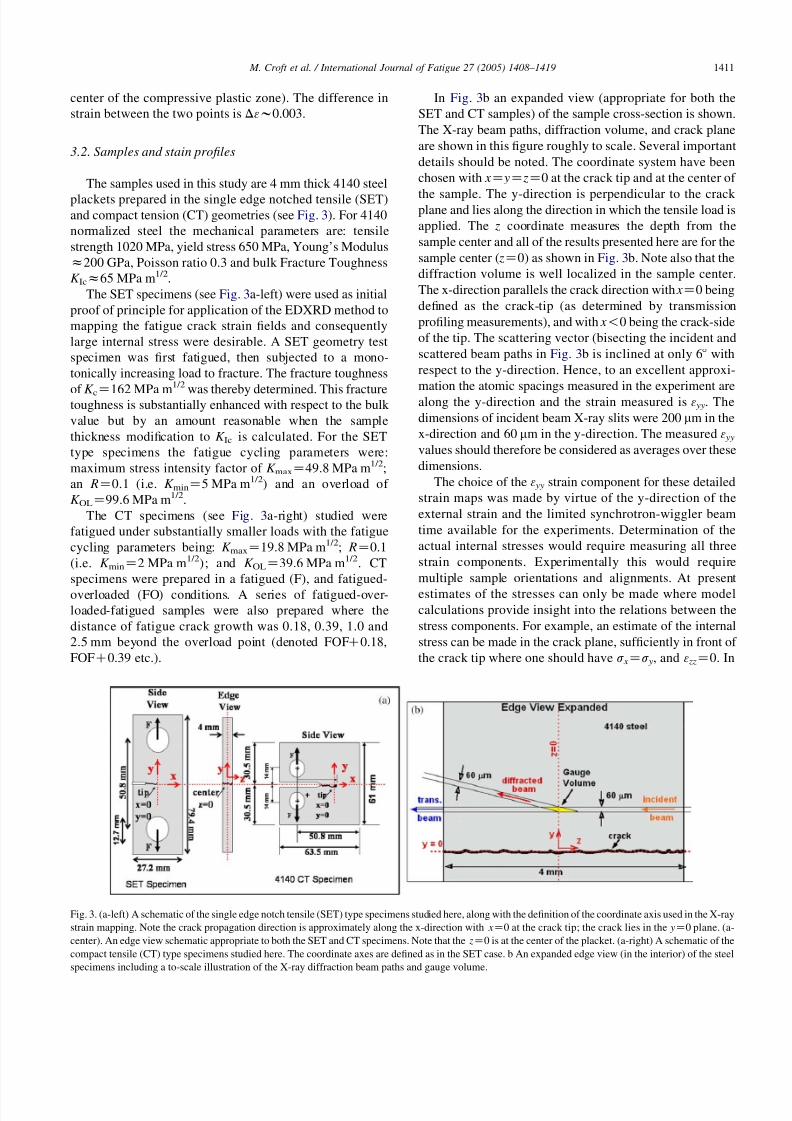
The samples used in this study are 4 mm thick 4140 steel
plackets prepared in the single edge notched tensile (SET)and compact tension (CT) geometries (see Fig. 3). For 4140
normalized steel the mechanical parameters are: tensile
strength 1020 MPa, yield stress 650 MPa, Young’s Modulus
z200 GPa, Poisson ratio 0.3 and bulk Fracture Toughness
K Icz65 MPa m1/2.
The SET specimens (see Fig. 3a-left) were used as initial
proof of principle for application of the EDXRD method to
mapping the fatigue crack strain fields and consequently
large internal stress were desirable. A SET geometry test
specimen was first fatigued, then subjected to a mono-
tonically increasing load to fracture. The fracture toughness
of K cZ
162 MPa m1/2
was thereby determined. This fracturetoughness is substantially enhanced with respect to the bulk
value but by an amount reasonable when the sample
thickness modification to K Ic is calculated. For the SET
type specimens the fatigue cycling parameters were:
maximum stress intensity factor of K maxZ49.8 MPa m1/2;
an RZ0.1 (i.e. K minZ5 MPa m1/2) and an overload of
K OLZ99.6 MPa m1/2.
The CT specimens (see Fig. 3a-right) studied were
fatigued under substantially smaller loads with the fatigue
cycling parameters being: K maxZ19.8 MPa m1/2; RZ0.1
(i.e. K minZ2 MPa m1/2); and K OLZ39.6 MPa m1/2. CT
specimens were prepared in a fatigued (F), and fatigued-
overloaded (FO) conditions. A series of fatigued-over-loaded-fatigued samples were also prepared where the
distance of fatigue crack growth was 0.18, 0.39, 1.0 and
2.5 mm beyond the overload point (denoted FOFC0.18,
FOFC0.39 etc.).
In Fig. 3b an expanded view (appropriate for both the
SET and CT samples) of the sample cross-section is shown.
The X-ray beam paths, diffraction volume, and crack plane
are shown in this figure roughly to scale. Several important
details should be noted. The coordinate system have been
chosen with xZ yZ zZ0 at the crack tip and at the center of
the sample. The y-direction is perpendicular to the crack plane and lies along the direction in which the tensile load is
applied. The z coordinate measures the depth from the
sample center and all of the results presented here are for the
sample center ( zZ0) as shown in Fig. 3b. Note also that the
diffraction volume is well localized in the sample center.
The x-direction parallels the crack direction with xZ0 being
defined as the crack-tip (as determined by transmission
profiling measurements), and with x!0 being the crack-side
of the tip. The scattering vector (bisecting the incident and
scattered beam paths in Fig. 3b is inclined at only 68 with
respect to the y-direction. Hence, to an excellent approxi-
mation the atomic spacings measured in the experiment are
along the y-direction and the strain measured is 3 yy. The
dimensions of incident beam X-ray slits were 200 mm in the
x-direction and 60 mm in the y-direction. The measured 3 yy
values should therefore be considered as averages over these
dimensions.
The choice of the 3 yy strain component for these detailed
strain maps was made by virtue of the y-direction of the
external strain and the limited synchrotron-wiggler beam
time available for the experiments. Determination of the
actual internal stresses would require measuring all three
strain components. Experimentally this would require
multiple sample orientations and alignments. At present
estimates of the stresses can only be made where modelcalculations provide insight into the relations between the
stress components. For example, an estimate of the internal
stress can be made in the crack plane, sufficiently in front of
the crack tip where one should have s xZs y, and 3 zzZ0. In
Fig. 3. (a-left) A schematic of the single edge notch tensile (SET) type specimens studied here, along with the definition of the coordinate axis used in the X-ray
strain mapping. Note the crack propagation direction is approximately along the x-direction with xZ0 at the crack tip; the crack lies in the yZ0 plane. (a-
center). An edge view schematic appropriate to both the SET and CT specimens. Note that the zZ0 is at the center of the placket. (a-right) A schematic of the
compact tensile (CT) type specimens studied here. The coordinate axes are defined as in the SET case. b An expanded edge view (in the interior) of the steel
specimens including a to-scale illustration of the X-ray diffraction beam paths and gauge volume.
M. Croft et al. / International Journal of Fatigue 27 (2005) 1408–1419 1411
7/30/2019 1 Strain Profiling of Fatigue Crack Overload Effects
http://slidepdf.com/reader/full/1-strain-profiling-of-fatigue-crack-overload-effects 5/12
this region s yZ3 yyE = ½1Knð1C2nÞZ3 yyE ð0:52Þ and an 3 yy
strain of 0.001 would correspond to a stress s y of 390 MPa.
4. Results
4.1. Behind crack tip results
Various models for fatigue crack propagation, particu-
larly upon overloading, emphasize the at-tip and beyond the
tip internal stresses while others include effects behind the
crack tip. In the few X-ray scattering studies performed in
the past on fatigue cracks, the region behind the crack tip
has been neglected. As part of the present work the crack
region has been systematically studied and clear evidence
for crack tip wake effects have been observed.
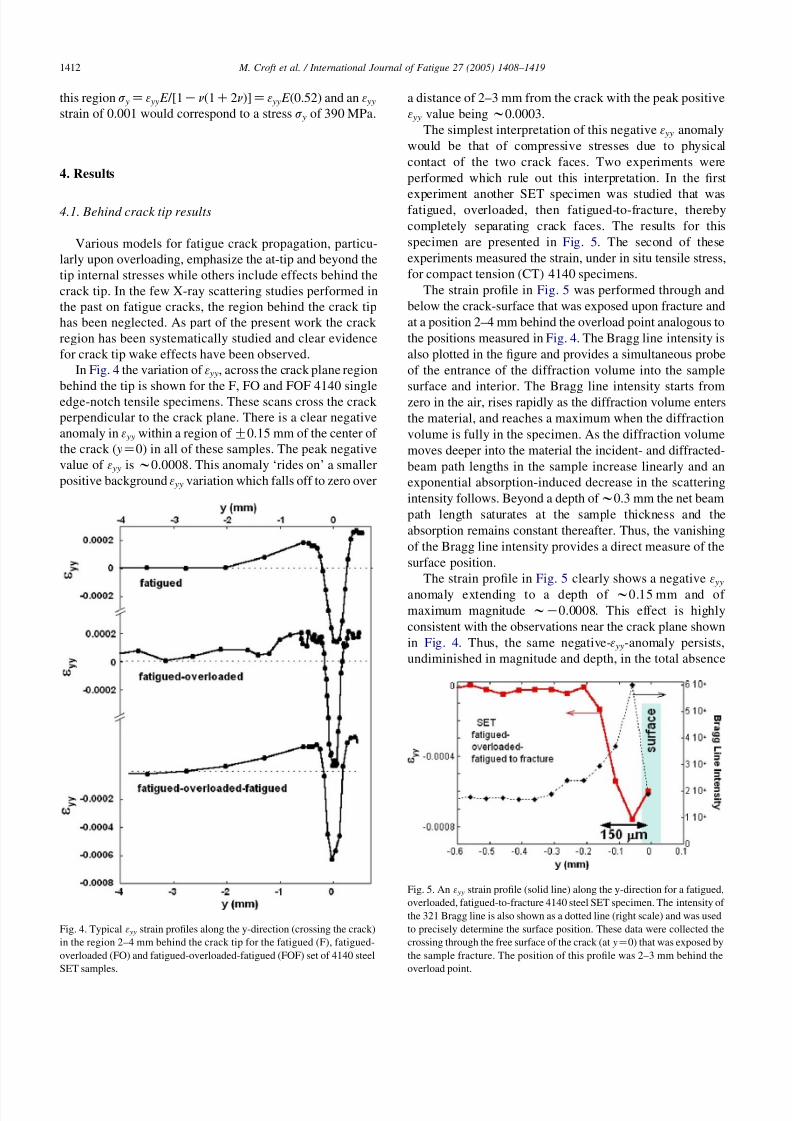
In Fig. 4 the variation of 3 yy, across the crack plane region
behind the tip is shown for the F, FO and FOF 4140 single
edge-notch tensile specimens. These scans cross the crack
perpendicular to the crack plane. There is a clear negative
anomaly in 3 yy within a region of G0.15 mm of the center of
the crack ( yZ0) in all of these samples. The peak negative
value of 3 yy isw0.0008. This anomaly ‘rides on’ a smaller
positive background 3 yy variation which falls off to zero over
a distance of 2–3 mm from the crack with the peak positive
3 yy value beingw0.0003.
The simplest interpretation of this negative 3 yy anomaly
would be that of compressive stresses due to physical
contact of the two crack faces. Two experiments were
performed which rule out this interpretation. In the first
experiment another SET specimen was studied that wasfatigued, overloaded, then fatigued-to-fracture, thereby
completely separating crack faces. The results for this
specimen are presented in Fig. 5. The second of these
experiments measured the strain, under in situ tensile stress,
for compact tension (CT) 4140 specimens.
The strain profile in Fig. 5 was performed through and
below the crack-surface that was exposed upon fracture and
at a position 2–4 mm behind the overload point analogous to
the positions measured in Fig. 4. The Bragg line intensity is
also plotted in the figure and provides a simultaneous probe
of the entrance of the diffraction volume into the sample
surface and interior. The Bragg line intensity starts fromzero in the air, rises rapidly as the diffraction volume enters
the material, and reaches a maximum when the diffraction
volume is fully in the specimen. As the diffraction volume
moves deeper into the material the incident- and diffracted-
beam path lengths in the sample increase linearly and an
exponential absorption-induced decrease in the scattering
intensity follows. Beyond a depth of w0.3 mm the net beam
path length saturates at the sample thickness and the
absorption remains constant thereafter. Thus, the vanishing
of the Bragg line intensity provides a direct measure of the
surface position.
The strain profile in Fig. 5 clearly shows a negative 3 yy
anomaly extending to a depth of w0.15 mm and of
maximum magnitude wK0.0008. This effect is highly
consistent with the observations near the crack plane shown
in Fig. 4. Thus, the same negative-3 yy-anomaly persists,
undiminished in magnitude and depth, in the total absence
Fig. 5. An 3 yy strain profile (solid line) along the y-direction for a fatigued,
overloaded, fatigued-to-fracture 4140 steel SET specimen. The intensity of
the 321 Bragg line is also shown as a dotted line (right scale) and was used
to precisely determine the surface position. These data were collected the
crossing through the free surface of the crack (at yZ0) that was exposed by
the sample fracture. The position of this profile was 2–3 mm behind the
overload point.
Fig. 4. Typical 3 yy strain profiles along the y-direction (crossing the crack)
in the region 2–4 mm behind the crack tip for the fatigued (F), fatigued-
overloaded (FO) and fatigued-overloaded-fatigued (FOF) set of 4140 steel
SET samples.
M. Croft et al. / International Journal of Fatigue 27 (2005) 1408–14191412
7/30/2019 1 Strain Profiling of Fatigue Crack Overload Effects
http://slidepdf.com/reader/full/1-strain-profiling-of-fatigue-crack-overload-effects 6/12
of the other crack face. This clearly rules out crack face
contact as the source of this particular anomaly.
Experiments on 4140 steel compact tension (CT)
specimens in the vicinity of the crack will now be
considered. These results indicate: that the negative 3 yy
anomaly is common near the crack in these second set of
experiments; and that the imposition of an external tensilestress, which separates the crack faces, does not remove the
3 yy anomaly.
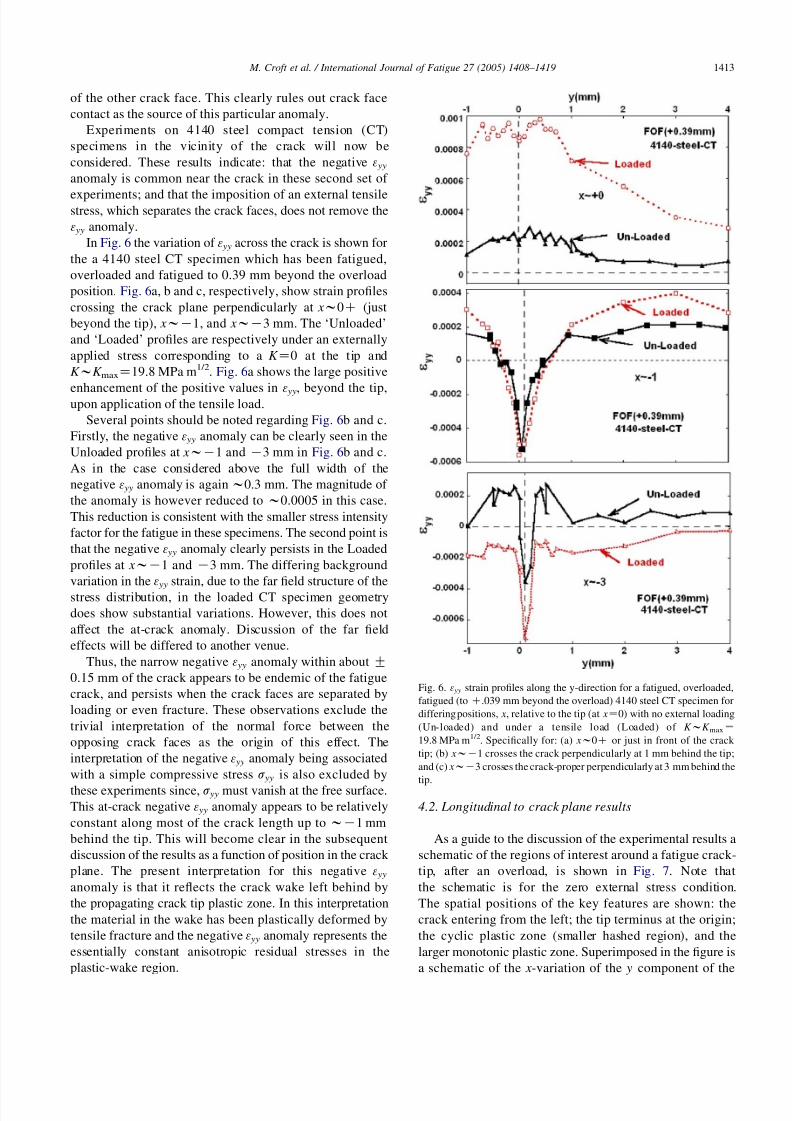
In Fig. 6 the variation of 3 yy across the crack is shown for
the a 4140 steel CT specimen which has been fatigued,
overloaded and fatigued to 0.39 mm beyond the overload
position. Fig. 6a, b and c, respectively, show strain profiles
crossing the crack plane perpendicularly at xw0C (just
beyond the tip), xwK1, and xwK3 mm. The ‘Unloaded’
and ‘Loaded’ profiles are respectively under an externally
applied stress corresponding to a K Z0 at the tip and
K wK maxZ19.8 MPa m1/2. Fig. 6a shows the large positive
enhancement of the positive values in3 yy, beyond the tip,upon application of the tensile load.
Several points should be noted regarding Fig. 6b and c.
Firstly, the negative 3 yy anomaly can be clearly seen in the
Unloaded profiles at xwK1 and K3 mm in Fig. 6b and c.
As in the case considered above the full width of the
negative 3 yy anomaly is againw0.3 mm. The magnitude of
the anomaly is however reduced to w0.0005 in this case.
This reduction is consistent with the smaller stress intensity
factor for the fatigue in these specimens. The second point is
that the negative 3 yy anomaly clearly persists in the Loaded
profiles at xwK1 and K3 mm. The differing background
variation in the 3 yy strain, due to the far field structure of the
stress distribution, in the loaded CT specimen geometry
does show substantial variations. However, this does not
affect the at-crack anomaly. Discussion of the far field
effects will be differed to another venue.
Thus, the narrow negative 3 yy anomaly within about G
0.15 mm of the crack appears to be endemic of the fatigue
crack, and persists when the crack faces are separated by
loading or even fracture. These observations exclude the
trivial interpretation of the normal force between the
opposing crack faces as the origin of this effect. The
interpretation of the negative 3 yy anomaly being associated
with a simple compressive stress s yy is also excluded by
these experiments since, s yy must vanish at the free surface.This at-crack negative 3 yy anomaly appears to be relatively
constant along most of the crack length up to wK1 mm
behind the tip. This will become clear in the subsequent
discussion of the results as a function of position in the crack
plane. The present interpretation for this negative 3 yy
anomaly is that it reflects the crack wake left behind by
the propagating crack tip plastic zone. In this interpretation
the material in the wake has been plastically deformed by
tensile fracture and the negative 3 yy anomaly represents the
essentially constant anisotropic residual stresses in the
plastic-wake region.
4.2. Longitudinal to crack plane results
As a guide to the discussion of the experimental results a
schematic of the regions of interest around a fatigue crack-
tip, after an overload, is shown in Fig. 7. Note that
the schematic is for the zero external stress condition.
The spatial positions of the key features are shown: the
crack entering from the left; the tip terminus at the origin;
the cyclic plastic zone (smaller hashed region), and the
larger monotonic plastic zone. Superimposed in the figure is
a schematic of the x-variation of the y component of the
Fig. 6. 3 yy strain profiles along the y-direction for a fatigued, overloaded,
fatigued (to C.039 mm beyond the overload) 4140 steel CT specimen for
differing positions, x, relative to the tip (at xZ0) with no external loading
(Un-loaded) and under a tensile load (Loaded) of K wK maxZ
19.8 MPa m1/2. Specifically for: (a) xw0C or just in front of the crack
tip; (b) xwK1 crosses the crack perpendicularly at 1 mm behind the tip;
and (c) xwK3 crosses the crack-proper perpendicularly at 3 mm behind the
tip.
M. Croft et al. / International Journal of Fatigue 27 (2005) 1408–1419 1413
7/30/2019 1 Strain Profiling of Fatigue Crack Overload Effects
http://slidepdf.com/reader/full/1-strain-profiling-of-fatigue-crack-overload-effects 7/12
stress in the yZ0, crack plane. Here, it should be noted that
our experimental results are for the y component of the
strain, not the stress, as is usually discussed in such
theoretical treatments. Nevertheless, the utility of this model
for visualizing some of the results will be clear.
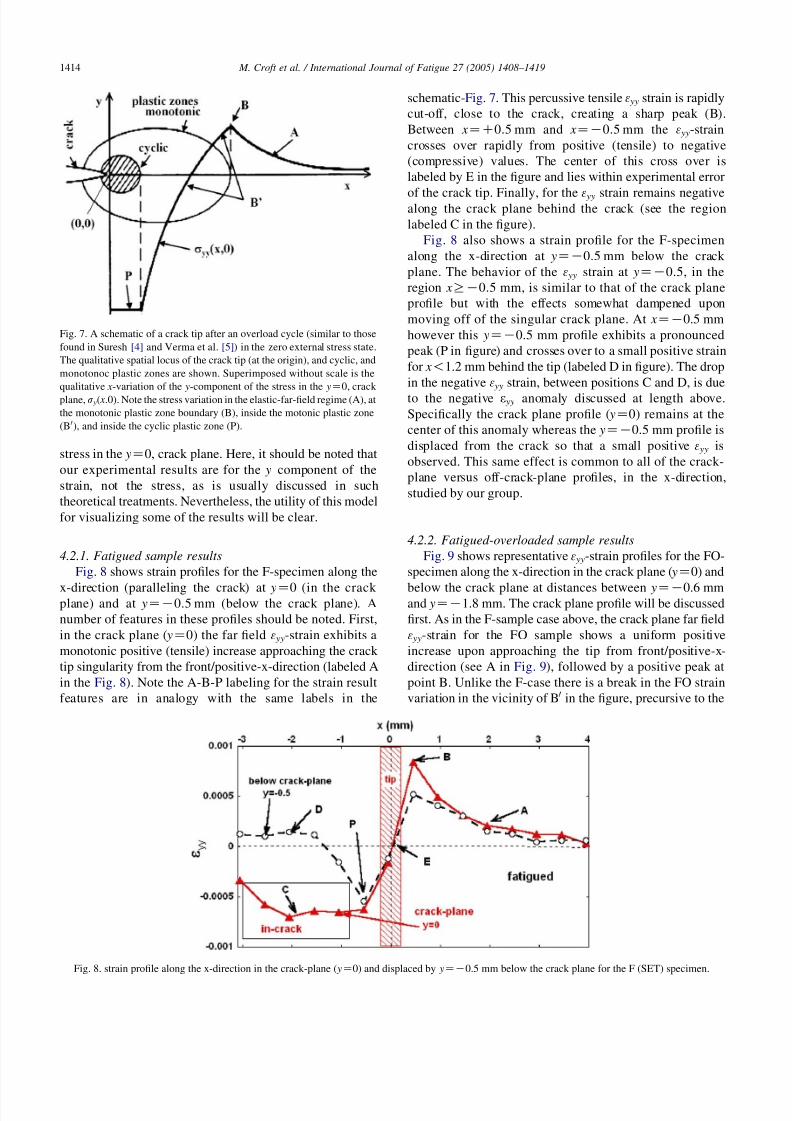
4.2.1. Fatigued sample results
Fig. 8 shows strain profiles for the F-specimen along the
x-direction (paralleling the crack) at yZ0 (in the crack plane) and at yZK0.5 mm (below the crack plane). A
number of features in these profiles should be noted. First,
in the crack plane ( yZ0) the far field 3 yy-strain exhibits a
monotonic positive (tensile) increase approaching the crack
tip singularity from the front/positive-x-direction (labeled A
in the Fig. 8). Note the A-B-P labeling for the strain result
features are in analogy with the same labels in the
schematic-Fig. 7. This percussive tensile 3 yy strain is rapidly
cut-off, close to the crack, creating a sharp peak (B).
Between xZC0.5 mm and xZK0.5 mm the 3 yy-strain
crosses over rapidly from positive (tensile) to negative
(compressive) values. The center of this cross over is
labeled by E in the figure and lies within experimental error
of the crack tip. Finally, for the 3 yy strain remains negativealong the crack plane behind the crack (see the region
labeled C in the figure).
Fig. 8 also shows a strain profile for the F-specimen
along the x-direction at yZK0.5 mm below the crack
plane. The behavior of the 3 yy strain at yZK0.5, in the
region xRK0.5 mm, is similar to that of the crack plane
profile but with the effects somewhat dampened upon
moving off of the singular crack plane. At xZK0.5 mm
however this yZK0.5 mm profile exhibits a pronounced
peak (P in figure) and crosses over to a small positive strain
for x!1.2 mm behind the tip (labeled D in figure). The drop
in the negative 3 yy strain, between positions C and D, is due
to the negative 3 yy anomaly discussed at length above.
Specifically the crack plane profile ( yZ0) remains at the
center of this anomaly whereas the yZK0.5 mm profile is
displaced from the crack so that a small positive 3 yy is
observed. This same effect is common to all of the crack-
plane versus off-crack-plane profiles, in the x-direction,
studied by our group.
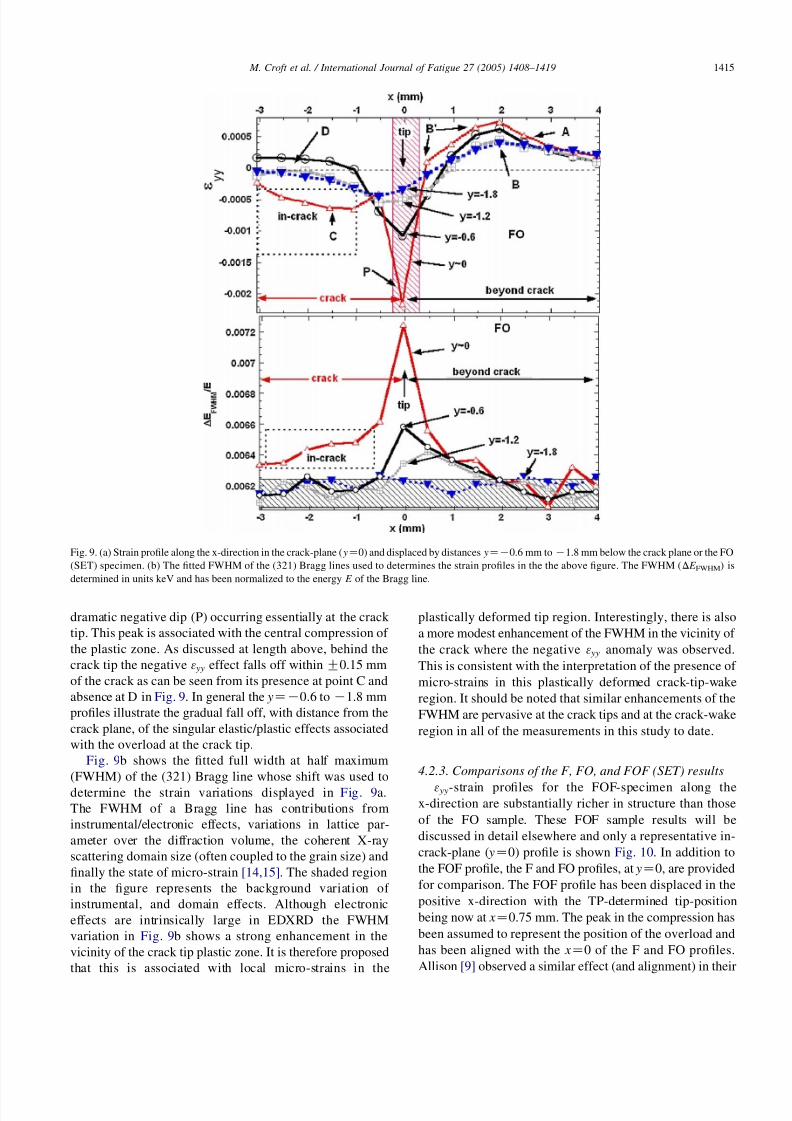
4.2.2. Fatigued-overloaded sample results
Fig. 9 shows representative 3 yy-strain profiles for the FO-
specimen along the x-direction in the crack plane ( yZ0) and
below the crack plane at distances between yZK0.6 mmand yZK1.8 mm. The crack plane profile will be discussed
first. As in the F-sample case above, the crack plane far field
3 yy-strain for the FO sample shows a uniform positive
increase upon approaching the tip from front/positive-x-
direction (see A in Fig. 9), followed by a positive peak at
point B. Unlike the F-case there is a break in the FO strain
variation in the vicinity of B 0 in the figure, precursive to the
Fig. 8. strain profile along the x-direction in the crack-plane ( yZ0) and displaced by yZK0.5 mm below the crack plane for the F (SET) specimen.
Fig. 7. A schematic of a crack tip after an overload cycle (similar to those
found in Suresh [4] and Verma et al. [5]) in the zero external stress state.
The qualitative spatial locus of the crack tip (at the origin), and cyclic, and
monotonoc plastic zones are shown. Superimposed without scale is the
qualitative x-variation of the y-component of the stress in the yZ0, crack
plane, s y( x.0). Note the stress variation in the elastic-far-field regime (A), at
the monotonic plastic zone boundary (B), inside the motonic plastic zone
(B0), and inside the cyclic plastic zone (P).
M. Croft et al. / International Journal of Fatigue 27 (2005) 1408–14191414
7/30/2019 1 Strain Profiling of Fatigue Crack Overload Effects
http://slidepdf.com/reader/full/1-strain-profiling-of-fatigue-crack-overload-effects 8/12
dramatic negative dip (P) occurring essentially at the crack
tip. This peak is associated with the central compression of
the plastic zone. As discussed at length above, behind the
crack tip the negative 3 yy effect falls off within G0.15 mm
of the crack as can be seen from its presence at point C and
absence at D in Fig. 9. In general the yZK0.6 toK1.8 mm
profiles illustrate the gradual fall off, with distance from the
crack plane, of the singular elastic/plastic effects associated
with the overload at the crack tip.
Fig. 9b shows the fitted full width at half maximum
(FWHM) of the (321) Bragg line whose shift was used to
determine the strain variations displayed in Fig. 9a.
The FWHM of a Bragg line has contributions from
instrumental/electronic effects, variations in lattice par-
ameter over the diffraction volume, the coherent X-ray
scattering domain size (often coupled to the grain size) and
finally the state of micro-strain [14,15]. The shaded region
in the figure represents the background variation of
instrumental, and domain effects. Although electronic
effects are intrinsically large in EDXRD the FWHM
variation in Fig. 9b shows a strong enhancement in the
vicinity of the crack tip plastic zone. It is therefore proposed
that this is associated with local micro-strains in the
plastically deformed tip region. Interestingly, there is also
a more modest enhancement of the FWHM in the vicinity of
the crack where the negative 3 yy anomaly was observed.
This is consistent with the interpretation of the presence of
micro-strains in this plastically deformed crack-tip-wake
region. It should be noted that similar enhancements of the
FWHM are pervasive at the crack tips and at the crack-wake
region in all of the measurements in this study to date.
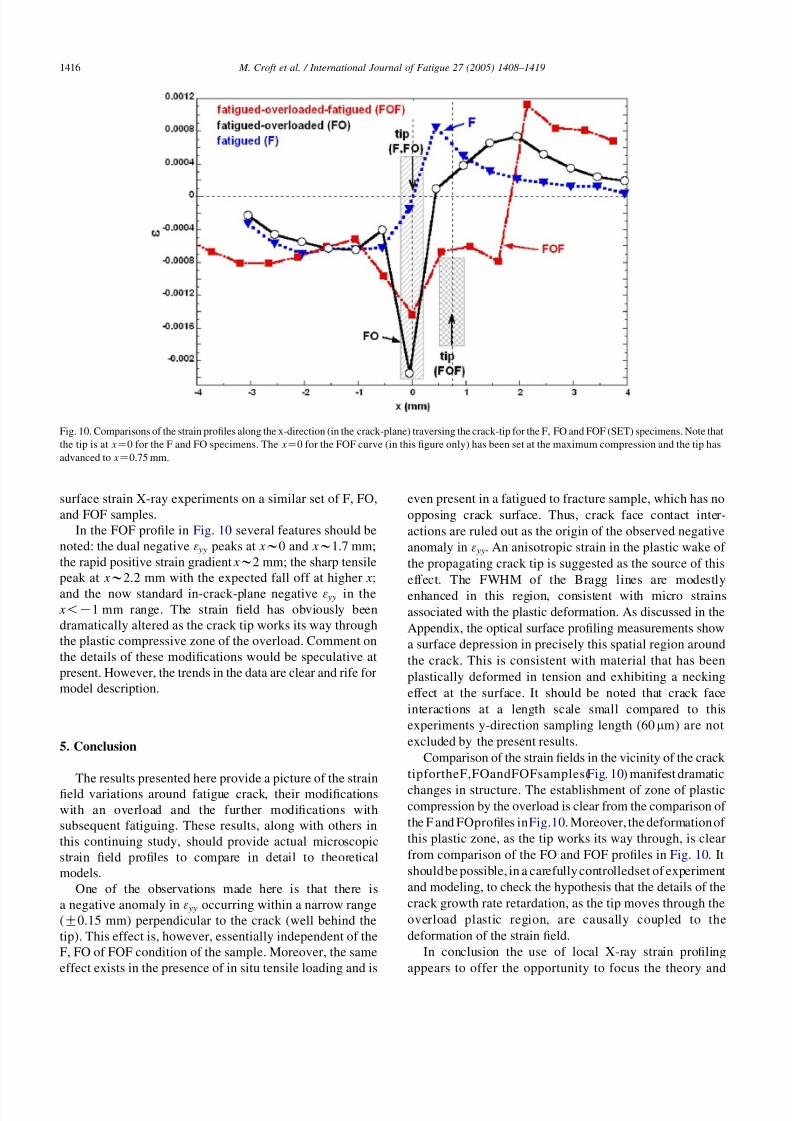
4.2.3. Comparisons of the F, FO, and FOF (SET) results
3 yy-strain profiles for the FOF-specimen along thex-direction are substantially richer in structure than those
of the FO sample. These FOF sample results will be
discussed in detail elsewhere and only a representative in-
crack-plane ( yZ0) profile is shown Fig. 10. In addition to
the FOF profile, the F and FO profiles, at yZ0, are provided
for comparison. The FOF profile has been displaced in the
positive x-direction with the TP-determined tip-position
being now at xZ0.75 mm. The peak in the compression has
been assumed to represent the position of the overload and
has been aligned with the xZ0 of the F and FO profiles.
Allison [9] observed a similar effect (and alignment) in their
Fig. 9. (a) Strain profile along the x-direction in the crack-plane ( yZ0) and displaced by distances yZK0.6 mm toK1.8 mm below the crack plane or the FO
(SET) specimen. (b) The fitted FWHM of the (321) Bragg lines used to determines the strain profiles in the the above figure. The FWHM (DE FWHM) is
determined in units keV and has been normalized to the energy E of the Bragg line.
M. Croft et al. / International Journal of Fatigue 27 (2005) 1408–1419 1415
7/30/2019 1 Strain Profiling of Fatigue Crack Overload Effects
http://slidepdf.com/reader/full/1-strain-profiling-of-fatigue-crack-overload-effects 9/12
surface strain X-ray experiments on a similar set of F, FO,
and FOF samples.
In the FOF profile in Fig. 10 several features should be
noted: the dual negative 3 yy peaks at xw0 and xw1.7 mm;
the rapid positive strain gradient xw2 mm; the sharp tensile
peak at xw2.2 mm with the expected fall off at higher x;
and the now standard in-crack-plane negative 3 yy in the x!K1 mm range. The strain field has obviously been
dramatically altered as the crack tip works its way through
the plastic compressive zone of the overload. Comment on
the details of these modifications would be speculative at
present. However, the trends in the data are clear and rife for
model description.
5. Conclusion
The results presented here provide a picture of the strain
field variations around fatigue crack, their modifications
with an overload and the further modifications with
subsequent fatiguing. These results, along with others in
this continuing study, should provide actual microscopic
strain field profiles to compare in detail to theoretical
models.
One of the observations made here is that there is
a negative anomaly in 3 yy occurring within a narrow range
(G0.15 mm) perpendicular to the crack (well behind the
tip). This effect is, however, essentially independent of the
F, FO of FOF condition of the sample. Moreover, the same
effect exists in the presence of in situ tensile loading and is
even present in a fatigued to fracture sample, which has no
opposing crack surface. Thus, crack face contact inter-
actions are ruled out as the origin of the observed negative
anomaly in 3 yy. An anisotropic strain in the plastic wake of
the propagating crack tip is suggested as the source of this
effect. The FWHM of the Bragg lines are modestly
enhanced in this region, consistent with micro strains
associated with the plastic deformation. As discussed in the
Appendix, the optical surface profiling measurements show
a surface depression in precisely this spatial region around
the crack. This is consistent with material that has been
plastically deformed in tension and exhibiting a necking
effect at the surface. It should be noted that crack face
interactions at a length scale small compared to this
experiments y-direction sampling length (60 mm) are not
excluded by the present results.
Comparison of the strain fields in the vicinity of the crack
tipfortheF,FOandFOFsamples(Fig. 10) manifest dramatic
changes in structure. The establishment of zone of plasticcompression by the overload is clear from the comparison of
the F and FOprofiles in Fig.10. Moreover, the deformation of
this plastic zone, as the tip works its way through, is clear
from comparison of the FO and FOF profiles in Fig. 10. It
should be possible, in a carefully controlledset of experiment
and modeling, to check the hypothesis that the details of the
crack growth rate retardation, as the tip moves through the
overload plastic region, are causally coupled to the
deformation of the strain field.
In conclusion the use of local X-ray strain profiling
appears to offer the opportunity to focus the theory and
Fig. 10. Comparisons of the strain profiles along the x-direction (in the crack-plane) traversing the crack-tip for the F, FO and FOF (SET) specimens. Note that
the tip is at xZ0 for the F and FO specimens. The xZ0 for the FOF curve (in this figure only) has been set at the maximum compression and the tip has
advanced to xZ0.75 mm.
M. Croft et al. / International Journal of Fatigue 27 (2005) 1408–14191416
7/30/2019 1 Strain Profiling of Fatigue Crack Overload Effects
http://slidepdf.com/reader/full/1-strain-profiling-of-fatigue-crack-overload-effects 10/12
modeling of the processes involved on the local measurable
strain fields. The flexibility of parameter choices should be
greatly constrained in this process and precise regions of
interest identified and explored to even smaller length scale
if necessary.
Acknowledgements
We gratefully acknowledge the support of the Office of
Naval Research (ONR) under Contract No. N00014-04-1-
0194 and also DURIP ONR N00014-02-1-0772. Utilization
of the NSLS was supported by US Department of Energy
contract DE-AC02-76CH00016. The authors wish to
express their gratitude to: Dr. A.K. Vasudevan for a
suggesting this materials problem and for a wealth of
advice on the course of these studies. The authors would
also like to acknowledge detailed conversations with
G. Glinka and D. Kujawski on this work. The authorswish to gratefully acknowledge the Zygo Corp. for the use
of their optical profiling equipment and technical support. In
particular we would like to thank Stan Bialecki of Zygo
Corp., whose tireless efforts made the optical measurements
possible.
Appendix. Optical surface height profiling
The studies discussed here involve fatigued and/or
cracked test specimens which intrinsically exhibit spatially
localized regions of interest. Visual or photographicobservation of theses specimens typically shows a visible
surface crack region and a dimple at the point of overload.
To quantitatively address the question of the surface
deformation that gives rise to the visible features, optical
surface height profiling measurements have been per-
formed. These measurements were performed in collabor-
ation with Zygo Inc., in Connecticut using their
New-View5000 and their technical staff. Only typicalexamples of these results are presented here. Such surface
measurements can provide both a guide for the spatial
regions of interest for the exacting X-ray measurements at
the synchrotron and can be correlated with the X-ray strain
results.
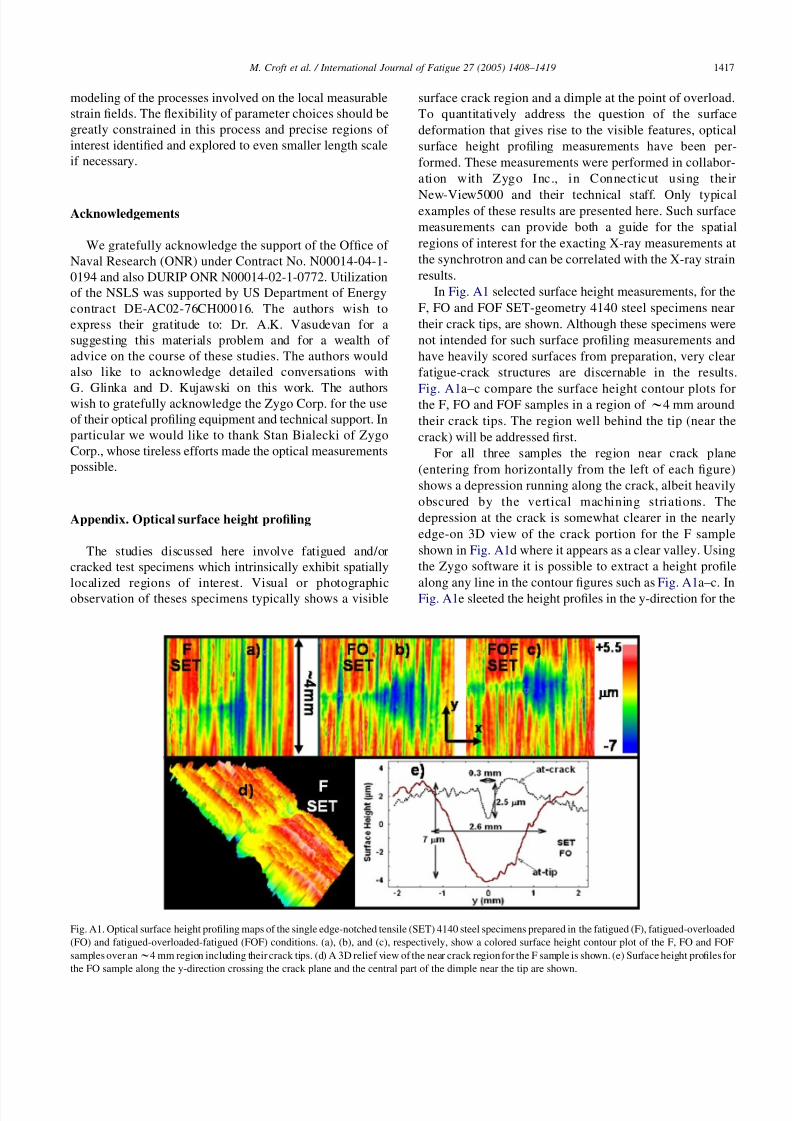
In Fig. A1 selected surface height measurements, for the
F, FO and FOF SET-geometry 4140 steel specimens near
their crack tips, are shown. Although these specimens were
not intended for such surface profiling measurements and
have heavily scored surfaces from preparation, very clear
fatigue-crack structures are discernable in the results.
Fig. A1a–c compare the surface height contour plots forthe F, FO and FOF samples in a region of w4 mm around
their crack tips. The region well behind the tip (near the
crack) will be addressed first.
For all three samples the region near crack plane
(entering from horizontally from the left of each figure)
shows a depression running along the crack, albeit heavily
obscured by the vertical machining striations. The
depression at the crack is somewhat clearer in the nearly
edge-on 3D view of the crack portion for the F sample
shown in Fig. A1d where it appears as a clear valley. Using
the Zygo software it is possible to extract a height profile
along any line in the contour figures such as Fig. A1a–c. InFig. A1e sleeted the height profiles in the y-direction for the
Fig. A1. Optical surface height profiling maps of the single edge-notched tensile (SET) 4140 steel specimens prepared in the fatigued (F), fatigued-overloaded
(FO) and fatigued-overloaded-fatigued (FOF) conditions. (a), (b), and (c), respectively, show a colored surface height contour plot of the F, FO and FOF
samples over anw4 mm region including their crack tips. (d) A 3D relief view of the near crack region for the F sample is shown. (e) Surface height profiles for
the FO sample along the y-direction crossing the crack plane and the central part of the dimple near the tip are shown.
M. Croft et al. / International Journal of Fatigue 27 (2005) 1408–1419 1417
7/30/2019 1 Strain Profiling of Fatigue Crack Overload Effects
http://slidepdf.com/reader/full/1-strain-profiling-of-fatigue-crack-overload-effects 11/12
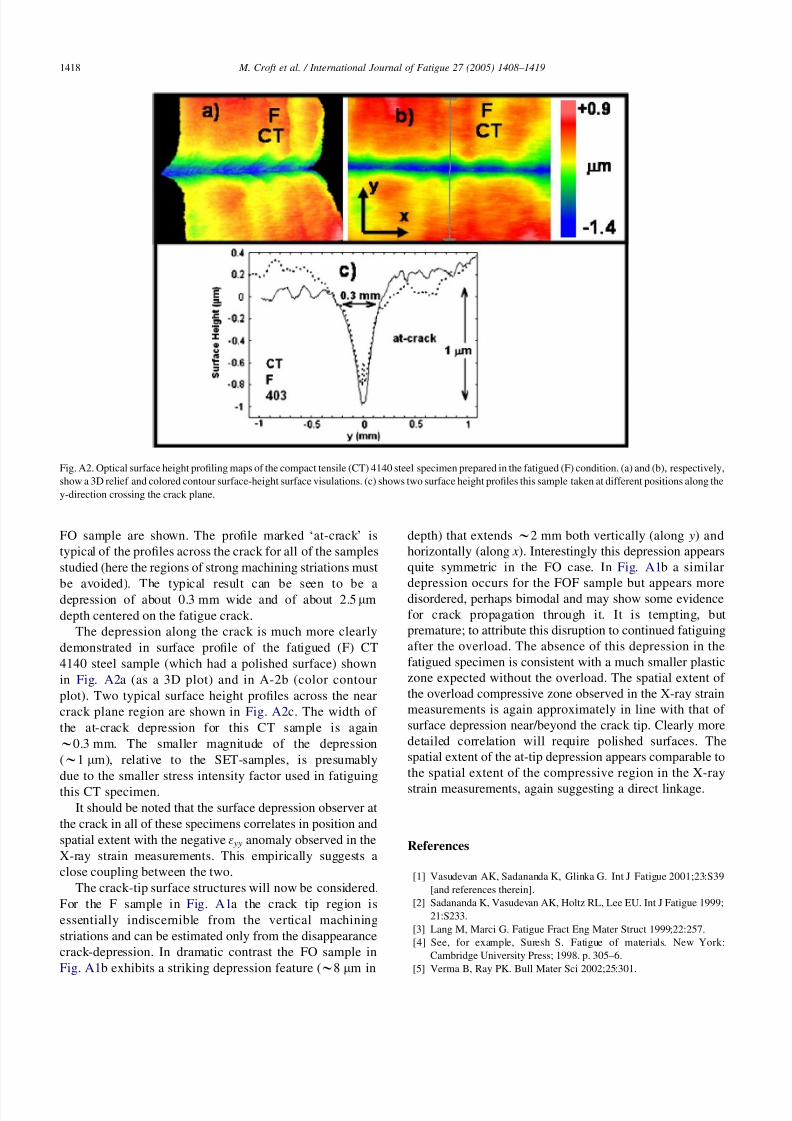
FO sample are shown. The profile marked ‘at-crack’ is
typical of the profiles across the crack for all of the samples
studied (here the regions of strong machining striations must
be avoided). The typical result can be seen to be adepression of about 0.3 mm wide and of about 2.5 mm
depth centered on the fatigue crack.
The depression along the crack is much more clearly
demonstrated in surface profile of the fatigued (F) CT
4140 steel sample (which had a polished surface) shown
in Fig. A2a (as a 3D plot) and in A-2b (color contour
plot). Two typical surface height profiles across the near
crack plane region are shown in Fig. A2c. The width of
the at-crack depression for this CT sample is again
w0.3 mm. The smaller magnitude of the depression
(w1 mm), relative to the SET-samples, is presumably
due to the smaller stress intensity factor used in fatiguing
this CT specimen.
It should be noted that the surface depression observer at
the crack in all of these specimens correlates in position and
spatial extent with the negative 3 yy anomaly observed in the
X-ray strain measurements. This empirically suggests a
close coupling between the two.
The crack-tip surface structures will now be considered.
For the F sample in Fig. A1a the crack tip region is
essentially indiscernible from the vertical machining
striations and can be estimated only from the disappearance
crack-depression. In dramatic contrast the FO sample in
Fig. A1b exhibits a striking depression feature (w8 mm in
depth) that extends w2 mm both vertically (along y) and
horizontally (along x). Interestingly this depression appears
quite symmetric in the FO case. In Fig. A1b a similar
depression occurs for the FOF sample but appears moredisordered, perhaps bimodal and may show some evidence
for crack propagation through it. It is tempting, but
premature; to attribute this disruption to continued fatiguing
after the overload. The absence of this depression in the
fatigued specimen is consistent with a much smaller plastic
zone expected without the overload. The spatial extent of
the overload compressive zone observed in the X-ray strain
measurements is again approximately in line with that of
surface depression near/beyond the crack tip. Clearly more
detailed correlation will require polished surfaces. The
spatial extent of the at-tip depression appears comparable to
the spatial extent of the compressive region in the X-ray
strain measurements, again suggesting a direct linkage.
References
[1] Vasudevan AK, Sadananda K, Glinka G. Int J Fatigue 2001;23:S39
[and references therein].
[2] Sadananda K, Vasudevan AK, Holtz RL, Lee EU. Int J Fatigue 1999;
21:S233.
[3] Lang M, Marci G. Fatigue Fract Eng Mater Struct 1999;22:257.
[4] See, for example, Suresh S. Fatigue of materials. New York:
Cambridge University Press; 1998. p. 305–6.
[5] Verma B, Ray PK. Bull Mater Sci 2002;25:301.
Fig. A2. Optical surface height profiling maps of the compact tensile (CT) 4140 steel specimen prepared in the fatigued (F) condition. (a) and (b), respectively,
show a 3D relief and colored contour surface-height surface visulations. (c) shows two surface height profiles this sample taken at different positions along the
y-direction crossing the crack plane.
M. Croft et al. / International Journal of Fatigue 27 (2005) 1408–14191418

7/30/2019 1 Strain Profiling of Fatigue Crack Overload Effects
http://slidepdf.com/reader/full/1-strain-profiling-of-fatigue-crack-overload-effects 12/12
[6] Croft M, Zakharchenko I, Zhong Z, Gulak Y, Hastings J, Hu J, et al.
J Appl Phys 2002;92:578 [and references therein].
[7] Prime M. Appl Mech Rev 1999;52 [and references therein].
[8] Withers P, Bhadeshia H. Mater Sci Technol 2001;17 [and references
therein].
[9] Allison JE. Fracture mechanics. In: Smith CW, editor. ASTM STP
677. Amercian Society for Testing and Materials; 1979. p. 550–62.
[10] Wang H, Buchholz F-G, Richard HA, Jaag S, Scholtes B. Comput
Mater Sci 1999;16:104.
[11] Ramos M, Pereira M, Dawish F, Motta S, Carneir M. Fatigue Fract
Eng Mater Struct 2003;26:115.
[12] James M, Hattingh D, Hughes D, Wei L-W, Patterson E,
Quinta Da Fonseca J. Fatigue Fract Eng Mater Struct 2004;27:
609.
[13] Reimers W, Broda M, Brusch G, Damtz D, Liss K, Pyzalla A, et al.
J Nondestr Eval 1998;17:129.
[14] Gerward L, Morup S, Topsoe H. J Appl Phys 1976;47:822.
[15] Otto JW. J Appl Cryst 1997;30:1008.
M. Croft et al. / International Journal of Fatigue 27 (2005) 1408–1419 1419