Embed Size (px)
Citation preview

1
State and trends of the carbon market
Updated September 20, 2001
Franck Lecocq – DECRG / PCFplus Research

2
Early stage of the carbon market 1997-2001

3
Greenhouse gases emission reductions an unusual commodity
• ERs become a commodity after certification.
• Before certification ERs are very heterogeneous depending on the plausibility of their baseline.
Emission Reduction=
Hypothetical baseline emissions - effective emissions

4
$0t/Co2
$1t/Co2
$2t/Co2
$3t/Co2
$4t/Co2
$5t/Co2
$6t/Co2
$7t/Co2
$8t/Co2
$9t/Co2
$0/tC
$5/tC
$10/tC
$15/tC
$20/tC
$25/tC
Optionss
Non verified ERs
Third-Party Verified
CDM
Government approved permits
Carbon prices on past transactions

5
Motivations of early participantsSellers• a new source of revenue.
Buyers• Belief that ultimately there will be constraints on GHG
emissions• Hedge against those compliance costs
Buyers (large utilities, oil companies) also want to
• Learn about the market
• Strategic positioning

6
Early developments of the market 1997 to 2001
• Partial information available.• Within OECD and EITs: 40-60 MtCO2e have been
transacted.• In developing countries: Less activity but
growing. Mostly government funded, but private activity growing.
• General trend towards sophistication: buyers clubs (PCF), traders, financial derivatives (options), integrated marketplaces, etc.

7
Which future for the carbon market?

8
Two storylines
Kyoto or Kyoto “light”
• Kyoto is the existing framework, but its future is uncertain.
• One possible outcome is Kyoto without the US.
No agreement, at least for the next few years
• Does it mean the market will collapse?
>

9
The Kyoto Protocol (1997)
• The Kyoto Protocol assigns greenhouse gases emission targets to Annex B countries between 2008 and 2012…
• …And defines three flexibility mechanisms to take profit of differences in marginal abatement costs:– Emission Trading– Joint Implementation– Clean Development Mechanism
10
Demand and supply under Kyoto scenarios
Total Annex Bdemand for ERs
Domestic carbon sinks
Hot Air financial flow to Russia and EE
Action within OECDRemainder Russia and EE (trading and JI)
Developing countries (CDM)

11
Volumes with “full” Kyoto
Gross annual demand for ERs 2800 – 4800 MtCO2ebetween 2008 and 2012
- Credits for hot air 950 – 2150
- Credits for Annex B Sinks 400 – 800 (?)
= Net demand 0 – 3000 MtCO2e(assuming large Annex B sinks)

12
Volumes in Kyoto w/o the US
Gross annual demand for ERs 1400 – 2400 MtCO2ebetween 2008 and 2012
- Credits for hot air 950 – 2150
- Credits for Annex B Sinks 100 – 400
= Net demand 0 – 1700 MtCO2e(assuming limited Annex B sinks)

13
Prices
• Very difficult to anticipate (uncertainties on abatement costs and rules governing mechanisms).
• Running CERT with the preceding volume assumptions yields prices in the range of:– $0 - $10/ tCO2e for “full” Kyoto.
– $0 - $2 / tCO2e w/o the US.

14
Consequences for Economies in Transition and non-Annex B countries
Economies in Transition:Key element = hot air
Net benefit of about $5b per year [2.9-6.3] at $3/tCO2e.
Developing countries:Model shows $2b – $4b transfers per year.
But the demand for CDM is more uncertain. In particular, there is a very low demand for CDM if Kyoto w/o US.
15
Two storylines
Kyoto or Kyoto “light”
• Kyoto is the existing framework, but its future is uncertain.
• One possible outcome is Kyoto without the US.
No agreement, at least for the next few years
• Does it mean the market will collapse?
>

16
Is Kyoto still relevant?Emerging market drivers
• Regulations constraining carbon emissions are being developed– National policies (UK, The Netherlands, etc.)– Subnational regulations (e.g. some US States)– Regional initiatives (EU-wide trading)
• Some firms are taking voluntary emission commitments (BP, Shell, Dupont, etc.)

17
Current or projected national policies
Trading? Start-up Project-based mechanism?EU Yes 2005 At least from 2008UK Yes . 2001 YesFrance Yes 2003? YesNorway Yes 2005 or earlier YesGermany No LaterDenmark Yes 2001 YesSweden Yes 2005 or later YesNetherlands Ongoing work YesFinland Ongoing work YesIreland Ongoing work Ongoing workAustralia Yes US dependent YesUSA Yes ? YesCanada Yes US dependent Japan Ongoing work YesNew Zealand Yes Not decided YesRussia No Yes`

18
Regional regulations in the US
• Oregon: CO2 emissions standard for new energy utilities. Price cap: $0.57/tCo2. Utilities can offset emissions using project based mechanisms.
• Washington: New plants must demonstrate the use of best available techniques for CO2 emissions control.
• Massachusetts: CO2 emissions cap for energy utilities effective in 2005. Utilities can offset excess emissions using project-based mechanisms.
• Near future: New York?

19
Voluntary corporate commitments
• Rapid survey indicates 52 major companies representing1 billion tCO2e emissions in 1999 have pledged to reduce GHG emissions by 2010.
• Resulting demand depends on the baseline. If we set baseline at 1999 emissions, we obtain a total demand of 500 MtCO2e over the next decade.
• At least eight have said they would use project based mechanisms.

20
Alcoa -- 25% below 1990 in 2010BP Amoco 79.8 Cumulative 2%/year below 1990 Chubu EPCo. 51.3 0.410 kgCo2/kWh in 2005Dupont 44.4 65% below 1990 in 2010Kodak -- 20% below 1990 in 2004Fortum 9 0.5 MtCo2e below baseline in 2010 IBM 4.1 Cumulative 4%/year below 1998 until 2004
Intel 3.3 10% below 1995 in 2010 (PFCs) Johns. & John, 1.5 7% below 1990 in 2010Motorola -- 50% below 1995 in 2010 (PFCs)Ontario Pow.Gen. 26 6% below 1990 in 2010
PEMEX 177 -1% per year until 2010 Shell 99 103 MtCo2e in 2002 Statoil 8.3 1.5 MtCo2e below baseline in 2010 Suncor 5 -1.5%/year until 2002 (-1%/year for 2003-2008) Transalta 38.5 -----
1999 Emissions Commitment Internal Trading
CDM/JI
Corporate voluntary commitments

21
In addition, Canada and Australia have voluntary ER programs with very good coverage of key emitting sectors.
22
Chicago Climate Exchange
• 25 Midwestern firms will agree on emission targets by the end of 2001 and start trading in 2002.
• -2% below 1998 level in 2002, additional –1% period year between 2003 and 2005.
• Allows for offsets through project-based mechanisms.
23
Emerging carbon funds
Prototype Carbon Fund +…• About 5 private sector funds to capture JI/CDM
Carbon credits in all investments.• Handful of private equity funds also seeking carbon
credit investors to raise IRR in deals.• Major forestry funds thinking about C credits.• New energy private equity and mutual funds might
seek C credit deals if demand rises.• Social funds use C as screening indicator.

24
Conclusion
• The carbon market exists, and is developing rapidly.
• It is likely to keep growing up even if Kyoto fails (the question will then be to coordinate the emerging regulations and initiatives).
• It brings opportunities for EITs and non-Annex B countries

25
Annex B countries
>

26
2008-2012 GHG Emission targets (100 = 1990)
Australia 108Austria92 (87)Belgium 92 (92.5)Bulgaria 92Canada94Croatia95Czech Republic 92Denmark 92 (79)Estonia92Finland92 (100)France92 (100)Germany 92 (79)Greece92 (125)
Hungary 94Iceland110Ireland92 (113)Italy 92 (93.5)Japan 94Latvia92Liechtenstein 92Lithuania 92Luxembourg92 (72)Monaco 92Netherlands92 (94)New Zealand 100Norway 101
Poland 94
Portugal 92 (127)Romania 92Russian Federation 100Slovakia 92Slovenia 92Spain 92 (115)Sweden 92 (104)Switzerland 92
Ukraine 100UK 92 (94)
USA 93

27
Discussion on the prices we obtain for Kyoto scenarios
There are higher price estimates in the literature.The difference stems from:• Higher sinks• Volume of hot air has been revised upwards• We assume a smooth market (e.g. limited
transaction costs, full hot air accessibility)• We only use a limited set of projections about
abatement costs.>

28
The Netherlands
• Government funded Emission Reduction Unit Procurement Tender (ERU-PT).
• Buys ERs in Eastern Europe
• 2000 tender (completed): $19 M
• Average price for first tender: $7/tCO2e
• Next tender expected in October, 2001
>

29
United Kingdom
• Climate Change Levy (April 2001)– Tax on energy use– Rebates in exchange for voluntary commitments– Benefits recycled in other corporate tax rebates
• Emission Trading (end of 2001)– Concerns selected companies, on a voluntary basis– Projects outside UK are considered for 2002.
>

30
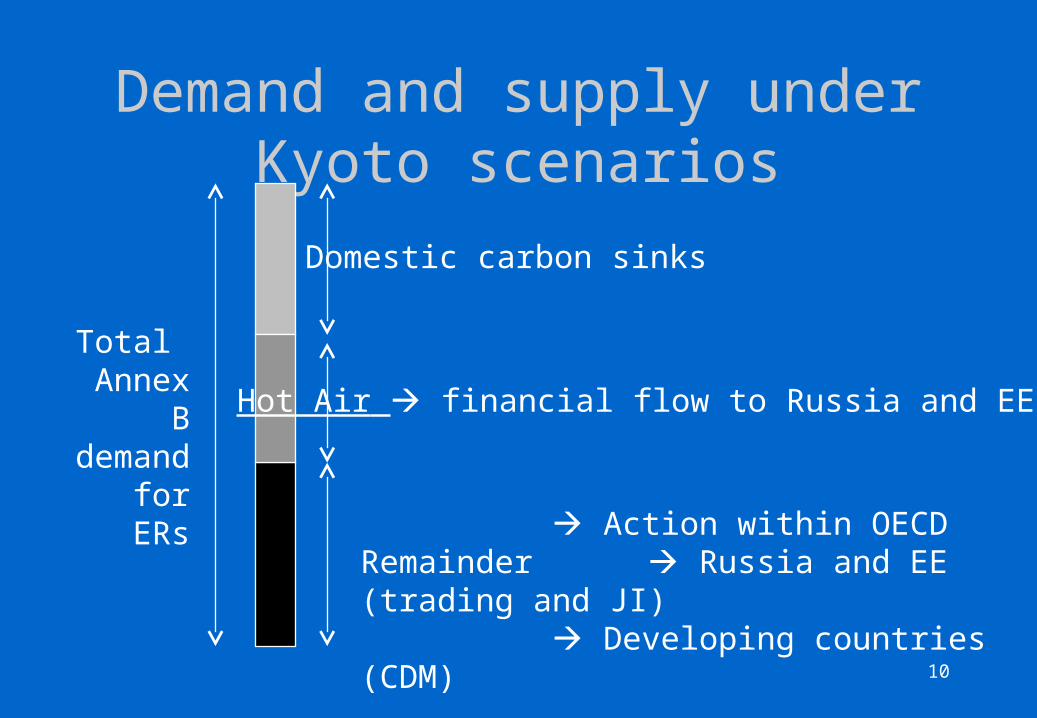
Hot Air
800
900
1000
1100
1200
1300
1400
1500
1990 1992 1994 1996 1998 2000 2002 2004 2006 2008 2010 2012
An
nu
al G
HG
em
iss
ion
s (
MtC
e)
Emission target
hot air
>