Embed Size (px)
Citation preview

1
Software Quality Metrics
Ch 4 in Kan
Steve Chenoweth, RHIT
What do you measure?

2
How do we know if it’s “quality”?
• Mean time to failure• Defect density• Customer problems• Customer satisfaction
Do you see “quality” here?

3
ANSI 982.2
• An error is a human mistake that results in incorrect software.
• The resulting fault is an accidental condition that causes a unit of the system to fail to function as required.
• A defect is an anomaly in a product.• A failure occurs when a functional unit of a
software-related system can no longer perform its required function or cannot perform within its specified limits.

4
Can we compare?
• Defect rate for product 1 vs defect rate for product 2?
• Need to “operationalize” the two numbers:– How many “opportunities for error” (OPEs) during
a specified time?– Often have to compare “failures” instead– Infer defects– Time frames need to be similar –• Lots more defects right after release

5
Can we even compare LOC?
• Are LOC like IQ points – people use them just because they are handy?
• Does coding style count, etc.?• “Everyone knows that debugging is twice as
hard as writing a program in the first place. So if you are as clever as you can be when you write it, how will you ever debug it?”
―Brian Kernighan

6
How about this question?
• In a next release of a product, what do you count?– All lines shipped to each customer?– Just the lines changed?– Something in-between?
“ A whole nuther way” to consider what counts…

7
The customer doesn’t care!
• They want a decreasing defect rate, over time.• They’ll get spoiled by a good release that had
little new stuff in it.

8
How about function points?
• Another way to consider “opportunities for error” (OPEs).
• Uses a weighted total of 5 major components:– Number of external inputs x 4– Number of external outputs x 5– Number of internal files x 10– Number of external interface files x 7– Number of external inquiries x 4

9
Problems per user-month (PUM)
• Problems reported / total license-months• Usually measured after release

10
Customer Satisfaction Metrics
• Often a 5-point scale:• Can be overall, or• For specific qualities.• HP uses “FURPS”:– Functionality– Usability– Reliability– Performance– Service

11
Customer Sat
• Can be expressed to the customer as a question, in different ways:
• Completely satisfied?• Satisfied?• Dissatisfied?• Neutral or worse?
Most commonly asked for

12
Relative scope of the 3 metrics
• These are subset relationships
13
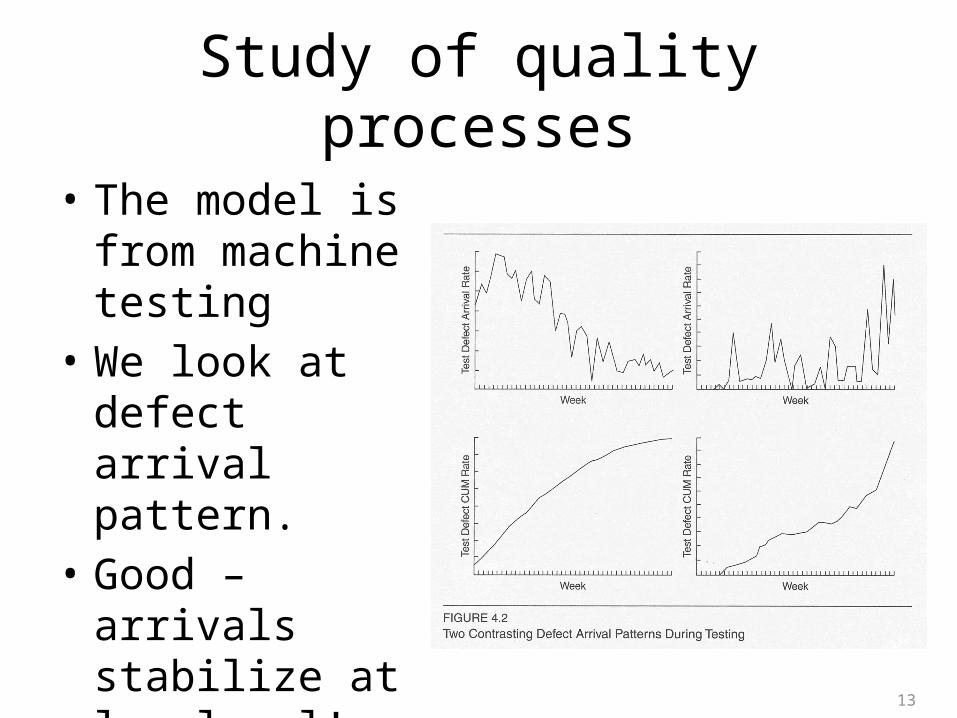
Study of quality processes
• The model is from machine testing
• We look at defect arrival pattern.
• Good – arrivals stabilize at low level!

14
In software, can track in all phases
• Moving from phase to phase, this also yields defect removal rates.
• Which of these patterns is better?

15
Looking at it in a good way…
• “Phase effectiveness”• Tall bars = low number of defects escaped

16
Maintenance – worth measuring
• Typical metrics looked at carefully:– Fix backlog and backlog management index– Fix response time and fix responsiveness– Percent delinquent fixes– Fix quality

17
Fix backlog
• Open versus closed problems• Backlog management index by month

18
Fix response time / responsiveness
• Mean time of all problems from open to closed
• Believed short response times customer satisfaction
• Closely related – percent “delinquent” fixes

19
Fix quality
• Number of defective fixes:– Didn’t fix the
reported problem, or
– Fixed it but injected a new defect.

20
Company “metrics programs”
• Ok, we all have different ones!• Motorola, for example:– Includes “SEA” – Schedule Estimation Accuracy– Etc.
• HP:– Average fixed defects/working day– Etc.
• IBM Rochester:– Fix response time– Etc.

21
Collecting data
• Expensive• Needs consistency• Should be targeted• Often use forms and
checklists• See pp 117 - 123

22
So, what do you use?
• How formal are your measurements?• How consistently applied?• How much time does it take?• Who reviews the data?• Who makes process changes?
• See Kan’s “Recommendations for small organizations,” pp 124-5.


![Kristin Chenoweth - The Girl in 14G[1]](https://img.pdfslide.us/doc/110x75/55407b524a7959b41d8b4ae1/kristin-chenoweth-the-girl-in-14g1.jpg)
