Embed Size (px)
Citation preview

1
ricap07: Roma, June 2007
Recent results from the Pierre Auger Observatory
(and comparisons with AGASA and HiRes)
Alan Watson
University of Leeds

2
Czech Republic
France
Germany
Italy
Netherlands
Poland
Portugal
Slovenia
Spain
United Kingdom
Argentina
Australia
Brasil
Bolivia*
Mexico
USA
Vietnam*
*Associate Countries
~300 PhD scientists from
~70 Institutions and 17 countries
The Pierre Auger Collaboration
Aim: To measure properties of UHECR with unprecedentedstatistics and precision – necessary even if no disagreement
Roma II LecceTorino L’AquilaMilano CataniaNapoli Palermo

3
Present situation Present situation (April 13, 2007)(April 13, 2007)
1423 (1373 filled) SDstations deployed with 1326 taking data
(180607) OVER 83%All 4 fluorescence buildings complete,each with 6 telescopes
1st 4-fold on 20 May 2007
AIM: 1600 tanks
18 June 2007
XLF
CLF

4
~ area of AugerObservatory
12% area of Sicily

5
GPS Receiverand radio transmission
6
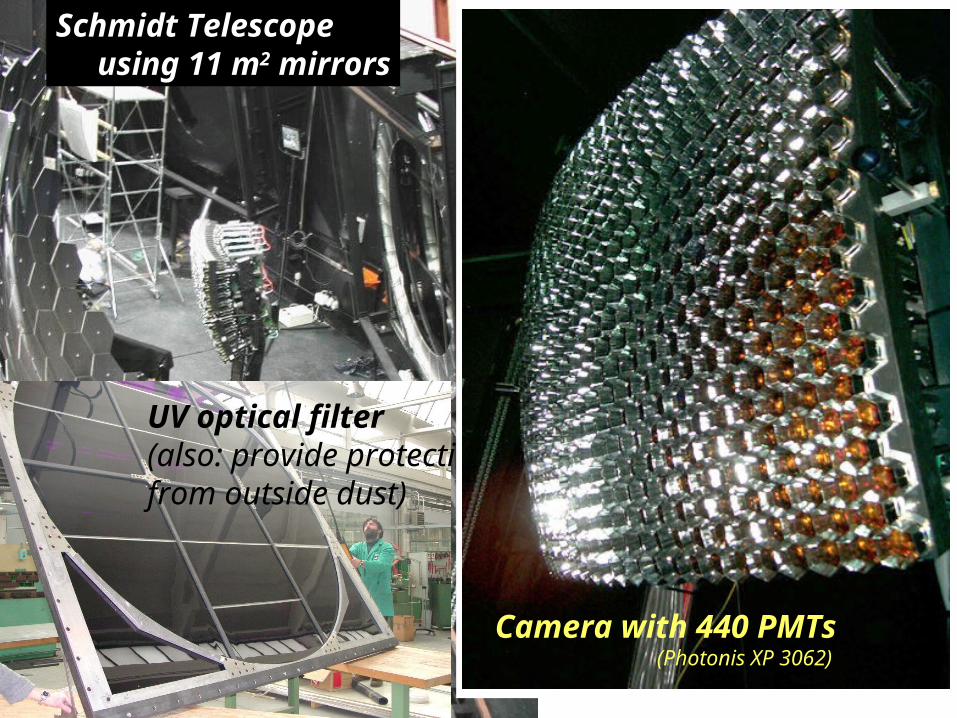
UV optical filter(also: provide protectionfrom outside dust)
Camera with 440 PMTs (Photonis XP 3062)
Schmidt Telescope using 11 m2 mirrors

7
ARRIVAL DIRECTION DISTRIBUTION FROM AUGER Typical accuracy of reconstruction ~ 1°
• No significant emission from Galactic Centre
• No broadband signals – e.g. Dipole – at any energy above 1 EeV e.g 1 < E < 3 EeV, Amplitude < 0.7%
• No clustering of the type claimed by AGASA
• No signal from BL Lacs as possibly seen by HiRes
Summary: Previous reports have not been confirmed
BUT, two ‘prescriptions’ are currently being tested – but I cannot tell you what they are

8
θ~ 48º, ~ 70 EeV
Flash ADC tracesFlash ADC traces
Lateral density distribution
Typical flash ADC trace
at about 2 km
Detector signal (VEM) vs time (µs)
PMT 1
PMT 2
PMT 3
-0.5 0 0.5 1.0 1.5 2.0 2.5 3.0 µs
18 detectors triggered
9
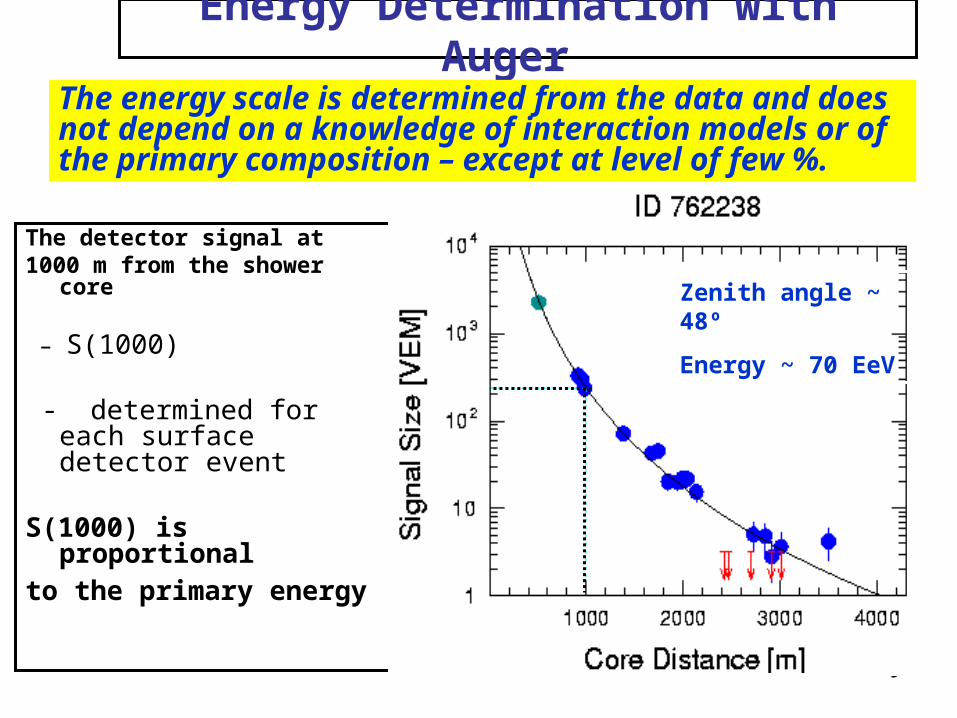
Energy Determination with Auger
The detector signal at 1000 m from the shower
core
– S(1000)
- determined for each surface detector event
S(1000) is proportional to the primary energy
The energy scale is determined from the data and does not depend on a knowledge of interaction models or of the primary composition – except at level of few %.
Zenith angle ~ 48º
Energy ~ 70 EeV

10
A Hybrid Event
11
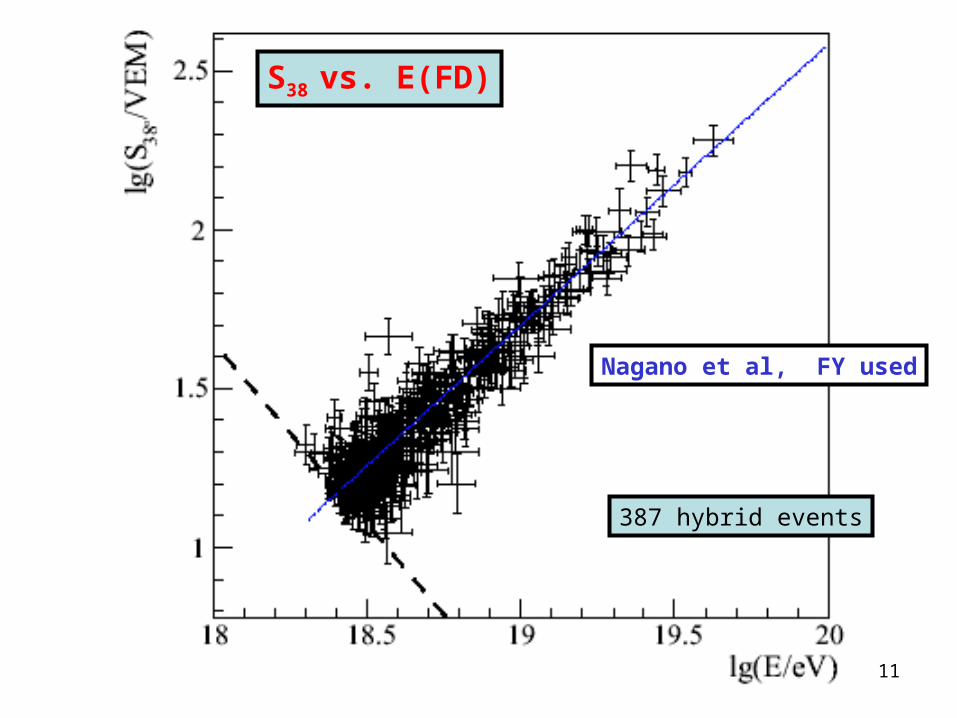
S38 vs. E(FD)
387 hybrid events
Nagano et al, FY used

12
10 EeV S(1000)
Precision of S(1000) improvesas energy increases

13
FD systematic uncertainty ~ 24%

14
Energy spectrum from SD
Calibration unc. 18%FD syst. unc. 24%
5165 km2 sr yr ~ 0.8 full Auger year
Exp Obs>1019.6 132 +/- 9 51
> 1020 30 +/- 2.5 2

15
Ankle? Comparisons of residualsagainst an arbitrary spectrum
A E -2.6

16
= 79 °

17
Muon map for 1019 eV and 80°
Shape is mass and model independent
18
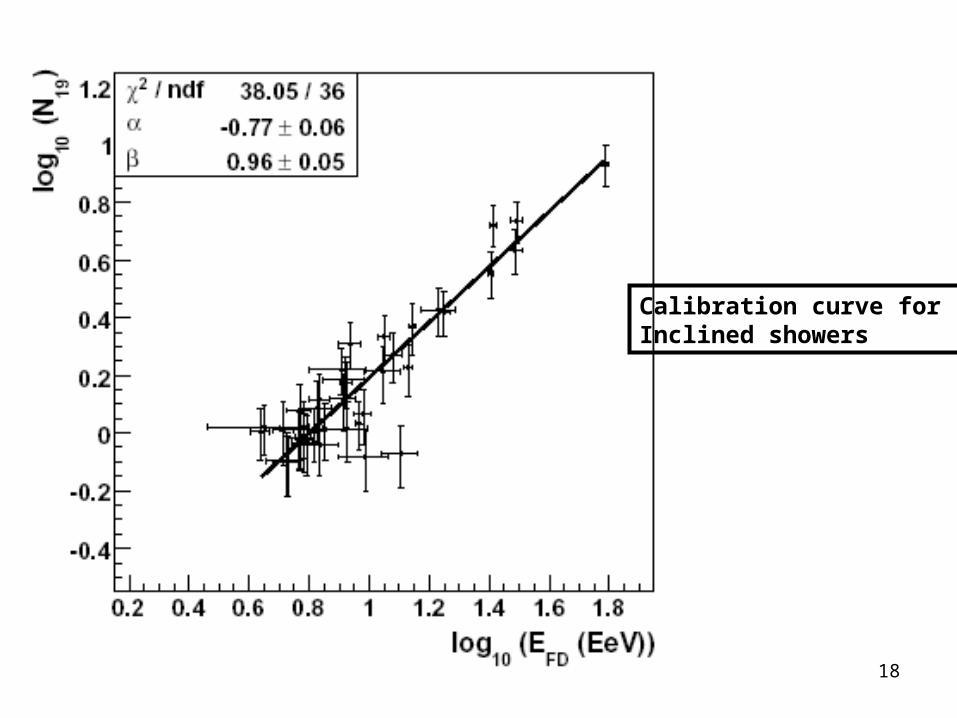
Calibration curve for Inclined showers
19
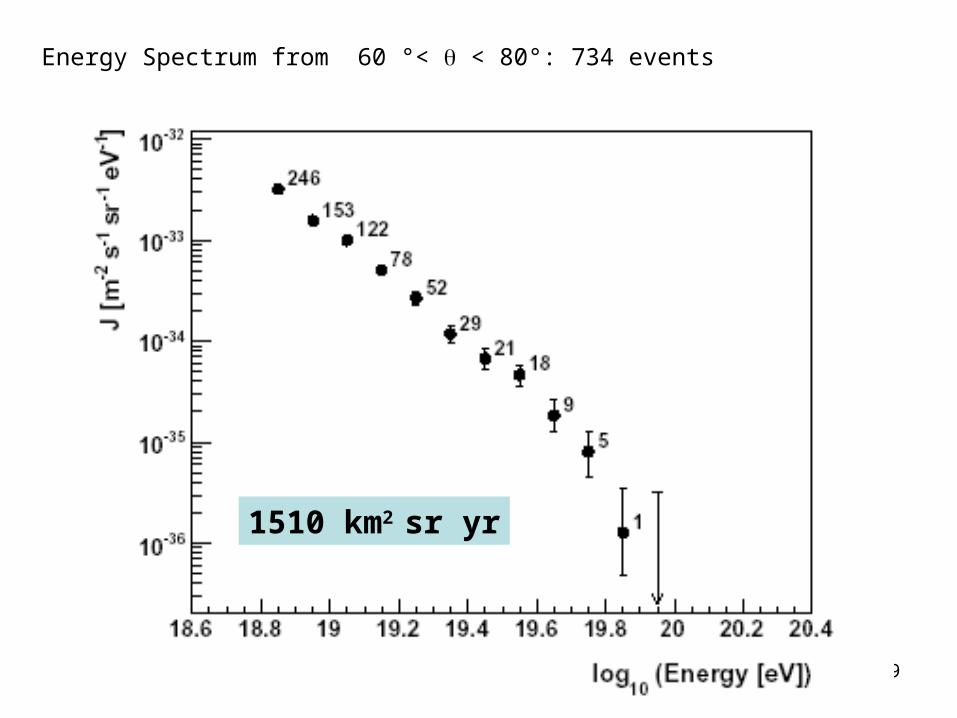
Energy Spectrum from 60 °< < 80°: 734 events
1510 km2 sr yr
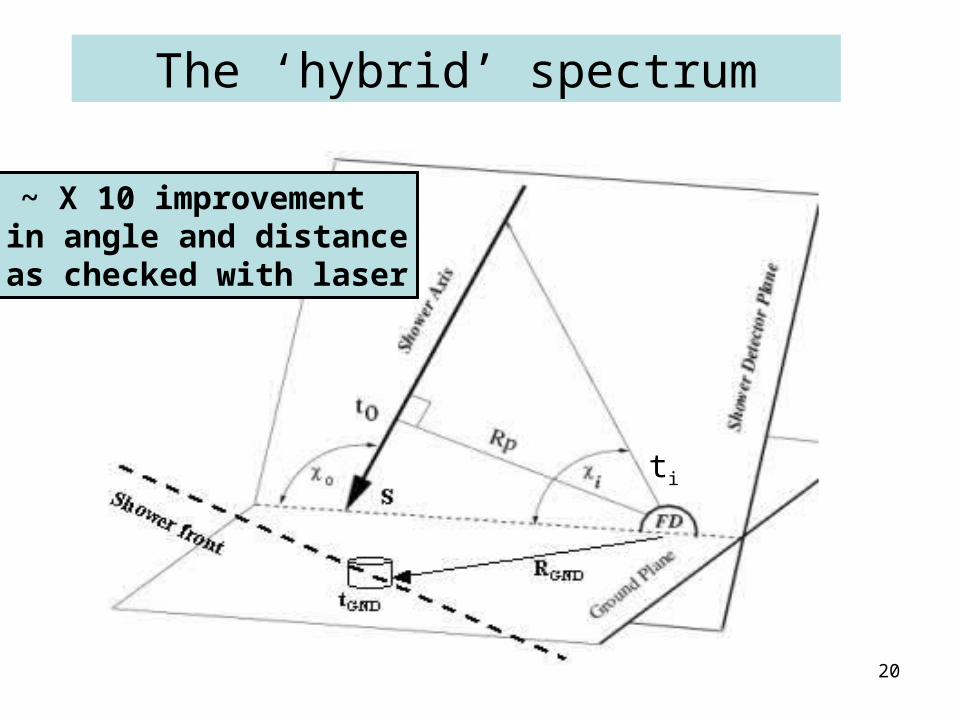
20
ti
The ‘hybrid’ spectrum
~ X 10 improvementin angle and distanceas checked with laser

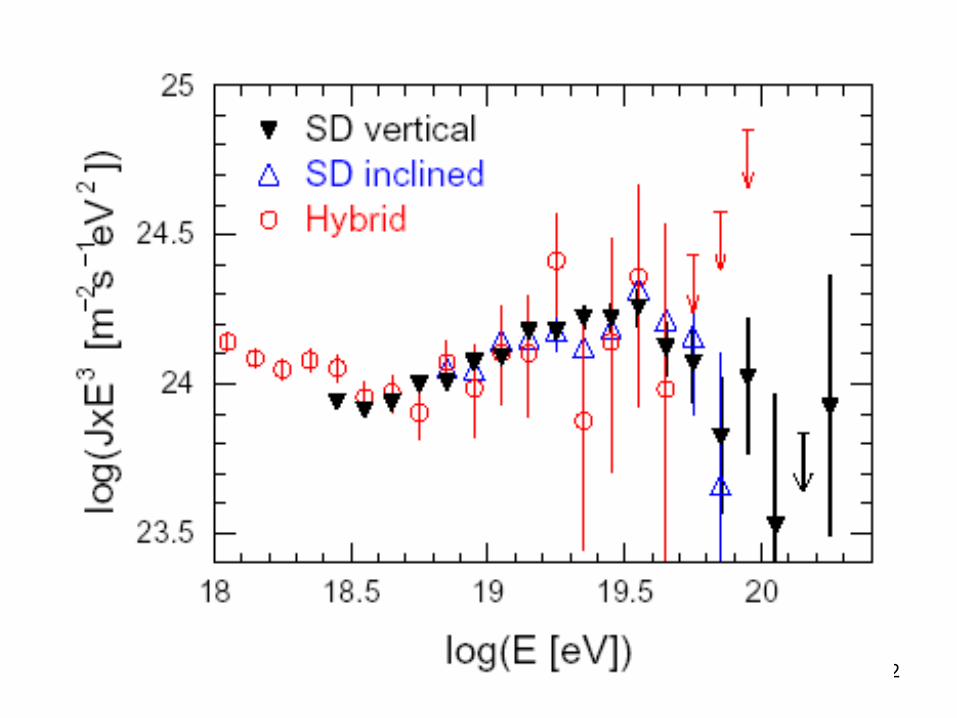
21
Hybrid Spectrum: clear evidence of the ‘ankle’ at ~ 4 x 10¹⁸ eV
-3.1 +/- 0.2
22

23
Energy Estimates aremodel and mass dependent
Takeda et al. ApP 2003
Surface Detectors
Recent reanalysis has reduced number > 1020 eVto 6 events
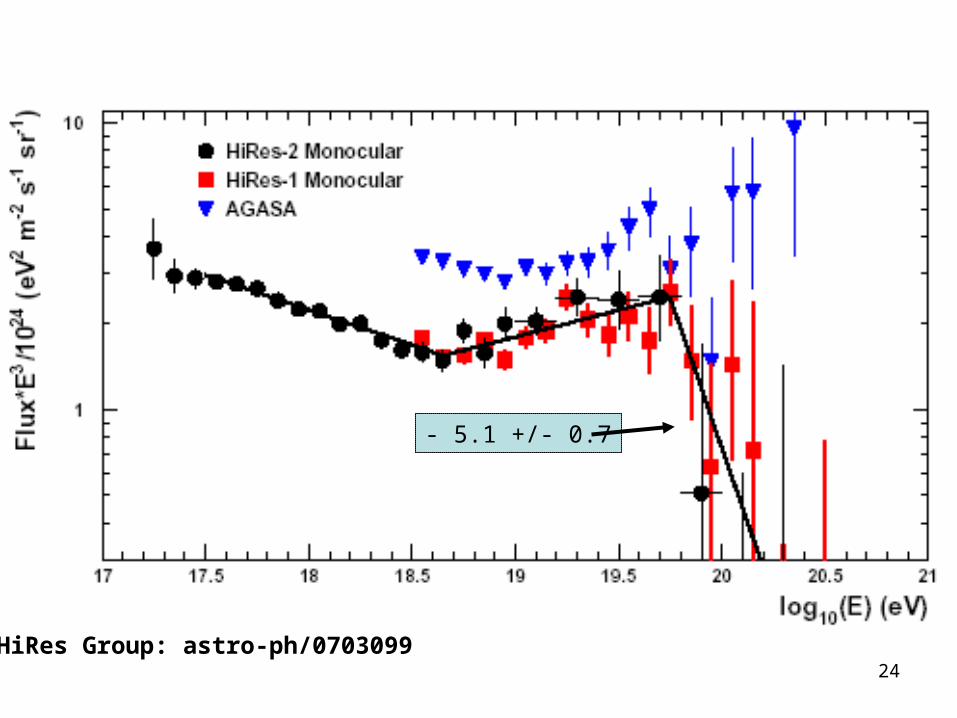
24HiRes Group: astro-ph/0703099
- 5.1 +/- 0.7

25
Teshima: Roma 2006
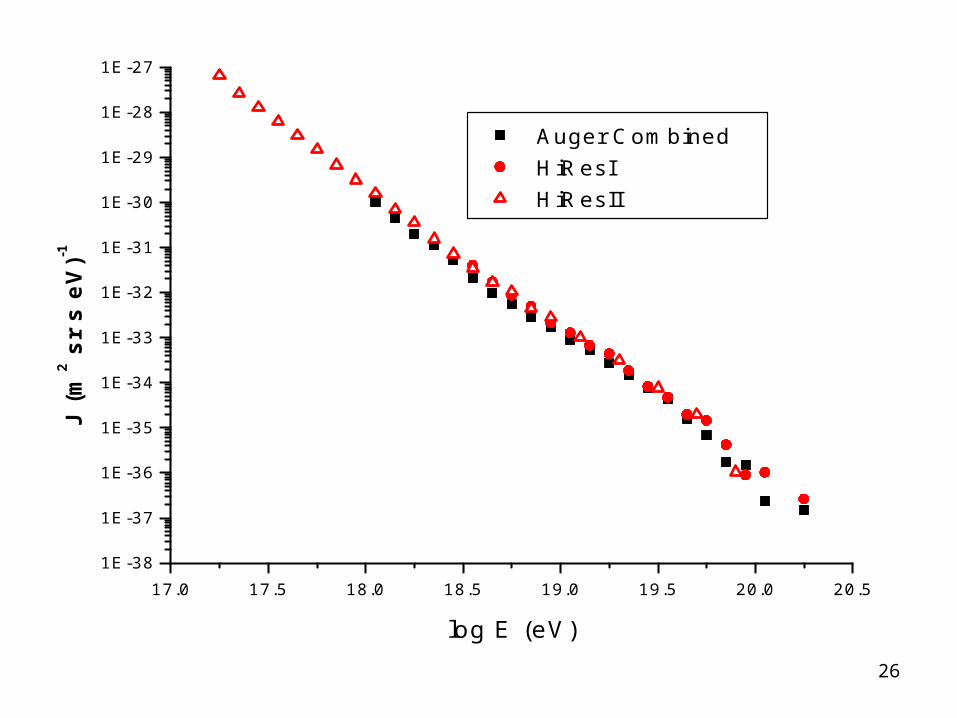
26
17.0 17.5 18.0 18.5 19.0 19.5 20.0 20.51E-38
1E-37
1E-36
1E-35
1E-34
1E-33
1E-32
1E-31
1E-30
1E-29
1E-28
1E-27J (
m2 s
r s e
V)-1
log E (eV)
Auger Combined HiResI HiResII

27
18.0 18.5 19.0 19.5 20.0 20.5
-1.0
-0.5
0.0
0.5
1.0
1.5
2.0
2.5
3.0
3.5
(J/J
s )
- 1
log E (eV)
Auger HiRes I HiRes II
x3
x2
x1
Plot of residuals of individual spectra compared to standard, Js = A E-2.6
HiRes - 5.1 +/- 0.7Auger - 4.1+/- 0.4

28
• Serious discrepancies between HiRes and Auger in the LOW energy region (small numbers at top end)
• Auger Aperture is INDEPENDENT of models, mass or assumptions about spectral slope
• This is NOT the case for HiRes Problem with HiRes aperture?
• Impossible to make meaningful comparisons with propagation models until this issue is resolved
• Cannot be FY or hemisphere differences~ x10

29
Immensely important IF it was to be establishedthat slopes at highest energy are different in northern (- 5.1+/- 0.7) and southern hemispheres (- 4.1 +/- 0.4)
But, MUCH TOO EARLY TO DRAW CONCLUSIONS
• Uncertainties about HiRes aperture
• Poorer energy and angular resolution in HiRes than Auger
• Low number of events – and no more to come to from HiRes
• Issue will be addressed with more Auger data
30
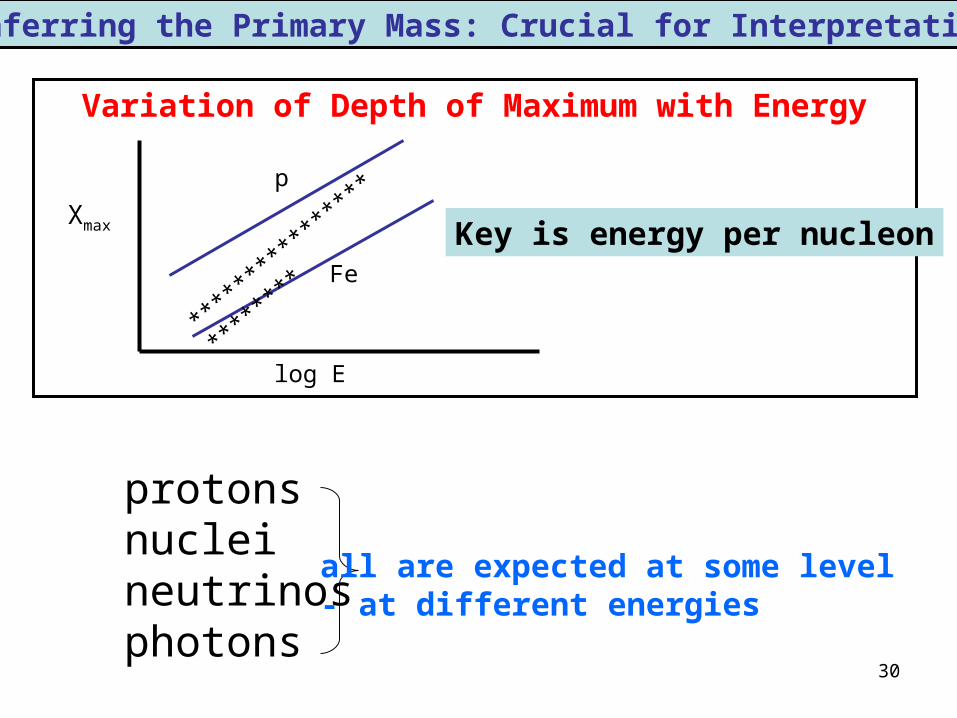
Variation of Depth of Maximum with Energy
Inferring the Primary Mass: Crucial for Interpretation
******
******
******
******
Xmax
log E
p
Fe
Key is energy per nucleon
protonsnucleineutrinosphotons
all are expected at some level- at different energies
31

32
Elongation Rate measured over two decades of energy
AnkleFluctuations in Xmax to be exploited

33
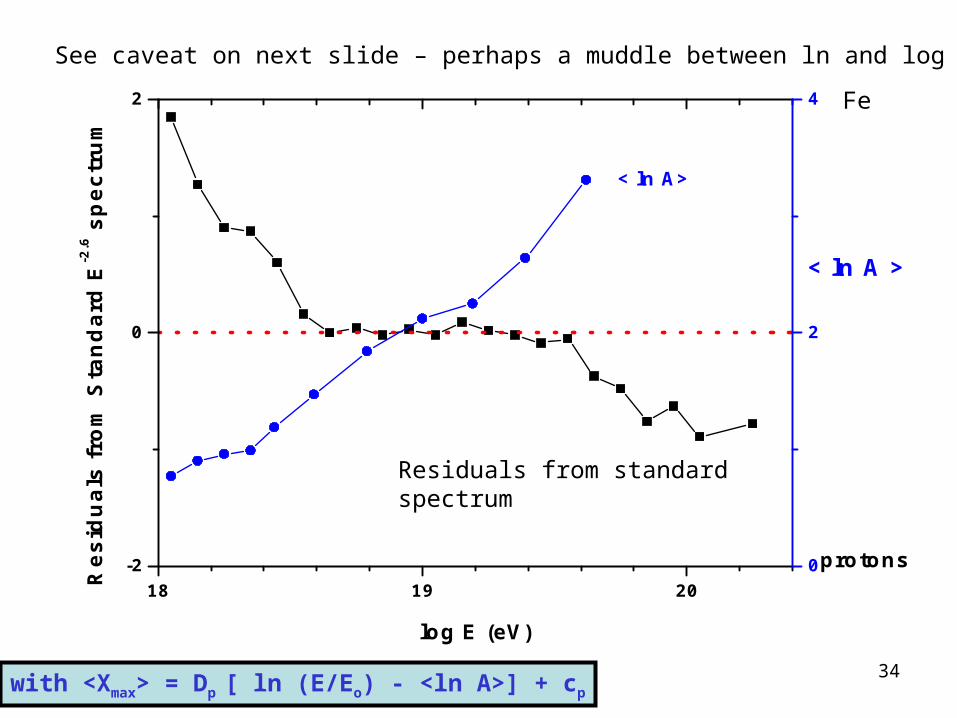
34
18 19 20-2
0
2
log E (eV)
Res
idu
als
fro
m S
tan
dar
d E
-2.6 s
pec
tru
m
Residuals from spectrum
0
2
4
< ln A >
Fe
protons
< ln A>
with <Xmax> = Dp [ ln (E/Eo) - <ln A>] + cp
Residuals from standard spectrum
Fe
See caveat on next slide – perhaps a muddle between ln and log

35
This is Michael Unger’s version of a similar plot that I sentlast week. There may be an error in my calculation. I will beChecking this shortly.

36
37
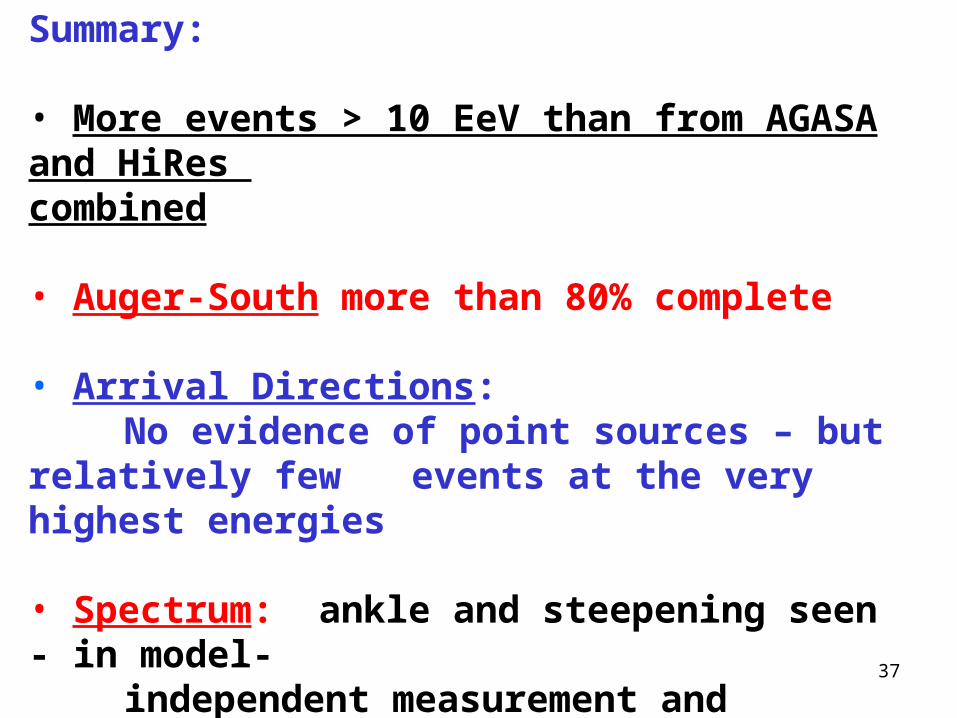
Summary:
• More events > 10 EeV than from AGASA and HiRes combined
• Auger-South more than 80% complete
• Arrival Directions:No evidence of point sources – but relatively few events at the very highest energies
• Spectrum: ankle and steepening seen - in model- independent measurement and analysisat ~ 5 x 10¹⁸ and ~ 4 x 10¹⁹ eV
38
But what does this all mean? Is the ankle marking a galactic/extra-galactic change?
Have we seen the GZK effect?Or is it a ‘bump’ from a more local effect?Are the accelerators just ‘tired’?
Can we deduce much from propagation models?
Deducing the MASS is crucial: mixed at highest energy?Certainly not expected – do hadronic models mayneed modification?Larger cross-section and/or more muons
Would help to reconcile AGASA with HiRes and Auger at the highest energies
Auger statistics will totally dominate after another year