Embed Size (px)
Citation preview

1
RESIST Trials - Grade 3 or 4 AST, ALT or Total Bilirubin:Actions and Outcomes
Action Taken:TPV/rN=748
CPI/rN=737
Total Number of Grade 3 or 4 ALT, AST, or Bilirubin
74 (9.9) 26 (3.5)
Continued treatment 57 (7.6%) 26 (3.5%)
No interruption 47 (6.3%) 23 (3.1%)
Interrupted 10 (1.3%) 3 (0.4%)
Discontinued treatment 17 (22.7%) 0 (0%)
With Grade 3 7 (0.9%)
With Grade 4 10 (1.3%)

2
Lipid Lowering Agent Use Among RESIST Participants
Note: agents included are statins, fibrates, and omega-3 fatty acids
n=108 n=102 n=130 n=79 n=238 n=181
14.417.4
31.8
13.810.7
24.6
0.05.0
10.015.020.025.030.035.0
Enrolled on LLD Needed to Start LLD Total on LLD
TPV/r CPI/r
Use of Lipid Lowering Drugs in RESIST
Per
cen
tag
e

3
Effect of LLD on triglycerides: RESIST
0
100
200
300
400
500
CPI Before CPI After TPV Before TPV After
390 (259, 581)
355 (230, 538)
445 (298, 634)
367 (286, 568)
N 63 63 118 118
# deter 3 4 6 3
4
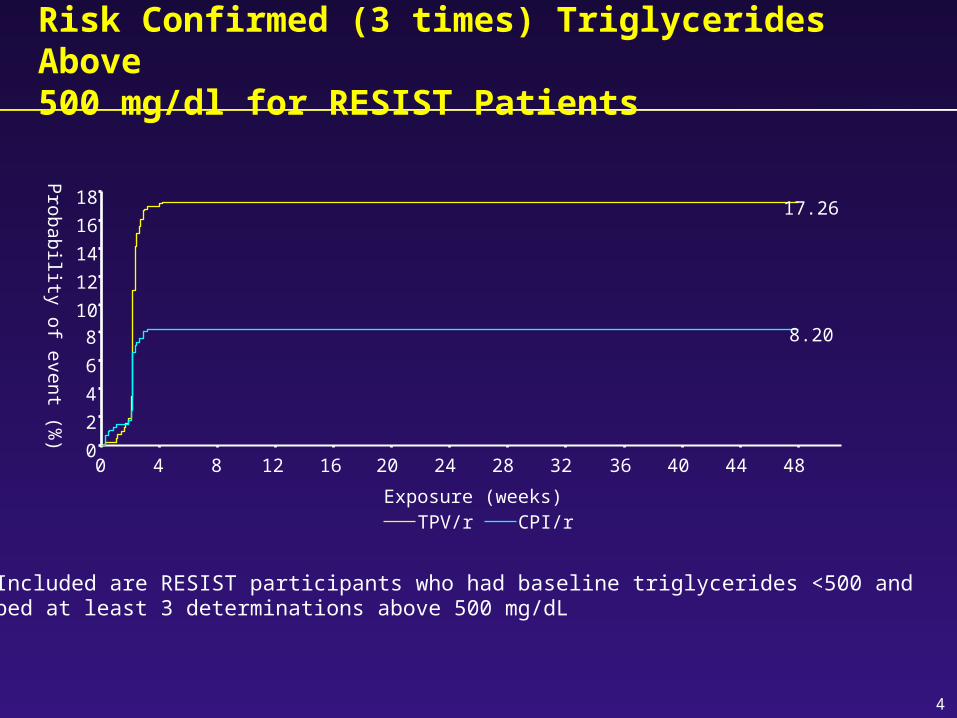
Risk Confirmed (3 times) Triglycerides Above 500 mg/dl for RESIST Patients
17.26
8.20
0
2
4
6
810
12
14
16
18
0 4 8 12 16 20 24 28 32 36 40 44 48
Exposure (weeks)TPV/r CPI/r
Pro
bab
ility
of
even
t (%
)
Note: Included are RESIST participants who had baseline triglycerides <500 and developed at least 3 determinations above 500 mg/dL

5
RTV-boosted drug interaction assessments
Substrate Drug TPV/r result
Norvir® result
Kaletra® result
Zidovudine 43% AUC 56% Cmax
25% AUC 27% Cmax
NR
Didanosine 10% AUC 20% Cmax
13% AUC 16% Cmax
NR
Tenofovir , except 38%
Cmax
NR NR
Rifabutin 3 x, metabolite 21 x
4 x, metabolite 35 x
3 x, metabolite 47 x
Atorvastatin 9.4 x metabolite >90%
NR 5.9 x metabolite NR
Ethinyl Estradiol 45-50% 40% 42% Methadone 50% 36-38% 45-53% Loperamide 50% NR NR NR = not reported in Norvir® or Kaletra® prescribing information

6
Reduced GSS as Key Mutations Increase
0
10
20
30
40
50
60
70
0 1 2 3 4
Number of key mutations% b
asel
ine
ba
ckg
rou
nd
RT
I su
scep
tib
ilit
y sc
ore
s <
2

7
Hypertriglyceridemia:Relative Contribution of TPV and RTV
Median baseline and maximal increase in serum triglycerides accordingto dose among Trial 1182.52 participants
Dose nMedian (Q25, Q75) baseline
(mg/dL)
Median (Q25, Q75) maximum increase
(mg/dL)
500/100 73 263 (168, 430) 161 (58, 403)
500/200 72 221 (172, 332) 271 (99, 558)
750/200 71 223 (173, 416) 196 (72, 421)

8
Analysis of Treatment Response at Week 48
n = Number of respondersN = Number of evaluable patientsTreatment difference and confidence interval weighted for the size of enfuvirtide and PI strata
RESIST-1 RESIST-2
Treatment Group
TPV/r CPI/r TPV/r CPI/r
n (%) N n (%) N n (%) N n (%) N
Key analysis
FAS (week 24) (NCF, as randomised)
130
(41.8)
311 74 (23.9)
309 177
(40.7)
435 76 (17.8)
428
FAS (week 48) (NCF, as randomised)
103
(33.1)
311 49 (15.9)
309 148
(34.0)
435 64 (15.0)
428
Sensitivity analysis
PPS (week 48) (NCF, as randomised)
66 (35.7)
185 38 (19.7)
193 102
(37.4)
273 41 (16.1)
254

9
K-M Probabilities for Grade 3 or 4 ALT and/or ASTThrough 120 Weeks in 8 HIV+ Integrated Trials*
0
3
6
9
12
15
0 10 20 30 40 50 60 70 80 90 100 110 120Study drug exposure (weeks)
Pro
bab
ilit
y (
%)
of
an
even
t
29 25 6 2 1 0
1870 1445 1019 417 148 133# At Risk-
Events-
* Includes TPV/r patients from 1182.2, 1182.4, 1182.6, 1182.17, 1182.51, 1182.52, and CPI/r patients who switched to TPV/r 500/200 from RESIST trials 1182.12 and 1182.48

RESIST StudiesCox Regression Model for Risk of Grade 3 or 4 ALT/AST
Baseline risk factors for Grade 34 ALT/AST are similar in TPV/r and CPI/r
Independent variables: age, gender, race, ΔCD4, baseline triglycerides, NRTI, NNRTI, viral load, CDC HIV stage, duration of HIV infection
Factor/Comparison Risk Ratio 95% CI
Treatment Group:TPV/r vs CPI/r 2.4 1.5 – 3.8
Baseline ALT,AST Total Bilirubin:(Grade > 1 vs Grade < 1) 2.5 1.3 – 4.8
CD4+ Cell Count at Baseline: >200 vs ≤200 cells/mm3 2.0 1.3 – 2.5
HBV or HCV Co-infection:Co-infected vs not co-infected 2.3 1.4 – 3.7
10
11
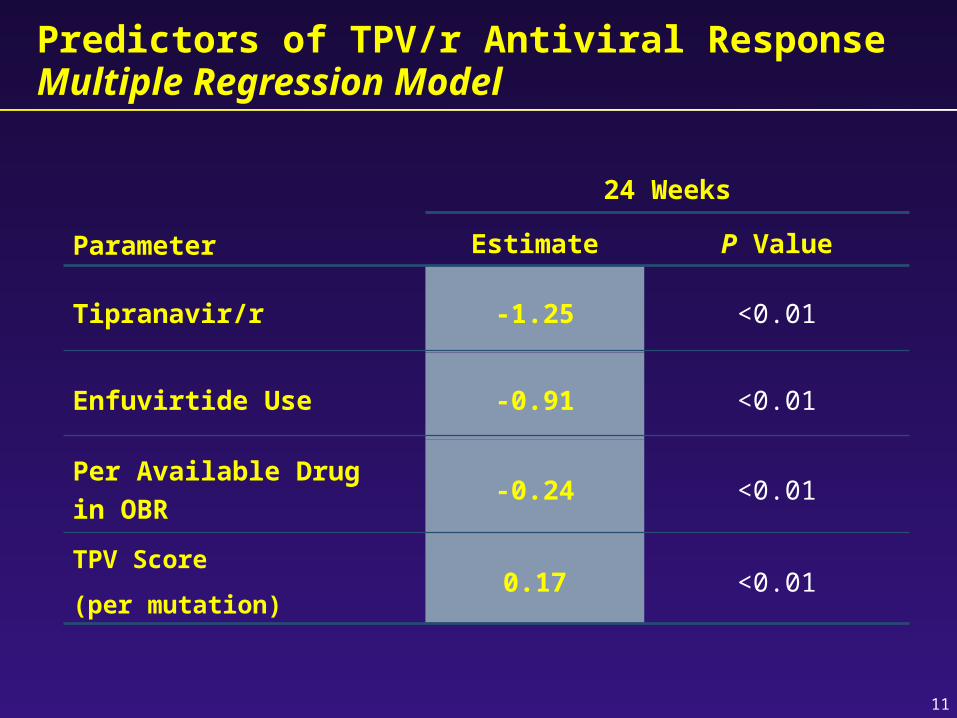
Predictors of TPV/r Antiviral Response Multiple Regression Model
P ValueEstimate
<0.010.17TPV Score
(per mutation)
<0.01-0.24Per Available Drug
in OBR
<0.01-0.91Enfuvirtide Use
<0.01-1.25Tipranavir/r
24 Weeks
Parameter
12
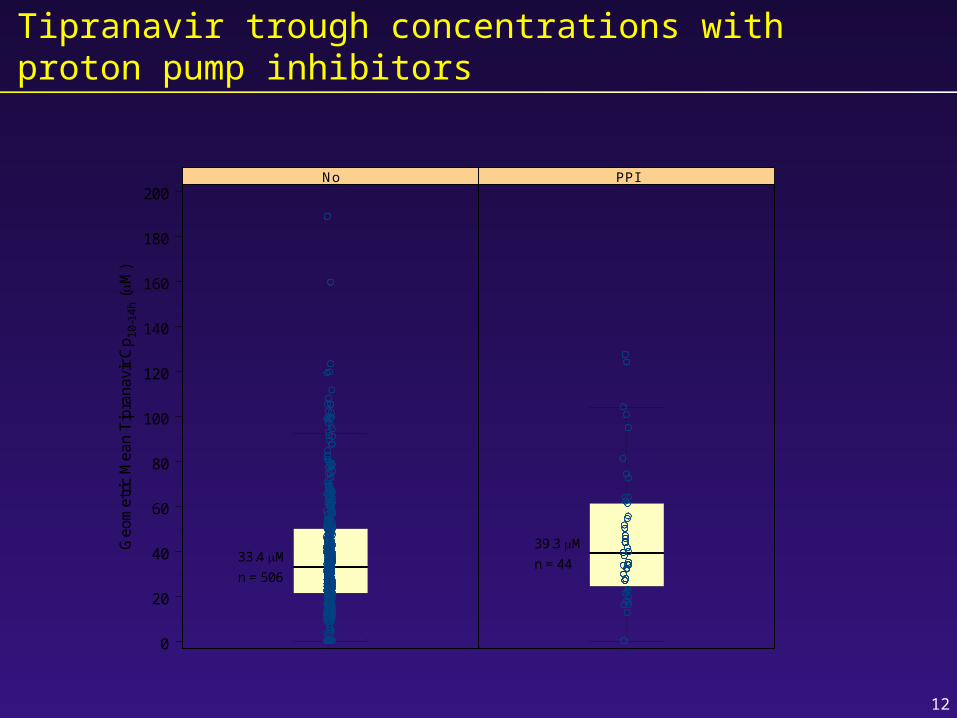
Tipranavir trough concentrations with proton pump inhibitors
0
20
40
60
80
100
120
140
160
180
200
Geo
met
ric M
ean
Tip
rana
vir
Cp
10-1
4h (M
)
No PPI
33.4 M
n = 506
39.3 M
n = 44

13
Trial 1182.52Impact of IQ on 14-Day Viral Load Response
Cha
nge
from
bas
elin
e at
2 w
eeks
(lo
g 10)
Inhibitory quotient
Observed data Fold Change = 30 1 log10 decline
30
-3
-2
-1
0
1
0.1 1 10 100 1000 10,000

14
1182.52Impact of IQ on 14-Day Viral Load Response
0.05
-0.13
-1.03-1.16
-0.98
-1.25-1.4
-1.2
-1
-0.8
-0.6
-0.4
-0.2
0
≤5 >5–30 >30–50 >50–100 >100–150 >150
Inhibitory quotient
HIV
RN
A lo
g 10
chan
ge f
rom
bas
elin
e
7
27 14 34 25 58
0.2

15
RESIST Trials24 Week VL Change according to IQ in Patients not using Enfuvirtide
-5
-4
-3
-2
-1
0
1
2
1 10 100 1000 10000
Log Inhibitory Quotient
Lo
g C
han
ge
fro
m b
asel
ine
HIV
RN
A
16
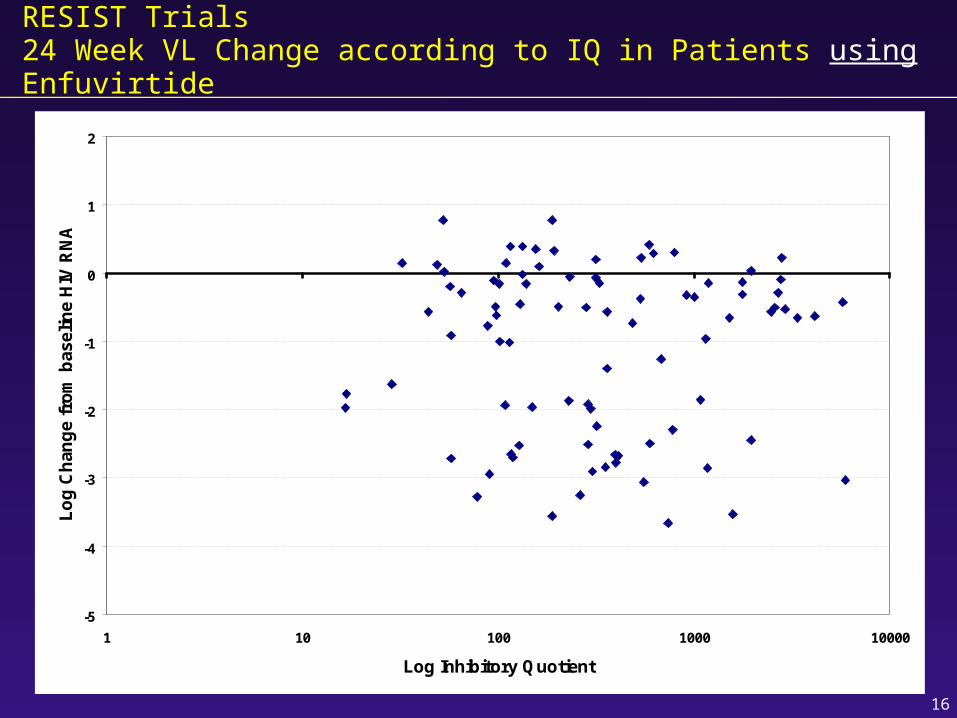
RESIST Trials24 Week VL Change according to IQ in Patients using Enfuvirtide
-5
-4
-3
-2
-1
0
1
2
1 10 100 1000 10000
Log Inhibitory Quotient
Lo
g C
han
ge
fro
m b
asel
ine
HIV
RN
A

17
0
20
40
60
80
100
120
140
160
Antiviral activity of tipranavir (ViroLogic)Non-clade B isolates
Mea
n EC
50 (n
M)
10274
11638
124Ref. NL4-3 (B virus)
EC50 = 62 nM
EC50 values measured at ViroLogic Inc (South San Francisco) using the PhenoSense assay
No evidence that other HIV-1 clades and circulating recombinant formshave lower susceptibility to TPV than HIV-1 clade B
Clade B biological cutoff value for TPV not yet determined
(1.6X LPV or 99nM)*
* Parkin et al, AAC, 2004, 48, 437-443
(three isolates each except two for clade H)

18
VIRCO / ViroLogic in Tipranavir Phenotype

19
Mutations Which Increase Susceptibility to TPV
Amino acid
Median FC IC50
NParameter Estimate
P-valueWild type Mutated
18L 1.00 0.50 5 -0.55 0.035
30N 1.20 0.50 26 -0.54 <0.001
50V 1.10 0.70 19 -0.31 0.021
54L 1.10 0.70 21 -0.31 0.018
77I 1.20 1.00 102 -0.18 0.011
88D 1.10 0.60 26 -0.38 0.001