Embed Size (px)
Citation preview
1
Report on results of Discriminant Analysis experiment.27 June 2002
Norman F. Schneidewind, PhD
Naval Postgraduate School
2822 Racoon Trail
Pebble Beach, California 93953 USA
Internet (email): [email protected]
2
Outline
• 1. Introduction
• 2. Objectives
• 3. Technical Approach
• 4. Risk Factors
• 5. Risk Factor Examples
• 6. Results
• 7. Conclusions
3
1.0 Introduction
• If measurement is to advance to a higher level:– We must shift our attention to the front-
end of the development process.– It is during system conceptualization that
errors in specifying requirements are inserted into the process.
4
1.1 Introduction
• A requirements change may induce ambiguity and uncertainty in the development process that cause errors in implementing the changes.– These errors may result in significant
risks associated with implementing the requirements.
• Faults and failures may be induced by changes in requirements due to lack of precision in requirements.
5
1.2 Introduction • Our use of risk pertains to executing the
software of a system where there is the chance of injury, damage, or loss of the mission, if a serious software failure occurs during the mission.
• Acronyms– CRs: Change Requests– DRs: Discrepancy Reports– MW: Man Weeks– SLOC: Source Lines Of Code

6
1.3 Introduction• Definitions
– critical value: Discriminant that distinguishes high quality from low quality software.
– “issues”: Number of possible conflicts among requirements.
– “mods”: Number of modifications or iterations on the proposed change.
– “sloc”: Number of lines of code affected by the change.
– “space”: Amount of memory space required to implement the change.
7
2.0 Objectives
• Given the lack of emphasis in metrics research on the critical role that requirements play in determining reliability, we are motivated to investigate the following issues:

8
2.1 Objectives
– What is the relationship between requirements attributes and reliability?
• Are there requirements attributes that are strongly related to the occurrence of defects and failures in the software?
9
2.2 Objectives
– What is the relationship between requirements attributes and software attributes like complexity and size?
• Are there requirements attributes that are strongly related to the complexity and size of software?

10
2.3 Objectives
– Is it feasible to use requirements attributes as predictors of reliability?
• Can static requirements change attributes like the size of the change be used to predict reliability in execution?
–For example, time to next failure and number of failures.

11
2.4 Objectives
– Are there requirements attributes that can discriminate between high and low reliability?
• Thus qualifying these attributes as predictors of reliability.
– Which requirements attributes affect the risk to reliability the most?

12
2.5 Objectives– Develop a process (shown in Figure 1)
that is used for the following:
– 1) analyze the relationships between requirements changes, complexity, and reliability, and
– 2) assess and predict reliability risk as a function of requirements changes.

13
Figure 1. Risk Analysis Process
RequirementsChangeRequest
AnalyzeRisk
Factors
AffectReliability
Y Mitigate Risk(e.g., ReduceComplexity)
ImplementRequirement
N
Check for S-Significant Relationships betweenRisk Factors and Failure Occurrence andMetric Characteristics

14
3.0 Technical Approach
• By retrospectively analyzing the relationship between requirements and reliability and maintainability, we identified those risk factors that are associated with reliability and maintainability.
• We prioritized them based on the degree to which the relationship is s-significant.
15
3.1 Technical Approach• In order to quantify the effect of a
requirements change, we used various risk factors.
• These are defined as the attribute of a requirement change that can induce adverse effects on reliability and maintainability:– Failure incidence, maintainability (e.g., size and
complexity of the code) and project management (e.g. personnel resources).

16
3.2 Technical Approach• Table 1 shows the Change Request
Hierarchy of the Space Shuttle:– change requests, discrepancy reports, and
failures.
• We analyzed categories 1 versus 2.1 and 1 versus 2.2.3 with respect to risk factors as discriminants of the categories.

17
Table 1: Change Request Hierarchy• Change Requests (CRs)
– 1. No Discrepancy Reports (i.e., CRs with no DRs)
– 2. Discrepancy Reports• 2.1 No failures (i.e., CRs with DRs only)• 2.2 Failures• 2.2.1 Pre-release failures• 2.2.2 Post-release failures• 2.2.3 Exclusive OR of 2.2.1 and 2.2.2
(i.e., CRs with failures)
18
3.3 Technical Approach• Categorical Data Analysis
• Using the null hypothesis, Ho: A risk factor is not a discriminant of reliability and maintainability
• versus the alternate hypothesis H1: A risk factor is a discriminant of reliability and maintainability, we used categorical data analysis to test the hypothesis.

19
3.4 Technical Approach• A similar hypothesis is used to assess whether risk
factors can serve as discriminants of metrics characteristics.
• We used the requirements, requirements risk factors, reliability, and metrics data from the Space Shuttle “Three Engine Out” software. (abort sequence invoked when three engines are lost) to test our hypotheses.
• Samples of these data are shown in Tables 2, 3, and 4.
20
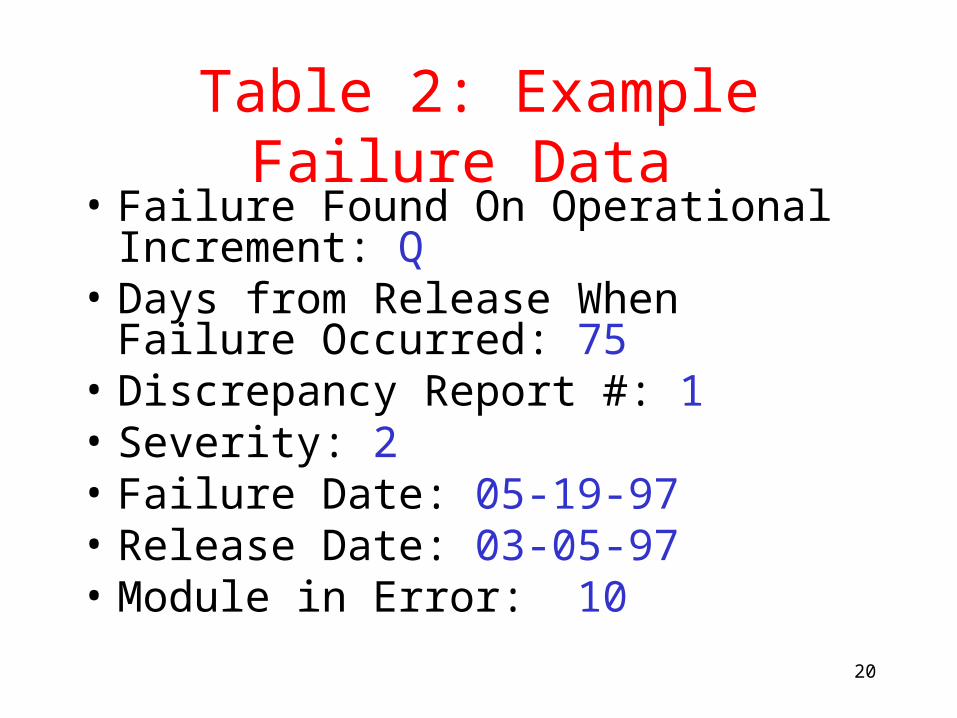
Table 2: Example Failure Data • Failure Found On Operational Increment: Q• Days from Release When Failure Occurred:
75• Discrepancy Report #: 1• Severity: 2• Failure Date: 05-19-97• Release Date: 03-05-97• Module in Error: 10

21
Table 3:Example Risk Factors • Change Request Number: A• Source Lines of Code Changed: 1933• Complexity Rating of Change: 4• Criticality Of Change: 3• Number of Principal Functions Affected: 27• Number of Modifications Of Change Request: 7• Number of Requirements Issues: 238• Number of Inspections Required: 12• Manpower Required to Make Change: 209.3 MW

22
Table 4: Example Metrics Data
• Module: 10
• Operator Count: 3895• Operand Count: 1957• Statement Count: 606• Path Count: 998• Cycle Count: 4• Discrepancy Report Count: 14• Change Request Count: 16

23
3.5 Technical Approach
• Table 5 shows the definition of the Change Request samples that are used in the analysis. – Sample sizes are small due to the high
reliability of the Space Shuttle. • However, sample size is one of the
parameters accounted for in the statistical tests that produced s-significant results in certain cases.

24
Table 5: Definition of Samples
• Sample Size• Total CRs 24• Instances of CRs with no DRs 12• Instances of CRs with DRs only 9• Instances of CRs with failures 7• Instances of CRs with modules that caused failures
7• A given CR can have multiple instances of DRs,
failures, and modules that caused failures.• CR: Change Request. DR: Discrepancy Report.

25
3.6 Technical Approach• To minimize the confounding effects of a
large number of variables that interact in some cases, a statistical categorical data analysis was performed incrementally.
• We used only one category of risk factor at a time.– Observe the effect of adding an
additional risk factor on the ability to correctly classify change requests that have discrepancy reports or failures and those that do not.

26
3.7 Technical Approach• The Mann-Whitney test for difference in
medians between categories was used because no assumption need be made about s-statistical distribution.
• In addition, some risk factors are ordinal scale quantities (e.g., modification level).– Rank correlation was used to check for
risk factor dependencies.

27
4.0 Risk Factors
• One of the software maintenance problems of the NASA Space Shuttle Flight Software organization is to evaluate the risk of implementing requirements changes.
• These changes can affect the reliability and maintainability of the software.
• To assess the risk of change, the software development contractor uses a number of risk factors.
28
4.1 Risk Factors
• This formal process is called a risk assessment. • No requirements change is approved by the
change control board without an accompanying risk assessment.
• To date this qualitative risk assessment has proven useful for identifying possible risky requirements changes.– Or conversely, providing assurance that there
are no unacceptable risks in making a change.

29
4.2 Risk Factors
• However, there has been no quantitative evaluation to determine whether high risk factor software was really less reliable and maintainable than low risk factor software.
• In addition, there is no model for predicting the reliability and maintainability of the software, if the change is implemented.
• We addressed both of these issues.

30
5.0 Risk Factor Examples
• Complexity Factors– Number of modifications or iterations on
the proposed change • How many times must the change be
modified or presented to the change control board before it is approved?
• Size Factors– Number of lines of code affected by the
change • How many lines of code must be
changed to implement the change?
31
5.1 Risk Factor Examples
• Requirements Issues and Function Factors– Possible conflicts among requirements
changes (requirements issues)• Will this change conflict with other
requirements changes (e.g., lead to conflicting operational scenarios)?
• Performance Factors– Amount of memory required to
implement the change• Will the change use memory to the
extent that other functions will be not have sufficient memory to operate effectively?
32
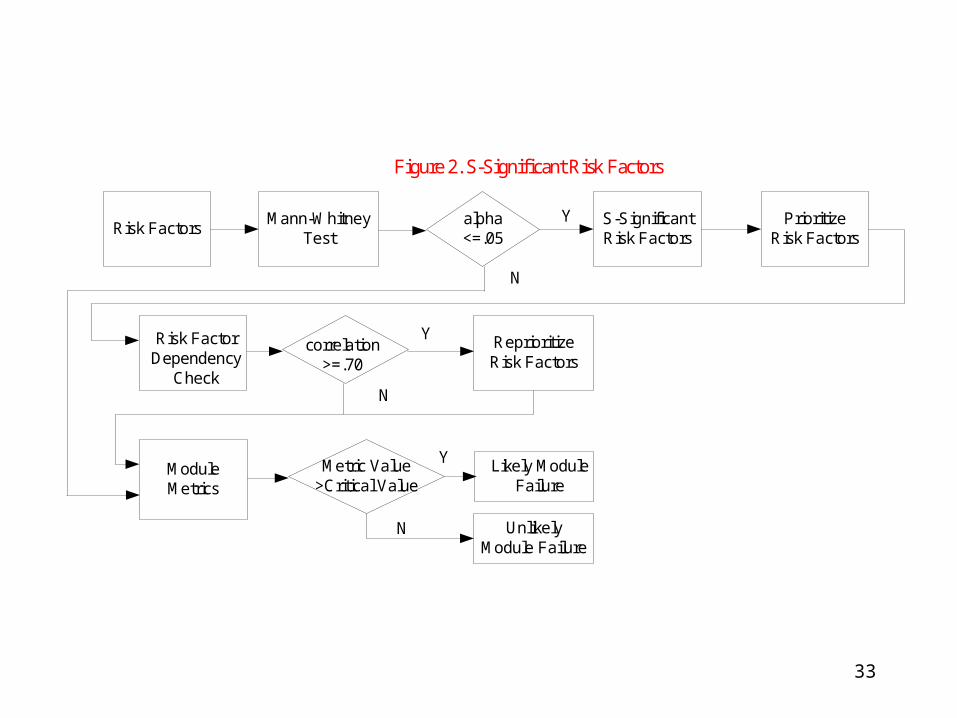
6.0 Results• We show the results of performing the statistical
analyses (a, b, and c) in Tables 6, 7, and 8, respectively. – This process is illustrated in Figure 2.
• Only those risk factors where there is sufficient data (i.e., data from seven or more CRs) and the results are s-significant are shown.
• Some quantitative risk factors (e.g., size of change, “sloc”) are s-significant;– no non-quantitative risk factors (e.g.,
complexity) are s-significant.
33
Risk Factors
Figure 2. S-Significant Risk Factors
Mann-WhitneyTest
alpha<=.05
S-SignificantRisk Factors
Y
Metric Value>Critical Value
PrioritizeRisk Factors
Risk FactorDependency
Check
correlation>=.70
ReprioritizeRisk Factors
Y
Likely ModuleFailure
N
ModuleMetrics
Y
N
UnlikelyModule Failure
N
34
6.1 Results
• a. Categorical data analysis on the relationship between CRs with no DRs vs. CRs with failures, using the Mann-Whitney Test.
• Categorical data analysis on the relationship between CRs with no DRs vs. CRs with DRs only, using the Mann-Whitney Test.
35
6.2 Results
• b. Dependency check on risk factors, using rank correlation coefficients.
• c. Identification of modules that caused failures as a result of the CR, and their metric values.
36
6.3 Results• a. Categorical Data Analysis
• Table 6 (Part 1) shows that there are s-significant results for CRs with no DRs vs. CRs with failures for the risk factors “mods”, “sloc”, “issues”, and “space”.
• There are also s-significant results for CRs with no DRs vs. CRs with DRs only for the risk factors “issues” and “space” (Part 2).
37
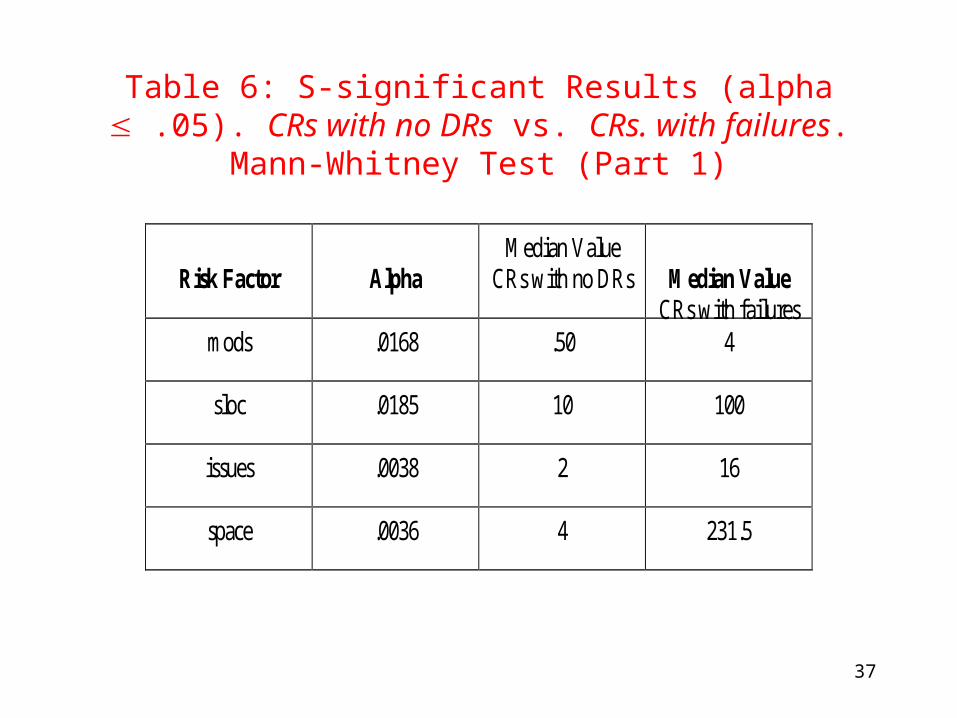
Table 6: S-significant Results (alpha .05). CRs with no DRs vs. CRs. with failures. Mann-Whitney Test (Part 1)
Risk Factor
Alpha
Median Value CRs with no DRs
Median Value
CRs with failures mods .0168 .50 4
sloc .0185 10 100
issues .0038 2 16
space .0036 4 231.5

38
Table 6: S-significant Results (Part 2)
CRs with no DRs vs. CRs with DRs only.
Risk Factor
Alpha
Median Value CRs with no DRs
Median Value CRs with DRs
only issues .0386 2 14
space .0318 4 111.50
39
6.4 Results• Since the value of alpha represents the level
of s-significance of a risk factor in predicting reliability, we use it in Table 6 as a means to prioritize the use of risk factors, with low values meaning high priority. – The priority order is: “space”, “issues”,
“mods”, and “sloc”.• The s-significant risk factors would be used
to predict reliability and maintainability problems for this set of data and this version of the software.

40
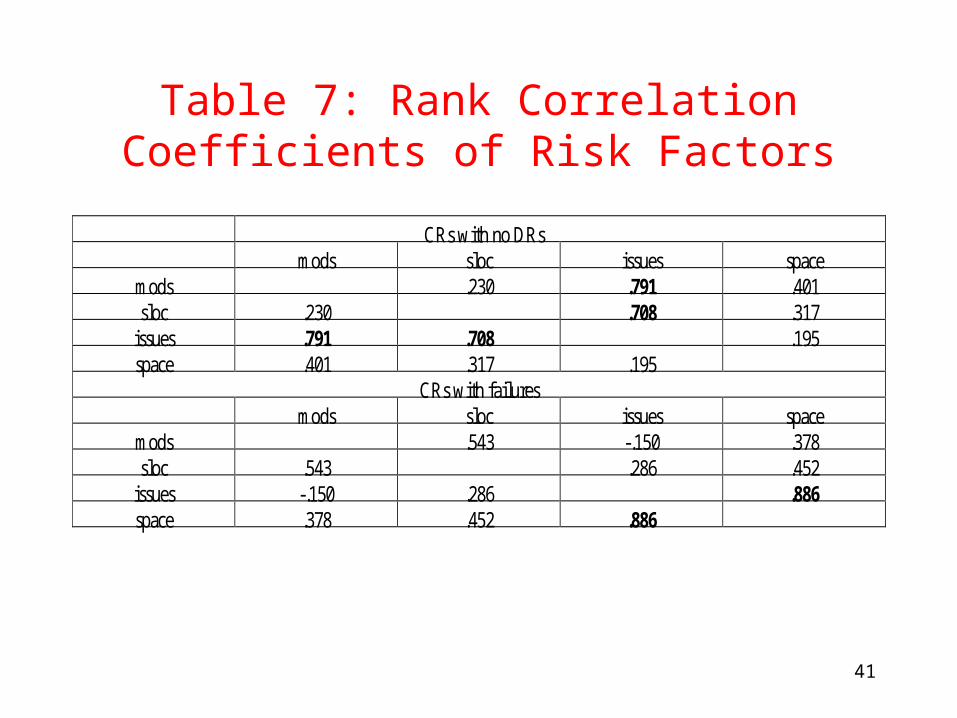
6.5 Results• b. Dependency Check on Risk Factors
• To check for possible dependencies among risk factors that could confound the results, rank correlation coefficients are computed in Table 7. – Using an arbitrary threshold of .7, the results
indicate s-significant dependencies between “issues” and “mod” and between “issues” and “sloc” for CRs with no DRs.
41
Table 7: Rank Correlation Coefficients of Risk Factors
CRs with no DRs mods sloc issues space
mods .230 .791 .401 sloc .230 .708 .317
issues .791 .708 .195 space .401 .317 .195
CRs with failures mods sloc issues space
mods .543 -.150 .378 sloc .543 .286 .452
issues -.150 .286 .886 space .378 .452 .886
42
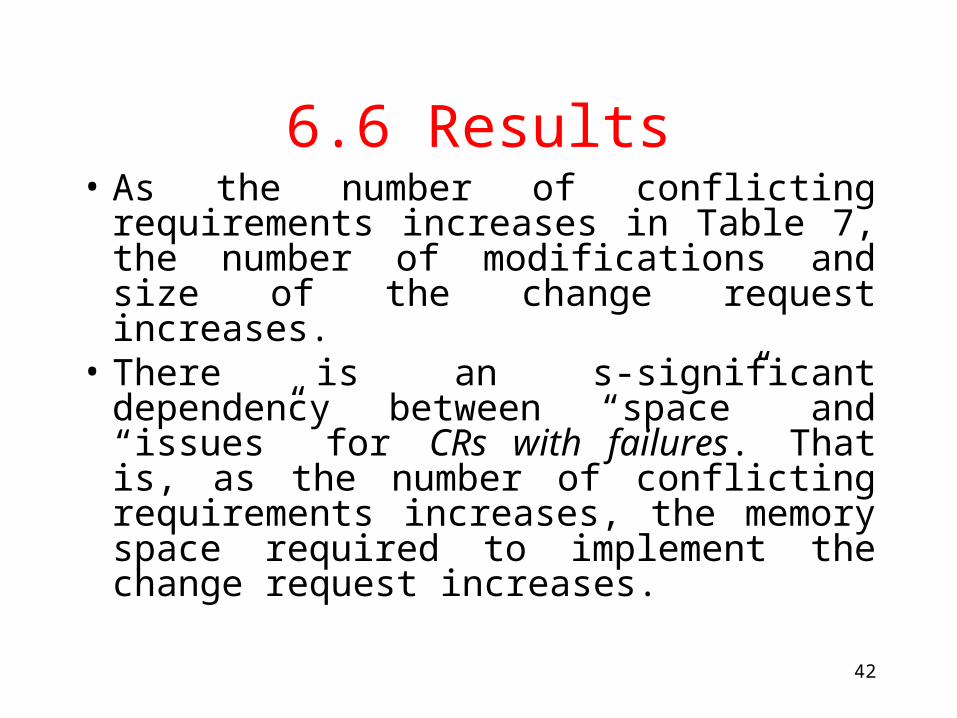
6.6 Results• As the number of conflicting requirements
increases in Table 7, the number of modifications and size of the change request increases.
• There is an s-significant dependency between “space” and “issues” for CRs with failures. That is, as the number of conflicting requirements increases, the memory space required to implement the change request increases.

43
6.7 Results• c. Identification of Modules That Caused
Failures• Requirements change requests may occur
on modules with metric values that exceed the critical values.
• In these cases, there is s-significant risk in making the change because such modules could fail.

44
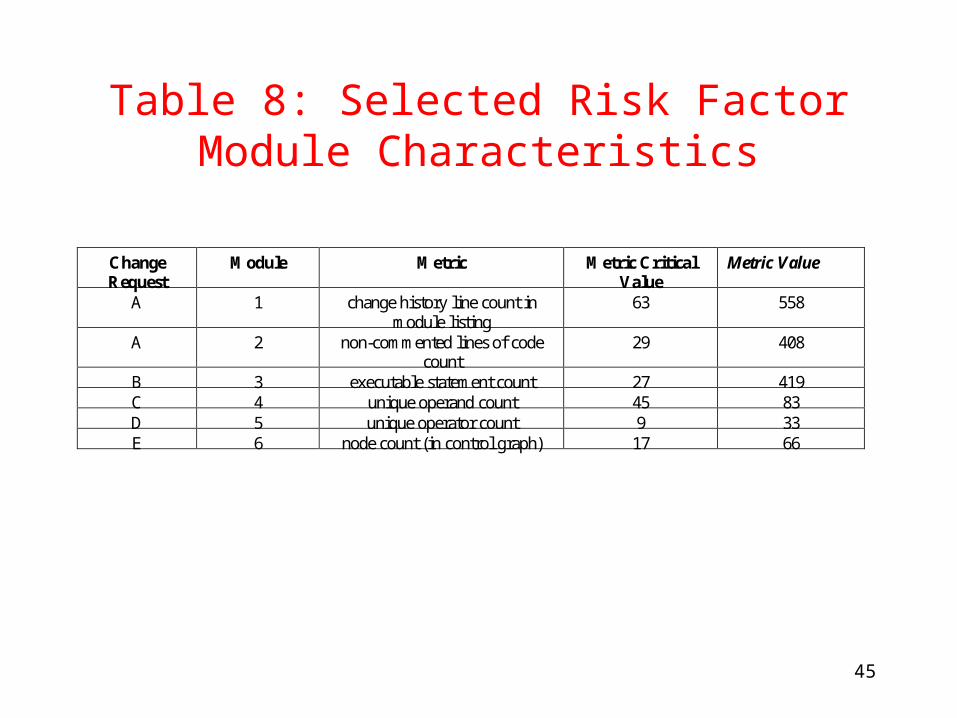
6.8 Results• Table 8 shows modules that caused failures,
as the result of the CRs, had metric values that far exceed the critical values.
• A module with metric values exceeding the critical values is predicted to cause failures.
• For the Space Shuttle, modules with excessive size and complexity consistently lead to failures.
45
Table 8: Selected Risk Factor Module Characteristics
Change Request
Module Metric Metric Critical Value
Metric Value
A 1 change history line count in module listing
63 558
A 2 non-commented lines of code count
29 408
B 3 executable statement count 27 419 C 4 unique operand count 45 83 D 5 unique operator count 9 33 E 6 node count (in control graph) 17 66

46
7.0 Conclusions• Risk factors that are s-significant can be
used to make decisions about the risk of making changes.
• These changes impact the reliability and maintainability of the software.

47
7.1 Conclusions• S-significant results were found for CRs
with no DRs vs. CRs with failures;– in addition, s-significant results were
found for CRs with no DRs vs. CRs with DRs only.
• Module metrics should be considered in risk analysis because metric values that exceed the critical values are likely to result in unreliable and non-maintainable software.
• This methodology can be generalized to other risk assessment domains, but the specific risk factors, their numerical values, and statistical results may vary.