Embed Size (px)
Citation preview


OifelVEy
HD28.M414
SOFTWARE COMPLEXITY ANDSOFTWARE MAINTENANCE COSTS
Rajiv 0. BankerSrikant M. DatarChris F. Kemerer
Dan! Zweig
April 1990(Revised January 1992)
CISR WP No. 208Sloan WP No. 3155-90
Center for Information Systems Research
Massachusetts Institute of Technology
Sloan School of Management77 Massachusetts Avenue
Cambridge, Massachusetts, 02139


SOFTWARE COMPLEXITY ANDSOFTWARE MAINTENANCE COSTS
Rajiv D. BankerSrikant M. Datar
Chris F. KemererDani Zweig
April 1990(Revised January 1992)
CISR WP No. 208Sloan WP No. 3155-90
®1990. 1991. 1992 R.D. Banker, S.M. Datar, C.F. Kemerer, D. Zweig
Center for information Systems Research
Sloan School of Managennent
Massachusetts Institute of Technology

M.! ^ IBRARIES
JUL 1 6 1992J
RtbciVED

Software Complexity and Software Maintenance Costs
Abstract
In an empirical analysis of sixty-five software maintenance projects in a large IBM COBOL transaction
processing environment, the impacts of correctable software complexity upon project costs were
estimated. Module size, procedure size, and the use of complex branching were all found to significantly
affect software maintenance costs. It was estimated that projects involving maintenance of systems with
greater underlying code complexity cost approximately 25% more than otherwise identical projects dealing
with less complex code. These costs are estimated to amount to several million dollars at this data site,
suggesting that the aggregate cost across the industry may be extremely large. A generalizable model is
provided to allow researchers and managers in other environments to estimate and reduce these costs.
ACM CR Categories and Subject Descriptors: D.2.7 [Software Engineering]: Distribution and
Maintenance; D.2.8 [Software Engineering]: Metrics; D.2.9 [Software Engineering]: Management; F.2.3
[Analysis of Algorithms and Problem Complexity]: Tradeoffs among Complexity Measures; K.6.0
[Management of Computing and Information Systems]: General - Economics; K.6.1 [Management of
Computing and Information Systems): Project and People Management; K.6.3 [Management of Computing
and Information Systems]: Software Management
General Terms: Management, Measurement, Performance.
Additional Key Words and Phrases: Software Maintenance, Software Complexity, Software Productivity, Software
Economics.
We gratefully acknowledge research support from the National Science Foundation Grant No. SES-8709044, the Center for
the Management of Technology and Information in Organizations (Carnegie Mellon University), the Center for Information
Systems Research (MIT), and the International Financial Services Research Center (MIT). The cooperation of managers at
Mellon Bank, NA, Pittsburgh, PA, was invaluable, as the research would not have been possible without their cooperauon.


Introduction
While the Unk between the difficulty in understanding computer software and the cost to maintain it is
appealing, prior empirical evidence linking software complexity to software maintenance costs is relatively
weak^ Many of the attempts to link software complexity to maintainability are based upon experiments
involving small pieces of code, or are based upon analysis of software written by students. Such evidence
is valuable, but several researchers have noted that such results must be applied cautiously to large scale
commercial application systems that account for most software maintenance expenditures [11, 14].
Furthermore, the limited large scale research that has been undertaken has generated either no or
conflicting results; as, for example, on the effects of software modularity and software structure [6, 10].
Nor does any of the previous work develop estimates of the acmal cost of complexity, estimates that could
be used by software maintenance managers to make best use of their resources. While research supporting
the statistical significance of a factor is, of course, a necessary first step in this process, practitioners must
also have an understanding of the practical magnitudes of the effects of complexity if they are to be able to
make informed decisions.
This study analyzes the effects of software complexity upon the costs of COBOL maintenance projects
within a large commercial bank. It has been estimated that 60 percent of all business expenditures on
computing are for maintenance of software written in COBOL^. Since over 50 billion lines of COBOL are
estimated to exist worldwide, this also suggests that their maintenance represents an information systems
activity of considerable economic imponance. Using a previously-developed economic model of software
maintenance as a vehicle [2], this research estimates the marginal impact of software complexity upon the
costs of software maintenance projects in a traditional information systems environment. The model
^See, for example, J. Kearney, et al.. Software Complexity Measurement, Communications of the ACM 29, 1 1 (1986)
1044-1050.
^Freedman, D.H. Programming without Tears, High Technology 6, 4 (1986) 38-45.

employs a multi-dimensional approach to measuring software complexity, and it controls for additional
project factors under managerial control that are believed to aifect maintenance project costs.
The analysis confirms that software maintenance costs are significantly affected by software complexity,
measured in three dimensions: module size, procedure size, and branching complexity. The findings
presented here also help to resolve the current debate over the functional form of the relationship between
software complexity and the cost of software maintenance. The analysis further provides acmal dollar
estimates of the magnitude of this impact at a typical commercial site. The estimated costs are high enough
to justify strong efforts on the part of software managers to monitor and control complexity. This analysis
could also be used to assess the costs and benefits of a class of computer-aided software engineering
(CASE) tools known as restructurers.
The remainder of this paper is organized as follows. The next section, "Previous Research and
Concepuial Model" presents the conceptual model and summarizes previous field research in this area.
The section "Model and Results" develops the research model and hypotheses, and presents the statistical
results. Managerial results and implications for software practice are presented in the section entided
"Implications for Software Maintenance Management". A final section provides some concluding remarks
and suggestions for future research.
Previous Research and Conceptual Model
Software Maintenance and Complexity - Introduction
This research adopts the ANSI/IEEE standard 729 definition of maintenance: "Modification of a software
product after delivery to correct faults, to improve performance or other attributes, or to adapt the product
to a changed environment" [22]. Research on the costs of software maintenance has much in common
with research on the costs of new software development, since both involve the creation of working code
through the efforts of human developers equipped with appropriate experience, tools, and techniques.
However, software maintenance involves a fundamental difference from development of new systems in
that the software maintainer must interact with an existing system. The goal of the current research is to

identify the factors that affect the assimilation process and thereby increase (decrease) the amount of effon
required to perform the maintenance task. In panicular, the current research focuses on measuring the
impact of aspects of the existing source code that are believed to affect the amount of effort required.
Basili defines software complexity as " ...a measure of the resources expended by another system while
interacting with a piece of software. Iftlie interacting system is people, the measures are concerned with
human efforts to comprehend, to maintain, to change, to test, etc.. that software." (1980, p. 232). Curtis
etal. similarly define this concept as psychological complexity: "Psychological complexity refers to
characteristics of software which make it difficult to understand and work with" ( 1 979, p. 96). Both of
these authors note that the lack of use of structured programming techniques is believed to increase the
cognitive load on a software maintainer. In the current research this will simply be referred to as software
complexity, with the focus being on correctable software complexity, i.e., complexity that results from
specific syntactical choices made by the developer. It is this type of complexity that offers the greatest
opponunity for managerial actions to reduce complexity.
Factors that increase maintainer effort will increase project cost, since maintenance costs are most directly a
function of the professional labor component of maintenance projects. Therefore, this research is designed
to measure the impact of aspects of software complexity of the existing system that affect the cost of
maintenance by increasing or decreasing the amount of maintainer effort to comprehend the software,
while controlling for project factors that may also affect performance. Given the growing economic
importance of maintenance, several researchers have attempted to validate hypotheses relating to
complexity. However, researchers have not been able to empirically test the impact of complexity upon
maintenance effort while controlling for additional factors known to affect costs [16, 24]. The main
research objective in this paper is on investigating the relationship between existing software complexity
and maintenance costs. However, in order to properly understand this relationship, the effects of project
factors will be controlled for. Figure 1 presents a simplified view of the concepaial model that will be
tested in this research.
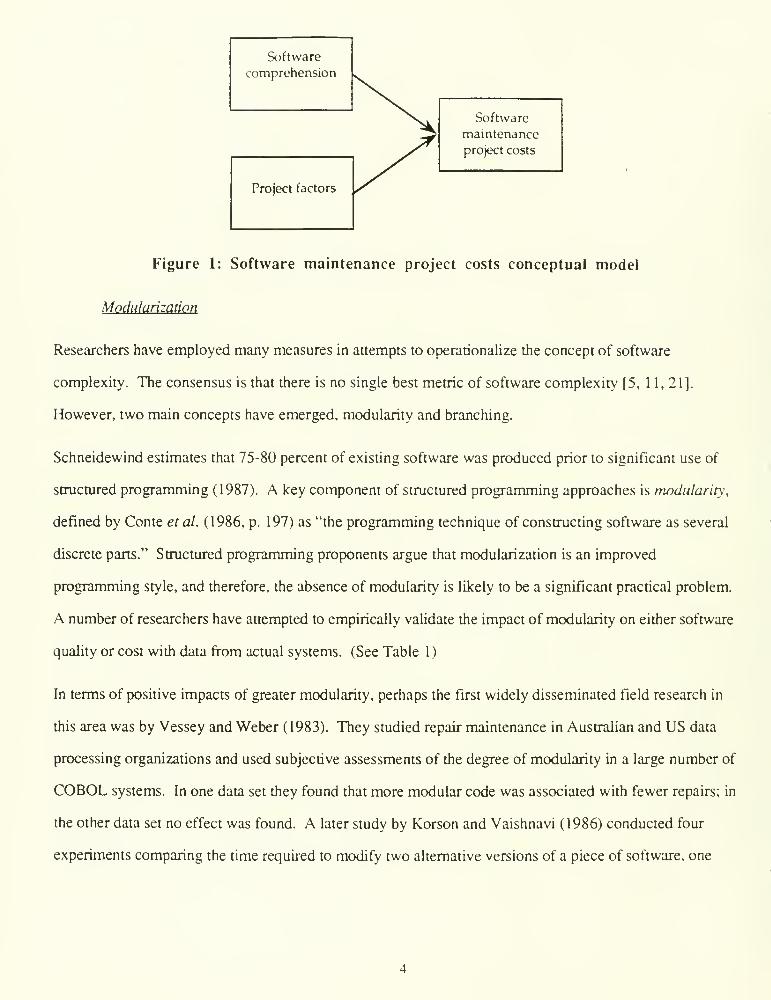
Software
comprehension
Project factors
Software
maintenance
project costs
Figure 1: Software maintenance project costs conceptual model
Modularization
Researchers have employed many measures in attempts to operationaiize the concept of software
complexity. The consensus is that there is no single best metric of software complexity [5, 11, 21].
However, two main concepts have emerged, modularity and branching.
Schneidewind estimates that 75-80 percent of existing software was produced prior to significant use of
strucuired programming (1987). A key component of structured programming approaches is modularity,
defined by Conte etal. (1986, p. 197) as "the programming technique of constructing software as several
discrete parts." Structured programming proponents argue that modularization is an improved
programming style, and therefore, the absence of modularity is likely to be a significant practical problem.
A number of researchers have attempted to empirically validate the impact of modularity on either software
quality or cost witii data from actual systems. (See Table 1
)
In terms of positive impacts of greater modularity, perhaps the first widely disseminated field research in
this area was by Vessey and Weber ( 1983). They studied repair maintenance in Australian and US data
processing organizations and used subjective assessments of the degree of modularity in a large number of
COBOL systems. In one data set they found that more modular code was associated with fewer repairs; in
the other data set no effect was found. A later study by Korson and Vaishnavi (1986) conducted four
experiments comparing the time required to modify two alternative versions of a piece of software, one

modular and one monolithic. In three of the four cases the modular version was significantly easier to
modify.
Card et al. (1985) reached the opposite conclusion. They tested the impact of module size and strength
(singleness of purpose) on programming effort, measured as programmer hours per executable statement.
They found that effort decreased as the size of the module increased. However, effort decreased as
strength increased, but increases in strength were associated with decreases in module size. They
concluded that nothing definitive could be stated about the impact of module size. A study by An et al.
(1987) analyzed change data from two releases of UNIX. They found that the average size of unchanged
modules (417 lines of C) was larger than that of changed modules (279 lines of C) Unfortunately, they
did not provide any analysis to determine if this difference was statistically significant.
An alternative hypothesis is that modules that are either too large or too small are unhkely to be optimal. If
the modules are too large they are unlikely to be devoted to single purpose. If the modules are too small,
then much of the complexity will reside in the interfaces between modules and therefore they will again be
difficult to comprehend. In contrast to the unidirectional studies cited above, a few researchers have
suggested the possibility of bi-directional effects. For example, Conte et al. (1986, p. 109) note that: "Tfie
degree ofmodularization affects the quality ofa design. Over-modularization is as undesirable as
undermodularization." In an analysis of secondary data, Bowen (1984) compared the number of source
lines of code (SLCXT) / module with a set of previously proposed maximum desirable values of two well-
known metrics, McCabe's V(G) and Halstead's N. He concluded that the optimal values of SLOC /
module differed across languages, but that all were much lower than the Department of Defense's
proposed standard of 200 SLOC / module. In his suggestions for future research, he notes (p. 331) that
"More research is necessary to derive and validate upper and lower boundsfor module size. Module size
lower bounds, or some equivalent metric such as coupling, have been neglected; however they are just as
significant as upper bounds. With just a module size upper bound, there is no way to dissuade the
implementation ofexcessively small modules, which in turn introduce inter-module complexity,
complicate software integration testing, and increase computer resource overhead."
Boydston ( 1984) undertook a study of completed systems programming projects at IBM whose main
purpose was to gain greater accuracy in cost estimation. One additional analysis he performed (p. 155)
was to attempt to estimate the optimum SLOC / module ratio for new code, based on the hypothesis that,
"Complexity ofprogramming increases as the lines of code per module and the number of modules to
interface increase ." In other words, extremes of either a very small number of large modules or a very
large number of small modules would both be unlikely to be optimal. His regression analysis developed
multiple, non-linear functions of work-months as a function of the number of new modules, with SLOC
held constant. He concludes (p. 159) that "...as a project gets larger, tlie additional complexity of larger
modules has to be balanced by tfie increasing complexity of information transfer between modules."
However, his model does not control for any non-code factors.
While not examining maintenance cost direcdy, Lind and Vairavan (1989) obtained empirical evidence
supporting the hypothesis of an non-extreme optimum value for module size, i.e., that the best sized
modules were ones that were neither too big nor too small. They analyzed the relationship between the
change rate (number of changes per 100 lines of code, a surrogate for cost) versus a discrete (categorical)
lines of code-based variable. Their five discrete SLOC categories were 0-50, 50-100, 100-150, 150-200,
and 200+. They found that minimum change rates occurred in the 100-150 range, a result they describe
(p. 652) as indicating the "...program change density declines with increasing metric values up to a certain
minimum value. ..beyond this minimum value, the program change density actually increases with an
increase in the value of the metrics."
The results of these previous smdies can be summarized as follows. Researchers testing for unidirectional
results (i.e., that either smaller modules or larger modules were better) have found either no or
contradictory results. Other researchers have suggested that a U-shaped function exists, that is, modules
that are either too small or too large are problematical. In the case of many small modules, more inter-
module interfaces are required. In the case of a few large modules, these modules are less likely to be
devoted to a single purpose^. However, researchers who suggest the U-shaped curve hypothesis either
provide no or limited data Unking size and cost. In general they also do not provide a model for
determining the optimum module size"^.
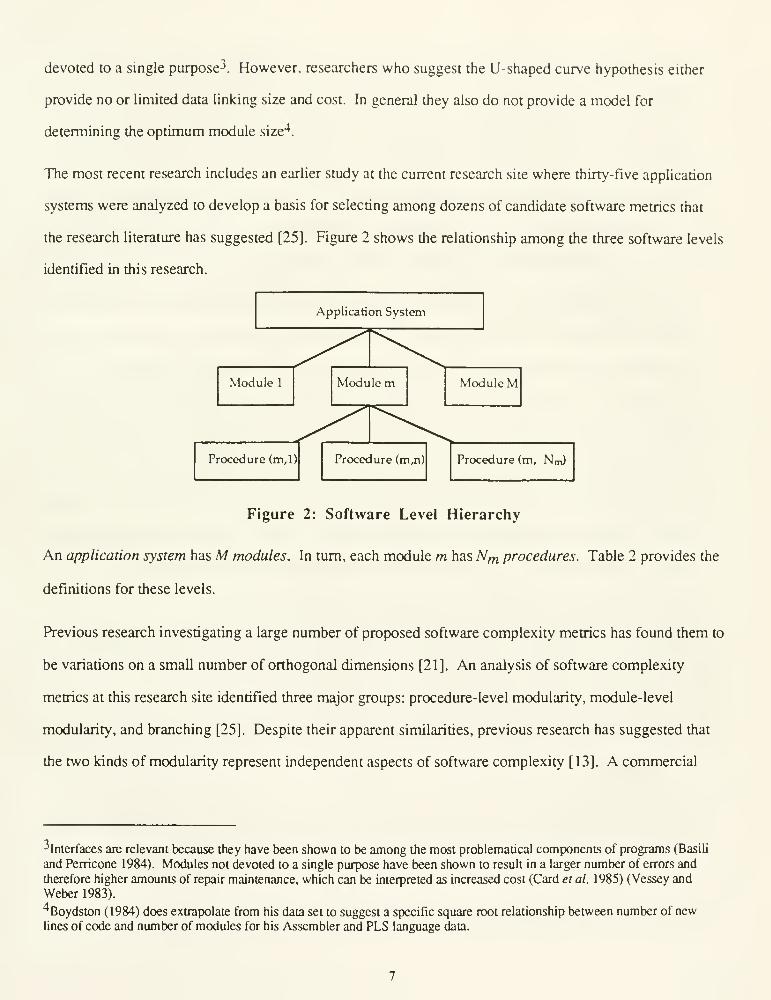
The most recent research includes an earlier study at the current research site where thirty-five application
systems were analyzed to develop a basis for selecting among dozens of candidate software metrics that
the research literature has suggested [25]. Figure 2 shows the relationship among the three software levels
identified in this research.
Figure 2: Software Level Hierarchy
An application system has M modules. In turn, each module m has Nm procedures. Table 2 provides the
definitions for these levels.
Previous research investigating a large number of proposed software complexity metrics has found them to
be variations on a small number of onhogonal dimensions [21]. An analysis of software complexity
metrics at this research site identified three major groups: procedure-level modularity, module-level
modularity, and branching [25]. Despite their apparent similarities, previous research has suggested that
the two kinds of modularity represent independent aspects of software complexity [13]. A commercial
^Interfaces are relevant because they have been shown to be among the most problematical components of programs (Basili
and Perricone 1984). Modules not devoted to a single purpose have been shown to result in a larger number of errors and
therefore higher amounts of repair maintenance, which can be interpreted as increased cost (Card et al. 1985) (Vessey and
Weber 1983).
^Boydston (1984) does extrapolate from his data set to suggest a specific square root relationship between number of new
lines of code and number of modules for his Assembler and PLS language data.

static code analyzer was used to compute these metrics. Given the high levels of correlation within (but
not across) complexity metric groups, a representative metric from each group was selected, based in pan
upon the ease with which it could be understood by software maintenance management and its ease of
collection. This approach has been recommended by previous research [21].
The first metric is PROCSIZE, the average size in executable statements of a module's procedures. There
is an almost universal tendency to associate large procedure size with poor procedure-level modularity.
However, inuiitively, neither extreme is Ukely to be effective. If modules are broken into too many small
procedures, complexity could rise, and in this case increasing the average procedure size would be
expected to decrease complexity.
Module length, in executable statements (MODLSIZE) was selected as the metric of module-level
modularity [5]^ . The effect of this complexity metric is expected to depend upon the application systems
being analyzed. As discussed in the survey of previous research, it is generally believed that large
modules will be more difficult to understand and modify than small ones, and maintenance costs will be
expected to increase with average module size. However, a system can be composed of too many small
modules. If modules are too small, a maintenance project will spread out over many modules with the
attendant interface problems. Therefore, complexity could decrease as module size increases.
Therefore, two specific research hypotheses concerning modularity are proposed:
Hypothesis I : Controlling for otherfactors known to affect software maintenance costs, software
maintenance costs will depend significantly upon average procedure size as measured by PROCSIZE, with
costs risingfor applications whose average procedure size is either very large or very small.
Hypothesis 2: Controlling for otherfactors known to affect software maintenance costs, softwaremaintenance costs will depend significantly upon average module size as measured by MODLSIZE, with
costs risingfor applications whose average module size is either very large or very small.
Branching
Previous work has suggested that control constructs (branching) are expected to have a significant impact
on comprehension [12]. Structured programming is a design approach that limits programming constructs
^This metric was found lo be uncorrelated with PROCSIZE (Pearson correlation coefficient =. 10).

to three basic means of branching through a piece of software. Because it is difficult to comply with these
structures using the GOTO syntax found in older programming languages, this approach is sometimes
colloquially referred to as "GOTO-Iess programming." A review of work in this area before 1984 was
conducted by Vessey and Weber (1984). While few negative results have been found, they note the
absence of significant results is as frequent as a finding of positive results. They attribute this outcome, in
part, to the fact that researchers have not adequately controlled for other factors. They also note the
difficulty of achieving such control, particularly in non-laboratory real-world settings.
More recently, Gibson and Senn (1989) have investigated the impact of software structure using a
laboratory experiment. They found that more structured versions of the same piece of software required
less time to maintain on average. They also found that maintainers' subjective assessments of the
complexity of the existing systems were not very accurate, a result they attribute to the maintainers'
inability to separate task complexity from existing systems complexity. They recommend using objective
measures of systems complexity to remedy this defect. However, the expected results from their
experiments did not hold in all cases. In addition, as noted by the authors, laboratory experimentation is
not a substitute for field research: "Further research is needed to determine whether the relationships
observed in this tightly controlled experiment exist in live settings." (p. 357). In panicular, laboratory
experimentation is unlikely to provide estimates of the actual cost impacts of ill-structured programs in
commercial settings.
In a recent pilot study of seven maintenance projects on Fortran and Pascal-based real-time systems. Gill
and Kemerer (1991) found that maintainer productivity decreased as existing systems complexity
increased, as measured by complexity density, a size-adjusted measure of branching complexity.
However, their model does not control for any non-code factors. The authors also note the need to
validate these results on a larger sample of commercial systems. Therefore, the question of a negative
impact of excessively complex branching on maintenance costs has only limited empirical support, and
there is a need for funher research.

In the current research the initial candidate metric chosen for branching was the proportion of the
executable statements that were GOTO statements (GOTOSTMT). This branching metric is normalized for
module size, so that it would not be confounded with MODLSIZE. This metric is also a measure of
module divisibility, as the degree to which a module can be divided into small and simple procedures
depends directly upon the incidence of branching within the module. Highly divisible modules (modules
with low values of GOTOSTMT) should be less cosdy to maintain, since a maintainer can deal with
manageable portions of the module in relative isolation.
While the density ofGOTO statements (GOTOSTMT), like other candidate control metrics examined, is a
measure of divisibility (each GOTO command makes a module more difficult to understand by forcing a
programmer to consider multiple portions of the module simultaneously), it does not distinguish between
more and less serious structure violations. A branch to the end of the current paragraph, for example, is
unlikely to make that paragraph much more difficult to comprehend, while a branch to a different section
of the module may. However, none of the existing structure metrics examined clearly differentiate
between the two cases. In addition, the modules analyzed have a large incidence of GOTO statements
(approximately seven per hundred executable statements). If only a relatively small proportion of these
seriously affect maintainability then the GOTOSTMT metric may be too noisy a measure of branching
complexity. At this research site over half of the GOTOs in these modules (19 GOTOs out of 31 in the
average module) are used to skip to the beginning or end of the current paragraph. Such branches would
not be expected to contribute noticeably to the difficulty of understanding a module (in most high-level
languages other than COBOL they would probably not be implemented by GOTO statements). Therefore,
a metric such as GOTOSTMT, which does not distinguish between these and the approximately forty
percent less benign branch commands, will be unlikely to be managerially useful.
To avoid this problem, a modified metric was computed, GOTOFAR, which is the density of the GOTO
statements that extend outside the boundaries of the paragraph and that can be expected to seriously impair
the maintainability of the software^. Since the automated static code analyzer was not able to compute this
^This is believed to be similar in concept to Gibson and Senn's (1989) elimination of "long jumps in code (GO TOs)".
10

metric, it was computed manually. Due to the large amount of data collection effort and analysis this
computation required, the metric was not computed for all the modules analyzed, but only for a random
sample of approximately fifty modules per application system. This random sample consisted of
approximately 1500 modules in total, or approximately thirty percent of all modules in the total data set^.
Therefore, the third research hypothesis is:
Hypotfiesis 3: Controlling for otherfactors known to affect software maintenance costs, software
maintenance costs will depend significantly upon the density of branching as measured by GOTOFAR.with costs rising with increases in the incidence ofbranching.
Table 3 summarizes the software complexity variables used in the model. Figure 3 presents the full
conceptual model.
Procedure
Size
Module Size
Branching
Software
comprehension
Project factors
Software
maintenance
project costs
Figure 2: Software Maintenance Project Cost Model
Project Factors^
The research model has two main components, one consisting of factors related to existing source code
complexity, and one of controllable project factors that are believed to affect maintenance costs. While the
current research focuses on assessing the effect of software complexity upon maintenance costs, it is
^A later sensitivity analysis regression using GOTOSTMT instead of GOTOFAR lends credence to the belief that the
excluded branch commands represent a noise factor. The estimated effect of GOTOSTMT had the same relative magnitude as
that of GOTOFAR, but the standard error of the coefficient was four times as large.
^This section draws heavily on work presented in [2].
11

necessary to control for project factors (such as task size and the skill of the developers) known to affect
these costs [16, 24]. The most significant of these is the size of the maintenance task. Excluding task size
or other relevant factors would result in a mis-specification of the model and incorrect inferences about the
impact of software complexity on costs'. To control for this factor and for other project factors known to
affect costs, the research began with a previously-developed economic model of software maintenance.
The initial data collection procedures and model development are described in detail in [18] and [2]. They
will only be summarized here.
Basic maintenance cost model
This model adopts the standard cost model formulation developed in the software engineering literature [3,
7]:
Effon = f (Size. Other Cost Drivers)
Table 4 summarizes the measures of the maintenance function used based upon the model developed in
[2]. The unit of analysis for this model is the project as defined by the research site. Each maintenance
project has its own task requirements and its own budget. Table 5 shows the project factors that are
included in the model for each project. The output of the software maintenance process is the modified
system, and therefore measures of the size of the additions and changes need to be included in the model.
Measures of size in a maintenance context are the size of the ponions of the system that were added or
changed by the maintenance project. While SLOC added or changed is the most widely used measure of
size. Function Points (FPs) added or changed are gaining in acceptance [3] FPs have an additional
advantage of including a measure of task complexity ^^.
'it should be noted that this research's inclusion of factors other than complexity militates against finding any statistical
effect resulting from complexity, in contrast to previous research that examines the effect of complexity without controlling
for other factors. While the model presented does not possess undesirable multicollineanty, no empirical model of this type
has factors that are completely orthogonal. Therefore, inclusion of the other factors parually reduces any effect found for the
complexity factors, making this a conservative test of the complexity hypotheses.
'^^is should not be confused with the application software complexity that is the focus of this research. Task complexity
in Function Points mcludes such factors as whether the project will be held to above average reliability standards, or whether
the operational system will run in a distributed environment
12
The SKILL variable is important, as previous research has found large differences in ability between top
rated developers and poorer ones (7] . All maintainers in the organization at the research site are rated on a
numerical scale, and the measure used in the model is the percentage of hours that were charged to the
project by staff who were highly rated. The SKILL variable is often neglected in research due to the
practical difficulties involved in collecting these data These practical difficulties include the fact that
formal personnel ratings may not always be available, and, even if collected by the organization, may not
be made available to researchers for confidentiality reasons. For the current work strict control over these
data were guaranteed to the research site by the researchers.
A personnel-related variable distinct from ability is LOWEXPER [7, 17]. Even a good developer is at a
disadvantage when faced with an unfamiliar system, as time must be expended in comprehending the
software and becoming famihar witii it.
METHOD, the use of a structured analysis and design methodology, is meant to increase developer
performance. However, previous research has shown that such methods add costs in the short term at this
site [2]. QUALITY may also be important, as it has been suggested that doing a careful job of error-free
programming will cost more than a rushed job, although benefits will be realized in the long term.
Conversely, some researchers believe that careful and systematic programming may not take longer, with
some even arguing that it should be less expensive. The measure used here was one of operational
quahty, the degree to which the system operates smoodily after the maintenance project's changes are
placed into production. The measure was generated from data on abnormal ends and user problem reports
collected on an on-going basis by the research site. Data from the two-month period following
implementation were compared with data from the previous twelve months' trend. Statistically significant
deviations from the previous mean resulted in above or below average operational quality ratings [18].
The RESPONSE variable is included as there has been some evidence that fast-turnaround environments
enhance developer performance, an effect tiiat is likely to be seen in maintenance work as well.
Based upon the software economics literature the effects of these factors are believed to be proportional,
rather than absolute [3, 7]. Thus they are weighted by project size, either FP added or changed or SLOC
13

added or changed, depending on whether they are thought to be associated more strongly with the analysis
/ design phase or with the coding / testing phase of the project [2]. Skill and application experience are
weighted by FPs, as it was believed their impact would be felt most strongly during analysis / design,
where the greatest amount of leverage from capability and experience would be obtained. Use of the
structured analysis / design methodology is also clearly associated with the analysis and design phase,
measured here by FPs. Operational quality was weighted by SLOC, as the types of errors represented by
the operational quality measure used reflect poor coding technique and / or insufficient testing. Response
time was also weighted by SLOC, as it seems more relevant to coding / testing activities than to analysis /
design work since the latter is not dependent upon access to machine cycles. Finally, all complexity
measures are weighted by SLOC since the impact of existing code complexity would be felt most strongly
during coding / testing rather than analysis / design. As noted earher, any collinearity that may exist
between the weighted complexity metrics and other independent variables that have been weighted by
SLOC will cause the model to underestimate the significance of the complexity metric variable. Therefore,
the analysis presented below is a conservative test.
Statistical Model and Results
The previous section described the selection of the variable in the model, including both the existing source
code complexity variables and the project factors. In this section, following a brief description of the
research site, the statistical model and its results are presented, followed by tests of the research
hypotheses.
The Research Site
Data were collected at a major regional bank with a large investment in computer software. The bank's
systems contain over eighteen million Unes of code. Almost all are written in the COBOL programming
language, and are running on large IBM mainframe computers. The software is organized into large
apphcation systems (e.g., Demand Deposits), which have an average size of 226 thousand SLOC^^.
1 iMean = 226 KSLOC, standard deviauon=185 KSLOC, min=54 KSLOC, max = 702 KSLOC.
14
Some of the bank's major application systems were written in the mid-1970's and are generally
acknowledged to be more poorly designed and harder to maintain than recently written software.
Given that COBOL and IBM are the most widely used software and hardware in commercial information
systems, this software environment appears to be a typical commercial data processing environment.
Thus, the research results should apply to other commercial environments, especially those with financial
services transaction processing systems. The projects analyzed were homogeneous in that they all
modified COBOL systems, and therefore the results are not confounded by the effects of multiple
programming languages.
Sixty-five software maintenance projects from seventeen major application systems were analyzed. These
projects were carried out between 1985 and 1987. An average project took about a thousand hours (at an
accounting cost of forty dollars per hour) and added or changed approximately five tiiousand SLOC.
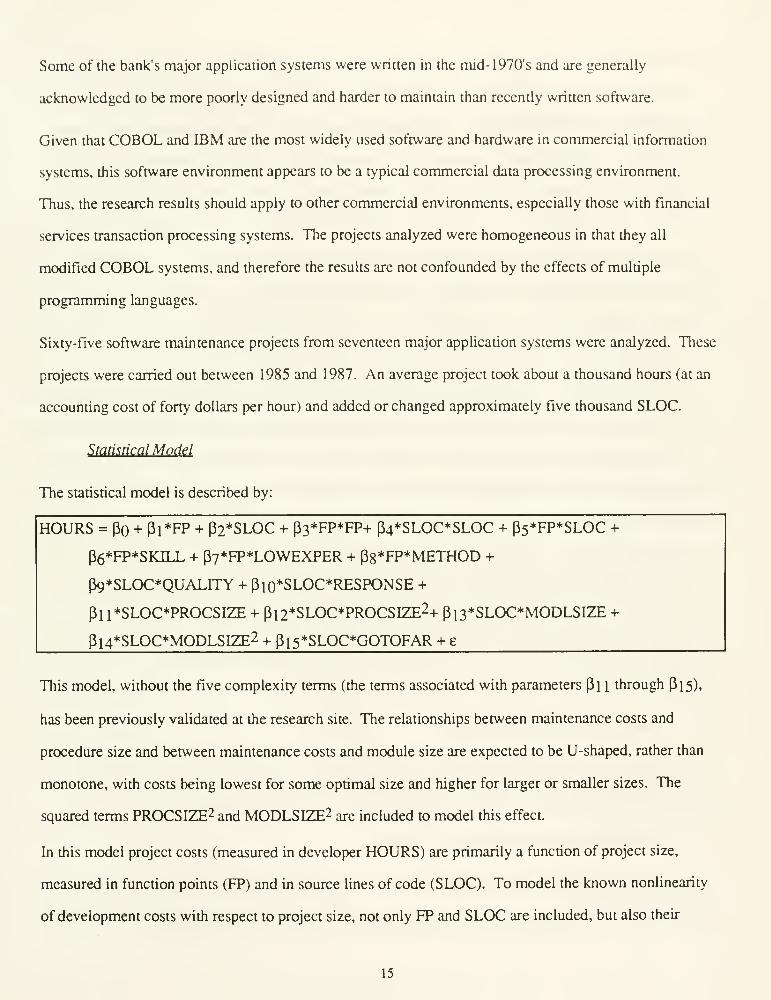
Statistical Model
The statistical model is described by:
HOURS = po + Pl*FP + (32*SLOC + p3*FP*FP+ (34*SLOC*SLOC + p5*FP*SL0C +
p6*FP*SKILL + p7*FP*LOWEXPER + p8*FP*METHOD +
P9*SL0C*QUALITY + Pio*SLOC*RESPONSE +
Pll*SLOC*PROCSIZE + Pi2*SLOC*PROCSIZE2+ pi3*SL0C*M0DLSIZE +
P14*SL0C*M0DLSIZE2 + pi5*SLOC*GOTOFAR + e
This model, without the five complexity terms (the terms associated with parameters Pi i through Pi 5),
has been previously validated at the research site. The relationships between maintenance costs and
procedure size and between maintenance costs and module size are expected to be U-shaped, rather than
monotone, with costs being lowest for some optimal size and higher for larger or smaller sizes. The
squared terms PROCSIZE2 and MODLSIZE2 are included to model this effect.
In this model project costs (measured in developer HOURS) are primarily a function of project size,
measured in function points (FP) and in source lines of code (SLOC). To model the known nonlinearity
of development costs with respect to project size, not only FP and SLOC are included, but also their
15

second-order terms. This approach is expected to result in a high degree of multicollinearity among the
size variables (the terms associated with parameters pi through P5) which will make the interpretation of
their coefficients difficult [3]. The multicoUinearity among the size variables, however, is of no current
concern for examining the current research hypotheses relating to the impact of complexity, since the
complexity variables are not collinear with the size variables. Table 6 presents the summary statistics for
this data set. The values given for the complexity metrics are application system averages.
The model was estimated using Ordinary Least Squares regression, since the OLS assumptions were
satisfied in the context of the estimation. The statistical results from two-tailed tests are presented in Table
7 with the complexity metric variables in bold type. The summary statistical results are as follows:
Fi5,49 = 28.63 (p<.0001), r2= 89.76%, Adjusted r2= 86.62%.
Although not all project factor variables are significant for this sample, none of the project factor variables
are ehminated so as to achieve a more parsimonious fit. The interest in the current research is in assessing
the marginal impact of adding the complexity metrics to an earlier version of the model (see [2]). The
Belsley-Kuh-Welsch multicollinearity diagnostics indicated that the complexity metrics are not
significantly confounded with the other regression variables. Thus, their coefficients may be interpreted
with relative confidence. Also, no significant heteroskedasticity was detected. This supports the decision
to model the complexity effects in the regression as proportional ones rather than use the unweighted
metrics alone. If the complexity effects were not proportional to project magnitude, use of the weighted
metrics would cause the model to overestimate the costs of large projects, resulting in residuals negatively
correlated with size.
Tests of the Research Hypotheses
Hypotfiesis 1 was that maintenance costs would be significantly affected by procedure size. This
hypothesis is confumed by an F-test on the joint effect of the two procedure-size terms:
P(Ho: pll=Pl2=0)<0.0001 as F2,49 =14.20.
A U-shaped relationship between procedure size and software maintenance costs was hypothesized, and
the data confuro this relationship, given that the two coefficients are significantly different than zero and
16

that the linear term is negative and the squared term is positive. The minimum of the U-shaped curve may
be computed by dividing the negated coefficient of the linear term by twice that of the quadratic term'^ .
At this site the minimum-cost procedure size was computed to be (0.0106/(2*0.00012)) = 44 executable
statements per procedure (See Table 7). This value is very close to the mean (43) and to the median (40)
for this organization. However, individual applications vary in average procedure size from 13 to 87
executable statements.
As is often the case in this type of estimation there was a high degree of multicollinearity between the linear
term and the quadratic term. This does not lessen the significance of their joint effect, but it does mean that
the estimates of the two individual coefficients (and hence the minimum point) are to be taken with caution.
To test the robustness of this calculation the analysis was repeated using a model that replaced the linear
and quadratic PROCSIZE terms with two linear variables, representing positive and negative deviations
from a conjecnared optimum respectively'^. This model was repeatedly estimated using a different
conjectured optimum value each time. The results consistently showed cost increases resulting from
deviations in either direction from the minimum point. This sensitivity analysis suppons the results shown
in Table 7 suggesting a bi-directional (U-shaped) relationship.
Hypothesis 2, that costs increase for both large or small values of MODLSIZE, was not supported, as the
conditions described above in the discussion for PROCSIZE were not met. Since the coefficients for both
the linear and quadratic MODLSIZE variables are in the same direction, they are likely picking up each
other's effect, and therefore the individual t-test values are low. However, a hypothesis that maintenance
costs are not significantly affected by module size can be rejected:
P(Ho: Pi3=pi4=0)=0.0076 as F2,49 =5.39
which supports the notion that MODLSIZE, as suggested by previous research, is a variable worthy of
managerial attention. A similar insight is obtained from a simplified version of the model that excludes the
'^This can easily be seen by differentiating with respect to x the quadratic equation y = ax + bxr , and setting dy/dx=
which yields x = -aJ2b .
'^This can be seen as measuring the relationship as a "V" rather than a "U."
17

MODLSIZE^ term. There the coefficient for the SLOC*MODLSIZE term = -.00012, t = -3.32
(p= .0017). This result can be interpreted in the traditional way, that is, the effect at this site tended to be
linear over the observed range of module sizes (controlling for project factors) with costs decreasing as
module size increased^'*.
It should be noted, however, that while these data do not suppon a U-shaped relationship, they are not
necessarily inconsistent with such a hypothesis. The observed linear relationship is consistent with the
data falling on the downward sloping arm of this U, with the possibility that costs would again begin to
rise had sufficiendy large modules been available. Therefore, if there is a U-shaped relationship, the
turning point appears to be outside the range of data collected at this site. Further empirical work at other
research sites will be required for this alternative interpretation to be verified.
Hypothesis 3 was that maintenance costs would be significantly affected by the density of branch
instructions within the modules. This hypothesis is confirmed.
P(Ho: (3i5=0)=0.0021 as U9 = 3.25.
Software maintenance costs are seen to increase linearly with an increase in the number of long GOTO
statements, as defined earlier.
Implications for Software Maintenance Management
Through the above analysis the effect of software complexity upon software maintenance costs has been
estimated. While it is a firmly established article of conventional wisdom that pxxjr programming style and
practices increase programming costs, little empirical evidence has been available to support this notion.
As a result, efforts and investments meant to improve programming practices have relied largely on faith.
The current research has extended an existing model of software maintenance and used it as a vehicle to
confum the significance of the impact of software complexity upon project costs and to estimate its
magnitude.
l'*With this simplified model it is noteworthy that while concern over modularity typically focuses upon large modules, at
this site the systems thai cost more to maintain tended to have modules that were too smaill.
18

This model provides managers with estimates of the benefits of improved programming practices that can
be used to justify investments designed to improve those practices. Given these data and estimates relating
software complexity and costs, the form of the model allows inference about the productivity of software
maintainers. Productivity is typically defined as the ratio of output to input. Since the model controls for
task size (output) variables on the RHS, any LHS increases in required inputs that are associated with
increases in complexity can be interpreted as decreases in productivity. Therefore, the model results may
be interpreted to mean that increased existing software complexity significantly decreases the productivity
ofsoftware maintainers. This result accords with strongly held intuition. The current research also
provides actual estimates of tiie magnitude and significance of this effect, results tiiat have generally not
been available, particularly for commercial applications involving actual maintenance activities and
controlling for project factors believed to affect productivity.
This model enables managers to estimate the benefits of improving software development and maintenance
practices, and to justify investments designed to improve those practices. In the illustrative computations
below, the impact of a one standard deviation change in the value of each of the complexity variables is
computed for a project of 5416 SLOC with average complexity values. The effects of PROCSIZE upon
HOURS is estimated in the regression model as follows:
0.0{)012*PROCSIZE2*SLOC - 0.0106*PROCSIZE*SLOC
Solving this equation once for the mean value of PROCSIZE (43) and once for a one standard deviation
increase in PROCSIZE (to 61), and then subtracting the first result from tiie second results in a difference
of 183.28 hours, or an increase of 20% of the average project cost of 937 hours. The equivalent
calculation for a decrease of one standard deviation in PROCSIZE (to 25) is 25% i^. The calculations for
MODLSIZE and GOTOFAR are similar, and the results are shown in Table 8.
Another way to use the results of die model for managerial planning is to estimate the aggregate cost
impact to the organization of software complexity. To do tiiis a manager might postulate the following
l^Note that these results are not symmetric as the site mean is not identical to the optimum value.
19

question: what would be the estimated cost savings if the more complex systems were improved, not to
some optimal level, but merely to the current average level of all systems?
The measurement of the individual systems and the model can be used to develop such an estimate. The
first step is to note that the current actual projects have an average cost of 937 hours. The second step is to
modify the data set in the following manner: test each of the three complexity variables for each of the sixty
five projects to determine whether it is of higher complexity than average. If yes, replace that value with
the average complexity value. If not, leave it unchanged. Once this transformation of the data is complete,
the model is used to estimate the cost of hypothetical projects based on the transformed data, which gives a
predicted cost of 704 hours for an average project, a twenty-five percent savings over the actual situation.
In order to determine the estimated dollar value to the organization of this reduction in complexity, a
'back-of-the-envelope' calculation of the estimated aggregate possible savings can be done. Two
assumptions are necessary for this calculation to be valid, (1) that the projects studied represent a typical
mix (believed to be the case), and (2) that maintenance projects represent seventy percent of the budget
(also true for this site). The result is that improving the site's more poorly written systems, not to
optimality, but merely to the level of the site's average complexity, could result in an aggregate savings of
more than seventeen percent (.25 * .7) of the applications software budget, which at this site translates into
a savings of several million dollars in the year following such an improvement.
These quantified impacts of complexity can help software maintenance managers make informed decisions
regarding preferred managerial practice. For example, one type of decision that could be aided by such
information is the purchase of CASE tools for code restructuring. The benefits of these tools have
generally had to be taken on faith. The current analysis, however, indicates that the magnitude of the
economic impact of software complexity is sufficienUy great that many organizations may be able to justify
the purchase and implementation of CASE tools for code restrucmring on the basis of these estimated
benefits.
More generally, a common belief in the long-term importance of good programming practice has not been
powerful enough to stand in the way of expedience when "quick-and-dirty" programming has been
20
perceived to be needed immediately. An awareness of the magnitude of the cost of existing software
complexity can combat this tendency. Tlie cost of software complexity at this research site is the legacy of
the practices of previous years.
Taken together these ideas show how, through the use of the model developed here, managers can make
decisions today on systems design, systems development, and tool selection and purchase that depend
upon system values that will affect/wrure maintenance. This model can be a valuable addition to the
traditional exclusive emphasis on software development project schedules and budgets because it allows
for the estimation of full life-cycle costs. Given the significant percentages of systems resources devoted
to maintenance, improving managers' ability to forecast these costs will allow them to be properly
weighted in current decision making.
As with any empirical study some limitations of these research results must be observed. The results were
found to exist in a site which, due to its size, software tools, hardware tools, and application type, is
typical of a large number of commercial information systems applications, particularly financial transaction
processing systems. However, additional studies at other sites, especially maximally dissimilar sites with
applications such as real-time command and control applications should be done before claims can be made
about the overall generalizability of these results. Also, values of specific parameters, such as the optimal
number of SLOC / module, are likely to differ with different programming languages^^, particularly non-
third generation languages.
In summary, this research suggests that considerable economic benefits can be expected from adherence to
appropriate programming practices. In particular, aspects of modem programming practice, such as the
maintenance of moderate procedure size and the avoidance of long branching, seem to have great benefits.
The informed use of tools or techniques that encourage such practices should have a positive net benefit.
'^Although ii is interesting to note that the optimal value of statements / module found here for COBOL code, 44, is similar
to the maximum size heuristic used at Toshiba in Japan for Fortran code, 50 (See K. Matsumura, K. Furuya, A. Yamashiro
and T. Obi, Trend toward Reusable Module Component: Design and Coding Technique 50SM, Proceedings of the llih
Annual International Computer Software & Applications Conference (COMPSAC), (October 7-9 1987, Tokyo, Japan), pp.
45-52.
21

Concluding Remarks
This study has investigated the links between software complexity and software maintenance costs. On
the basis of an analysis of software maintenance projects in a commercial application environment, it was
confirmed that software maintenance costs are significantly affected by the levels of existing software
complexity. In this study, software maintenance costs were found to increase with increases in the
complexity of a system's implementation, as measured by its average procedure size, average module size,
and its branching complexity.
Historically, most models of software economics have focused on new development. Therefore, they have
not used software complexity metrics. After controlling for project factors believed to affect maintenance
costs, the analysis at this site suggests that high levels of software complexity account for approximately
twenty-five percent of maintenance costs or more than seventeen percent of total life-cycle costs. Given
the extremely large dollar amounts spent on maintenance in commercial applications, the neglect of
software complexity is potentially a serious omission.
The results presented here are based upon a detailed analysis of maintenance costs at a site judged to be
typical of traditional transaction processing environments. These types of environments account for a
considerable percentage of today's software maintenance costs. Based upon this analysis, the aggregate
cost of poor programming practice for industry as a whole are likely to be substantial.
22


Table 2: Source Code Definitions
Level
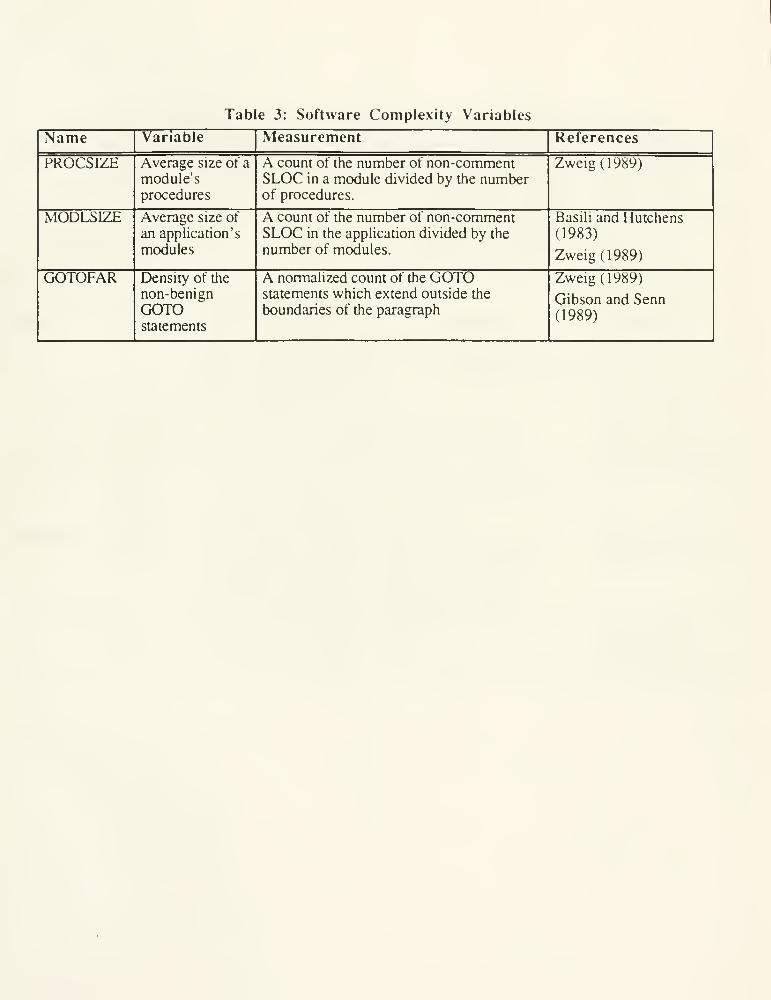
Table 3: Software Complexity Variables
Name

Table 4: Cost Drivers
Activity

Table 5: Maintenance Model Project Factor Variables [2]
Name

Table

TabI

Table 8: Estimated cost impacts
Name
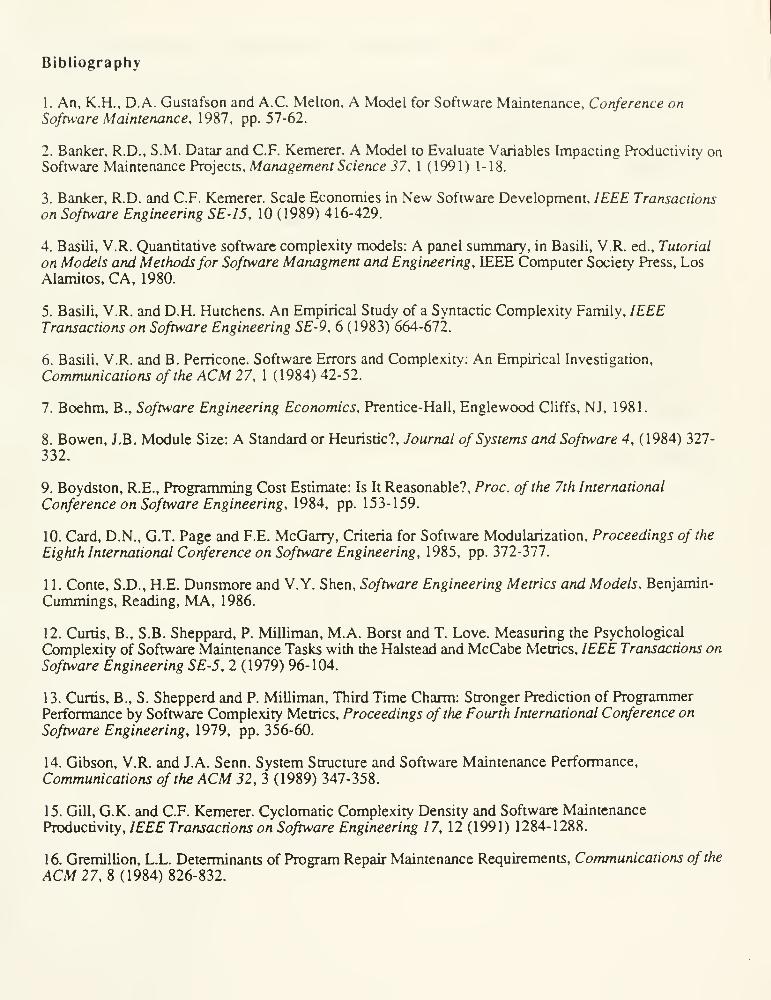
Bibliography
1. An, K.H., D.A. Gustafson and A.C. Melton, A Model for Software Maintenance, Conference onSoftware Maintenance, 1987, pp. 57-62.
2. Banker, R.D., S.M. Datar and C.F. Kemerer. A Model to Evaluate Variables Impacting Productivity onSoftware Maintenance Projects, Management Science 37, 1 (1991) 1-18.
3. Banker, R.D. and C.F. Kemerer. Scale Economies in New Software Development, IEEE Transactions
on Software Engineering SE-15, 10 (1989) 416-429.
4. Basili, V.R. Quantitative software complexity models: A panel summary, in Basili, V.R. ed.. Tutorial
on Models and Methods for Software Managment and Engineering, IEEE Computer Society Press, Los
Alamitos, CA, 1980.
5. Basili, V.R. and D.H. Hutchens. An Empirical Study of a Syntactic Complexity Family, IEEETransactions on Software Engineering SE-9, 6 (1983) 664-672.
6. Basili, V.R. and B. Perricone. Software Errors and Complexity: An Empirical Investigation,
Communications of the ACM 27, 1 (1984) 42-52.
7. Boehm, B., Software Engineering Economics, Prentice-Hall, Englewood Cliffs, NJ, 1981.
8. Bowen, J.B. Module Size: A Standard or Heuristic?, Journal of Systems and Software 4, (1984) 327-
332.
9. Boydston, R.E., Programming Cost Estimate: Is It Reasonable?, Proc. of the 7th International
Conference on Software Engineering, 1984, pp. 153-159.
10. Card, D.N., G.T. Page and F.E. McGarry, Criteria for Software Modularization, Proceedings of the
Eighth International Conference on Software Engineering, 1985, pp. 372-377.
1 1. Conte, S.D., H.E. Dunsmore and V.Y. Shen, Software Engineering Metrics and Models, Benjainin-
Cummings, Reading, MA, 1986.
12. Curtis, B., S.B. Sheppard, P. Milliman, M.A. Borst and T. Love. Measuring the Psychological
Complexity of Software Maintenance Tasks with the Halstead and McCabe Metrics, IEEE Transactions on
Software Engineering SE-5, 2 (1979) 96-104.
13. Curtis, B., S. Shepperd and P. Milliman, Third Time Charm: Stronger Prediction of Programmer
Performance by Software Complexity Metrics, Proceedings of the Fourth International Conference on
Software Engineering, 1979, pp. 356-60.
14. Gibson, V.R. and J.A. Senn. System Structure and Software Maintenance Performance,
Communications of the ACM 32, 3 (1989) 347-358.
15. Gill, G.K. and C.F. Kemerer. Cyclomatic Complexity Density and Software Maintenance
Productivity, IEEE Transactions on Software Engineering 17, 12 (1991) 1284-1288.
16. Gremillion, L.L. Determinants of Program Repair Maintenance Requirements, Communications of the
/iCM 2 7, 8(1984)826-832.

17. Jeffery, D.R. and M.J. Lawrence. Managing Programming Productivity, Journal of Systems andSoftwares. (1985)49-58.
18. Kemerer, C.F., Measurement of Software Development Produciivitw Carnegie Mellon University
Ph.D. thesis, 1987.
19. Korson, T.D. and V.K. Vaishnavi. An Empirical Study of the Effects of Modularity on ProgramModifiability, in Soloway, E. and S. Iyengar ed.. Empirical Studies of Programmers, Ablex Publishing
Co., 1986.
20. Lind, R. and K. Vairavan. An Experimental Investigation of Software Metrics and their Relationship
to Software Development Effon, IEEE Transactions on Software Engineering 15, 5 (1989) 649-653.
21. Munson, J.C. and T.M. Khoshgoftaar, The Dimensionality of Program Complexity, Proceedings oftfie International Conference on Software Engineering, 1989, pp. 245-253.
22. Schneidewind, N.F. The State of Software Maintenance, IEEE Transactions on Software Engineering
S£-/J, 3(1987) 303-310.
23. Vessey, I. and R. Weber. Some Factors Affecting Program Repair Maintenance: An Empirical Study,
Communications of the ACM 26, 2 (1983) 128-134.
24. Vessey, I. and R. Weber. Research on Structured Programming: An Empiricist's Evaluation, IEEETransactions on Software Engineering SE-IO, 4 (1984) 394-407.
25. Zweig, D., Software Complexity and Maintainability, Carnegie Mellon University Doctoral
dissenation thesis, 1989.

Table

Bibliography
1. An, K.H., D.A. Gustafson and A.C. Melton, A Model for Software Maintenance, Conference on
Software Maintenance, l^^l , pp. 57-62.
2. Banker, R.D., S.M. Datar and C.F. Kemerer. A Model to Evaluate Variables Impacting Productivity on
Software Maintenance Projects, A/artagemertr5c/ertce i7, 1 (1991) 1-18.
3. Banker, R.D. and C.F. Kemerer. Scale Economies in New Software Development, IEEE Transactions
on Software Engineering SE-15, 10 (1989) 416-429.
4. Basili, V.R. Quantitative software complexity models: A panel summary, in Basili, V.R. ed.. Tutorial
on Models and Methods for Software Managment and Engineering, IEEE Computer Society Press, LosAlamitos, CA, 1980.
5. Basili, V.R. and D.H. Hutchens. An Empirical Study of a Syntactic Complexity Family, IEEETransactions on Software Engineering SE-9, 6 (1983) 664-672.
6. Basili, V.R. and B. Perricone. Software Errors and Complexity: An Empirical Investigation,
Communications of the ACM 27, 1 (1984) 42-52.
7. Boehm, B., Software Engineering Economics, Prentice-Hall, Englewood Cliffs, NJ, 1981.
8. Bowen, J.B. Module Size: A Standard or Heuristic?, Journal of Systems and Software 4, (1984) 327-
332.
9. Boydston, R.E., Programming Cost Estimate: Is It Reasonable?, Proc. of the 7th International
Conference on Software Engineering, 1984, pp. 153-159.
10. Card, D.N., G.T. Page and F.E. McGarry, Criteria for Software Modularization, Proceedings of the
Eighth International Conference on Software Engineering, 1985, pp. 372-377.
11. Conte, S.D., H.E. Dunsmore and V.Y. Shen, Software Engineering Metrics and Models, Benjamin-
Cummings, Reading, MA, 1986.
12. Curtis, B., S.B. Sheppard, P. Milliman, M.A. Borst and T. Love. Measuring the Psychological
Complexity of Software Maintenance Tasks with the Halstead and McCabe Metrics, lEE'I Transactions onSoftware Engineering SE-5, 2 (1979) 96-104.
13. Curtis, B., S. Shepperd and P. Milliman, Third Time Charm: Stronger Prediction of ProgrammerPerformance by Software Complexity Metrics, Proceedings oftfie Fourth International Conference on
Software Engineering, 1979, pp. 356-60.
14. Gibson, V.R. and J.A. Senn. System Structure and Software Maintenance Pert'ormance,
Communications of the ACM 32, 3 (1989) 347-358.
15. Gill, G.K. and C.F. Kemerer. Cyclomatic Complexity Density and Software MaintenanceProductivity, IEEE Transactions on Software Engineering 17, 12 (1991) 1284-12S8.
16. GremiUion, L.L. Determinants of Program Repair Maintenance Requirements, Communications of the
ACM 27,^ (1984)826-832.
1
64 10 ''^ ^


Date Due
Lib-26-67

M| l/BRARIF^ Dlir
3 ^OflO 0D??0flT7 S


![When do Software Complexity Metrics Mean Nothing? do Software Complexity Metrics Mean ... and Hassan [40] ask whether code metrics are affected by ... When do Software Complexity Metrics](https://img.pdfslide.us/doc/110x75/5ab63d137f8b9ab47e8da4f2/when-do-software-complexity-metrics-mean-nothing-do-software-complexity-metrics.jpg)