Embed Size (px)
Citation preview

REPORT DOCUMENTATION PAGE Form Approved
OMB No. 0704-0188 Public reporting burden for this collection of information is estimated to average 1 hour per response, including the time for reviewing instructions, searching existing data sources, gathering and maintaining the data needed, and completing and reviewing this collection of information. Send comments regarding this burden estimate or any other aspect of this collection of information, including suggestions for reducing this burden to Department of Defense, Washington Headquarters Services, Directorate for Information Operations and Reports (0704-0188), 1215 Jefferson Davis Highway, Suite 1204, Arlington, VA 22202-4302. Respondents should be aware that notwithstanding any other provision of law, no person shall be subject to any penalty for failing to comply with a collection of information if it does not display a currently valid OMB control number. PLEASE DO NOT RETURN YOUR FORM TO THE ABOVE ADDRESS.
1. REPORT DATE (DD-MM-YYYY) 24 September 2015
2. REPORT TYPETech Paper
3. DATES COVERED (From - To) 10 August 2015 – 24 September 2015
4. TITLE AND SUBTITLE Air Force Dynamic Mechanical Analysis Testing of NATO Round Robin Propellant Testing for Development of AOP-4717
5a. CONTRACT NUMBER
5b. GRANT NUMBER
5c. PROGRAM ELEMENT NUMBER
6. AUTHOR(S) Miller, Timothy C.
5d. PROJECT NUMBER
Ruth, Patrick N. 5e. TASK NUMBER
5f. WORK UNIT NUMBER Q16H
7. PERFORMING ORGANIZATION NAME(S) AND ADDRESS(ES) 8. PERFORMING ORGANIZATION REPORT NO.
Air Force Research Laboratory (AFMC) AFRL/RQRP 10 E. Saturn Blvd Edwards AFB, CA 93524-7680
9. SPONSORING / MONITORING AGENCY NAME(S) AND ADDRESS(ES) 10. SPONSOR/MONITOR’S ACRONYM(S) Air Force Research Laboratory (AFMC) AFRL/RQR 11. SPONSOR/MONITOR’S REPORT
5 Pollux Drive NUMBER(S)
Edwards AFB, CA 93524-7048 AFRL-RQ-ED-TP-2015-318 12. DISTRIBUTION / AVAILABILITY STATEMENT Approved for public release; distribution unlimited 13. SUPPLEMENTARY NOTES For presentation at NATO A/C 326 Working Group Meeting; U.S. Army Research, Development and Engineering Command, Huntsville, Alabama; 22-24 Sep 2015 PA Case Number: #15481; Clearance Date: 9/3/2015
14. ABSTRACT
In late July and early August of 2015, the Air Force Research Laboratory (Propulsion Division) performed testing on an inert propellant previously provided by Naval Air Warfare Center Weapons Division (NAWCWD). The purpose of the tests was to participate in an international round robin that would have as its main goal standardization of dynamic mechanical analysis (DMA) testing of solid rocket propellants. The standardization of these types of tests (as they apply to propellants) will become part of AOP-4717, an overarching NATO document that includes other propellant testing protocols. Due to resource limitations, the reduced protocol was followed. The tests are best described in two parts: the following section describes the strain sweep tests, which are a necessary precursor to the frequency sweep tests. After these strain sweep tests are described, the frequency sweep tests are explained. Since the experimental apparatus is common to both test types, however, this is described next. 15. SUBJECT TERMS N/A
16. SECURITY CLASSIFICATION OF:
17. LIMITATION OF ABSTRACT
18. NUMBER OF PAGES
19a. NAME OF RESPONSIBLE PERSON
T. Miller
a. REPORT Unclassified
b. ABSTRACT Unclassified
c. THIS PAGE Unclassified
SAR 15 19b. TELEPHONE NO
(include area code)
N/A Standard Form
298 (Rev. 8-98) Prescribed by ANSI Std. 239.18

Approved for public release; distribution unlimited. Public Affairs Clearance Number XXXXX.
Air Force Dynamic Mechanical Analysis Testing of NATO Round Robin Propellant Testing for Development of AOP-4717
Timothy C. Miller, Air Force Research Laboratory
Patrick N. Ruth, ERC Incorporated
August 2015

1
Introduction
In late July and early August of 2015, the Air Force Research Laboratory (Propulsion Division) performed testing on an inert propellant previously provided by Naval Air Warfare Center Weapons Division (NAWCWD). The purpose of the tests was to participate in an international round robin that would have as its main goal standardization of dynamic mechanical analysis (DMA) testing of solid rocket propellants. The standardization of these types of tests (as they apply to propellants) will become part of AOP-4717, an overarching NATO document that includes other propellant testing protocols. Due to resource limitations, the reduced protocol was followed. The tests are best described in two parts: the following section describes the strain sweep tests, which are a necessary precursor to the frequency sweep tests. After these strain sweep tests are described, the frequency sweep tests are explained. Since the experimental apparatus is common to both test types, however, this is described next.
Experimental Details: The test laboratory is located at Edwards Air Force Base near Boron, California. The laboratory is air conditioned, but the temperature and relative humidity vary significantly, especially during this set of tests, which took place when thunderstorms and rain affected the humidity levels in the lab. The specimens were all kept on the lab bench next to the Q800 (the testing machine), so their environment (prior to testing) varied with the lab conditions. Immediately prior to testing, the lab relative humidity and temperature were recorded (see the chart below). This, however, only gives the conditions just prior to testing – if high humidity levels have affected the specimens, the data in the table may not show this effect. Because all of the strain sweep tests were performed on one day, there is only one set of environmental data in the table below.
Table 1 -- Lab conditions for each of the tests
Specimen name Test type Relative Humidity Temperature (deg C)
20140724A
Strain sweep 53.5 18.1 20140724B
20140724C
20140724D
Frequency sweep
73.3 20.6
20140724E 61.8 21.5
20140724F 52.8 19.6
The test apparatus was a TA Instruments Q800 Dynamic Mechanical Analyzer. The instrument is installed on a vibration-isolation table made of concrete and with four rubber vibration absorption bushings mounted between the tabletop and the two trestle-type legs. A double cantilever beam (DCB) fixture supplied by TA Instruments was used for all the tests. Cooling is provided by a Gas Cooling Accessory (GCA), which supplies liquid nitrogen on demand to the Q800 for use at subambient temperatures. The Q800, the vibration isolation table, and a close-up of the DCB fixture are shown in the figure below.

2
Figure 1 -- The TA Instruments Q800 and a close-up of the dual cantilever beam fixture
The instrument is run with Advantage for Q Series software version 2.5.0.256 run from a Windows-based laptop. The software allows the user to do calibrations of various types, such as electronics, position, force, and clamp calibrations. One day prior to testing, all of these calibrations were performed on the apparatus and reasonable results were obtained – the apparatus remained on during the whole suite of tests and the original calibrations were used throughout.
Three specimens were used in each portion of the testing program (three for strain sweeps and three for frequency sweeps). The specimen slab was milled flat to a nominal thickness of 4 mm the day prior to testing, and the specimens were hand cut from this slab. Since the glass beads (a substitute for particulate matter made during mixing of inert propellants) were 350 μm in diameter, the specimen thicknesses were more than ten times this critical diameter, so continuum mechanics may be assumed applicable. Below is a picture of the milled slab and the specimens immediately after hand cutting:
Figure 2 -- Milled slab and slab cut into specimens
3
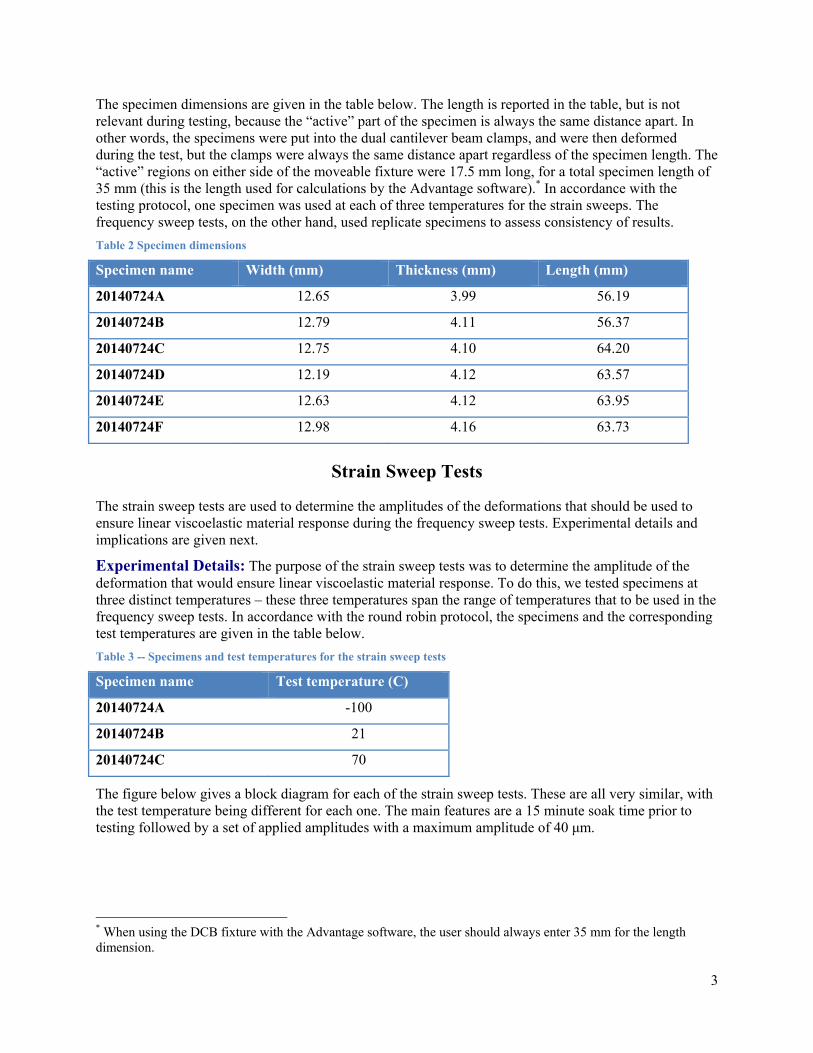
The specimen dimensions are given in the table below. The length is reported in the table, but is not relevant during testing, because the “active” part of the specimen is always the same distance apart. In other words, the specimens were put into the dual cantilever beam clamps, and were then deformed during the test, but the clamps were always the same distance apart regardless of the specimen length. The “active” regions on either side of the moveable fixture were 17.5 mm long, for a total specimen length of 35 mm (this is the length used for calculations by the Advantage software).* In accordance with the testing protocol, one specimen was used at each of three temperatures for the strain sweeps. The frequency sweep tests, on the other hand, used replicate specimens to assess consistency of results.
Table 2 Specimen dimensions
Specimen name Width (mm) Thickness (mm) Length (mm)
20140724A 12.65 3.99 56.19
20140724B 12.79 4.11 56.37
20140724C 12.75 4.10 64.20
20140724D 12.19 4.12 63.57
20140724E 12.63 4.12 63.95
20140724F 12.98 4.16 63.73
Strain Sweep Tests
The strain sweep tests are used to determine the amplitudes of the deformations that should be used to ensure linear viscoelastic material response during the frequency sweep tests. Experimental details and implications are given next.
Experimental Details: The purpose of the strain sweep tests was to determine the amplitude of the deformation that would ensure linear viscoelastic material response. To do this, we tested specimens at three distinct temperatures – these three temperatures span the range of temperatures that to be used in the frequency sweep tests. In accordance with the round robin protocol, the specimens and the corresponding test temperatures are given in the table below.
Table 3 -- Specimens and test temperatures for the strain sweep tests
Specimen name Test temperature (C)
20140724A -100
20140724B 21
20140724C 70
The figure below gives a block diagram for each of the strain sweep tests. These are all very similar, with the test temperature being different for each one. The main features are a 15 minute soak time prior to testing followed by a set of applied amplitudes with a maximum amplitude of 40 μm.
* When using the DCB fixture with the Advantage software, the user should always enter 35 mm for the length dimension.
4
Figure 3 -- Block diagrams for Q800 DMA control for strain sweep tests
Discussion and results: As stated above, the main reason for the strain sweep tests is to determine proper test conditions for the frequency sweep tests. By applying incrementally higher displacement amplitudes, the experimenter can determine at what displacement the specimen starts to deviate from linear viscoelastic behavior.
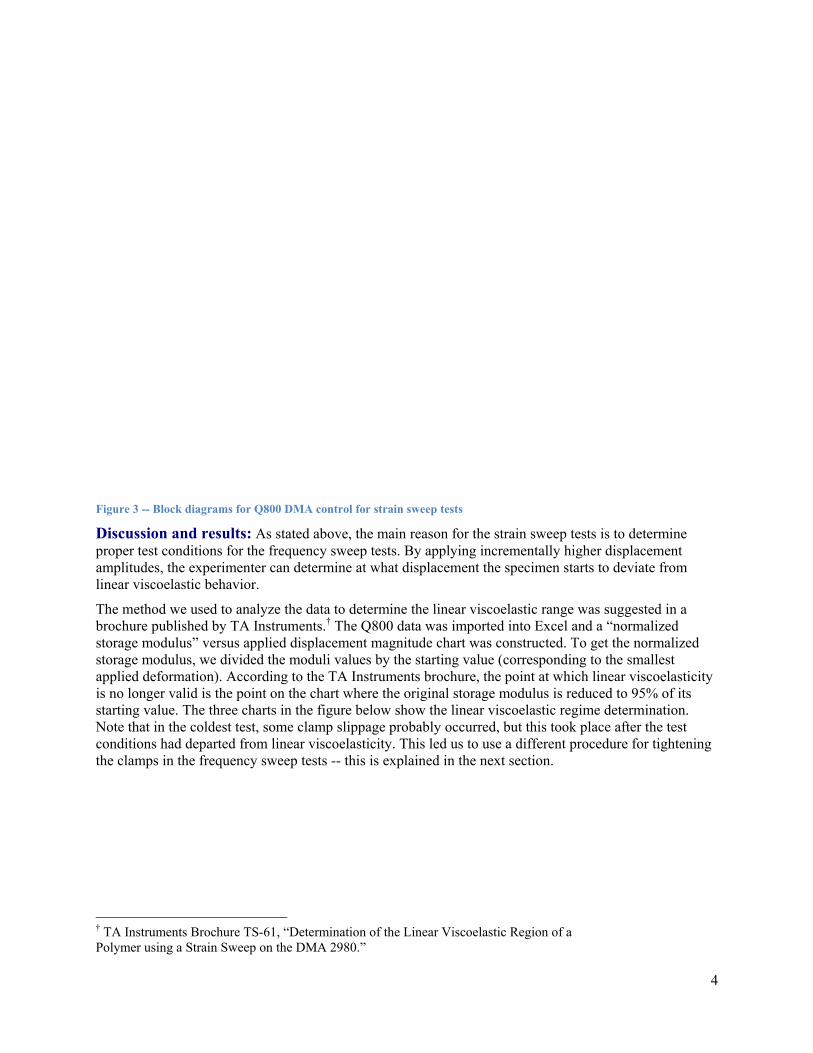
The method we used to analyze the data to determine the linear viscoelastic range was suggested in a brochure published by TA Instruments.† The Q800 data was imported into Excel and a “normalized storage modulus” versus applied displacement magnitude chart was constructed. To get the normalized storage modulus, we divided the moduli values by the starting value (corresponding to the smallest applied deformation). According to the TA Instruments brochure, the point at which linear viscoelasticity is no longer valid is the point on the chart where the original storage modulus is reduced to 95% of its starting value. The three charts in the figure below show the linear viscoelastic regime determination. Note that in the coldest test, some clamp slippage probably occurred, but this took place after the test conditions had departed from linear viscoelasticity. This led us to use a different procedure for tightening the clamps in the frequency sweep tests -- this is explained in the next section.
† TA Instruments Brochure TS-61, “Determination of the Linear Viscoelastic Region of a Polymer using a Strain Sweep on the DMA 2980.”
5
Figure 4 -- Normalized storage modulus vs. displacement amplitude
The storage, loss, and complex moduli for the three test temperatures are shown in the figure below. Again, the slippage in the clamps at the low temperature may have invalidated some of the data for the -100 C specimen, but the other specimens gave good results. Since the purpose of the tests was to determine the range of viscoelasticity, the slippage did not affect our conclusions, so it was not overly troublesome. The most important figure for the strain sweep tests is Figure 4, because it was used to determine the proper amplitudes for subsequent (frequency sweep) tests. In actuality, the graphs themselves were not used – instead, the corresponding data was used with linear interpolation to get the appropriate values at which the storage modulus had dropped to 95% of its original value. This is somewhat more exact than using the graphs. The interpolated values are given in the table below. Based on this table, we decided to use a displacement amplitude of 2.10 μm for the strain sweeps – this is a value that is only very slightly less than the most conservative value found and shown in the table.‡ The frequency sweep tests are described in the next section.
Table 4 -- Oscillatory amplitude determinations from strain sweep tests
Test condition (C) Upper limit for amplitude for linear viscoelasticity (μm)
-100 2.15
+21 3.58
+70 7.06
‡ The strain in a DCB specimen is related linearly to the displacement at the midpoint, but the relationship is not simple to derive – the software corrects for influences of shear, for example. For comparison with other DMA test specimens, a 2.10 μm displacement induces a strain of about 0.006 m/m.

6
Figure 5 -- storage, loss, and complex moduli for the strain sweep tests at the three test temperatures
0
1000
2000
3000
4000
5000
0.00 0.05 0.10 0.15
Modulus (M
Pa)
strain (%)
‐100 C test condition
storage modulus
loss modulus
complex modulus
0
5
10
15
20
25
30
35
40
0.00 0.02 0.04 0.06 0.08 0.10 0.12 0.14
Modulus (M
Pa)
strain (%)
+21 C test condition
storage modulus
loss modulus
complex modulus
0
5
10
15
20
25
0.00 0.02 0.04 0.06 0.08 0.10 0.12 0.14
Modulus (M
Pa)
strain (%)
+70 C test condition
storage modulus
loss modulus
complex modulus

7
Frequency Sweep Tests
Having determined the amplitude (2.10 μm) for deformations from the previous tests, the frequency sweep tests were performed next.
Experimental Details: Frequency sweep testing was performed on the inert propellant previously provided by NAWCWD for the international round robin. The hardware and software were identical to that previously described. During frequency sweep testing, we used a different procedure to tighten the clamps. This is described next.
First, the test applies different frequencies at a large range of temperatures – from -110 C to 70 C in 2 C increments, with a soak time of 60 seconds at each temperature. Because of this, the test took many hours (more than eight) and so it was possible to run only one test per day. This meant that our lab conditions varied somewhat from test to test. The relative humidity in the lab just prior to testing each specimen varied from about 50-75% (see Table 1, page 1 for exact numbers).
During the strain sweep tests described in the previous section, at the coldest temperature, the specimen seemed to slip in the clamps – this is inferred from the data for storage modulus at -100 C (Figure 5, page 6). The probable cause is the differential contraction of the sample and clamps as the temperature drops. While the clamps are tight at ambient temperature, as the temperature drops, the fixture contracts, but the polymer specimen contracts much more, leading to a loosening of the specimen in the grips.
To solve this problem, we experimented with different procedures using a separate (non-round-robin) set of specimens. What we arrived at for a satisfactory procedure was this: Just prior to any frequency sweep test, the specimen was mounted very loosely in the fixture, the furnace was closed, and the chamber was ramped down to the lower test temperature (-110 C) at a rate of 10 C/min and then held at that temperature for 10 minutes. After this, the furnace was opened and the clamps were tightened to 6 in-lb of torque. At the end of the tests, we examined the specimens for either excessive deformation at the clamps or overly loose clamps and found them to be reasonably tight, but not excessively -- so we used this procedure for all of the round-robin frequency sweep tests. The specimens were always reasonably tightened in the clamps when inspected at ambient temperatures the day after each of the tests.
In addition to the clamping issue, another concern arose because of the test duration. To achieve sub-ambient temperatures, the Q800 uses a Gas Cooling Accessory – essentially an automated dewar that supplies liquid nitrogen to the Q800 for cooling. Due to the low temperatures in the protocol and the length of the test, we were concerned that the Q800 would run out of liquid nitrogen in mid-test. The test sequence was modified so that the GCA would fill up at the start and also so that it would refill in mid-test if necessary. We found out during testing that the GCA had just enough nitrogen to finish each of the tests. Therefore, although this was a concern, in the end this did not affect the test results. The block diagram for the frequency sweep test is given below.

8
Figure 6 -- Block diagram used for frequency sweeps
Discussion and results: The results are shown in the following figures, each of which gives the storage modulus, loss modulus, and tan delta function (all on one graph) for each of the samples. In each graph, the tan delta function is mapped to the right hand axis and the moduli are mapped to the left.

9
Figure 7-- Viscoelastic properties for the frequency sweep tests (one graph per specimen)

10
As for the peaks of the tan delta function, these were found using data from the Excel spreadsheet and noting the highest local value. For each specimen, the temperatures at these peaks is given below -- the α peak corresponds to the glass transition temperature.
Table 5 -- Tan delta peak determinations
Specimen name α peaks (deg C) β peaks (deg C)
0.1 Hz 1.0 Hz 10 Hz 0.1 Hz 1.0 Hz 10 Hz
20140724D -48.0 -48.0 -48.0 -74.0 -70.0 -64.0
20140724E -48.0 -48.0 -48.0 -74.0 -70.0 -64.0
20140724F -48.0 -48.0 -46.0 -74.0 -70.0 -64.0
The step-wise temperature nature of the frequency sweep tests employed here gives superior mechanical properties for a master curve, but does so at the expense of resolution of the tan delta peaks. This is discussed in the TA Instruments literature, which also says that a continuous temperature sweep test (at a single frequency) can resolve the peaks more closely. Obviously, the tests we performed could only determine the Tg peak with a 2 deg C resolution (because that was the incremental temperature step).
This is not important with the β peaks, because they are sufficiently broad to be adequately characterized with the step-wise process. To see how the procedures compared for α peak detection, we performed an auxiliary test on a TMA (thermo-mechanical analyzer) apparatus. Briefly, the TMA apparatus (a Q400 from TA Instruments) uses similar software, and incremented the temperature continuously while maintaining a frequency of 0.1 Hz throughout the test. Temperature ranges were limited due to lack of liquid nitrogen for this particular setup. Another difference was the fixturing – the TMA used a small cylindrical specimen (about 8.5 mm in diameter and 4 high)§ – this was loaded in compression using an expansion type probe.
The figure below shows one test result from the TMA for a range of temperatures that was insufficient to show the β peak, but that shows the α peak quite well – and confirms that the data in Table 5 is accurate. The data is the dimension change (due to expansion) of the 4 mm high specimen during the 0.1 Hz oscillatory temperature sweep test. The data in the figure supports the data in the table above.
§ The TMA specimen was cut directly from one of the NATO DMA specimens used in the strain sweep tests at 21 C. Because it was deformed beyond the linear viscoelastic range, the storage and loss moduli may not be directly comparable to the frequency sweep tests we performed.

11
Figure 8 -- Use of an expansion probe and a thermomechanical analyzer to find the glass transition temperature.
This experiment raised additional questions, however, because the graphs for storage modulus, loss modulus, and tan delta from the TMA tests were qualitatively very similar to our test results, but the absolute values varied significantly. One possible explanation is that the TMA specimen was cut directly from one of the NATO DMA specimens used in the strain sweep tests at 21 C. Because it was deformed beyond the linear viscoelastic range during the strain sweep test, the storage and loss moduli (and perhaps the tan delta function) may not be directly comparable to the frequency sweep tests. Another possible explanation is that the experimental setup is less rigorous in the TMA test. For example, the probe does not uniformly compress the entire top of the specimen), so, moduli (which are based on accurate assessments of stress and strain) may be incorrect.
As far as repeatability is concerned, the graphs in Figure 7 show excellent reproducibility. However, it is difficult to observe this well, because of the dense nature of the information presented. To better show repeatability, we took the storage modulus, the loss modulus, and the tan delta function for a single frequency (1 Hz) and compared results from all three frequency-sweep specimens in the figure below. Although the results appear excellent, the two moduli graphs have log plots on the ordinate axis. A more careful examination will show significant deviations for the storage modulus on the “upper shelf” (below about -80 C). The between-specimen variability for the loss modulus and tan delta function is insignificant.**
** The best way to examine repeatability is to graph the various parameters on linear, rather than log scales.

12
Figure 9 -- DMA parameters for 1.0 Hz oscillations

13
Summary and Conclusions
Since the purpose of this set of tests was to help derive a standard for NATO use, the more important conclusions will only be apparent after comparison with work from other laboratories. However, the derivation of storage modulus, loss modulus, and the tan delta function, carried out on a propellant using the dynamic mechanical analysis method, gave reproducible and logical results, which will be used for comparison with round robin results from other laboratories. The most important findings are summarized here:
When making the specimens for dual cantilever beam fixtures, one important consideration is uniform thickness – machining to a uniform thickness before cutting the specimens from a common slab can enhance reproducibility.
The linear viscoelasticity regime can be discerned by comparing normalized storage moduli values over a range of deformations and finding the threshold at which the normalized value drops to 95% of the starting value.
Clamping tension is not guaranteed when testing using frequency sweeps over a wide range of temperatures unless a procedure is used that ensures the clamps are tight at the coldest temperature.
Long tests such as the frequency sweep sequences prescribed in this round robin may be problematic for the Q800 due to lack of sufficient reserve of liquid nitrogen in the gas cooling accessory.
Determination of Tg by locating the peak of the tan delta function was very repeatable and consistent with thermomechanical analysis results from another device.
The β peaks varied with frequency but were repeatable for a given frequency. For the α peaks, there was no significant frequency effect.
Of the three pertinent parameters (storage modulus, loss modulus, and tan delta), only the storage modulus showed variability issues, and that only took place on the “upper shelf” (below about -80 C).