Embed Size (px)
Citation preview
For more information visit www.neuropt.org or email [email protected]
1. REHAB MEASURES: ACTION RESEARCH ARM TEST
Available at the Internet Stroke Center (External Link)
Title of Assessment Action Research Arm Test
Acronym ARAT
Instrument Reviewer(s)
Initially reviewed by the Rehabilitation Measures Team in 2011; Updated by Cara Weisbach, PT, DPT and Wendy Romney, PT, DPT, NCS and the SCI EDGE task force of the Academy of Neurologic Physical Therapy - a component of APTA with references from the chronic stroke population in 2012; Updated by Irene Ward, PT, DPT, NCS and the TBI EDGE task force of the Academy of Neurologic Physical Therapy - a component of APTA in 2012; Updated by Maggie Bland PT,DPT,NCS and Nancy Byl PT,MPH,PhD, FAPTA and the STROKEDGE II Task Force of the Academy of Neurologic Physical Therapy - a component of APTA in 2016.
Summary Date 4/4/2016
Purpose Assesses upper limb functioning using observational methods
Description The ARAT's is a 19 item measure divided into 4 sub-tests (grasp, grip, pinch, and gross arm movement). Performance on each item is rated on a 4-point ordinal scale ranging from:
3: Performs test normally
2: Completes test, but takes abnormally long or has great difficulty
1: Performs test partially
0: Can perform no part of test
Lyle’s decision rule: Patients who achieve a maximum score on the first (most difficult) item are credited with having scored 3 on all subsequent items on that scale. If the patient scores less than 3 on the first item, then the second item is assessed. This is the easiest item, and if patients score 0 then they are unlikely to achieve a score above 0 for the remainder of the items and are credited with a zero for the other items. The maximum score on the ARTS is 57 points (possible range 0 to 57).
Items can also be summed (van der Lee et al, 2002)
A standardized scoring protocol has been published by Yozbatiran 2008
For more information visit www.neuropt.org or email [email protected]
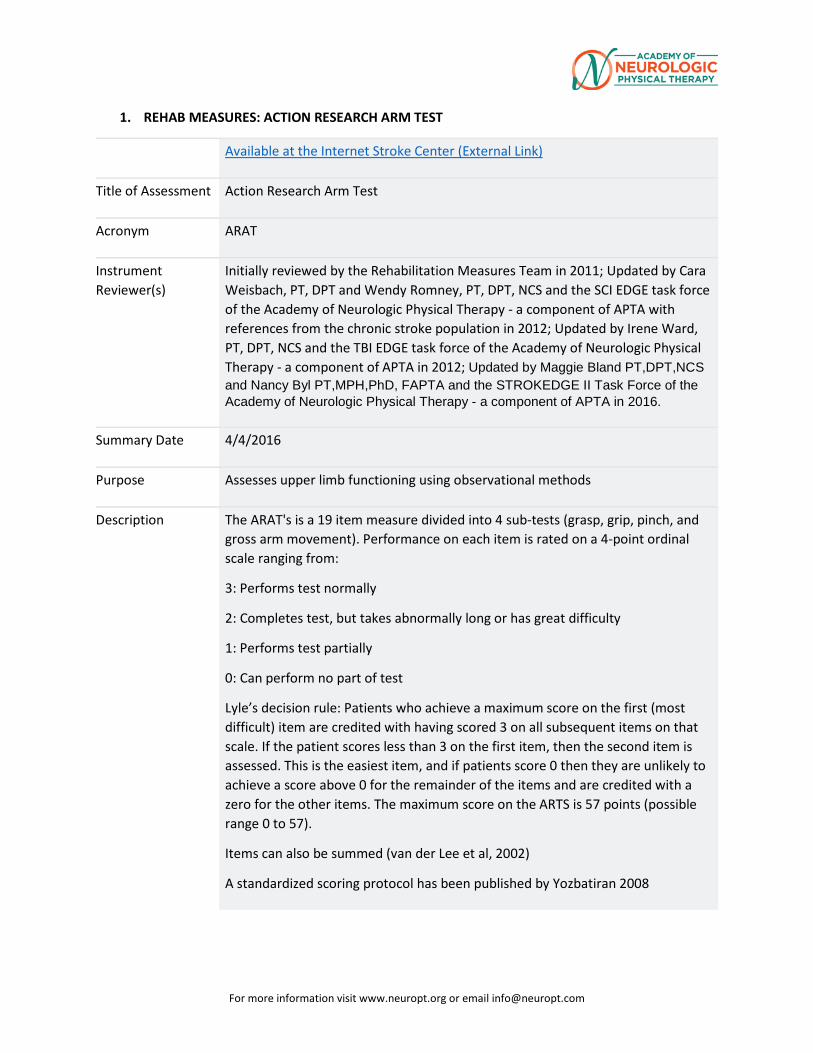
Area of Assessment
Activities of Daily Living; Coordination; Dexterity; Upper Extremity Function
Body Part Upper Extremity
ICF Domain Activity
Domain Motor
Assessment Type Observer
Length of Test 06 to 30 Minutes
Time to Administer 10 minutes, dependent on number of items performed
Number of Items 19
Equipment Required
Various sized wood blocks
Cricket ball
Stone
Jug and glass
Tube
Washer and bolt
Ball bearing
A marble
Training Required None
Type of training required
No Training
Cost Purchase of the kit ~ $600
Actual Cost Free
Age Range Adolescent: 13-17 years; Adult: 18-64 years; Elderly adult: 65+
For more information visit www.neuropt.org or email [email protected]
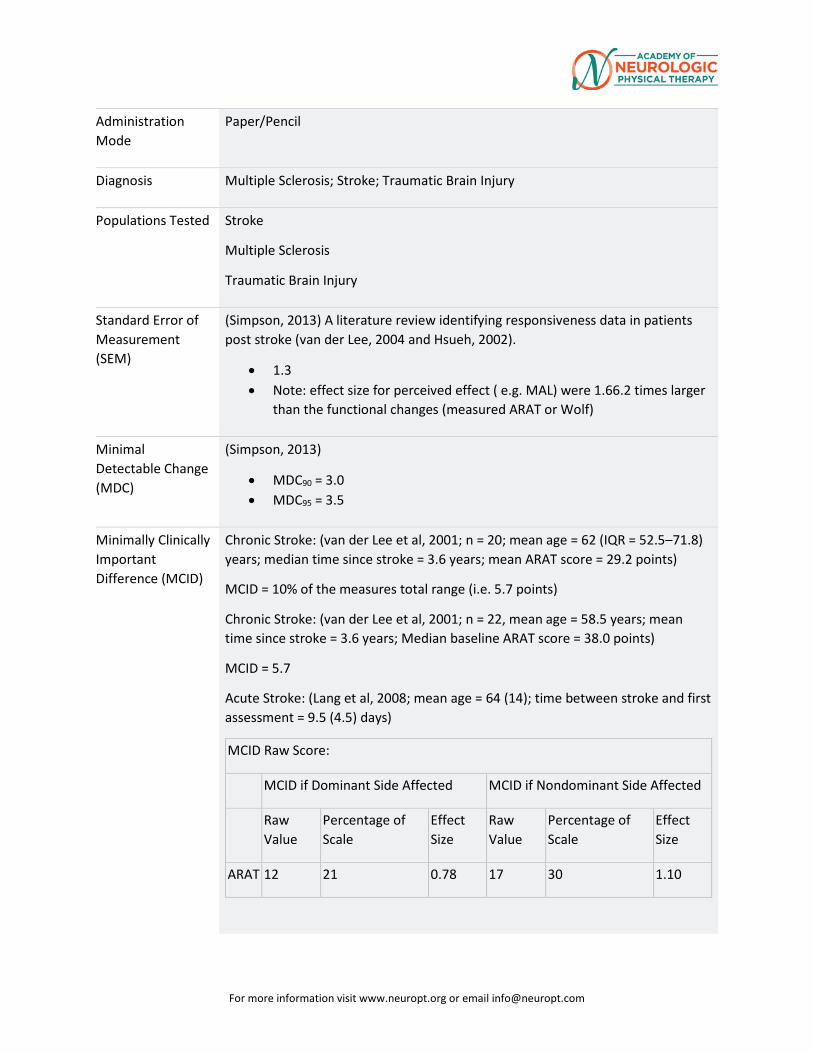
Administration Mode
Paper/Pencil
Diagnosis Multiple Sclerosis; Stroke; Traumatic Brain Injury
Populations Tested Stroke
Multiple Sclerosis
Traumatic Brain Injury
Standard Error of Measurement (SEM)
(Simpson, 2013) A literature review identifying responsiveness data in patients post stroke (van der Lee, 2004 and Hsueh, 2002).
• 1.3 • Note: effect size for perceived effect ( e.g. MAL) were 1.66.2 times larger
than the functional changes (measured ARAT or Wolf)
Minimal Detectable Change (MDC)
(Simpson, 2013)
• MDC90 = 3.0 • MDC95 = 3.5
Minimally Clinically Important Difference (MCID)
Chronic Stroke: (van der Lee et al, 2001; n = 20; mean age = 62 (IQR = 52.5–71.8) years; median time since stroke = 3.6 years; mean ARAT score = 29.2 points)
MCID = 10% of the measures total range (i.e. 5.7 points)
Chronic Stroke: (van der Lee et al, 2001; n = 22, mean age = 58.5 years; mean time since stroke = 3.6 years; Median baseline ARAT score = 38.0 points)
MCID = 5.7
Acute Stroke: (Lang et al, 2008; mean age = 64 (14); time between stroke and first assessment = 9.5 (4.5) days)
MCID Raw Score:
MCID if Dominant Side Affected MCID if Nondominant Side Affected
Raw Value
Percentage of Scale
Effect Size
Raw Value
Percentage of Scale
Effect Size
ARAT 12 21 0.78 17 30 1.10
For more information visit www.neuropt.org or email [email protected]
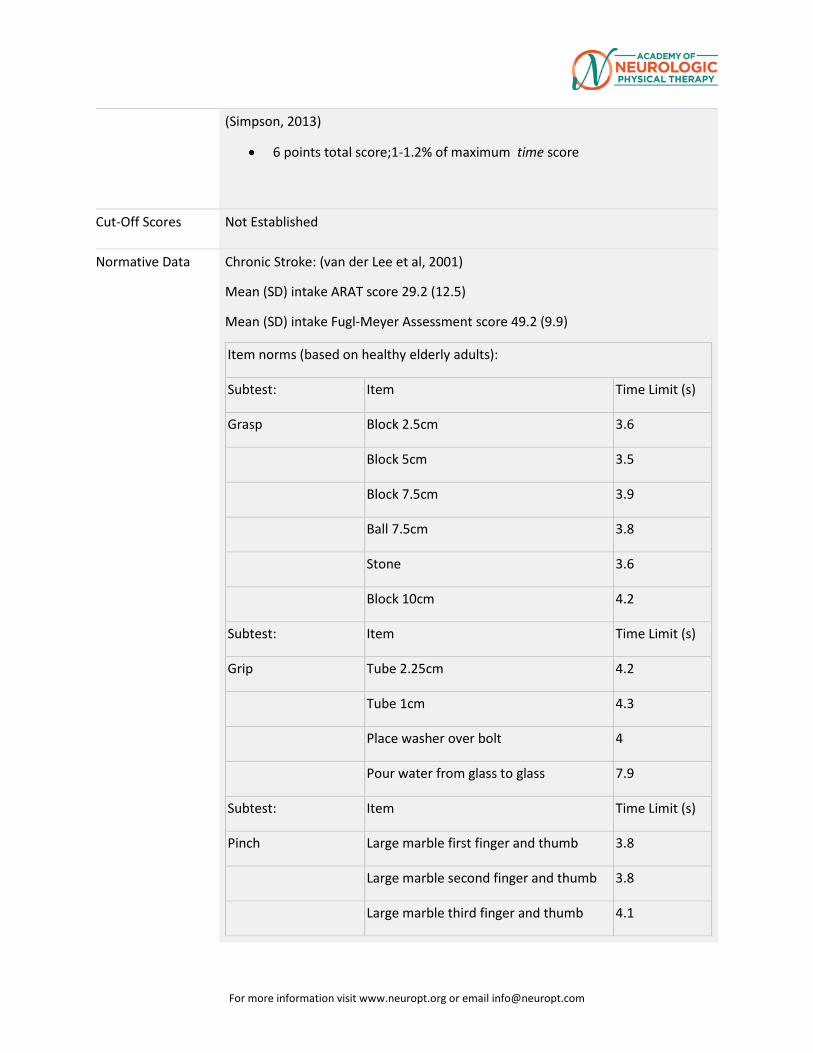
(Simpson, 2013)
• 6 points total score;1-1.2% of maximum time score
Cut-Off Scores Not Established
Normative Data Chronic Stroke: (van der Lee et al, 2001)
Mean (SD) intake ARAT score 29.2 (12.5)
Mean (SD) intake Fugl-Meyer Assessment score 49.2 (9.9)
Item norms (based on healthy elderly adults):
Subtest: Item Time Limit (s)
Grasp Block 2.5cm 3.6
Block 5cm 3.5
Block 7.5cm 3.9
Ball 7.5cm 3.8
Stone 3.6
Block 10cm 4.2
Subtest: Item Time Limit (s)
Grip Tube 2.25cm 4.2
Tube 1cm 4.3
Place washer over bolt 4
Pour water from glass to glass 7.9
Subtest: Item Time Limit (s)
Pinch Large marble first finger and thumb 3.8
Large marble second finger and thumb 3.8
Large marble third finger and thumb 4.1
For more information visit www.neuropt.org or email [email protected]
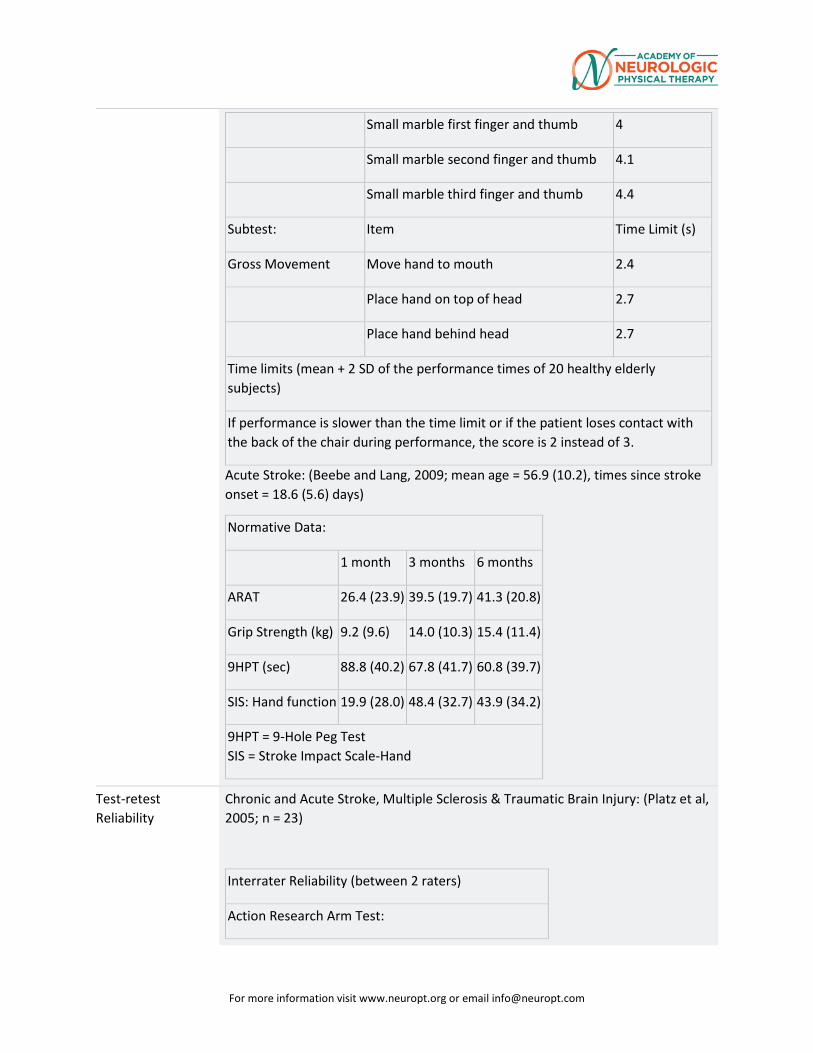
Small marble first finger and thumb 4
Small marble second finger and thumb 4.1
Small marble third finger and thumb 4.4
Subtest: Item Time Limit (s)
Gross Movement Move hand to mouth 2.4
Place hand on top of head 2.7
Place hand behind head 2.7
Time limits (mean + 2 SD of the performance times of 20 healthy elderly subjects)
If performance is slower than the time limit or if the patient loses contact with the back of the chair during performance, the score is 2 instead of 3.
Acute Stroke: (Beebe and Lang, 2009; mean age = 56.9 (10.2), times since stroke onset = 18.6 (5.6) days)
Normative Data:
1 month 3 months 6 months
ARAT 26.4 (23.9) 39.5 (19.7) 41.3 (20.8)
Grip Strength (kg) 9.2 (9.6) 14.0 (10.3) 15.4 (11.4)
9HPT (sec) 88.8 (40.2) 67.8 (41.7) 60.8 (39.7)
SIS: Hand function 19.9 (28.0) 48.4 (32.7) 43.9 (34.2)
9HPT = 9-Hole Peg Test SIS = Stroke Impact Scale-Hand
Test-retest Reliability
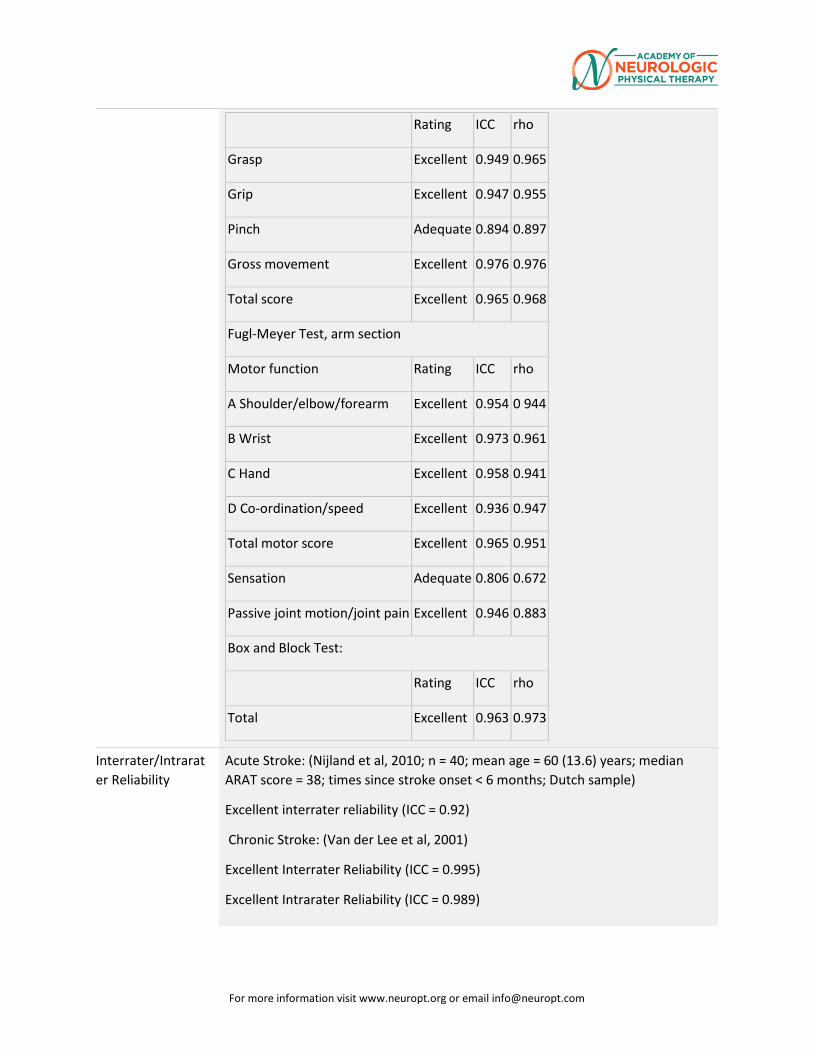
Chronic and Acute Stroke, Multiple Sclerosis & Traumatic Brain Injury: (Platz et al, 2005; n = 23)
Interrater Reliability (between 2 raters)
Action Research Arm Test:
For more information visit www.neuropt.org or email [email protected]
Rating ICC rho
Grasp Excellent 0.949 0.965
Grip Excellent 0.947 0.955
Pinch Adequate 0.894 0.897
Gross movement Excellent 0.976 0.976
Total score Excellent 0.965 0.968
Fugl-Meyer Test, arm section
Motor function Rating ICC rho
A Shoulder/elbow/forearm Excellent 0.954 0 944
B Wrist Excellent 0.973 0.961
C Hand Excellent 0.958 0.941
D Co-ordination/speed Excellent 0.936 0.947
Total motor score Excellent 0.965 0.951
Sensation Adequate 0.806 0.672
Passive joint motion/joint pain Excellent 0.946 0.883
Box and Block Test:
Rating ICC rho
Total Excellent 0.963 0.973
Interrater/Intrarater Reliability
Acute Stroke: (Nijland et al, 2010; n = 40; mean age = 60 (13.6) years; median ARAT score = 38; times since stroke onset < 6 months; Dutch sample)
Excellent interrater reliability (ICC = 0.92)
Chronic Stroke: (Van der Lee et al, 2001)
Excellent Interrater Reliability (ICC = 0.995)
Excellent Intrarater Reliability (ICC = 0.989)
For more information visit www.neuropt.org or email [email protected]
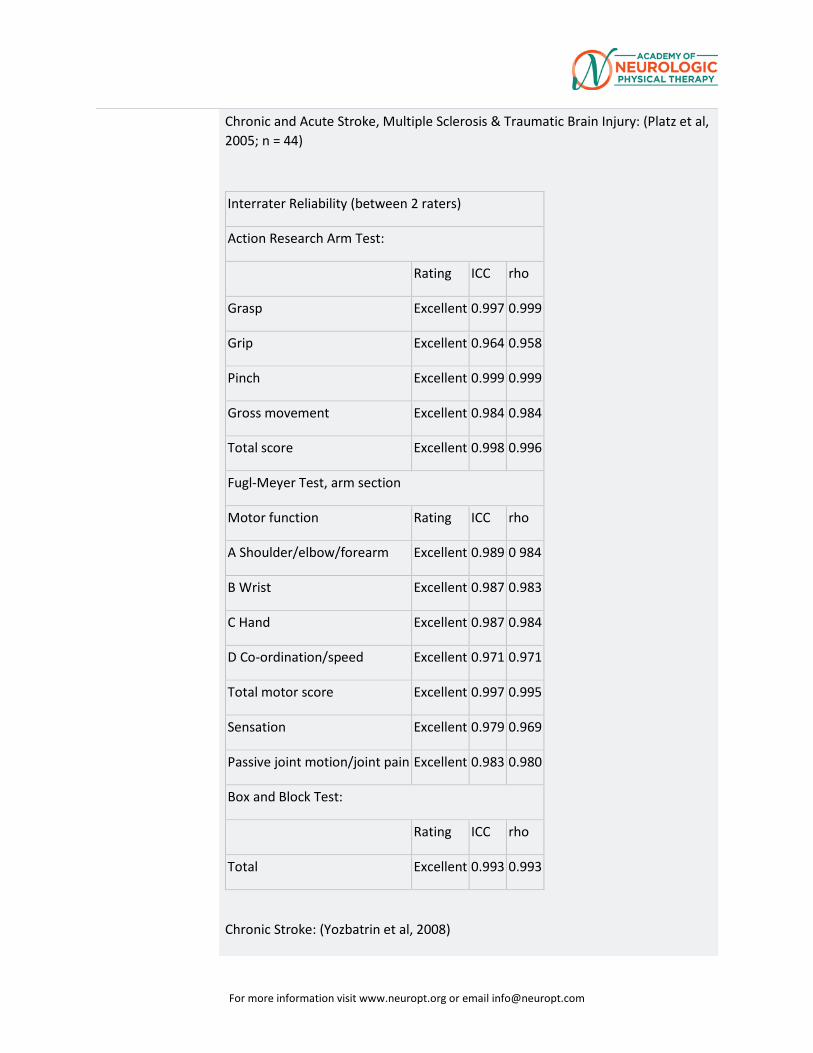
Chronic and Acute Stroke, Multiple Sclerosis & Traumatic Brain Injury: (Platz et al, 2005; n = 44)
Interrater Reliability (between 2 raters)
Action Research Arm Test:
Rating ICC rho
Grasp Excellent 0.997 0.999
Grip Excellent 0.964 0.958
Pinch Excellent 0.999 0.999
Gross movement Excellent 0.984 0.984
Total score Excellent 0.998 0.996
Fugl-Meyer Test, arm section
Motor function Rating ICC rho
A Shoulder/elbow/forearm Excellent 0.989 0 984
B Wrist Excellent 0.987 0.983
C Hand Excellent 0.987 0.984
D Co-ordination/speed Excellent 0.971 0.971
Total motor score Excellent 0.997 0.995
Sensation Excellent 0.979 0.969
Passive joint motion/joint pain Excellent 0.983 0.980
Box and Block Test:
Rating ICC rho
Total Excellent 0.993 0.993
Chronic Stroke: (Yozbatrin et al, 2008)
For more information visit www.neuropt.org or email [email protected]
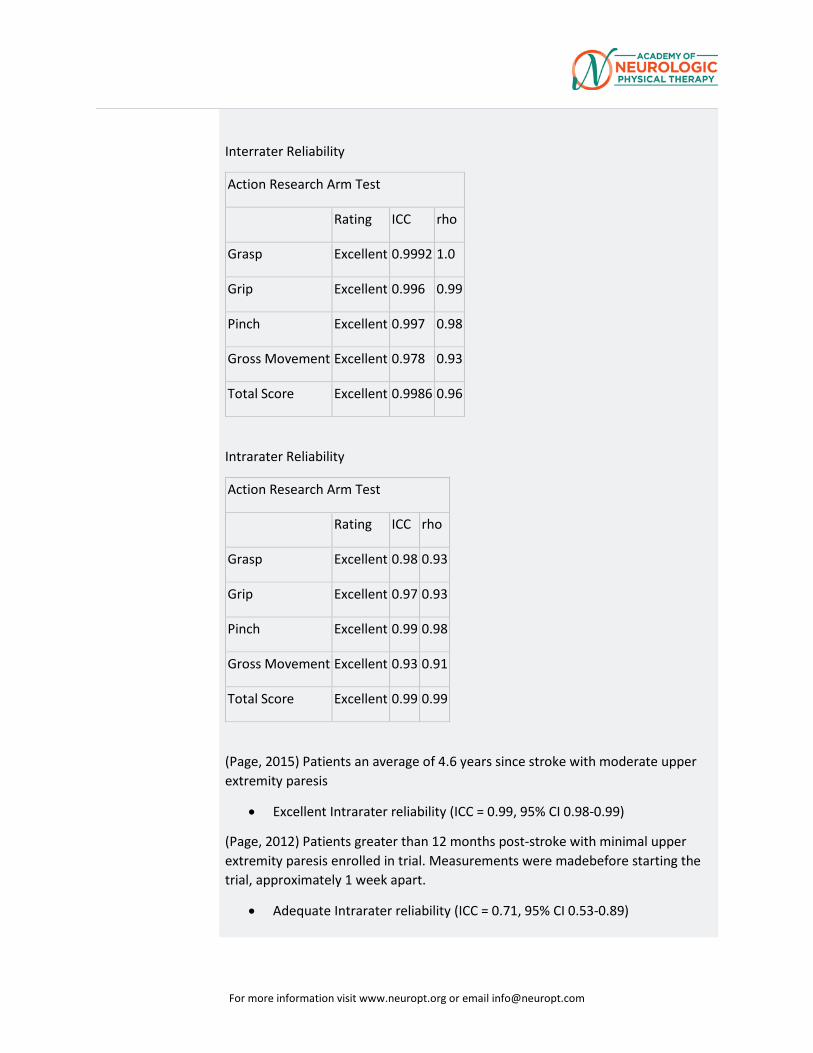
Interrater Reliability
Action Research Arm Test
Rating ICC rho
Grasp Excellent 0.9992 1.0
Grip Excellent 0.996 0.99
Pinch Excellent 0.997 0.98
Gross Movement Excellent 0.978 0.93
Total Score Excellent 0.9986 0.96
Intrarater Reliability
Action Research Arm Test
Rating ICC rho
Grasp Excellent 0.98 0.93
Grip Excellent 0.97 0.93
Pinch Excellent 0.99 0.98
Gross Movement Excellent 0.93 0.91
Total Score Excellent 0.99 0.99
(Page, 2015) Patients an average of 4.6 years since stroke with moderate upper extremity paresis
• Excellent Intrarater reliability (ICC = 0.99, 95% CI 0.98-0.99)
(Page, 2012) Patients greater than 12 months post-stroke with minimal upper extremity paresis enrolled in trial. Measurements were madebefore starting the trial, approximately 1 week apart.
• Adequate Intrarater reliability (ICC = 0.71, 95% CI 0.53-0.89)
For more information visit www.neuropt.org or email [email protected]
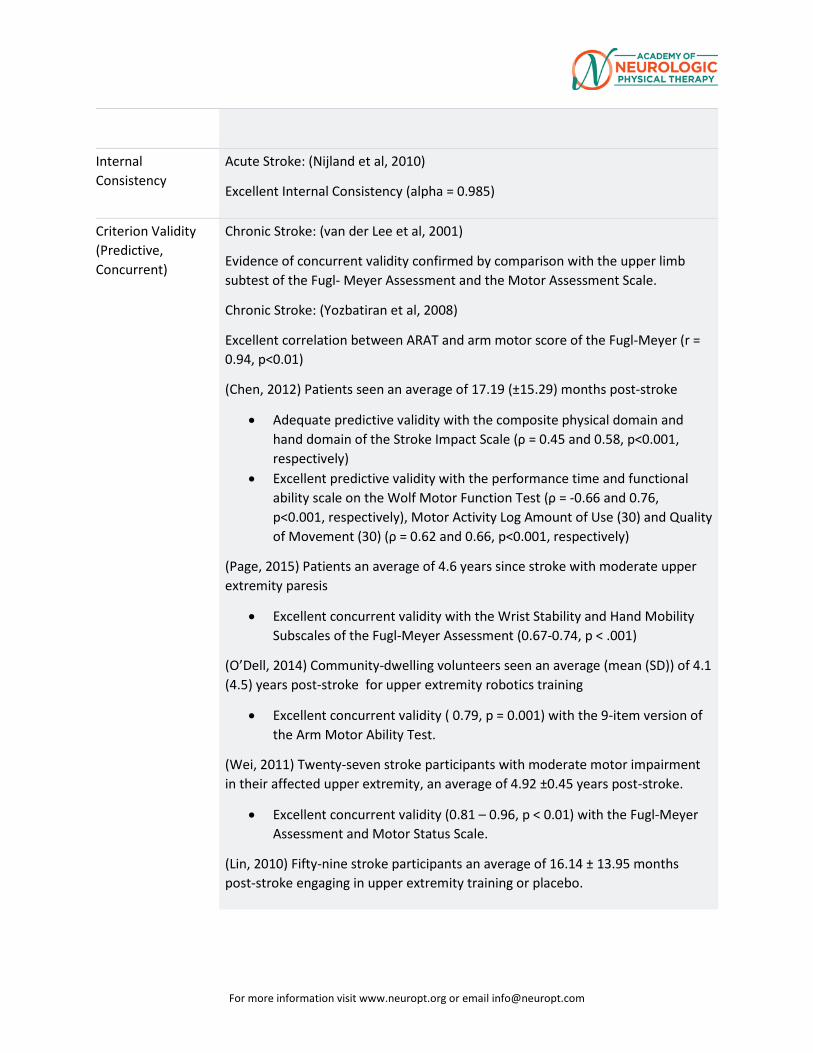
Internal Consistency
Acute Stroke: (Nijland et al, 2010)
Excellent Internal Consistency (alpha = 0.985)
Criterion Validity (Predictive, Concurrent)
Chronic Stroke: (van der Lee et al, 2001)
Evidence of concurrent validity confirmed by comparison with the upper limb subtest of the Fugl- Meyer Assessment and the Motor Assessment Scale.
Chronic Stroke: (Yozbatiran et al, 2008)
Excellent correlation between ARAT and arm motor score of the Fugl-Meyer (r = 0.94, p<0.01)
(Chen, 2012) Patients seen an average of 17.19 (±15.29) months post-stroke
• Adequate predictive validity with the composite physical domain and hand domain of the Stroke Impact Scale (ρ = 0.45 and 0.58, p<0.001, respectively)
• Excellent predictive validity with the performance time and functional ability scale on the Wolf Motor Function Test (ρ = -0.66 and 0.76, p<0.001, respectively), Motor Activity Log Amount of Use (30) and Quality of Movement (30) (ρ = 0.62 and 0.66, p<0.001, respectively)
(Page, 2015) Patients an average of 4.6 years since stroke with moderate upper extremity paresis
• Excellent concurrent validity with the Wrist Stability and Hand Mobility Subscales of the Fugl-Meyer Assessment (0.67-0.74, p < .001)
(O’Dell, 2014) Community-dwelling volunteers seen an average (mean (SD)) of 4.1 (4.5) years post-stroke for upper extremity robotics training
• Excellent concurrent validity ( 0.79, p = 0.001) with the 9-item version of the Arm Motor Ability Test.
(Wei, 2011) Twenty-seven stroke participants with moderate motor impairment in their affected upper extremity, an average of 4.92 ±0.45 years post-stroke.
• Excellent concurrent validity (0.81 – 0.96, p < 0.01) with the Fugl-Meyer Assessment and Motor Status Scale.
(Lin, 2010) Fifty-nine stroke participants an average of 16.14 ± 13.95 months post-stroke engaging in upper extremity training or placebo.
For more information visit www.neuropt.org or email [email protected]
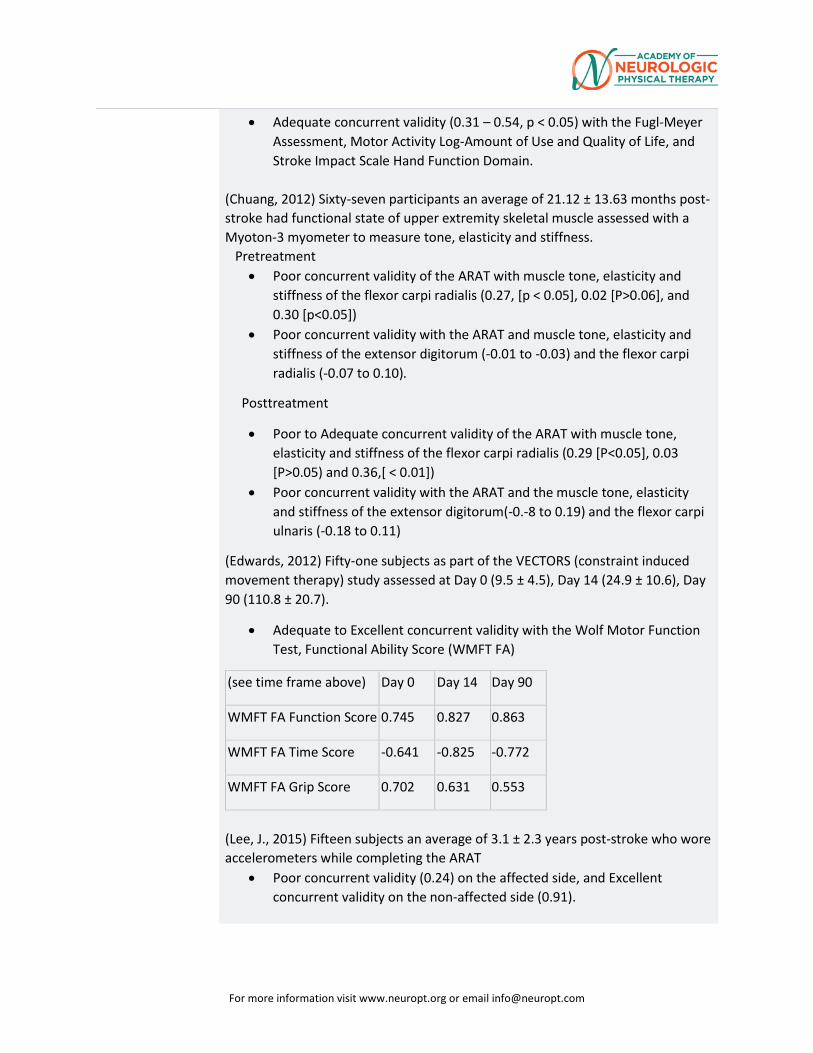
• Adequate concurrent validity (0.31 – 0.54, p < 0.05) with the Fugl-Meyer Assessment, Motor Activity Log-Amount of Use and Quality of Life, and Stroke Impact Scale Hand Function Domain.
(Chuang, 2012) Sixty-seven participants an average of 21.12 ± 13.63 months post-stroke had functional state of upper extremity skeletal muscle assessed with a Myoton-3 myometer to measure tone, elasticity and stiffness. Pretreatment
• Poor concurrent validity of the ARAT with muscle tone, elasticity and stiffness of the flexor carpi radialis (0.27, [p < 0.05], 0.02 [P>0.06], and 0.30 [p<0.05])
• Poor concurrent validity with the ARAT and muscle tone, elasticity and stiffness of the extensor digitorum (-0.01 to -0.03) and the flexor carpi radialis (-0.07 to 0.10).
Posttreatment
• Poor to Adequate concurrent validity of the ARAT with muscle tone, elasticity and stiffness of the flexor carpi radialis (0.29 [P<0.05], 0.03 [P>0.05) and 0.36,[ < 0.01])
• Poor concurrent validity with the ARAT and the muscle tone, elasticity and stiffness of the extensor digitorum(-0.-8 to 0.19) and the flexor carpi ulnaris (-0.18 to 0.11)
(Edwards, 2012) Fifty-one subjects as part of the VECTORS (constraint induced movement therapy) study assessed at Day 0 (9.5 ± 4.5), Day 14 (24.9 ± 10.6), Day 90 (110.8 ± 20.7).
• Adequate to Excellent concurrent validity with the Wolf Motor Function Test, Functional Ability Score (WMFT FA)
(see time frame above) Day 0 Day 14 Day 90
WMFT FA Function Score 0.745 0.827 0.863
WMFT FA Time Score -0.641 -0.825 -0.772
WMFT FA Grip Score 0.702 0.631 0.553
(Lee, J., 2015) Fifteen subjects an average of 3.1 ± 2.3 years post-stroke who wore accelerometers while completing the ARAT
• Poor concurrent validity (0.24) on the affected side, and Excellent concurrent validity on the non-affected side (0.91).
For more information visit www.neuropt.org or email [email protected]
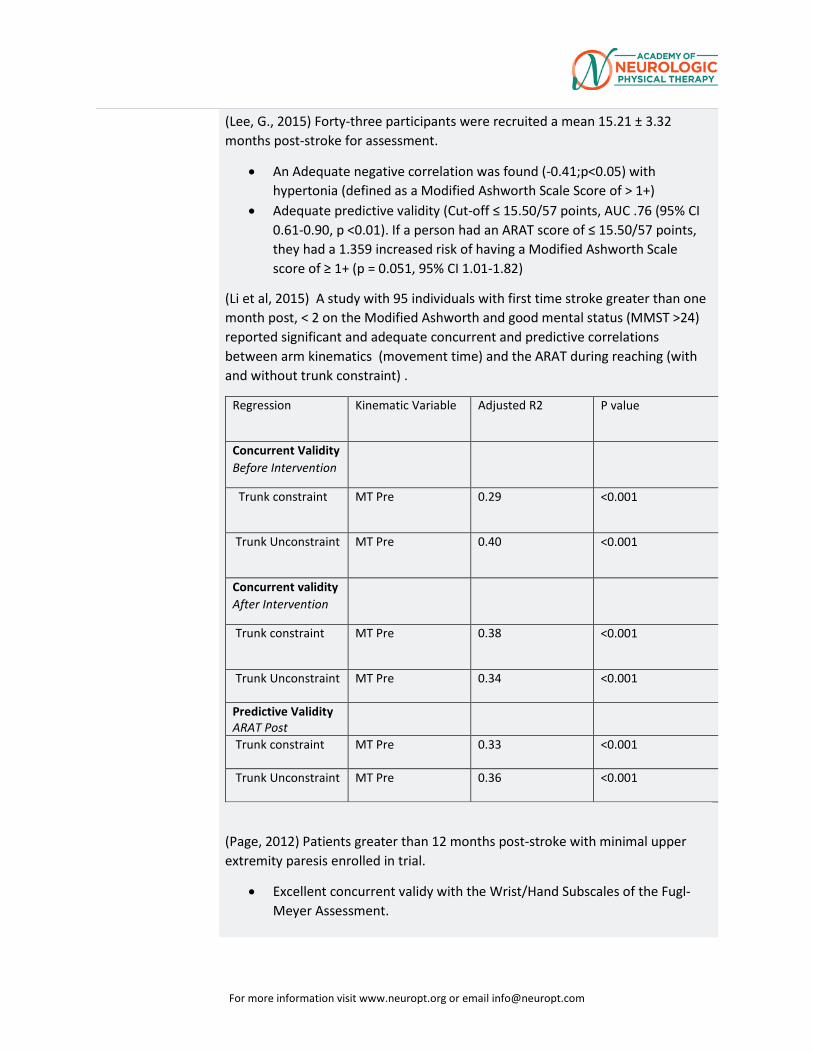
(Lee, G., 2015) Forty-three participants were recruited a mean 15.21 ± 3.32 months post-stroke for assessment.
• An Adequate negative correlation was found (-0.41;p<0.05) with hypertonia (defined as a Modified Ashworth Scale Score of > 1+)
• Adequate predictive validity (Cut-off ≤ 15.50/57 points, AUC .76 (95% CI 0.61-0.90, p <0.01). If a person had an ARAT score of ≤ 15.50/57 points, they had a 1.359 increased risk of having a Modified Ashworth Scale score of ≥ 1+ (p = 0.051, 95% CI 1.01-1.82)
(Li et al, 2015) A study with 95 individuals with first time stroke greater than one month post, < 2 on the Modified Ashworth and good mental status (MMST >24) reported significant and adequate concurrent and predictive correlations between arm kinematics (movement time) and the ARAT during reaching (with and without trunk constraint) .
Regression Kinematic Variable Adjusted R2 P value
Concurrent Validity Before Intervention
Trunk constraint MT Pre 0.29 <0.001
Trunk Unconstraint MT Pre 0.40 <0.001
Concurrent validity After Intervention
Trunk constraint MT Pre 0.38 <0.001
Trunk Unconstraint MT Pre 0.34 <0.001
Predictive Validity ARAT Post
Trunk constraint MT Pre 0.33 <0.001
Trunk Unconstraint MT Pre 0.36 <0.001
(Page, 2012) Patients greater than 12 months post-stroke with minimal upper extremity paresis enrolled in trial.
• Excellent concurrent validy with the Wrist/Hand Subscales of the Fugl-Meyer Assessment.
For more information visit www.neuropt.org or email [email protected]
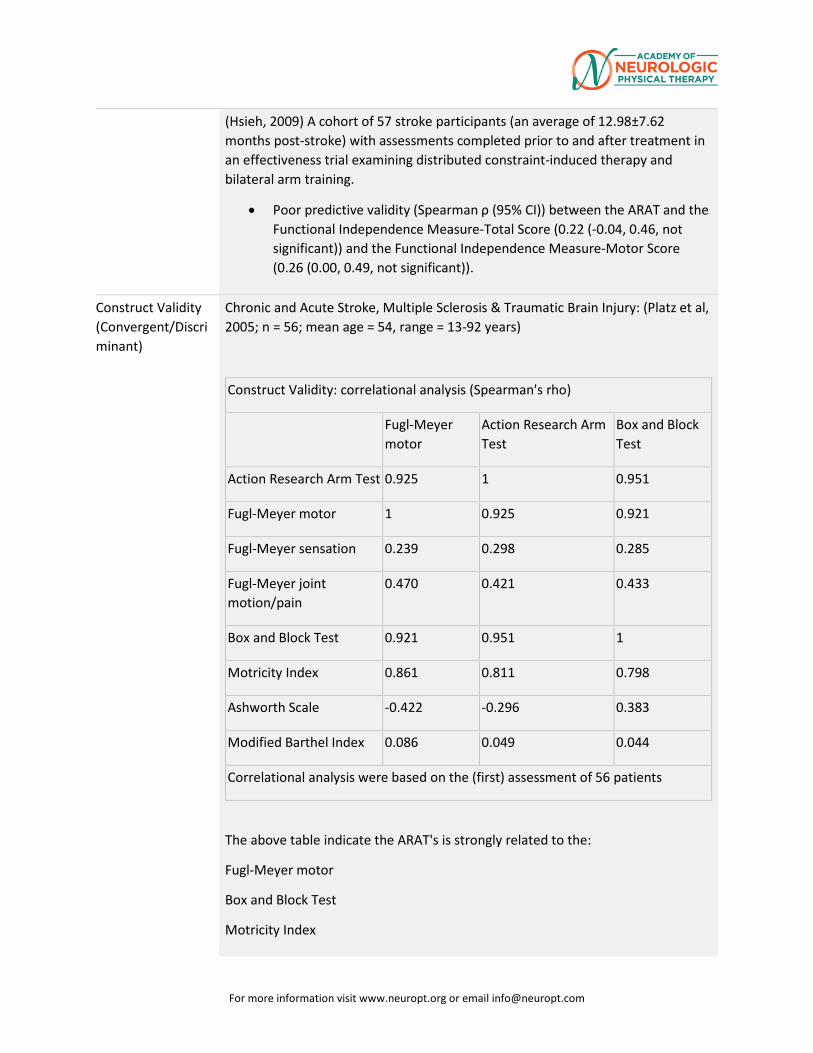
(Hsieh, 2009) A cohort of 57 stroke participants (an average of 12.98±7.62 months post-stroke) with assessments completed prior to and after treatment in an effectiveness trial examining distributed constraint-induced therapy and bilateral arm training.
• Poor predictive validity (Spearman ρ (95% CI)) between the ARAT and the Functional Independence Measure-Total Score (0.22 (-0.04, 0.46, not significant)) and the Functional Independence Measure-Motor Score (0.26 (0.00, 0.49, not significant)).
Construct Validity (Convergent/Discriminant)
Chronic and Acute Stroke, Multiple Sclerosis & Traumatic Brain Injury: (Platz et al, 2005; n = 56; mean age = 54, range = 13-92 years)
Construct Validity: correlational analysis (Spearman's rho)
Fugl-Meyer motor
Action Research Arm Test
Box and Block Test
Action Research Arm Test 0.925 1 0.951
Fugl-Meyer motor 1 0.925 0.921
Fugl-Meyer sensation 0.239 0.298 0.285
Fugl-Meyer joint motion/pain
0.470 0.421 0.433
Box and Block Test 0.921 0.951 1
Motricity Index 0.861 0.811 0.798
Ashworth Scale -0.422 -0.296 0.383
Modified Barthel Index 0.086 0.049 0.044
Correlational analysis were based on the (first) assessment of 56 patients
The above table indicate the ARAT's is strongly related to the:
Fugl-Meyer motor
Box and Block Test
Motricity Index
For more information visit www.neuropt.org or email [email protected]
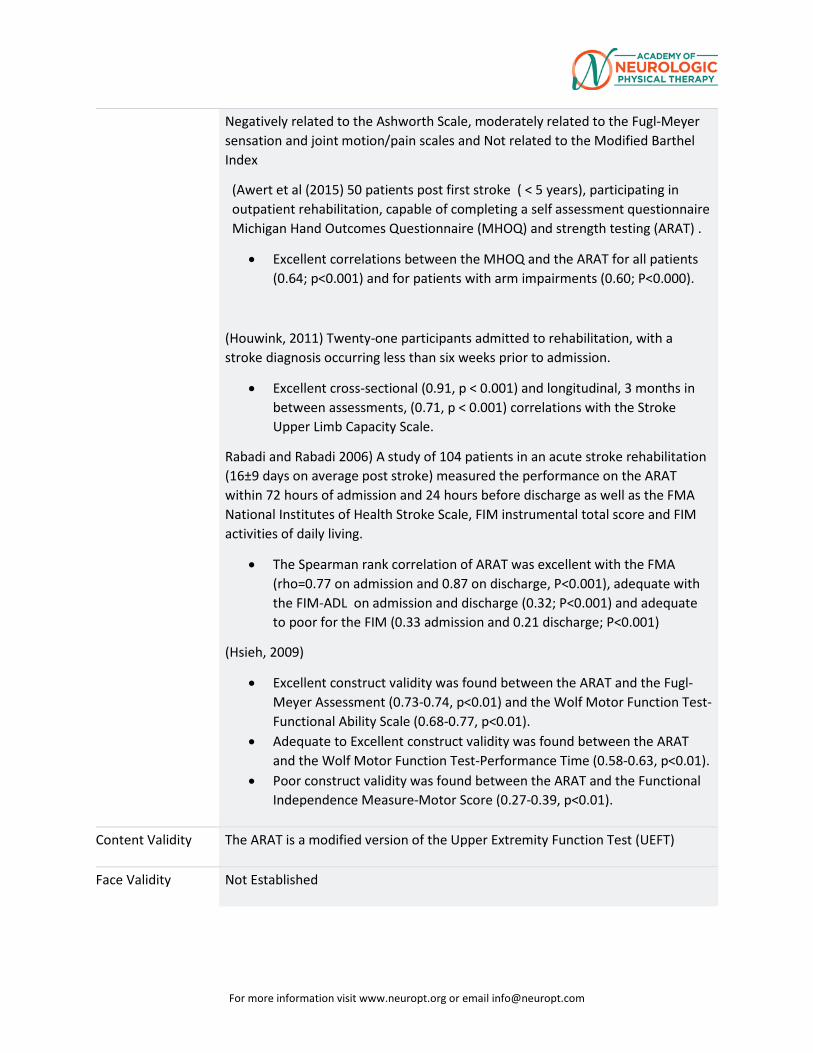
Negatively related to the Ashworth Scale, moderately related to the Fugl-Meyer sensation and joint motion/pain scales and Not related to the Modified Barthel Index
(Awert et al (2015) 50 patients post first stroke ( < 5 years), participating in outpatient rehabilitation, capable of completing a self assessment questionnaire Michigan Hand Outcomes Questionnaire (MHOQ) and strength testing (ARAT) .
• Excellent correlations between the MHOQ and the ARAT for all patients (0.64; p<0.001) and for patients with arm impairments (0.60; P<0.000).
(Houwink, 2011) Twenty-one participants admitted to rehabilitation, with a stroke diagnosis occurring less than six weeks prior to admission.
• Excellent cross-sectional (0.91, p < 0.001) and longitudinal, 3 months in between assessments, (0.71, p < 0.001) correlations with the Stroke Upper Limb Capacity Scale.
Rabadi and Rabadi 2006) A study of 104 patients in an acute stroke rehabilitation (16±9 days on average post stroke) measured the performance on the ARAT within 72 hours of admission and 24 hours before discharge as well as the FMA National Institutes of Health Stroke Scale, FIM instrumental total score and FIM activities of daily living.
• The Spearman rank correlation of ARAT was excellent with the FMA (rho=0.77 on admission and 0.87 on discharge, P<0.001), adequate with the FIM-ADL on admission and discharge (0.32; P<0.001) and adequate to poor for the FIM (0.33 admission and 0.21 discharge; P<0.001)
(Hsieh, 2009)
• Excellent construct validity was found between the ARAT and the Fugl-Meyer Assessment (0.73-0.74, p<0.01) and the Wolf Motor Function Test-Functional Ability Scale (0.68-0.77, p<0.01).
• Adequate to Excellent construct validity was found between the ARAT and the Wolf Motor Function Test-Performance Time (0.58-0.63, p<0.01).
• Poor construct validity was found between the ARAT and the Functional Independence Measure-Motor Score (0.27-0.39, p<0.01).
Content Validity The ARAT is a modified version of the Upper Extremity Function Test (UEFT)
Face Validity Not Established
For more information visit www.neuropt.org or email [email protected]
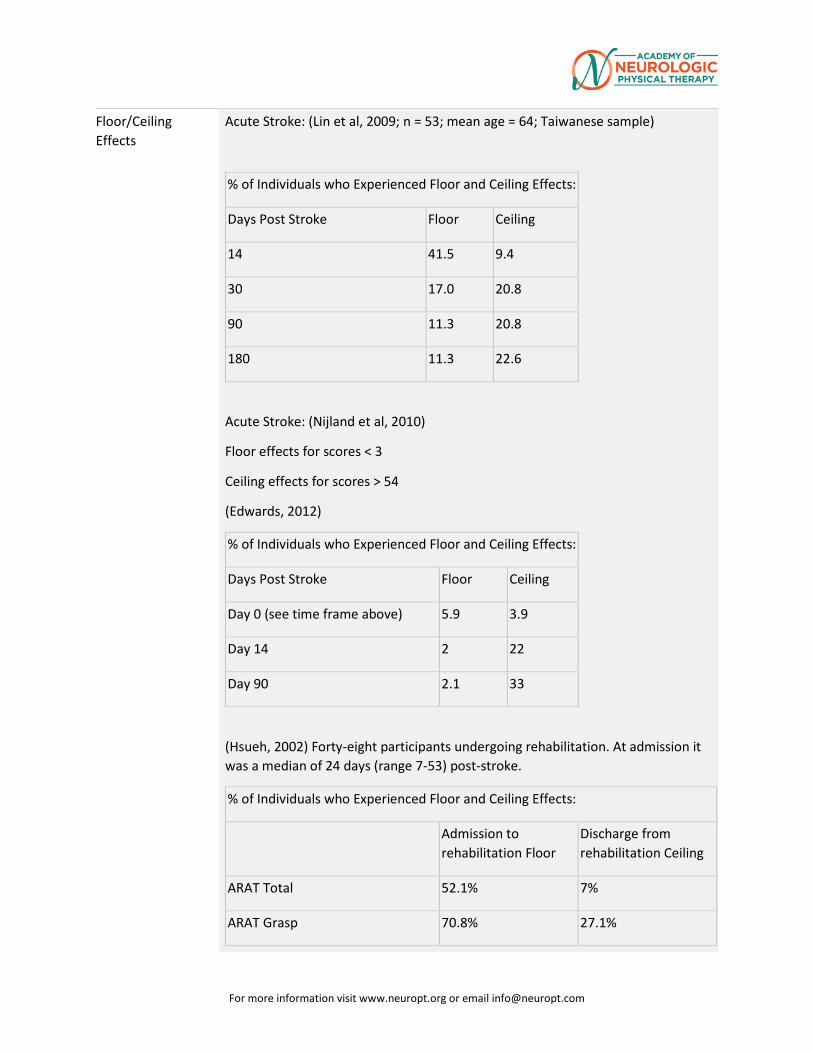
Floor/Ceiling Effects
Acute Stroke: (Lin et al, 2009; n = 53; mean age = 64; Taiwanese sample)
% of Individuals who Experienced Floor and Ceiling Effects:
Days Post Stroke Floor Ceiling
14 41.5 9.4
30 17.0 20.8
90 11.3 20.8
180 11.3 22.6
Acute Stroke: (Nijland et al, 2010)
Floor effects for scores < 3
Ceiling effects for scores > 54
(Edwards, 2012)
% of Individuals who Experienced Floor and Ceiling Effects:
Days Post Stroke Floor Ceiling
Day 0 (see time frame above) 5.9 3.9
Day 14 2 22
Day 90 2.1 33
(Hsueh, 2002) Forty-eight participants undergoing rehabilitation. At admission it was a median of 24 days (range 7-53) post-stroke.
% of Individuals who Experienced Floor and Ceiling Effects:
Admission to rehabilitation Floor
Discharge from rehabilitation Ceiling
ARAT Total 52.1% 7%
ARAT Grasp 70.8% 27.1%
For more information visit www.neuropt.org or email [email protected]
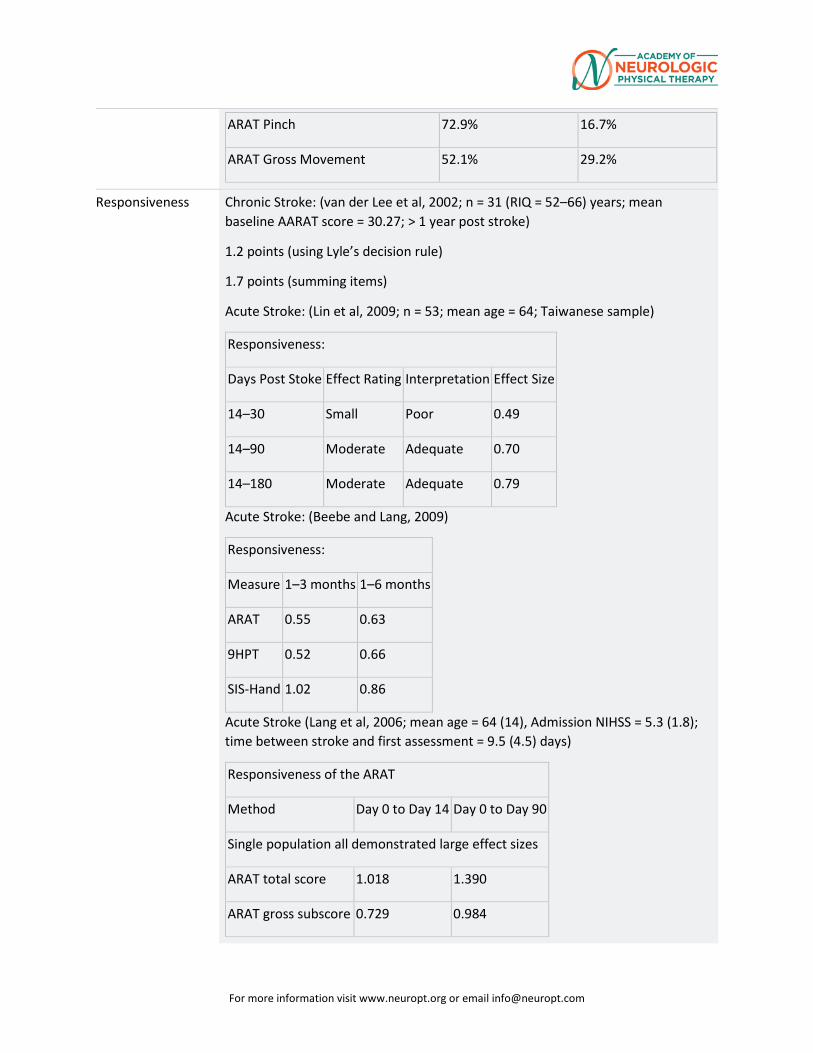
ARAT Pinch 72.9% 16.7%
ARAT Gross Movement 52.1% 29.2%
Responsiveness Chronic Stroke: (van der Lee et al, 2002; n = 31 (RIQ = 52–66) years; mean baseline AARAT score = 30.27; > 1 year post stroke)
1.2 points (using Lyle’s decision rule)
1.7 points (summing items)
Acute Stroke: (Lin et al, 2009; n = 53; mean age = 64; Taiwanese sample)
Responsiveness:
Days Post Stoke Effect Rating Interpretation Effect Size
14–30 Small Poor 0.49
14–90 Moderate Adequate 0.70
14–180 Moderate Adequate 0.79
Acute Stroke: (Beebe and Lang, 2009)
Responsiveness:
Measure 1–3 months 1–6 months
ARAT 0.55 0.63
9HPT 0.52 0.66
SIS-Hand 1.02 0.86
Acute Stroke (Lang et al, 2006; mean age = 64 (14), Admission NIHSS = 5.3 (1.8); time between stroke and first assessment = 9.5 (4.5) days)
Responsiveness of the ARAT
Method Day 0 to Day 14 Day 0 to Day 90
Single population all demonstrated large effect sizes
ARAT total score 1.018 1.390
ARAT gross subscore 0.729 0.984
For more information visit www.neuropt.org or email [email protected]
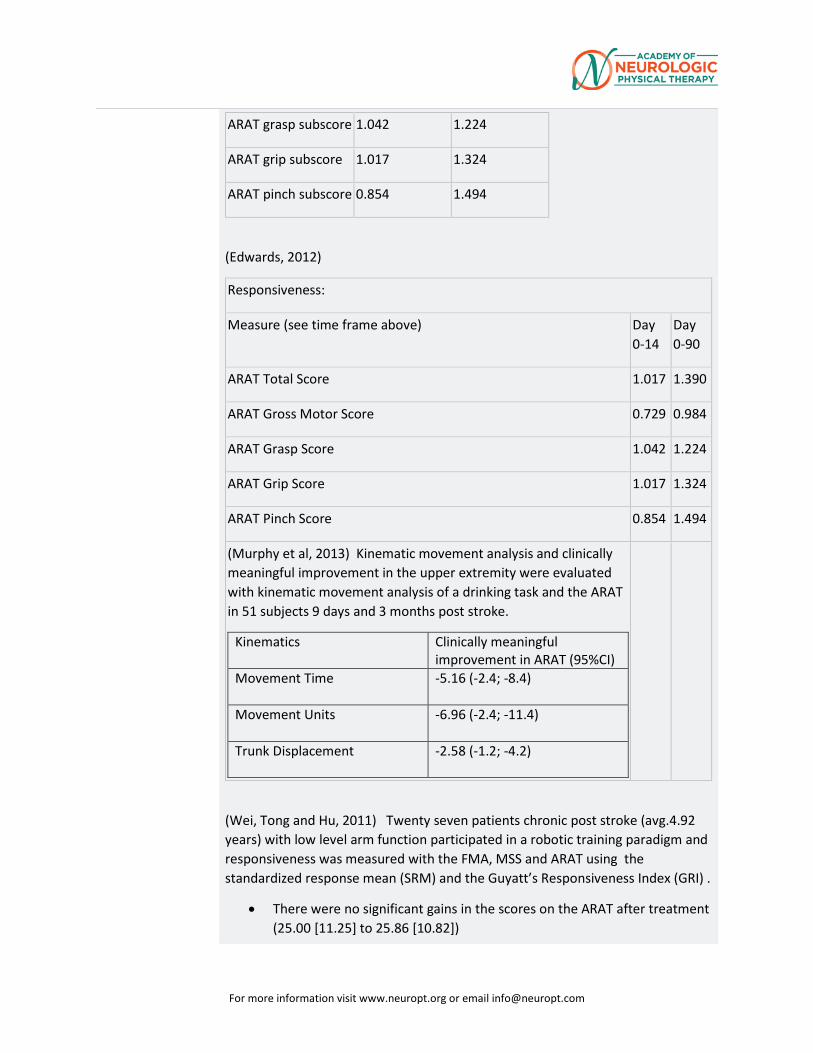
ARAT grasp subscore 1.042 1.224
ARAT grip subscore 1.017 1.324
ARAT pinch subscore 0.854 1.494
(Edwards, 2012)
Responsiveness:
Measure (see time frame above) Day 0-14
Day 0-90
ARAT Total Score 1.017 1.390
ARAT Gross Motor Score 0.729 0.984
ARAT Grasp Score 1.042 1.224
ARAT Grip Score 1.017 1.324
ARAT Pinch Score 0.854 1.494
(Murphy et al, 2013) Kinematic movement analysis and clinically meaningful improvement in the upper extremity were evaluated with kinematic movement analysis of a drinking task and the ARAT in 51 subjects 9 days and 3 months post stroke.
Kinematics Clinically meaningful improvement in ARAT (95%CI)
Movement Time -5.16 (-2.4; -8.4)
Movement Units -6.96 (-2.4; -11.4)
Trunk Displacement -2.58 (-1.2; -4.2)
(Wei, Tong and Hu, 2011) Twenty seven patients chronic post stroke (avg.4.92 years) with low level arm function participated in a robotic training paradigm and responsiveness was measured with the FMA, MSS and ARAT using the standardized response mean (SRM) and the Guyatt’s Responsiveness Index (GRI) .
• There were no significant gains in the scores on the ARAT after treatment (25.00 [11.25] to 25.86 [10.82])
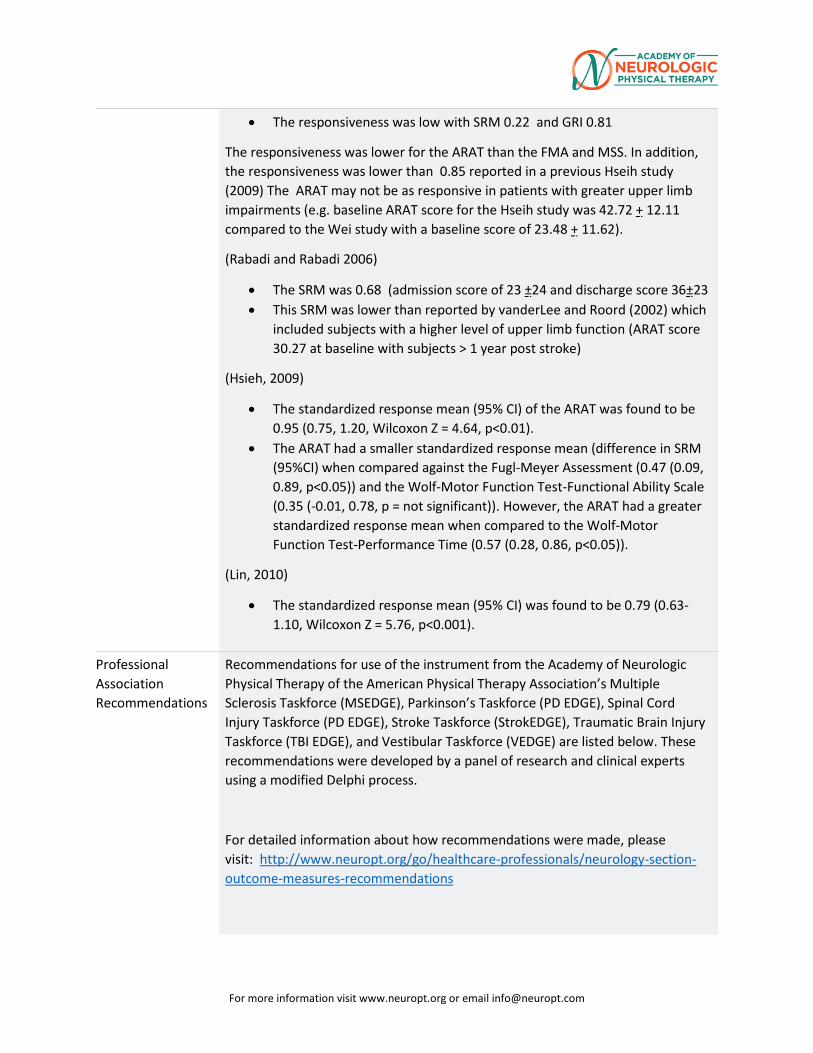
For more information visit www.neuropt.org or email [email protected]
• The responsiveness was low with SRM 0.22 and GRI 0.81
The responsiveness was lower for the ARAT than the FMA and MSS. In addition, the responsiveness was lower than 0.85 reported in a previous Hseih study (2009) The ARAT may not be as responsive in patients with greater upper limb impairments (e.g. baseline ARAT score for the Hseih study was 42.72 + 12.11 compared to the Wei study with a baseline score of 23.48 + 11.62).
(Rabadi and Rabadi 2006)
• The SRM was 0.68 (admission score of 23 ±24 and discharge score 36±23 • This SRM was lower than reported by vanderLee and Roord (2002) which
included subjects with a higher level of upper limb function (ARAT score 30.27 at baseline with subjects > 1 year post stroke)
(Hsieh, 2009)
• The standardized response mean (95% CI) of the ARAT was found to be 0.95 (0.75, 1.20, Wilcoxon Z = 4.64, p<0.01).
• The ARAT had a smaller standardized response mean (difference in SRM (95%CI) when compared against the Fugl-Meyer Assessment (0.47 (0.09, 0.89, p<0.05)) and the Wolf-Motor Function Test-Functional Ability Scale (0.35 (-0.01, 0.78, p = not significant)). However, the ARAT had a greater standardized response mean when compared to the Wolf-Motor Function Test-Performance Time (0.57 (0.28, 0.86, p<0.05)).
(Lin, 2010)
• The standardized response mean (95% CI) was found to be 0.79 (0.63-1.10, Wilcoxon Z = 5.76, p<0.001).
Professional Association Recommendations
Recommendations for use of the instrument from the Academy of Neurologic Physical Therapy of the American Physical Therapy Association’s Multiple Sclerosis Taskforce (MSEDGE), Parkinson’s Taskforce (PD EDGE), Spinal Cord Injury Taskforce (PD EDGE), Stroke Taskforce (StrokEDGE), Traumatic Brain Injury Taskforce (TBI EDGE), and Vestibular Taskforce (VEDGE) are listed below. These recommendations were developed by a panel of research and clinical experts using a modified Delphi process.
For detailed information about how recommendations were made, please visit: http://www.neuropt.org/go/healthcare-professionals/neurology-section-outcome-measures-recommendations
For more information visit www.neuropt.org or email [email protected]
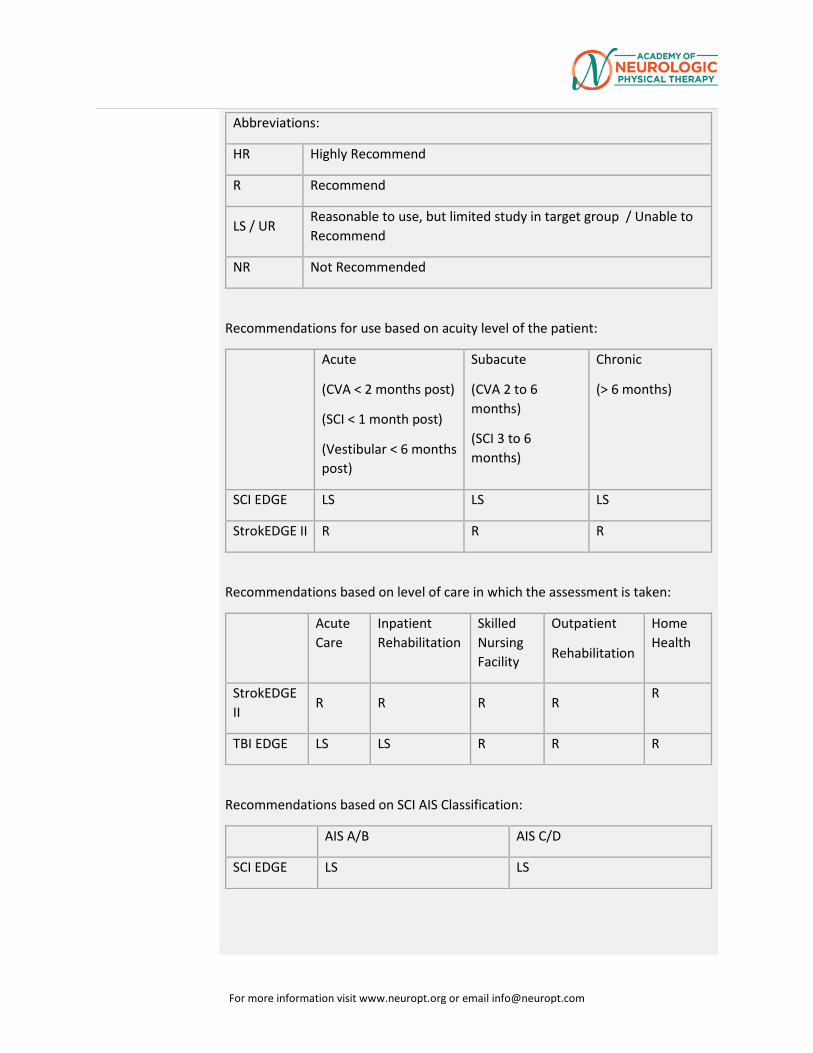
Abbreviations:
HR Highly Recommend
R Recommend
LS / UR Reasonable to use, but limited study in target group / Unable to Recommend
NR Not Recommended
Recommendations for use based on acuity level of the patient:
Acute
(CVA < 2 months post)
(SCI < 1 month post)
(Vestibular < 6 months post)
Subacute
(CVA 2 to 6 months)
(SCI 3 to 6 months)
Chronic
(> 6 months)
SCI EDGE LS LS LS
StrokEDGE II R R R
Recommendations based on level of care in which the assessment is taken:
Acute Care
Inpatient Rehabilitation
Skilled Nursing Facility
Outpatient
Rehabilitation
Home Health
StrokEDGE II
R R R R R
TBI EDGE LS LS R R R
Recommendations based on SCI AIS Classification:
AIS A/B AIS C/D
SCI EDGE LS LS
For more information visit www.neuropt.org or email [email protected]
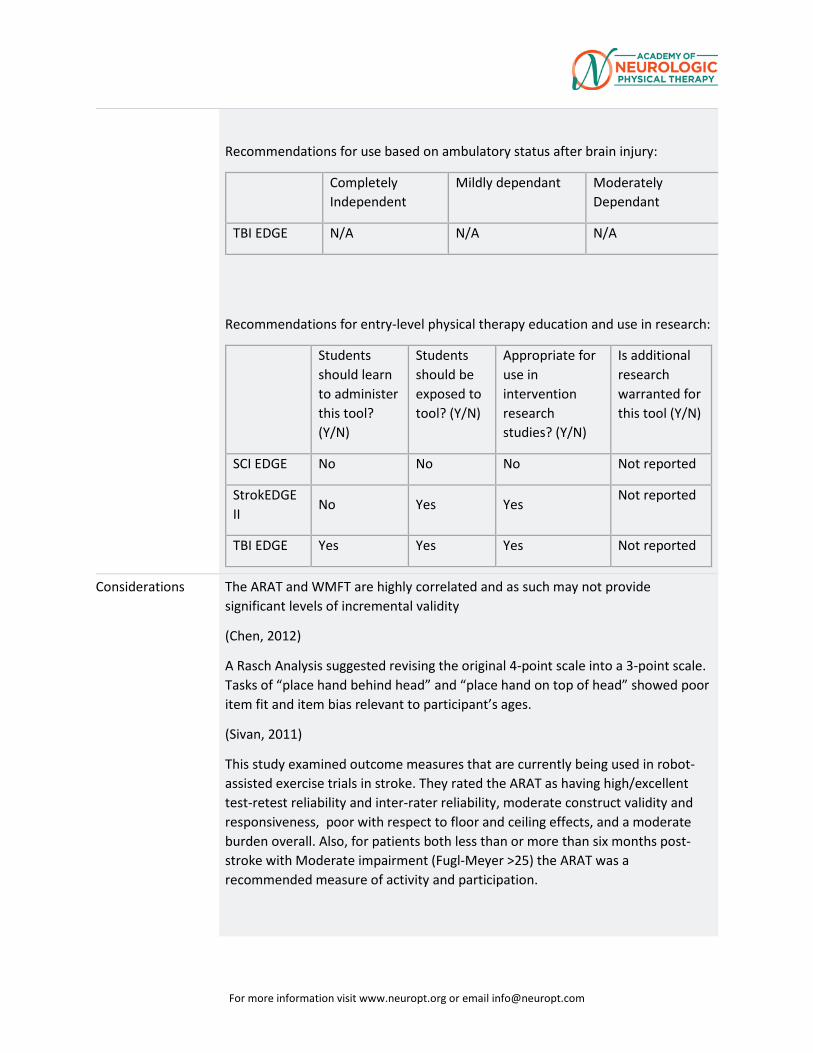
Recommendations for use based on ambulatory status after brain injury:
Completely Independent
Mildly dependant Moderately Dependant
TBI EDGE N/A N/A N/A
Recommendations for entry-level physical therapy education and use in research:
Students should learn to administer this tool? (Y/N)
Students should be exposed to tool? (Y/N)
Appropriate for use in intervention research studies? (Y/N)
Is additional research warranted for this tool (Y/N)
SCI EDGE No No No Not reported
StrokEDGE II
No Yes Yes Not reported
TBI EDGE Yes Yes Yes Not reported
Considerations The ARAT and WMFT are highly correlated and as such may not provide significant levels of incremental validity
(Chen, 2012)
A Rasch Analysis suggested revising the original 4-point scale into a 3-point scale. Tasks of “place hand behind head” and “place hand on top of head” showed poor item fit and item bias relevant to participant’s ages.
(Sivan, 2011)
This study examined outcome measures that are currently being used in robot-assisted exercise trials in stroke. They rated the ARAT as having high/excellent test-retest reliability and inter-rater reliability, moderate construct validity and responsiveness, poor with respect to floor and ceiling effects, and a moderate burden overall. Also, for patients both less than or more than six months post-stroke with Moderate impairment (Fugl-Meyer >25) the ARAT was a recommended measure of activity and participation.
For more information visit www.neuropt.org or email [email protected]
(Nordin, 2014)
This study examined percent intra- and inter-rater reliability across 35 participants a median of 22 months post-stroke. Items 10, 11, 14, and 19 had some systematic disagreement within raters and items 1, 4, 17, and 19 between raters. Item 19 (hand to mouth) had the most disagreements. In general the greatest difficulties were deciding between a score of 2 or 3.
(Croarkin, 2004)
This evidence-based literature review ranked different tests of upper extremity function based on their psychometric properties. They ranked the ARAT as Level II: Established by evidence for inter-rater reliability and concurrent and convergent validity.
(Velstra, 2011)
In this systematic review, the authors examined how multiple measures of upper extremity function related to the International Classification of Functioning, Disability, and Health. The ARAT addressed the mobility at several joints category under the Body Functions and Body Structures domain 17 timess. Under the Activities and Participation domain 1 time fine hand use was covered, 6 times for grasping, 1 for turning or twisting the hands or arms, and 1 for drinking. One item was found not linked.
Do you see an error or have a suggestion for this instrument summary? Please e-mail us!
Bibliography Awert ,H.J, Keiser S, Kromme, CH, Vliet, TP, Vlieland, V, Meesters, J.J. (2015) “Validity of the Michigan Hand Outcomes Questionnaire in patients with stroke” Arch of Phys Med and Rehab. www.archives-pmr.org. ? details and pub med?
Beebe, J. A. and Lang, C. E. (2009). "Relationships and Responsiveness of Six Upper Extremity Function Tests During the First Six Months of Recovery After Stroke." Journal of Neurologic Physical Therapy 33(2): 96-103 Find it on PubMed
Chen, H., Lin K., Wu, C., Chen, C. (2012). “Rasch validation and predictive validity of the action research arm test in patients receiving stroke rehabilitation.” Arch Phys Med Rehabil 93: 1039-1045.
Chuang, L., Wu, C., Lin, K. (2012). “Reliability, validity, and responsiveness of myotonometric measurement of muscle tone, elasticity, and stiffness in patients with stroke.” Arch Phys Med Rehabil 93: 532-540.
Croarkin, E. Danoff, J., Barnes, C. (2004). “Evidence-based rating of upper-extremity motor function tests used for people following stroke.” Phys Ther 84(1):62-74.
For more information visit www.neuropt.org or email [email protected]
Edwards, D.F., Lang, C.E., Wagner, J.M., Birkenmeier R.L., Dromerick, A.W. (2012). “An evaluation of the Wolf Motor Function Test in motor trials early after stroke.” Arch Phys Med Rehabil 93:660-668.
Houwink, A., Roorda, L.D., Smits, W., Molenaar, I.W., Geurts, A.C. (2011). “Measuring upper limb capacity in patients after stroke: reliability and validity of the stroke upper limb capacity scale.” Arch Phys Med Rehabil 92: 1418-1422.
Hsieh, Y., Wu, C., Lin, K., Chang, Y., Chen, C., Liu, J. (2009). “Responsiveness and validity of three outcome measures of motor function after stroke rehabilitation.” Strok 40:1386-1391.
Hsueh, I., Hsieh, C. (2002). “Responsiveness of two upper extremity function instruments for stroke inpatients receiving rehabilitation.” Clin Rehabil 16: 617-624.
Lang, C., Edwards, D., et al. (2008). "Estimating minimal clinically important differences of upper extremity measures early after stroke." Archives of physical medicine and rehabilitation 89(9): 1693. Find it on PubMed
Lang, C. E., Wagner, J. M., et al. (2006). "Measurement of upper-extremity function early after stroke: properties of the action research arm test." Arch Phys Med Rehabil 87(12): 1605-1610. Find it on PubMed
Lee, G.,An, A., Lee, Y., Lee, D., Park, D. (2015) “Predictive factors of hypertonia in the upper extremity of chronic stroke survivors.” J Phys Ther Sci 27: 2545-2449.
Lee, J., Park, J.H., Kim, Y. (2015). “Sensitivity of the accelerometer as a measurement tool for upper extremity movement by stroke patients: a comparison with the action research arm test.” J Phys Ther Sci 27: 1053-1054.
Li, K-y, Lin, K-c, Chen C-k, Liing R-j, WU, C-y, Chang, W-y (2015) “Concurrent and predictive validity of arm kinematics with and without a trunk restraint during a reaching task in individuals with stroke.” Arch of Phys Med and Rehab:96:1666-75 Add pub med link
Lin, J.-H., Hsu, M.-J., et al. (2009). "Psychometric comparisons of 4 measures for assessing upper-extremity function in people with stroke." Phys Ther 89: 840-850. Find it on PubMed
Lin K-c, Chuang L-l, Wu C-y, Hsieh Y-w. (2010) Responsiveness and validity of three dexterous function measures in stroke rehabilitation. J of Rehabilitation Research and Development:;47 (4): 563-572
Lyle, R. C. (1981). "A performance test for assessment of upper limb function in physical rehabilitation treatment and research." Int J Rehabil Res 4(7333761): 483-492. Find it on PubMed
For more information visit www.neuropt.org or email [email protected]
McDonnell, M. (2008). "Action research arm test." Aust J Physiother 54(3): 220. Find it on PubMed
Murphy, MA, Willen Cand Sunnerhagen KS.(2013) “Responsiveness of upper extremity kinematic measures and clinical improvement during the first three months after stroke.” 27 (9): 844-853
Nijland, R., van Wegen, E., et al. (2010). "A comparison of two validated tests for upper limb function after stroke: The Wolf Motor Function Test and the Action Research Arm Test." J Rehabil Med 42(7): 694-696. Find it on PubMed
Nordin, A., Murphy, M.A., Danielsson, A. (2014) “Intra-rater and inter-rater reliability at the item level of the action research arm test for patients with stroke.” J Rehabil Med 46: 738-745.
O’Dell, M.W., Kim, G., Rivera, L., et al. (2013) “A psychometric evaluation of the arm motor ability test.” J Rehabil Med 45 (6):510-527.
Page, S.J., Levine, P., Hade, E. (2012). “Psychometric properties and administration of the Wrist/Hand Subscales of the Fugl-Meyer Assessment in minimally impaire upper extremity hemiparesis in stroke.” 93: 2373-2376.
Page, S.J., Hade, E., Persch, A. (2015). “Psychometrics of the wrist stability and hand mobility subscales of the Fugl-Meyer Assessment in moderately impaired stroke.” Phys Ther 95(1): 103-108.
Platz, T., Pinkowski, C., et al. (2005). "Reliability and validity of arm function assessment with standardized guidelines for the Fugl-Meyer Test, Action Research Arm Test and Box and Block Test: a multicentre study." Clin Rehabil 19: 404-411. Find it on PubMed
Rabadi, MH, Rabadi FM. (2006) “Comparison of the action research arm test and the Fugl-Meyer assessment as measures of upper-extremity motor weakness after stroke.” Arch Phys Med Rehabil 87(7):962-6
Simpson, L.A., Eng, J.J. (2013) “Functional recovery following stroke: capturing changes in upper extremity function.” Neurorehabil Neural Repair 17(3): 240-250.
Sivan, M., O’Connor, R.J., Makower, S., Levesley, M., Bhakta, B. (2011) “Systematic review of outcome measures used in the evaluation of robot-assisted upper limb exercise in stroke.” J Rehabil Med 43:181-189.
van der Lee, J. H., Beckerman, H., et al. (2001). "The responsiveness of the Action Research Arm test and the Fugl-Meyer Assessment scale in chronic stroke patients." J Rehabil Med 33(3): 110-113. Find it on PubMed
For more information visit www.neuropt.org or email [email protected]
Van der Lee, J. H., De Groot, V., et al. (2001). "The intra- and interrater reliability of the action research arm test: a practical test of upper extremity function in patients with stroke." Arch Phys Med Rehabil 82(1): 14-19. Find it on PubMed
van der Lee, J. H., Roorda, L. D., et al. (2002). "Improving the Action Research Arm test: a unidimensional hierarchical scale." Clin Rehabil 16(6): 646-653. Find it on PubMed
Velstra, I., Ballert, C.S., Cieza, A. (2011). “A systematic literature review of outcome measures for upper extremity function using the international classification of functioning, disability, and health as reference.” American Academy of Physical Medicine and Rehabilitation 3: 846-860.
Wei, X., Tong, K., Hu, X. (2011). “The responsiveness and correlation between Fugl-Meyer Assessment, Motor Status Scale, and the Action Research Arm Test in chronic stroke with upper-extremity rehabilitation robotic training.” International J of Rehabilitation Research 34 (4): 349-356.
Yozbatiran, N., Der-Yeghiaian, L., et al. (2008). "A standardized approach to performing the action research arm test." Neurorehabil Neural Repair 22(1): 78-90. Find it on PubMed
Year published 1981
Instrument in PDF Format
Yes
Approval Status Approved
For more information visit www.neuropt.org or email [email protected]
2. REHAB MEASURES: ARM MOTOR ABILITY TEST
Link to instrument
Title of Assessment Arm Motor Ability Test - 13
Acronym AMAT
Instrument Reviewer(s) Initially reviewed by Jane Sullivan PT, DHS, MS and the Stroke EDGE task force of the Academy of Neurologic Physical Therapy - a component of APTA. Updated by Michele Sulwer, PT, DPT, NCS and Genevieve Pinto-Zipp, PT, EdD of the StrokEDGE II, Academy of Neurologic Physical Therapy - a component of APTA, in 3/2016
Summary Date 8/30/2013; March 2016
Purpose To evaluate disabilities in upper extremity function in activities of daily living (ADL) using a quantitative and qualitative measure.
Description The test consists of 13 ADL activities involving one to three component tasks or movement segments. As in the case of most ADL, the components within each compound task either involve differential contributions from the two arms, or of the distal and proximal musculature of an affected arm, or are not of equal difficulty. This, the task components in this assessment are measured separately. However, each compound task is performed continuously, as a unit, without the patient’s awareness of component parcellation. One is therefore able to quantify ADL in the manner of a laboratory test without interfering with the natural flow of movement characteristic of everyday activity.
Each of tasks is timed and rated according to quality of movement and ability to perform each component part of a compound task. Tasks have either a 1 or 2 minute performance time limit.
Area of Assessment Activities of Daily Living; Upper Extremity Function
Body Part Upper Extremity
ICF Domain Activity
Domain ADL
Assessment Type Performance Measure
For more information visit www.neuropt.org or email [email protected]
Length of Test 31 to 60 Minutes
Time to Administer 30-40 minutes
Number of Items 28
Equipment Required • Shoe
• Telephone
• Shirt
In order to assure a standard placement of test objects, a laminated template is used. This can be constructed according to directions or purchased by contacting: Edward Taub, Ph.D, Department of Psychology, 415 Campbell Hall, University of Alabama at Birmingham, Birmingham, AL 35294
Training Required Reading an article/manual
Type of training required Reading an Article/Manual
Cost Not Free
Actual Cost $25; A test template can be obtained from the address below:
Edward Taub, Ph.D, Department of Psychology, 415 Campbell Hall, University of Alabama at Birmingham, Birmingham, AL 35294
Age Range Adults
Administration Mode Paper and Pencil
Diagnosis Stroke
Populations Tested Stroke
Standard Error of Measurement (SEM)
Not Established
Minimal Detectable Change (MDC)
Stroke:
For more information visit www.neuropt.org or email [email protected]
(Kopp et al, 1997; n = 33 subacute stroke inpatients with moderate to mild upper extremity motor deficit; median age = 66 years; sex = 12 females; median Motricity Index Arm Score = 89; median chronicity = 43 days)
• In individuals with subacute stroke and mild to moderate movement deficits, the AMAT detected the difference in change occurring as a result of the passage of 1 versus 2 weeks.
Minimally Clinically Important Difference (MCID)
Not Established
Cut-Off Scores Not Established
Normative Data Not Established
Test-retest Reliability Stroke:
(Kopp et al, 1997)
• Excellent test-retest reliability (ICC = 0.93 - 0.99)
Interrater/Intrarater Reliability
Stroke:
(Kopp et al, 1997)
• Excellent interrater reliability (ICC = 0.95 - 0.99)
Internal Consistency Not Established
Criterion Validity (Predictive/Concurrent)
Stroke:
(Kopp et al, 1997)
• Adequate to excellent concurrent validity with the Motricity-Index-Arm (correlation coefficient = 0.45-0.61)
(Chae et al, 2003)
• Excellent concurrent validity with the Fugl-Meyer Assessment (correlation coefficient = 0.92-0.94)
Construct Validity (Convergent/Discriminant)
Stroke:
(Kopp et al, 1997)
For more information visit www.neuropt.org or email [email protected]
• Adequate to excellent correlation with Motricity-Index-Arm (r = 0.45 – 0.61)
(Chae et al, 2003; n = 30 chronic stroke survivors)
• Excellent correlation with Fugl-Meyer Assessment
Content Validity Not Established
Face Validity Not Established
Floor/Ceiling Effects Stroke:
The AMAT time of performance exhibited significant ceiling and floor effects with respect to the Fugl-Meyer Assessment (Chae et al, 2003).
Responsiveness Stroke:
In individuals with subacute stroke and mild to moderate movement deficits, the AMAT detected the difference in change occurring as a result of the passage of 1 versus 2 weeks (Kopp et al, 1997).
Professional Association Recommendations
Recommendations for use of the instrument from the Academy of Neurologic Physical Therapy of the American Physical Therapy Association’s Multiple Sclerosis Taskforce (MSEDGE), Parkinson’s Taskforce (PD EDGE), Spinal Cord Injury Taskforce (PD EDGE), Stroke Taskforce (StrokEDGE), Traumatic Brain Injury Taskforce (TBI EDGE), and Vestibular Taskforce (VEDGE) are listed below. These recommendations were developed by a panel of research and clinical experts using a modified Delphi process.
For detailed information about how recommendations were made, please visit: http://www.neuropt.org/go/healthcare-professionals/neurology-section-outcome-measures-recommendations
Abbreviations:
HR Highly Recommend
R Recommend
LS / UR Reasonable to use, but limited study in target group / Unable to Recommend
For more information visit www.neuropt.org or email [email protected]
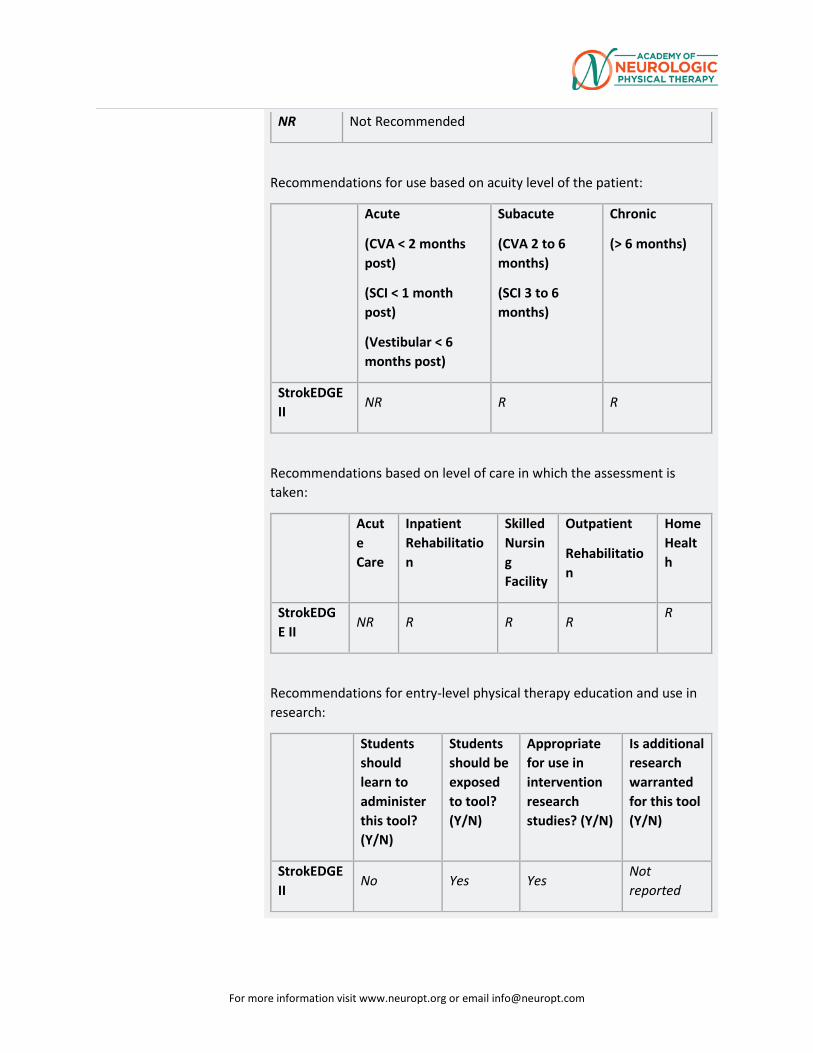
NR Not Recommended
Recommendations for use based on acuity level of the patient:
Acute
(CVA < 2 months post)
(SCI < 1 month post)
(Vestibular < 6 months post)
Subacute
(CVA 2 to 6 months)
(SCI 3 to 6 months)
Chronic
(> 6 months)
StrokEDGE II
NR R R
Recommendations based on level of care in which the assessment is taken:
Acute Care
Inpatient Rehabilitation
Skilled Nursing Facility
Outpatient
Rehabilitation
Home Health
StrokEDGE II
NR R R R R
Recommendations for entry-level physical therapy education and use in research:
Students should learn to administer this tool? (Y/N)
Students should be exposed to tool? (Y/N)
Appropriate for use in intervention research studies? (Y/N)
Is additional research warranted for this tool (Y/N)
StrokEDGE II
No Yes Yes Not reported
For more information visit www.neuropt.org or email [email protected]
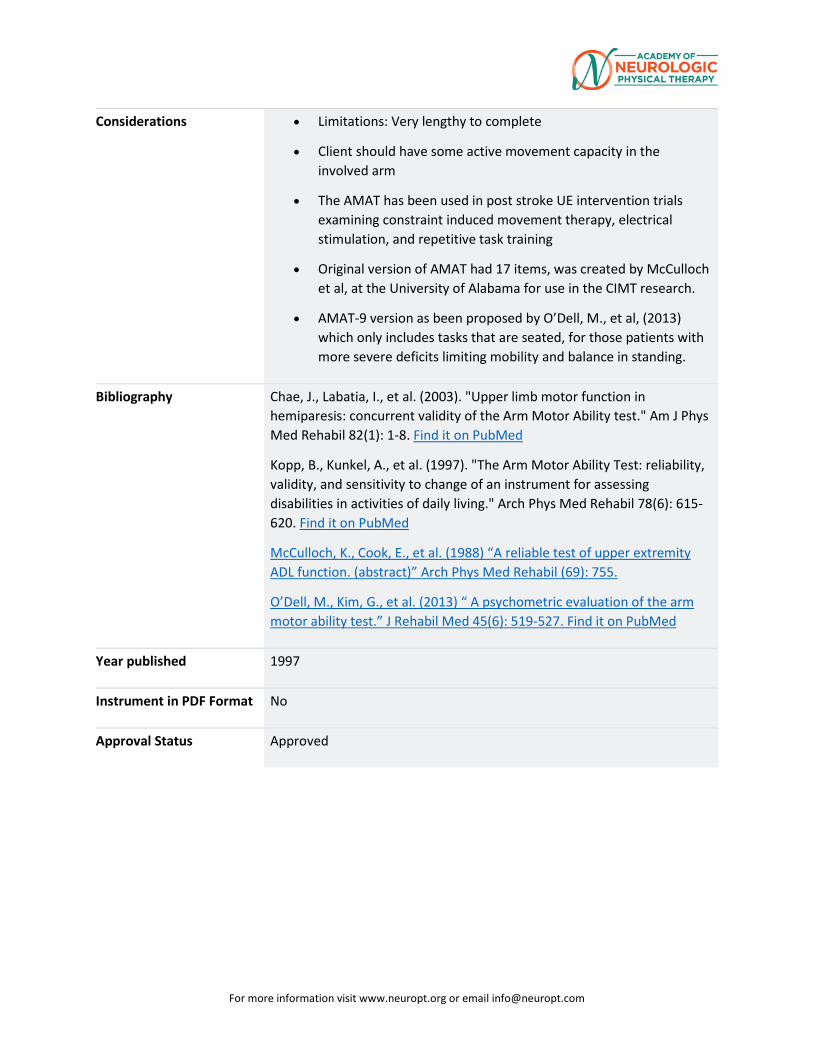
Considerations • Limitations: Very lengthy to complete
• Client should have some active movement capacity in the involved arm
• The AMAT has been used in post stroke UE intervention trials examining constraint induced movement therapy, electrical stimulation, and repetitive task training
• Original version of AMAT had 17 items, was created by McCulloch et al, at the University of Alabama for use in the CIMT research.
• AMAT-9 version as been proposed by O’Dell, M., et al, (2013) which only includes tasks that are seated, for those patients with more severe deficits limiting mobility and balance in standing.
Bibliography Chae, J., Labatia, I., et al. (2003). "Upper limb motor function in hemiparesis: concurrent validity of the Arm Motor Ability test." Am J Phys Med Rehabil 82(1): 1-8. Find it on PubMed
Kopp, B., Kunkel, A., et al. (1997). "The Arm Motor Ability Test: reliability, validity, and sensitivity to change of an instrument for assessing disabilities in activities of daily living." Arch Phys Med Rehabil 78(6): 615-620. Find it on PubMed
McCulloch, K., Cook, E., et al. (1988) “A reliable test of upper extremity ADL function. (abstract)” Arch Phys Med Rehabil (69): 755.
O’Dell, M., Kim, G., et al. (2013) “ A psychometric evaluation of the arm motor ability test.” J Rehabil Med 45(6): 519-527. Find it on PubMed
Year published 1997
Instrument in PDF Format No
Approval Status Approved
For more information visit www.neuropt.org or email [email protected]
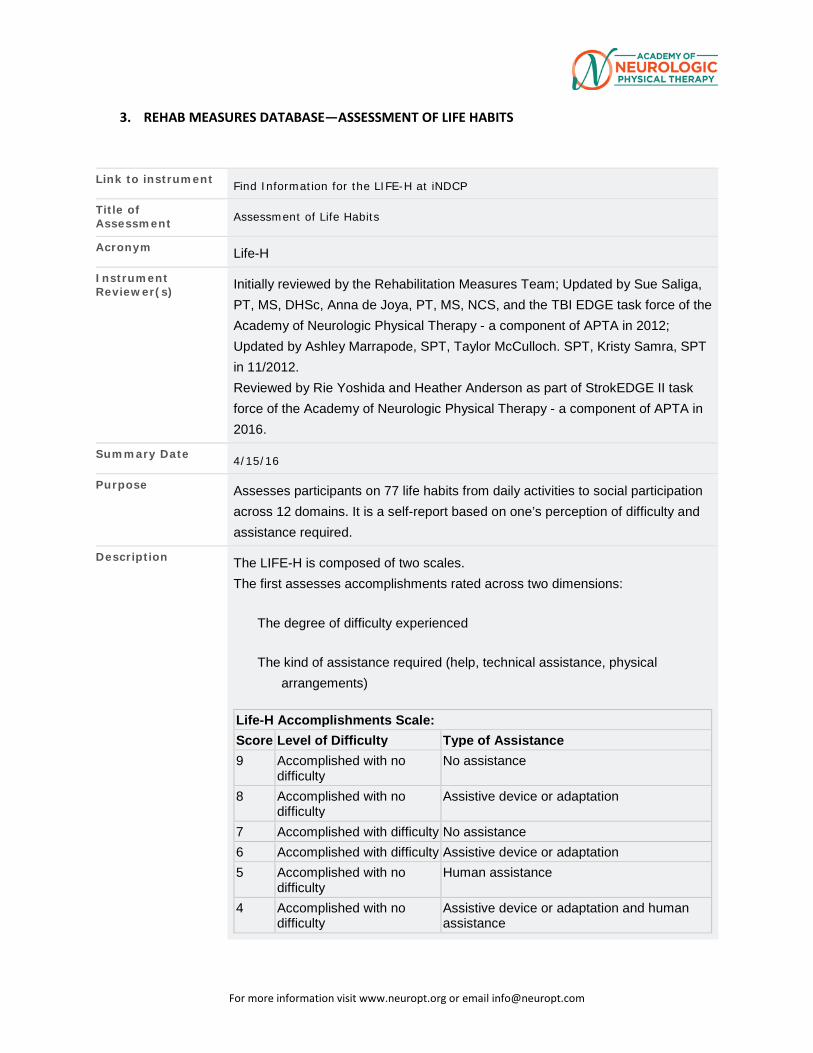
3. REHAB MEASURES DATABASE—ASSESSMENT OF LIFE HABITS
Link to instrument Find Information for the LIFE-H at iNDCP
Title of Assessment Assessment of Life Habits
Acronym Life-H
Instrument Reviewer(s) Initially reviewed by the Rehabilitation Measures Team; Updated by Sue Saliga,
PT, MS, DHSc, Anna de Joya, PT, MS, NCS, and the TBI EDGE task force of the Academy of Neurologic Physical Therapy - a component of APTA in 2012; Updated by Ashley Marrapode, SPT, Taylor McCulloch. SPT, Kristy Samra, SPT in 11/2012. Reviewed by Rie Yoshida and Heather Anderson as part of StrokEDGE II task force of the Academy of Neurologic Physical Therapy - a component of APTA in 2016.
Summary Date 4/15/16
Purpose Assesses participants on 77 life habits from daily activities to social participation across 12 domains. It is a self-report based on one’s perception of difficulty and assistance required.
Description The LIFE-H is composed of two scales. The first assesses accomplishments rated across two dimensions:
The degree of difficulty experienced
The kind of assistance required (help, technical assistance, physical arrangements)
Life-H Accomplishments Scale: Score Level of Difficulty Type of Assistance 9 Accomplished with no
difficulty No assistance
8 Accomplished with no difficulty
Assistive device or adaptation
7 Accomplished with difficulty No assistance 6 Accomplished with difficulty Assistive device or adaptation 5 Accomplished with no
difficulty Human assistance
4 Accomplished with no difficulty
Assistive device or adaptation and human assistance
For more information visit www.neuropt.org or email [email protected]
3 Accomplished with difficulty Human assistance 2 Accomplished with difficulty Assistive device or adaptation and human
assistance 1 Accomplished by a proxy
0 Not accomplished
N/A Not applicable
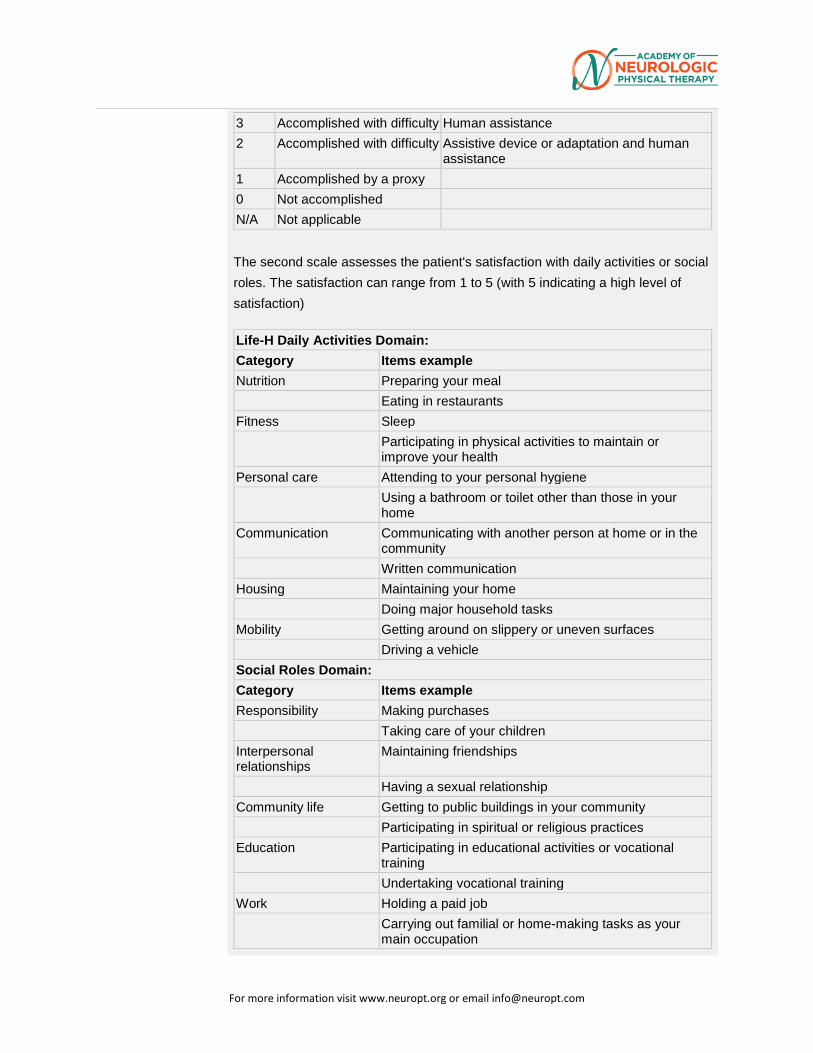
The second scale assesses the patient's satisfaction with daily activities or social roles. The satisfaction can range from 1 to 5 (with 5 indicating a high level of satisfaction)
Life-H Daily Activities Domain: Category Items example Nutrition Preparing your meal
Eating in restaurants Fitness Sleep
Participating in physical activities to maintain or improve your health
Personal care Attending to your personal hygiene Using a bathroom or toilet other than those in your home
Communication Communicating with another person at home or in the community Written communication
Housing Maintaining your home Doing major household tasks
Mobility Getting around on slippery or uneven surfaces Driving a vehicle
Social Roles Domain: Category Items example Responsibility Making purchases
Taking care of your children Interpersonal relationships
Maintaining friendships
Having a sexual relationship Community life Getting to public buildings in your community
Participating in spiritual or religious practices Education Participating in educational activities or vocational
training Undertaking vocational training
Work Holding a paid job Carrying out familial or home-making tasks as your main occupation
For more information visit www.neuropt.org or email [email protected]
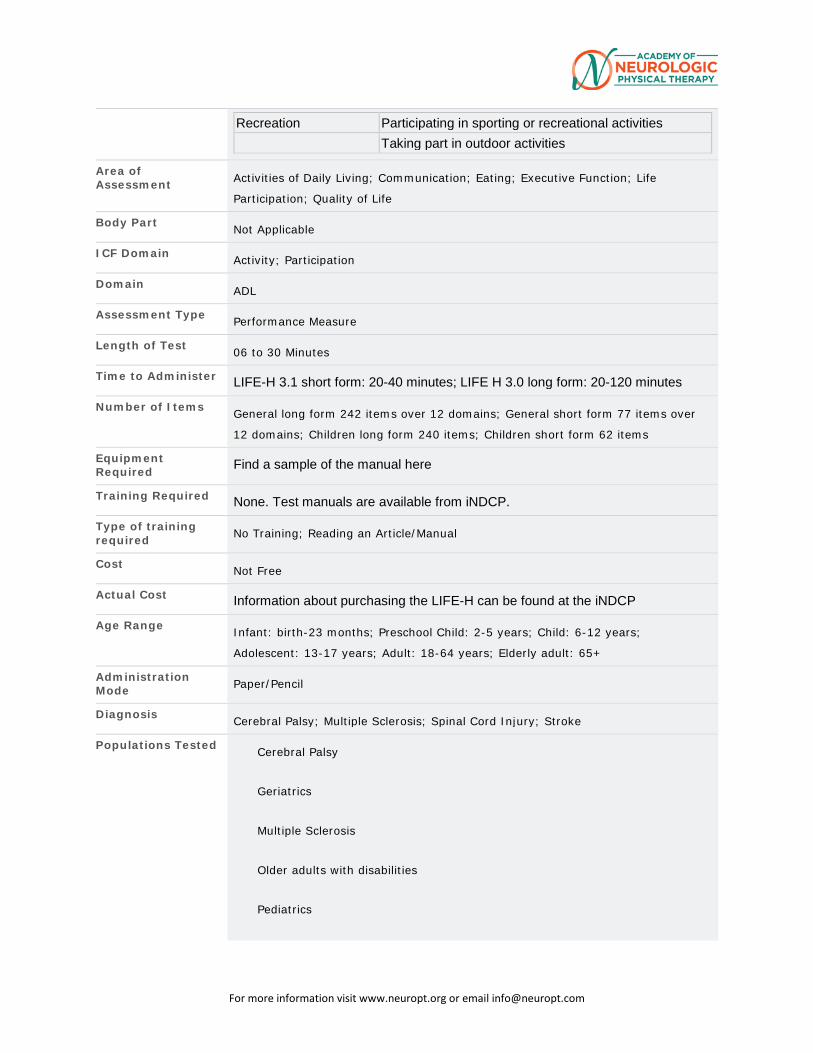
Recreation Participating in sporting or recreational activities Taking part in outdoor activities
Area of Assessment Activities of Daily Living; Communication; Eating; Executive Function; Life
Participation; Quality of Life
Body Part Not Applicable
ICF Domain Activity; Participation
Domain ADL
Assessment Type Performance Measure
Length of Test 06 to 30 Minutes
Time to Administer LIFE-H 3.1 short form: 20-40 minutes; LIFE H 3.0 long form: 20-120 minutes
Number of Items General long form 242 items over 12 domains; General short form 77 items over
12 domains; Children long form 240 items; Children short form 62 items
Equipment Required Find a sample of the manual here
Training Required None. Test manuals are available from iNDCP.
Type of training required No Training; Reading an Article/Manual
Cost Not Free
Actual Cost Information about purchasing the LIFE-H can be found at the iNDCP
Age Range Infant: birth-23 months; Preschool Child: 2-5 years; Child: 6-12 years;
Adolescent: 13-17 years; Adult: 18-64 years; Elderly adult: 65+
Administration Mode Paper/Pencil
Diagnosis Cerebral Palsy; Multiple Sclerosis; Spinal Cord Injury; Stroke
Populations Tested Cerebral Palsy
Geriatrics
Multiple Sclerosis
Older adults with disabilities
Pediatrics
For more information visit www.neuropt.org or email [email protected]
SCI
Stroke
Traumatic Brain Injury
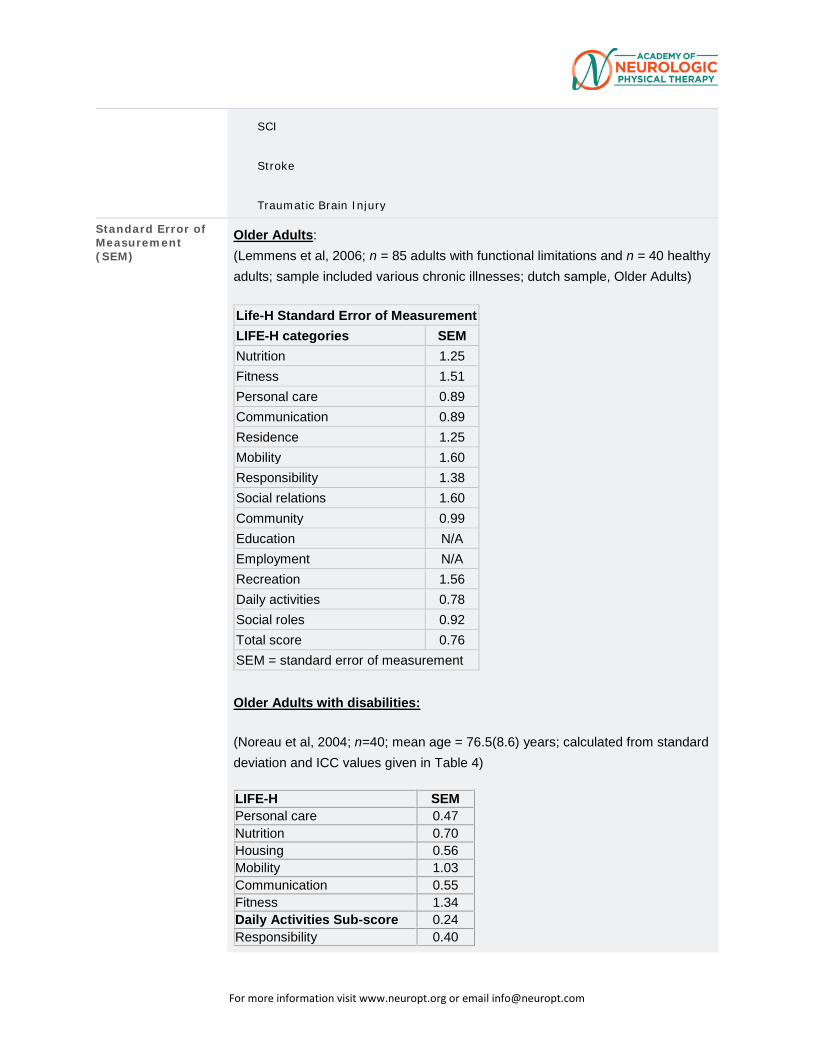
Standard Error of Measurement (SEM)
Older Adults: (Lemmens et al, 2006; n = 85 adults with functional limitations and n = 40 healthy adults; sample included various chronic illnesses; dutch sample, Older Adults) Life-H Standard Error of Measurement LIFE-H categories SEM Nutrition 1.25 Fitness 1.51 Personal care 0.89 Communication 0.89 Residence 1.25 Mobility 1.60 Responsibility 1.38 Social relations 1.60 Community 0.99 Education N/A Employment N/A Recreation 1.56 Daily activities 0.78 Social roles 0.92 Total score 0.76 SEM = standard error of measurement
Older Adults with disabilities:
(Noreau et al, 2004; n=40; mean age = 76.5(8.6) years; calculated from standard deviation and ICC values given in Table 4)
LIFE-H SEM Personal care 0.47 Nutrition 0.70 Housing 0.56 Mobility 1.03 Communication 0.55 Fitness 1.34 Daily Activities Sub-score 0.24 Responsibility 0.40
For more information visit www.neuropt.org or email [email protected]
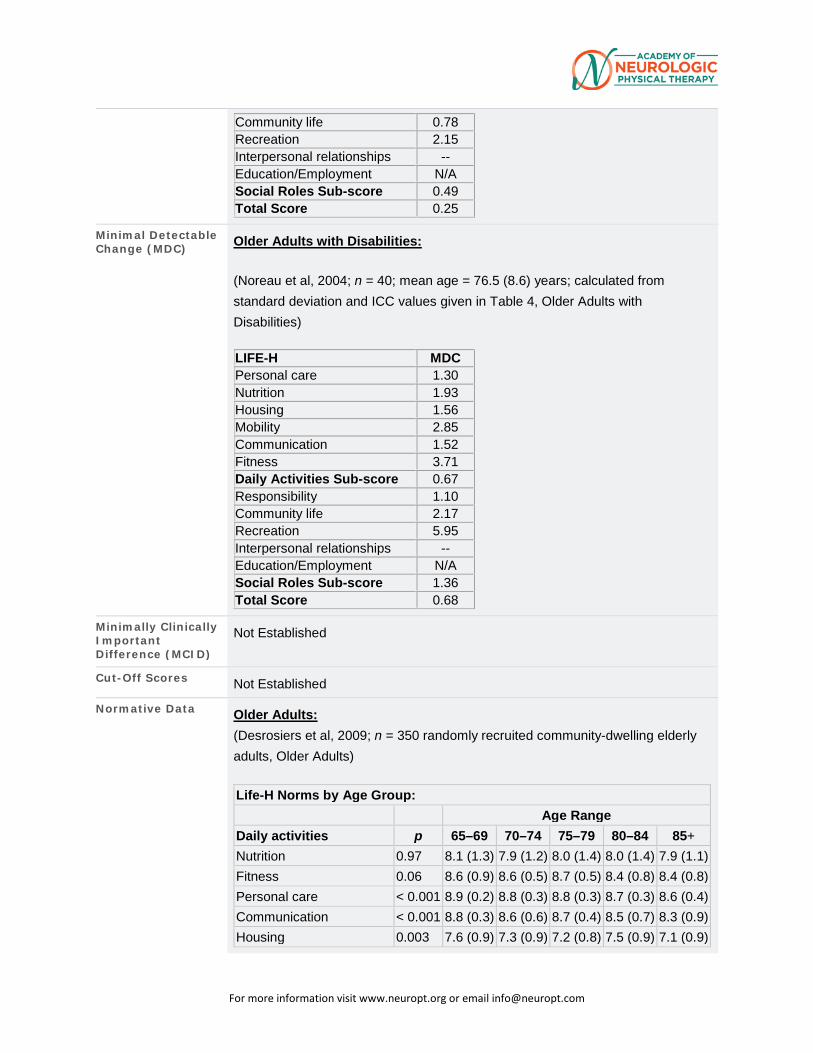
Community life 0.78 Recreation 2.15 Interpersonal relationships -- Education/Employment N/A Social Roles Sub-score 0.49 Total Score 0.25
Minimal Detectable Change (MDC) Older Adults with Disabilities:
(Noreau et al, 2004; n = 40; mean age = 76.5 (8.6) years; calculated from standard deviation and ICC values given in Table 4, Older Adults with Disabilities)
LIFE-H MDC Personal care 1.30 Nutrition 1.93 Housing 1.56 Mobility 2.85 Communication 1.52 Fitness 3.71 Daily Activities Sub-score 0.67 Responsibility 1.10 Community life 2.17 Recreation 5.95 Interpersonal relationships -- Education/Employment N/A Social Roles Sub-score 1.36 Total Score 0.68
Minimally Clinically Important Difference (MCID)
Not Established
Cut-Off Scores Not Established
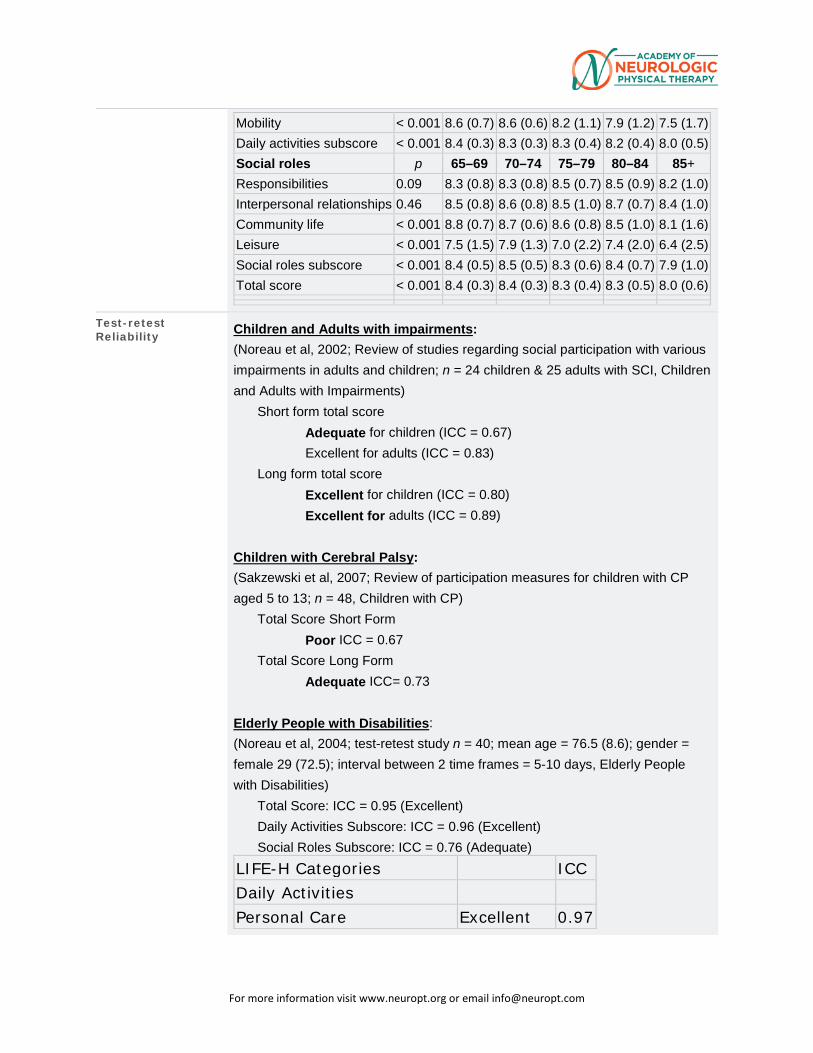
Normative Data Older Adults: (Desrosiers et al, 2009; n = 350 randomly recruited community-dwelling elderly adults, Older Adults) Life-H Norms by Age Group:
Age Range Daily activities p 65–69 70–74 75–79 80–84 85+ Nutrition 0.97 8.1 (1.3) 7.9 (1.2) 8.0 (1.4) 8.0 (1.4) 7.9 (1.1) Fitness 0.06 8.6 (0.9) 8.6 (0.5) 8.7 (0.5) 8.4 (0.8) 8.4 (0.8) Personal care < 0.001 8.9 (0.2) 8.8 (0.3) 8.8 (0.3) 8.7 (0.3) 8.6 (0.4) Communication < 0.001 8.8 (0.3) 8.6 (0.6) 8.7 (0.4) 8.5 (0.7) 8.3 (0.9) Housing 0.003 7.6 (0.9) 7.3 (0.9) 7.2 (0.8) 7.5 (0.9) 7.1 (0.9)
For more information visit www.neuropt.org or email [email protected]
Mobility < 0.001 8.6 (0.7) 8.6 (0.6) 8.2 (1.1) 7.9 (1.2) 7.5 (1.7) Daily activities subscore < 0.001 8.4 (0.3) 8.3 (0.3) 8.3 (0.4) 8.2 (0.4) 8.0 (0.5) Social roles p 65–69 70–74 75–79 80–84 85+ Responsibilities 0.09 8.3 (0.8) 8.3 (0.8) 8.5 (0.7) 8.5 (0.9) 8.2 (1.0) Interpersonal relationships 0.46 8.5 (0.8) 8.6 (0.8) 8.5 (1.0) 8.7 (0.7) 8.4 (1.0) Community life < 0.001 8.8 (0.7) 8.7 (0.6) 8.6 (0.8) 8.5 (1.0) 8.1 (1.6) Leisure < 0.001 7.5 (1.5) 7.9 (1.3) 7.0 (2.2) 7.4 (2.0) 6.4 (2.5) Social roles subscore < 0.001 8.4 (0.5) 8.5 (0.5) 8.3 (0.6) 8.4 (0.7) 7.9 (1.0) Total score < 0.001 8.4 (0.3) 8.4 (0.3) 8.3 (0.4) 8.3 (0.5) 8.0 (0.6)
Test-retest Reliability Children and Adults with impairments:
(Noreau et al, 2002; Review of studies regarding social participation with various impairments in adults and children; n = 24 children & 25 adults with SCI, Children and Adults with Impairments)
Short form total score Adequate for children (ICC = 0.67) Excellent for adults (ICC = 0.83)
Long form total score Excellent for children (ICC = 0.80) Excellent for adults (ICC = 0.89)
Children with Cerebral Palsy: (Sakzewski et al, 2007; Review of participation measures for children with CP aged 5 to 13; n = 48, Children with CP)
Total Score Short Form Poor ICC = 0.67
Total Score Long Form Adequate ICC= 0.73
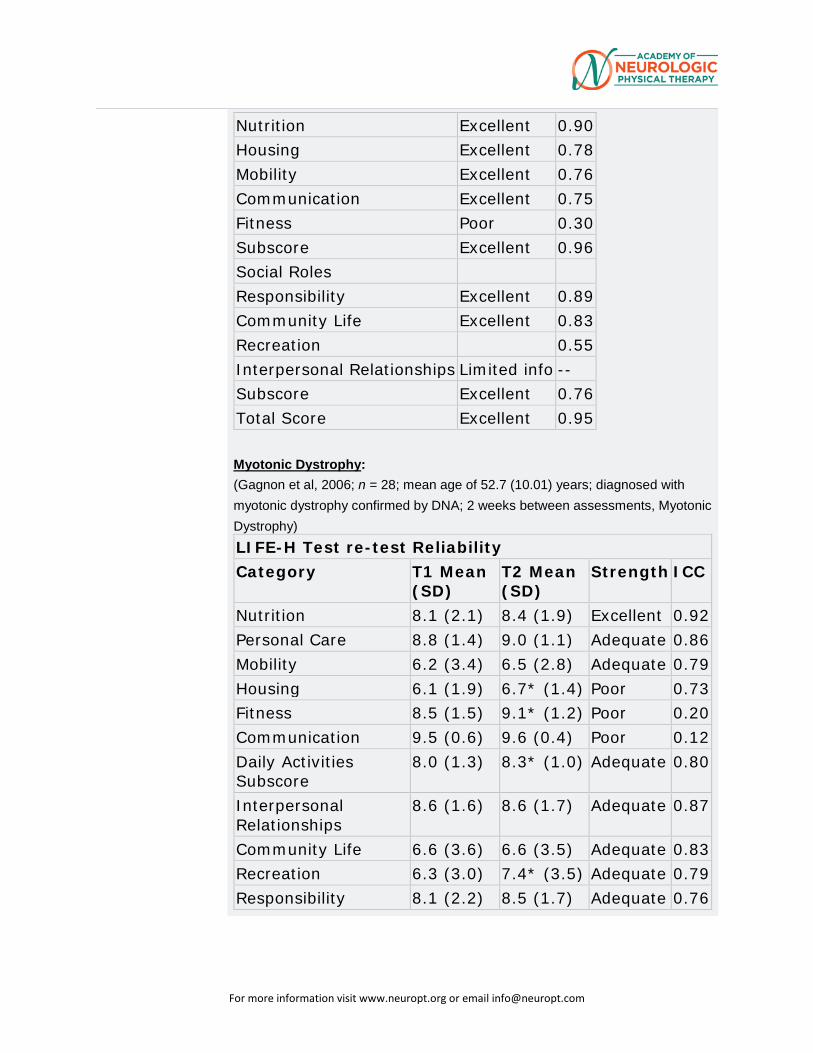
Elderly People with Disabilities: (Noreau et al, 2004; test-retest study n = 40; mean age = 76.5 (8.6); gender = female 29 (72.5); interval between 2 time frames = 5-10 days, Elderly People with Disabilities)
Total Score: ICC = 0.95 (Excellent) Daily Activities Subscore: ICC = 0.96 (Excellent) Social Roles Subscore: ICC = 0.76 (Adequate)
LIFE-H Categories
ICC Daily Activities
Personal Care Excellent 0.97
For more information visit www.neuropt.org or email [email protected]
Nutrition Excellent 0.90 Housing Excellent 0.78 Mobility Excellent 0.76 Communication Excellent 0.75 Fitness Poor 0.30 Subscore Excellent 0.96 Social Roles
Responsibility Excellent 0.89 Community Life Excellent 0.83 Recreation
0.55
Interpersonal Relationships Limited info -- Subscore Excellent 0.76 Total Score Excellent 0.95 Myotonic Dystrophy: (Gagnon et al, 2006; n = 28; mean age of 52.7 (10.01) years; diagnosed with myotonic dystrophy confirmed by DNA; 2 weeks between assessments, Myotonic Dystrophy) LIFE-H Test re-test Reliability Category T1 Mean
(SD) T2 Mean (SD)
Strength ICC
Nutrition 8.1 (2.1) 8.4 (1.9) Excellent 0.92 Personal Care 8.8 (1.4) 9.0 (1.1) Adequate 0.86 Mobility 6.2 (3.4) 6.5 (2.8) Adequate 0.79 Housing 6.1 (1.9) 6.7* (1.4) Poor 0.73 Fitness 8.5 (1.5) 9.1* (1.2) Poor 0.20 Communication 9.5 (0.6) 9.6 (0.4) Poor 0.12 Daily Activities Subscore
8.0 (1.3) 8.3* (1.0) Adequate 0.80
Interpersonal Relationships
8.6 (1.6) 8.6 (1.7) Adequate 0.87
Community Life 6.6 (3.6) 6.6 (3.5) Adequate 0.83 Recreation 6.3 (3.0) 7.4* (3.5) Adequate 0.79 Responsibility 8.1 (2.2) 8.5 (1.7) Adequate 0.76
For more information visit www.neuropt.org or email [email protected]
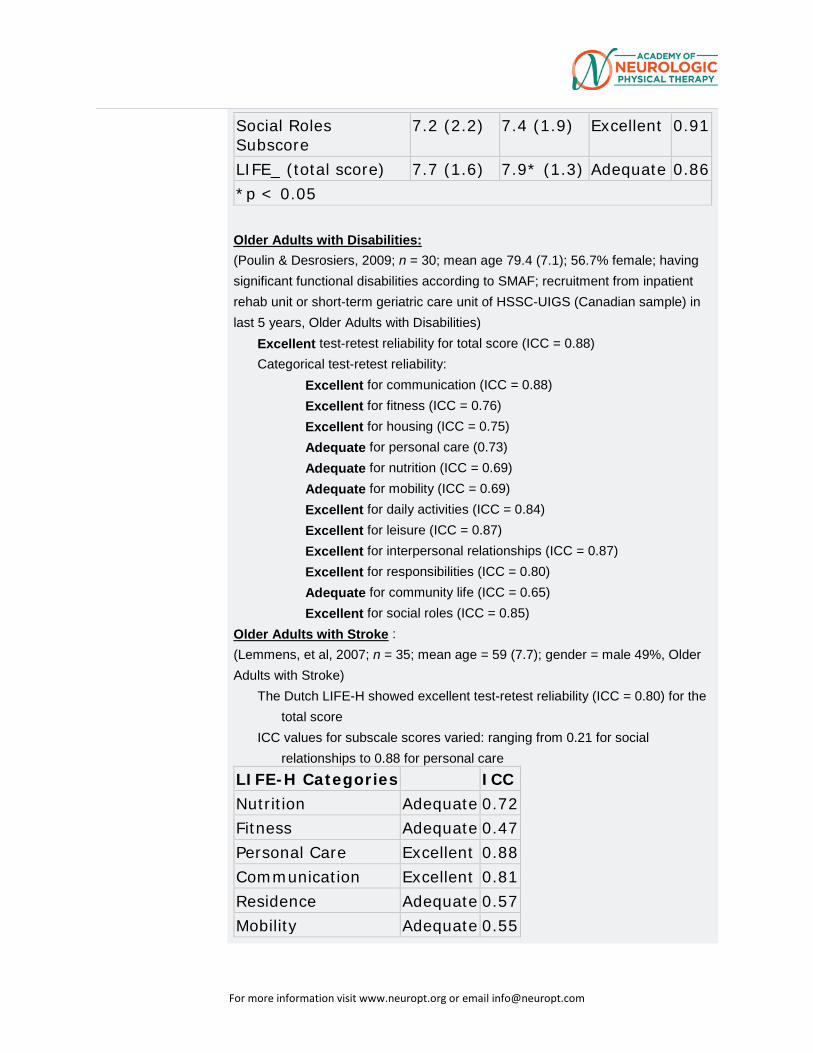
Social Roles Subscore
7.2 (2.2) 7.4 (1.9) Excellent 0.91
LIFE_ (total score) 7.7 (1.6) 7.9* (1.3) Adequate 0.86 *p < 0.05 Older Adults with Disabilities: (Poulin & Desrosiers, 2009; n = 30; mean age 79.4 (7.1); 56.7% female; having significant functional disabilities according to SMAF; recruitment from inpatient rehab unit or short-term geriatric care unit of HSSC-UIGS (Canadian sample) in last 5 years, Older Adults with Disabilities)
Excellent test-retest reliability for total score (ICC = 0.88) Categorical test-retest reliability:
Excellent for communication (ICC = 0.88) Excellent for fitness (ICC = 0.76) Excellent for housing (ICC = 0.75) Adequate for personal care (0.73) Adequate for nutrition (ICC = 0.69) Adequate for mobility (ICC = 0.69) Excellent for daily activities (ICC = 0.84) Excellent for leisure (ICC = 0.87) Excellent for interpersonal relationships (ICC = 0.87) Excellent for responsibilities (ICC = 0.80) Adequate for community life (ICC = 0.65) Excellent for social roles (ICC = 0.85)
Older Adults with Stroke : (Lemmens, et al, 2007; n = 35; mean age = 59 (7.7); gender = male 49%, Older Adults with Stroke)
The Dutch LIFE-H showed excellent test-retest reliability (ICC = 0.80) for the total score
ICC values for subscale scores varied: ranging from 0.21 for social relationships to 0.88 for personal care
LIFE-H Categories
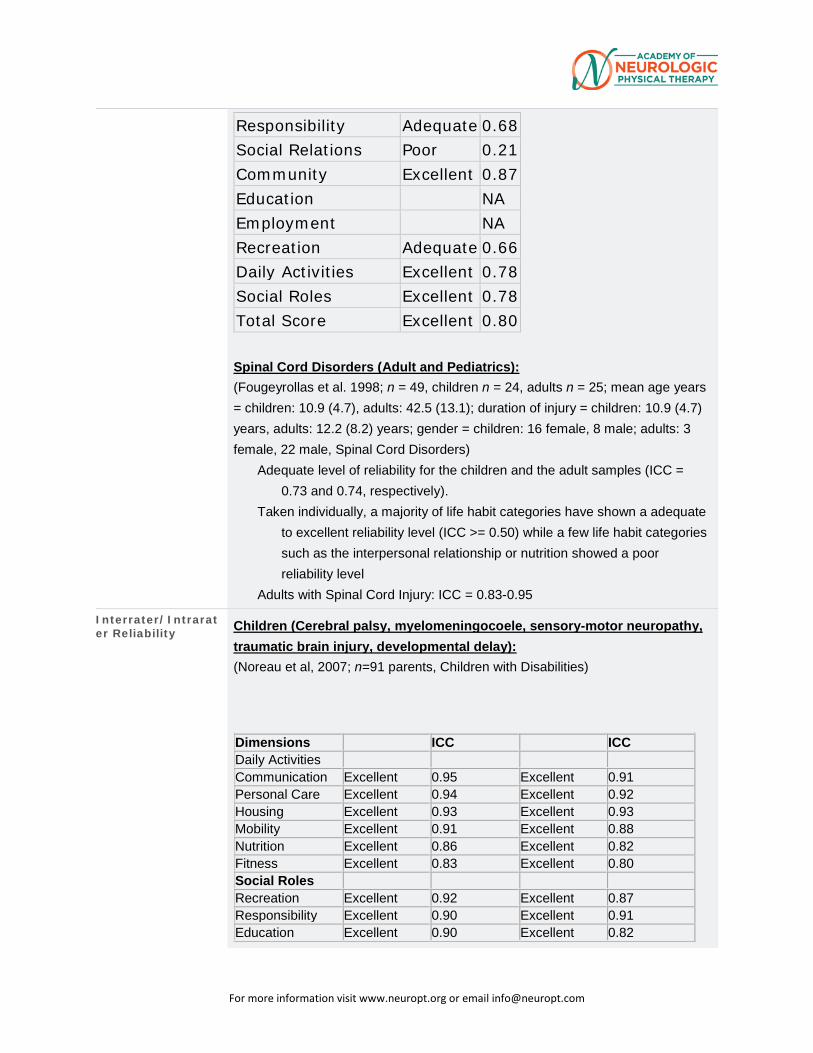
ICC Nutrition Adequate 0.72 Fitness Adequate 0.47 Personal Care Excellent 0.88 Communication Excellent 0.81 Residence Adequate 0.57 Mobility Adequate 0.55
For more information visit www.neuropt.org or email [email protected]
Responsibility Adequate 0.68 Social Relations Poor 0.21 Community Excellent 0.87 Education
NA
Employment
NA Recreation Adequate 0.66 Daily Activities Excellent 0.78 Social Roles Excellent 0.78 Total Score Excellent 0.80 Spinal Cord Disorders (Adult and Pediatrics): (Fougeyrollas et al. 1998; n = 49, children n = 24, adults n = 25; mean age years = children: 10.9 (4.7), adults: 42.5 (13.1); duration of injury = children: 10.9 (4.7) years, adults: 12.2 (8.2) years; gender = children: 16 female, 8 male; adults: 3 female, 22 male, Spinal Cord Disorders)
Adequate level of reliability for the children and the adult samples (ICC = 0.73 and 0.74, respectively).
Taken individually, a majority of life habit categories have shown a adequate to excellent reliability level (ICC >= 0.50) while a few life habit categories such as the interpersonal relationship or nutrition showed a poor reliability level
Adults with Spinal Cord Injury: ICC = 0.83-0.95
Interrater/Intrarater Reliability Children (Cerebral palsy, myelomeningocoele, sensory-motor neuropathy,
traumatic brain injury, developmental delay): (Noreau et al, 2007; n=91 parents, Children with Disabilities)
Dimensions
ICC
ICC Daily Activities
Communication Excellent 0.95 Excellent 0.91 Personal Care Excellent 0.94 Excellent 0.92 Housing Excellent 0.93 Excellent 0.93 Mobility Excellent 0.91 Excellent 0.88 Nutrition Excellent 0.86 Excellent 0.82 Fitness Excellent 0.83 Excellent 0.80 Social Roles
Recreation Excellent 0.92 Excellent 0.87 Responsibility Excellent 0.90 Excellent 0.91 Education Excellent 0.90 Excellent 0.82
For more information visit www.neuropt.org or email [email protected]
Community Life Excellent 0.78 Excellent 0.78 Interpersonal Relationships
Adequate 0.58 Adequate 0.63
Children with Cerebral Palsy: (Sakzewski et al, 2007; Review of participation measures for children with CP aged 5 to 13; n = 48, Children with CP)
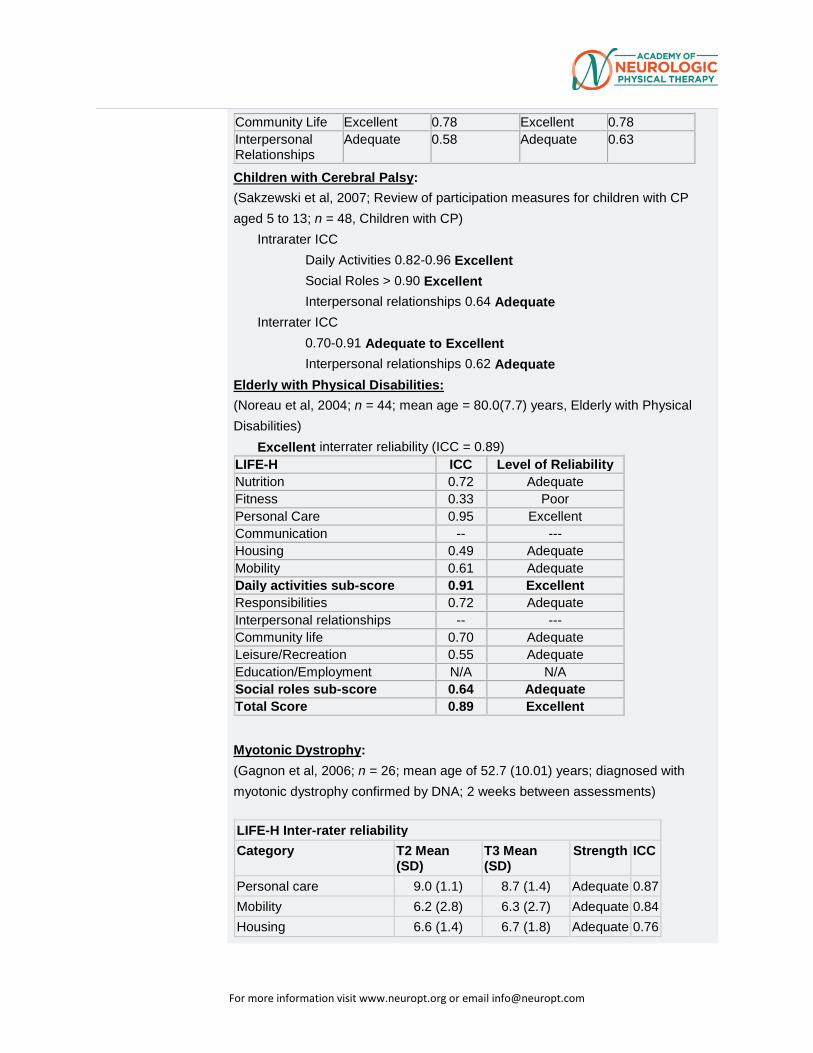
Intrarater ICC Daily Activities 0.82-0.96 Excellent Social Roles > 0.90 Excellent Interpersonal relationships 0.64 Adequate
Interrater ICC 0.70-0.91 Adequate to Excellent Interpersonal relationships 0.62 Adequate
Elderly with Physical Disabilities: (Noreau et al, 2004; n = 44; mean age = 80.0(7.7) years, Elderly with Physical Disabilities)
Excellent interrater reliability (ICC = 0.89) LIFE-H ICC Level of Reliability Nutrition 0.72 Adequate Fitness 0.33 Poor Personal Care 0.95 Excellent Communication -- --- Housing 0.49 Adequate Mobility 0.61 Adequate Daily activities sub-score 0.91 Excellent Responsibilities 0.72 Adequate Interpersonal relationships -- --- Community life 0.70 Adequate Leisure/Recreation 0.55 Adequate Education/Employment N/A N/A Social roles sub-score 0.64 Adequate Total Score 0.89 Excellent
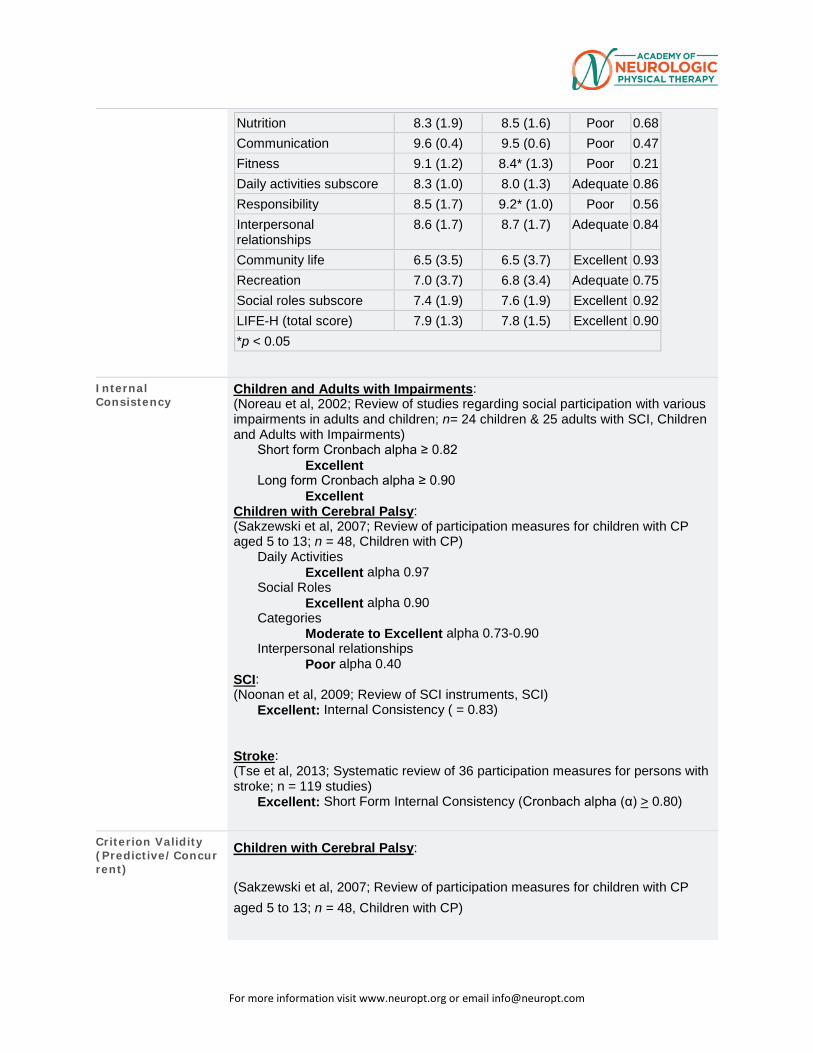
Myotonic Dystrophy: (Gagnon et al, 2006; n = 26; mean age of 52.7 (10.01) years; diagnosed with myotonic dystrophy confirmed by DNA; 2 weeks between assessments) LIFE-H Inter-rater reliability Category T2 Mean
(SD) T3 Mean (SD)
Strength ICC
Personal care 9.0 (1.1) 8.7 (1.4) Adequate 0.87 Mobility 6.2 (2.8) 6.3 (2.7) Adequate 0.84 Housing 6.6 (1.4) 6.7 (1.8) Adequate 0.76
For more information visit www.neuropt.org or email [email protected]
Nutrition 8.3 (1.9) 8.5 (1.6) Poor 0.68 Communication 9.6 (0.4) 9.5 (0.6) Poor 0.47 Fitness 9.1 (1.2) 8.4* (1.3) Poor 0.21 Daily activities subscore 8.3 (1.0) 8.0 (1.3) Adequate 0.86 Responsibility 8.5 (1.7) 9.2* (1.0) Poor 0.56 Interpersonal relationships
8.6 (1.7) 8.7 (1.7) Adequate 0.84
Community life 6.5 (3.5) 6.5 (3.7) Excellent 0.93 Recreation 7.0 (3.7) 6.8 (3.4) Adequate 0.75 Social roles subscore 7.4 (1.9) 7.6 (1.9) Excellent 0.92 LIFE-H (total score) 7.9 (1.3) 7.8 (1.5) Excellent 0.90 *p < 0.05
Internal Consistency
Children and Adults with Impairments: (Noreau et al, 2002; Review of studies regarding social participation with various impairments in adults and children; n= 24 children & 25 adults with SCI, Children and Adults with Impairments)
Short form Cronbach alpha ≥ 0.82 Excellent
Long form Cronbach alpha ≥ 0.90 Excellent
Children with Cerebral Palsy: (Sakzewski et al, 2007; Review of participation measures for children with CP aged 5 to 13; n = 48, Children with CP)
Daily Activities Excellent alpha 0.97
Social Roles Excellent alpha 0.90
Categories Moderate to Excellent alpha 0.73-0.90
Interpersonal relationships Poor alpha 0.40
SCI: (Noonan et al, 2009; Review of SCI instruments, SCI)
Excellent: Internal Consistency ( = 0.83)
Stroke: (Tse et al, 2013; Systematic review of 36 participation measures for persons with stroke; n = 119 studies)
Excellent: Short Form Internal Consistency (Cronbach alpha (α) > 0.80)
Criterion Validity (Predictive/Concurrent)
Children with Cerebral Palsy:
(Sakzewski et al, 2007; Review of participation measures for children with CP aged 5 to 13; n = 48, Children with CP)
For more information visit www.neuropt.org or email [email protected]
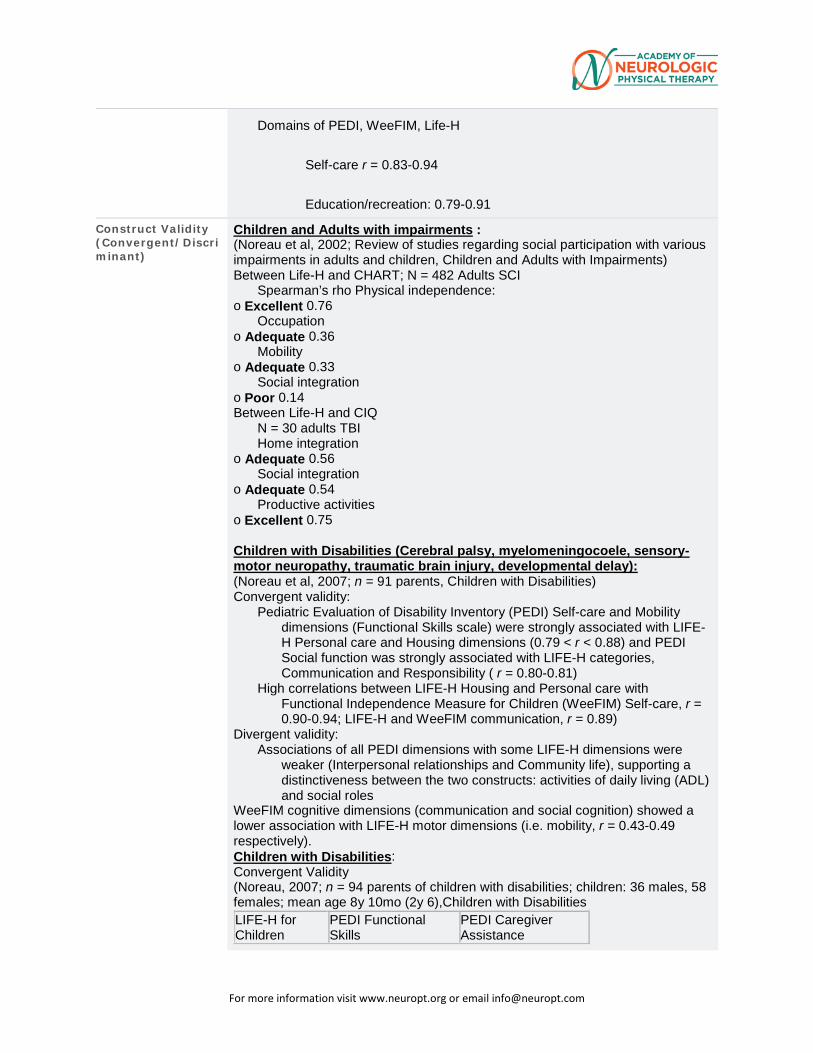
Domains of PEDI, WeeFIM, Life-H
Self-care r = 0.83-0.94
Education/recreation: 0.79-0.91
Construct Validity (Convergent/Discriminant)
Children and Adults with impairments : (Noreau et al, 2002; Review of studies regarding social participation with various impairments in adults and children, Children and Adults with Impairments) Between Life-H and CHART; N = 482 Adults SCI
Spearman’s rho Physical independence: o Excellent 0.76
Occupation o Adequate 0.36
Mobility o Adequate 0.33
Social integration o Poor 0.14 Between Life-H and CIQ
N = 30 adults TBI Home integration
o Adequate 0.56 Social integration
o Adequate 0.54 Productive activities
o Excellent 0.75 Children with Disabilities (Cerebral palsy, myelomeningocoele, sensory-motor neuropathy, traumatic brain injury, developmental delay): (Noreau et al, 2007; n = 91 parents, Children with Disabilities) Convergent validity:
Pediatric Evaluation of Disability Inventory (PEDI) Self-care and Mobility dimensions (Functional Skills scale) were strongly associated with LIFE-H Personal care and Housing dimensions (0.79 < r < 0.88) and PEDI Social function was strongly associated with LIFE-H categories, Communication and Responsibility ( r = 0.80-0.81)
High correlations between LIFE-H Housing and Personal care with Functional Independence Measure for Children (WeeFIM) Self-care, r = 0.90-0.94; LIFE-H and WeeFIM communication, r = 0.89)
Divergent validity: Associations of all PEDI dimensions with some LIFE-H dimensions were
weaker (Interpersonal relationships and Community life), supporting a distinctiveness between the two constructs: activities of daily living (ADL) and social roles
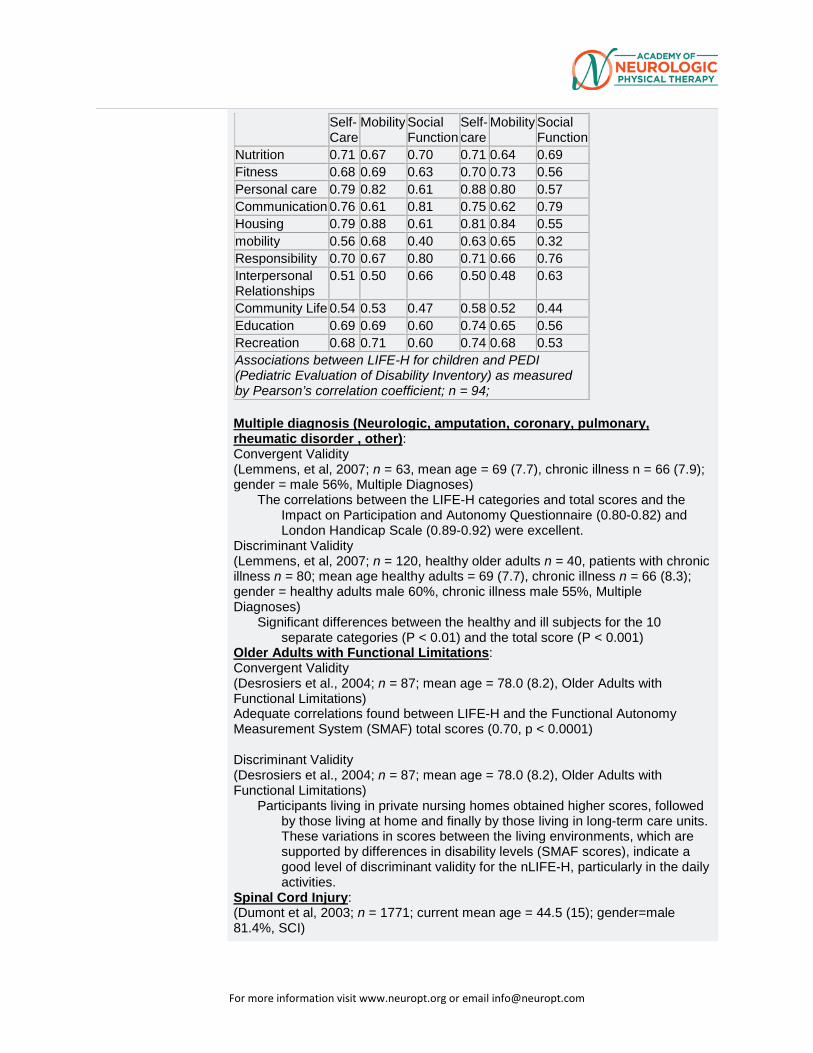
WeeFIM cognitive dimensions (communication and social cognition) showed a lower association with LIFE-H motor dimensions (i.e. mobility, r = 0.43-0.49 respectively). Children with Disabilities: Convergent Validity (Noreau, 2007; n = 94 parents of children with disabilities; children: 36 males, 58 females; mean age 8y 10mo (2y 6),Children with Disabilities LIFE-H for Children
PEDI Functional Skills
PEDI Caregiver Assistance
For more information visit www.neuropt.org or email [email protected]
Self-Care
Mobility Social Function
Self-care
Mobility Social Function
Nutrition 0.71 0.67 0.70 0.71 0.64 0.69 Fitness 0.68 0.69 0.63 0.70 0.73 0.56 Personal care 0.79 0.82 0.61 0.88 0.80 0.57 Communication 0.76 0.61 0.81 0.75 0.62 0.79 Housing 0.79 0.88 0.61 0.81 0.84 0.55 mobility 0.56 0.68 0.40 0.63 0.65 0.32 Responsibility 0.70 0.67 0.80 0.71 0.66 0.76 Interpersonal Relationships
0.51 0.50 0.66 0.50 0.48 0.63
Community Life 0.54 0.53 0.47 0.58 0.52 0.44 Education 0.69 0.69 0.60 0.74 0.65 0.56 Recreation 0.68 0.71 0.60 0.74 0.68 0.53 Associations between LIFE-H for children and PEDI (Pediatric Evaluation of Disability Inventory) as measured by Pearson’s correlation coefficient; n = 94; Multiple diagnosis (Neurologic, amputation, coronary, pulmonary, rheumatic disorder , other): Convergent Validity (Lemmens, et al, 2007; n = 63, mean age = 69 (7.7), chronic illness n = 66 (7.9); gender = male 56%, Multiple Diagnoses)
The correlations between the LIFE-H categories and total scores and the Impact on Participation and Autonomy Questionnaire (0.80-0.82) and London Handicap Scale (0.89-0.92) were excellent.
Discriminant Validity (Lemmens, et al, 2007; n = 120, healthy older adults n = 40, patients with chronic illness n = 80; mean age healthy adults = 69 (7.7), chronic illness n = 66 (8.3); gender = healthy adults male 60%, chronic illness male 55%, Multiple Diagnoses)
Significant differences between the healthy and ill subjects for the 10 separate categories (P < 0.01) and the total score (P < 0.001)
Older Adults with Functional Limitations: Convergent Validity (Desrosiers et al., 2004; n = 87; mean age = 78.0 (8.2), Older Adults with Functional Limitations) Adequate correlations found between LIFE-H and the Functional Autonomy Measurement System (SMAF) total scores (0.70, p < 0.0001) Discriminant Validity (Desrosiers et al., 2004; n = 87; mean age = 78.0 (8.2), Older Adults with Functional Limitations)
Participants living in private nursing homes obtained higher scores, followed by those living at home and finally by those living in long-term care units. These variations in scores between the living environments, which are supported by differences in disability levels (SMAF scores), indicate a good level of discriminant validity for the nLIFE-H, particularly in the daily activities.
Spinal Cord Injury: (Dumont et al, 2003; n = 1771; current mean age = 44.5 (15); gender=male 81.4%, SCI)
For more information visit www.neuropt.org or email [email protected]
Rasch analysis showed satisfactory measurement properties (person reliability = 0.91), and high agreement with expert opinion (items hierarchy r = 0.89)
Item difficulty hierarchy from spinal cord injury experts differed from hierarchy from traumatic brain injury experts, suggesting that the construct varies across impairment groups
Convergent Validity (Noreau et al, 1998; n = 482; mean age = 42 (12) years; no other information available; information from abstract, SCI)
Convergent validity was demonstrated by correlations between grouped LIFE-H items and corresponding CHART dimensions: 0.14 for social integration, through 0.33 and 0.36 for mobility and occupation, to 0.76 for physical independence
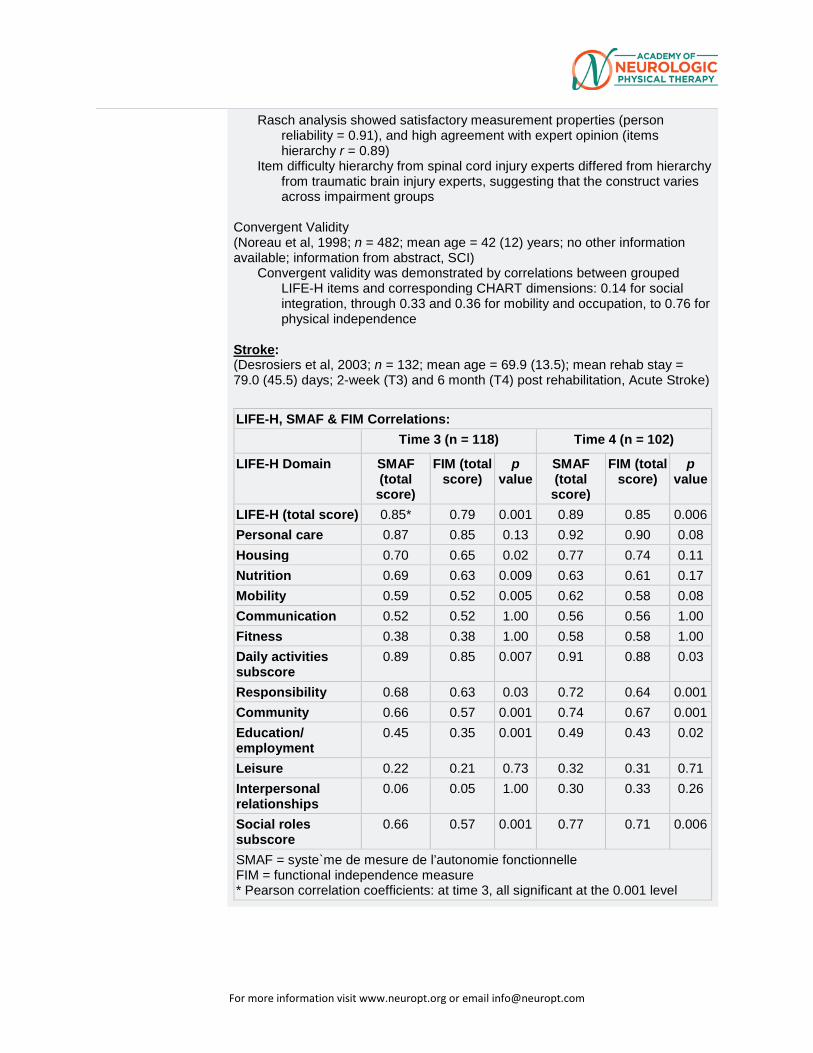
Stroke: (Desrosiers et al, 2003; n = 132; mean age = 69.9 (13.5); mean rehab stay = 79.0 (45.5) days; 2-week (T3) and 6 month (T4) post rehabilitation, Acute Stroke) LIFE-H, SMAF & FIM Correlations: Time 3 (n = 118) Time 4 (n = 102) LIFE-H Domain SMAF
(total score)
FIM (total score)
p value
SMAF (total score)
FIM (total score)
p value
LIFE-H (total score) 0.85* 0.79 0.001 0.89 0.85 0.006 Personal care 0.87 0.85 0.13 0.92 0.90 0.08 Housing 0.70 0.65 0.02 0.77 0.74 0.11 Nutrition 0.69 0.63 0.009 0.63 0.61 0.17 Mobility 0.59 0.52 0.005 0.62 0.58 0.08 Communication 0.52 0.52 1.00 0.56 0.56 1.00 Fitness 0.38 0.38 1.00 0.58 0.58 1.00 Daily activities subscore
0.89 0.85 0.007 0.91 0.88 0.03
Responsibility 0.68 0.63 0.03 0.72 0.64 0.001 Community 0.66 0.57 0.001 0.74 0.67 0.001 Education/ employment
0.45 0.35 0.001 0.49 0.43 0.02
Leisure 0.22 0.21 0.73 0.32 0.31 0.71 Interpersonal relationships
0.06 0.05 1.00 0.30 0.33 0.26
Social roles subscore
0.66 0.57 0.001 0.77 0.71 0.006
SMAF = syste`me de mesure de l’autonomie fonctionnelle FIM = functional independence measure * Pearson correlation coefficients: at time 3, all significant at the 0.001 level
For more information visit www.neuropt.org or email [email protected]
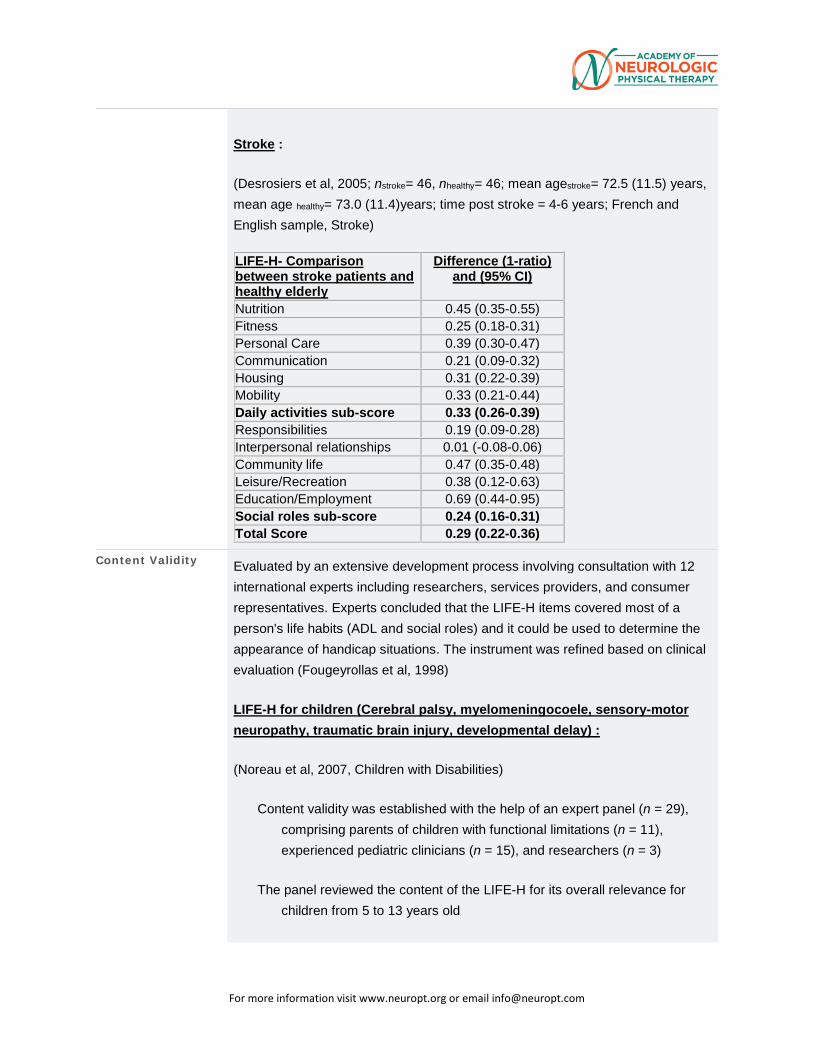
Stroke :
(Desrosiers et al, 2005; nstroke= 46, nhealthy= 46; mean agestroke= 72.5 (11.5) years, mean age healthy= 73.0 (11.4)years; time post stroke = 4-6 years; French and English sample, Stroke) LIFE-H- Comparison between stroke patients and healthy elderly
Difference (1-ratio) and (95% CI)
Nutrition 0.45 (0.35-0.55) Fitness 0.25 (0.18-0.31) Personal Care 0.39 (0.30-0.47) Communication 0.21 (0.09-0.32) Housing 0.31 (0.22-0.39) Mobility 0.33 (0.21-0.44) Daily activities sub-score 0.33 (0.26-0.39) Responsibilities 0.19 (0.09-0.28) Interpersonal relationships 0.01 (-0.08-0.06) Community life 0.47 (0.35-0.48) Leisure/Recreation 0.38 (0.12-0.63) Education/Employment 0.69 (0.44-0.95) Social roles sub-score 0.24 (0.16-0.31) Total Score 0.29 (0.22-0.36)
Content Validity Evaluated by an extensive development process involving consultation with 12 international experts including researchers, services providers, and consumer representatives. Experts concluded that the LIFE-H items covered most of a person's life habits (ADL and social roles) and it could be used to determine the appearance of handicap situations. The instrument was refined based on clinical evaluation (Fougeyrollas et al, 1998)
LIFE-H for children (Cerebral palsy, myelomeningocoele, sensory-motor neuropathy, traumatic brain injury, developmental delay) :
(Noreau et al, 2007, Children with Disabilities)
Content validity was established with the help of an expert panel (n = 29), comprising parents of children with functional limitations (n = 11), experienced pediatric clinicians (n = 15), and researchers (n = 3)
The panel reviewed the content of the LIFE-H for its overall relevance for children from 5 to 13 years old
For more information visit www.neuropt.org or email [email protected]
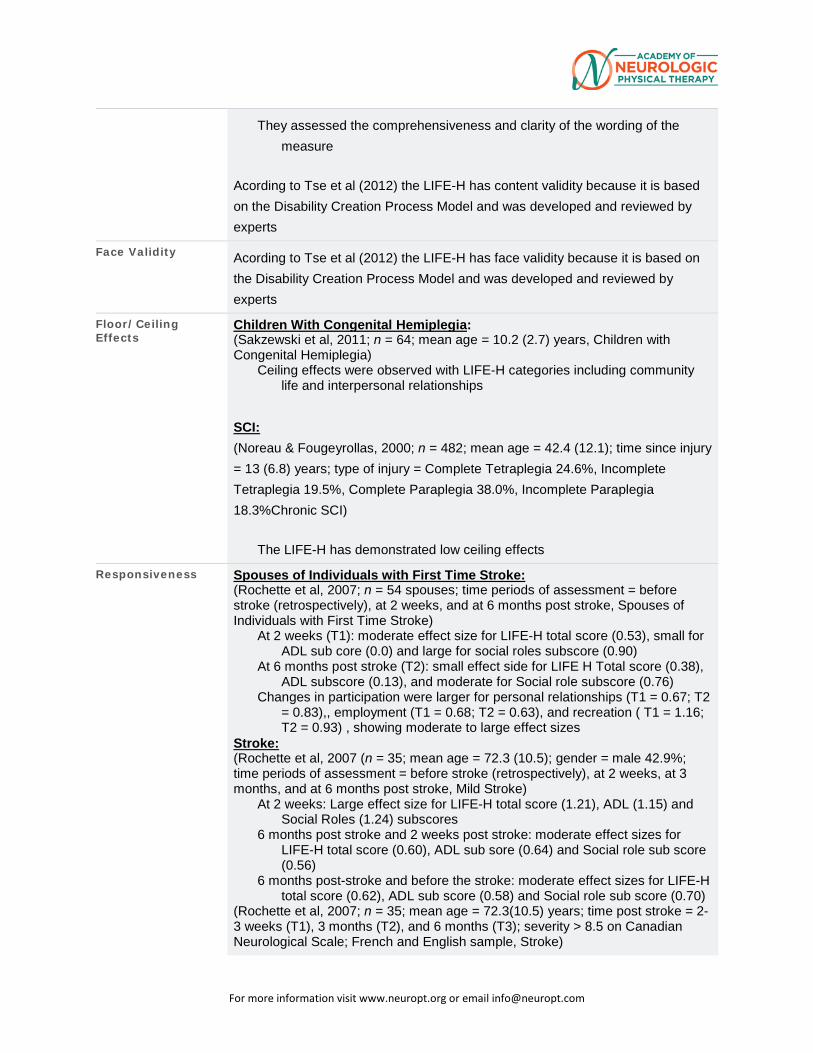
They assessed the comprehensiveness and clarity of the wording of the measure
Acording to Tse et al (2012) the LIFE-H has content validity because it is based on the Disability Creation Process Model and was developed and reviewed by experts
Face Validity Acording to Tse et al (2012) the LIFE-H has face validity because it is based on the Disability Creation Process Model and was developed and reviewed by experts
Floor/Ceiling Effects
Children With Congenital Hemiplegia: (Sakzewski et al, 2011; n = 64; mean age = 10.2 (2.7) years, Children with Congenital Hemiplegia)
Ceiling effects were observed with LIFE-H categories including community life and interpersonal relationships
SCI: (Noreau & Fougeyrollas, 2000; n = 482; mean age = 42.4 (12.1); time since injury = 13 (6.8) years; type of injury = Complete Tetraplegia 24.6%, Incomplete Tetraplegia 19.5%, Complete Paraplegia 38.0%, Incomplete Paraplegia 18.3%Chronic SCI)
The LIFE-H has demonstrated low ceiling effects
Responsiveness Spouses of Individuals with First Time Stroke: (Rochette et al, 2007; n = 54 spouses; time periods of assessment = before stroke (retrospectively), at 2 weeks, and at 6 months post stroke, Spouses of Individuals with First Time Stroke)
At 2 weeks (T1): moderate effect size for LIFE-H total score (0.53), small for ADL sub core (0.0) and large for social roles subscore (0.90)
At 6 months post stroke (T2): small effect side for LIFE H Total score (0.38), ADL subscore (0.13), and moderate for Social role subscore (0.76)
Changes in participation were larger for personal relationships (T1 = 0.67; T2 = 0.83),, employment (T1 = 0.68; T2 = 0.63), and recreation ( T1 = 1.16; T2 = 0.93) , showing moderate to large effect sizes
Stroke: (Rochette et al, 2007 (n = 35; mean age = 72.3 (10.5); gender = male 42.9%; time periods of assessment = before stroke (retrospectively), at 2 weeks, at 3 months, and at 6 months post stroke, Mild Stroke)
At 2 weeks: Large effect size for LIFE-H total score (1.21), ADL (1.15) and Social Roles (1.24) subscores
6 months post stroke and 2 weeks post stroke: moderate effect sizes for LIFE-H total score (0.60), ADL sub sore (0.64) and Social role sub score (0.56)
6 months post-stroke and before the stroke: moderate effect sizes for LIFE-H total score (0.62), ADL sub score (0.58) and Social role sub score (0.70)
(Rochette et al, 2007; n = 35; mean age = 72.3(10.5) years; time post stroke = 2-3 weeks (T1), 3 months (T2), and 6 months (T3); severity > 8.5 on Canadian Neurological Scale; French and English sample, Stroke)
For more information visit www.neuropt.org or email [email protected]
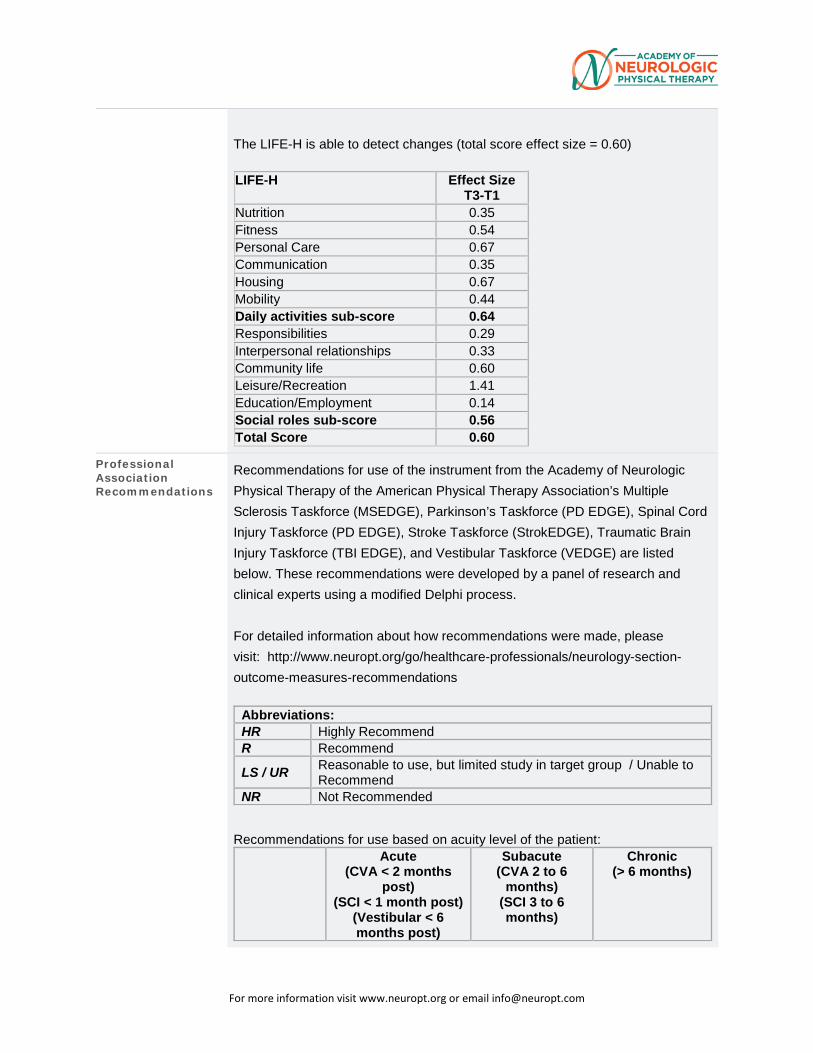
The LIFE-H is able to detect changes (total score effect size = 0.60)
LIFE-H Effect Size T3-T1
Nutrition 0.35 Fitness 0.54 Personal Care 0.67 Communication 0.35 Housing 0.67 Mobility 0.44 Daily activities sub-score 0.64 Responsibilities 0.29 Interpersonal relationships 0.33 Community life 0.60 Leisure/Recreation 1.41 Education/Employment 0.14 Social roles sub-score 0.56 Total Score 0.60
Professional Association Recommendations
Recommendations for use of the instrument from the Academy of Neurologic Physical Therapy of the American Physical Therapy Association’s Multiple Sclerosis Taskforce (MSEDGE), Parkinson’s Taskforce (PD EDGE), Spinal Cord Injury Taskforce (PD EDGE), Stroke Taskforce (StrokEDGE), Traumatic Brain Injury Taskforce (TBI EDGE), and Vestibular Taskforce (VEDGE) are listed below. These recommendations were developed by a panel of research and clinical experts using a modified Delphi process. For detailed information about how recommendations were made, please visit: http://www.neuropt.org/go/healthcare-professionals/neurology-section-outcome-measures-recommendations
Abbreviations: HR Highly Recommend R Recommend LS / UR Reasonable to use, but limited study in target group / Unable to
Recommend NR Not Recommended
Recommendations for use based on acuity level of the patient:
Acute (CVA < 2 months
post) (SCI < 1 month post)
(Vestibular < 6 months post)
Subacute (CVA 2 to 6
months) (SCI 3 to 6 months)
Chronic (> 6 months)
For more information visit www.neuropt.org or email [email protected]
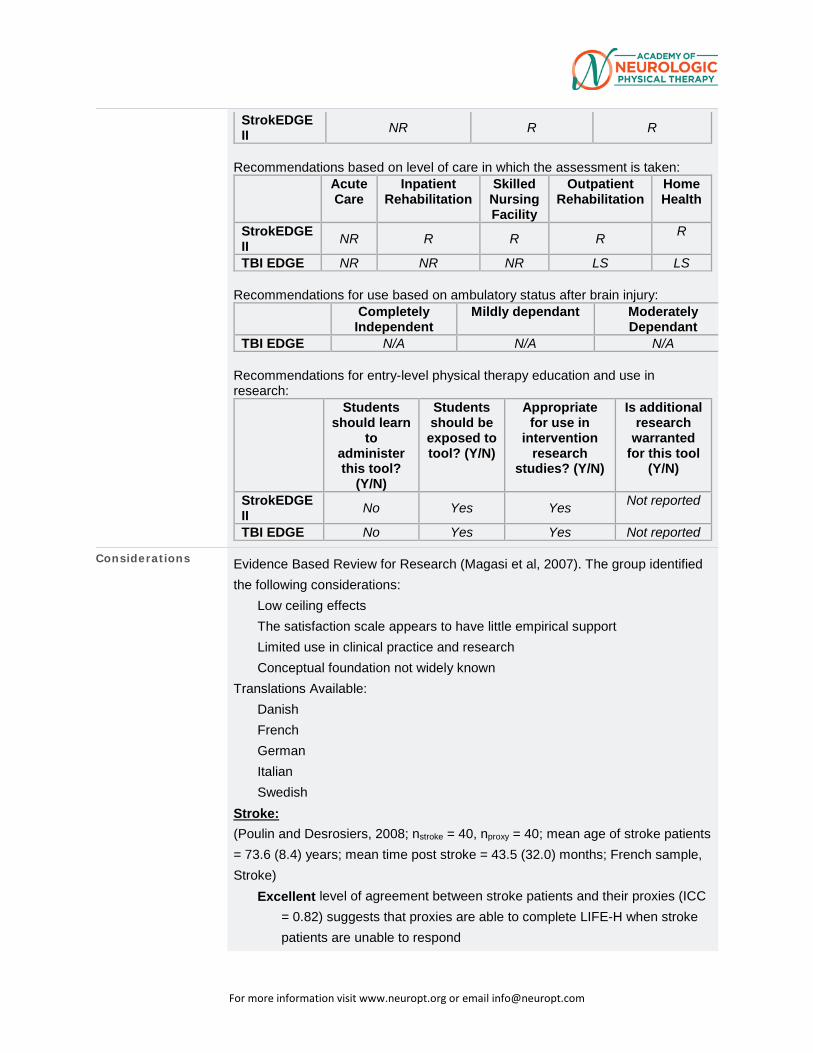
StrokEDGE II NR R R
Recommendations based on level of care in which the assessment is taken:
Acute Care
Inpatient Rehabilitation
Skilled Nursing Facility
Outpatient Rehabilitation
Home Health
StrokEDGE II NR R R R R
TBI EDGE NR NR NR LS LS Recommendations for use based on ambulatory status after brain injury:
Completely Independent
Mildly dependant Moderately Dependant
TBI EDGE N/A N/A N/A Recommendations for entry-level physical therapy education and use in research:
Students should learn
to administer this tool?
(Y/N)
Students should be exposed to tool? (Y/N)
Appropriate for use in
intervention research
studies? (Y/N)
Is additional research
warranted for this tool
(Y/N)
StrokEDGE II No Yes Yes Not reported
TBI EDGE No Yes Yes Not reported
Considerations Evidence Based Review for Research (Magasi et al, 2007). The group identified the following considerations:
Low ceiling effects
The satisfaction scale appears to have little empirical support Limited use in clinical practice and research
Conceptual foundation not widely known
Translations Available: Danish
French
German
Italian
Swedish
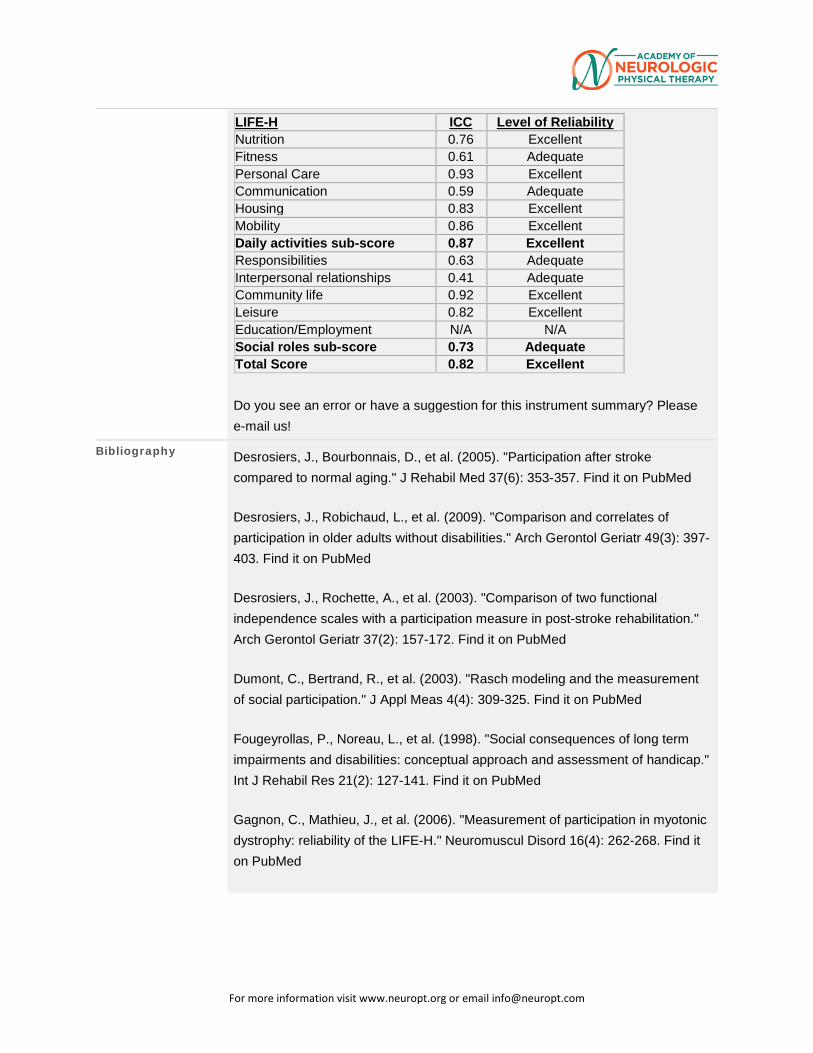
Stroke: (Poulin and Desrosiers, 2008; nstroke = 40, nproxy = 40; mean age of stroke patients = 73.6 (8.4) years; mean time post stroke = 43.5 (32.0) months; French sample, Stroke)
Excellent level of agreement between stroke patients and their proxies (ICC = 0.82) suggests that proxies are able to complete LIFE-H when stroke patients are unable to respond
For more information visit www.neuropt.org or email [email protected]
LIFE-H ICC Level of Reliability Nutrition 0.76 Excellent Fitness 0.61 Adequate Personal Care 0.93 Excellent Communication 0.59 Adequate Housing 0.83 Excellent Mobility 0.86 Excellent Daily activities sub-score 0.87 Excellent Responsibilities 0.63 Adequate Interpersonal relationships 0.41 Adequate Community life 0.92 Excellent Leisure 0.82 Excellent Education/Employment N/A N/A Social roles sub-score 0.73 Adequate Total Score 0.82 Excellent
Do you see an error or have a suggestion for this instrument summary? Please e-mail us!
Bibliography Desrosiers, J., Bourbonnais, D., et al. (2005). "Participation after stroke compared to normal aging." J Rehabil Med 37(6): 353-357. Find it on PubMed
Desrosiers, J., Robichaud, L., et al. (2009). "Comparison and correlates of participation in older adults without disabilities." Arch Gerontol Geriatr 49(3): 397-403. Find it on PubMed
Desrosiers, J., Rochette, A., et al. (2003). "Comparison of two functional independence scales with a participation measure in post-stroke rehabilitation." Arch Gerontol Geriatr 37(2): 157-172. Find it on PubMed
Dumont, C., Bertrand, R., et al. (2003). "Rasch modeling and the measurement of social participation." J Appl Meas 4(4): 309-325. Find it on PubMed
Fougeyrollas, P., Noreau, L., et al. (1998). "Social consequences of long term impairments and disabilities: conceptual approach and assessment of handicap." Int J Rehabil Res 21(2): 127-141. Find it on PubMed
Gagnon, C., Mathieu, J., et al. (2006). "Measurement of participation in myotonic dystrophy: reliability of the LIFE-H." Neuromuscul Disord 16(4): 262-268. Find it on PubMed
For more information visit www.neuropt.org or email [email protected]
Lemmens, J., E, I. S. M. v. E., et al. (2007). "Reproducibility and validity of the Dutch Life Habits Questionnaire (LIFE-H 3.0) in older adults." Clin Rehabil 21(9): 853-862. Find it on PubMed
Magasi, S. R., Heinemann, A. W., et al. (2008). "Participation following traumatic spinal cord injury: an evidence-based review for research." J Spinal Cord Med 31(2): 145-156. Find it on PubMed
Morris, C., Kurinczuk, J. J., et al. (2005). "Child or family assessed measures of activity performance and participation for children with cerebral palsy: a structured review." Child Care Health Dev 31(4): 397-407. Find it on PubMed
Noonan, V. K., Miller, W. C., et al. (2009). "A review of instruments assessing participation in persons with spinal cord injury." Spinal Cord 47(6): 435-446. Find it on PubMed
Noreau, L., Desrosiers, J., et al. (2004). "Measuring social participation: reliability of the LIFE-H in older adults with disabilities." Disabil Rehabil 26(6): 346-352. Find it on PubMed
Noreau, L. and Fougeyrollas, P. (2000). "Long-term consequences of spinal cord injury on social participation: the occurrence of handicap situations." Disabil Rehabil 22(4): 170-180. Find it on PubMed
Noreau, L., Fougeyrollas, P., et al. (2002). "The LIFE-H: Assessment of the quality of social participation." Technology and Disability 14(3): 113-118.
Noreau, L., Lepage, C., et al. (2007). "Measuring participation in children with disabilities using the Assessment of Life Habits." Developmental Medicine & Child Neurology 49(9): 666-671.
Poulin, V. and Desrosiers, J. (2008). "Participation after stroke: comparing proxies' and patients' perceptions." J Rehabil Med 40(1): 28-35. Find it on PubMed
Poulin, V. and Desrosiers, J. (2009). "Reliability of the LIFE-H satisfaction scale and relationship between participation and satisfaction of older adults with disabilities." Disability & Rehabilitation 31(16): 1311-1317.
For more information visit www.neuropt.org or email [email protected]
Rochette, A., Desrosiers, J., et al. (2007). "Changes in participation after a mild stroke: quantitative and qualitative perspectives." Top Stroke Rehabil 14(3): 59-68. Find it on PubMed
Sakzewski, L., Boyd, R., et al. (2007). "Clinimetric properties of participation measures for 5- to 13-year-old children with cerebral palsy: a systematic review." Dev Med Child Neurol 49(3): 232-240. Find it on PubMed
Sakzewski, L., Ziviani, J., et al. (2011). "Participation outcomes in a randomized trial of 2 models of upper-limb rehabilitation for children with congenital hemiplegia." Arch Phys Med Rehabil 92(4): 531-539. Find it on PubMed
Tse, T., Douglas, J., et al. (2013). "Measuring participation after stroke: a review of frequently used tools." Arch Phys Med Rehabil 94(1): 177-192. Find it on PubMed
Year published 1997
Instrument in PDF Format Yes
Approval Status Approved
4. REHAB MEASURES DATABASE: BALANCE EVALUATION SYSTEMS TEST
Link to instrument BESTest here (other languages below)
Title of Assessment Balance Evaluation Systems Test
Acronym BESTest
Instrument Reviewer(s) Initially reviewed by Kirsten Potter, PT, DPT, MS, NCS and the MS EDGE task
force of the Academy of Neurologic Physical Therapy - a component of APTA in 3/2011; Updated with the TBI population by Katie Hays, PT, DPT, and the TBI EDGE task force of the Academy of Neurologic Physical Therapy - a component of APTA in 5/2012; Updated for PD population by Cathy Harro MS, PT, NCS and the PD EDGE Task Force of Neurology Section, APTA 3/2013. Updated for the Vestibular EDGE task force of the Academy of Neurologic Physical Therapy by Diane Wrisley PT, PhD, NCS and Elizabeth Dannenbaum MScPT 11/2013. Updated by Evan Papa DPT, PhD for the University of North Texas Health
For more information visit www.neuropt.org or email [email protected]
Sciences Center, DPT class of 2015. Updated by StrokEdge II Task Force: Dorian Rose, PhD, PT and Carmen Capo-Lugo, PhD, PT; May 2016.
Summary Date 8/25/2015
Purpose The Balance Evaluation Systems Test (BESTest) serves as a 36-item clinical balance assessment tool, developed to assess balance impairments across six contexts of postural control: mechanical constraints, limits of stability, APAs, postural response to induced loss of balance, sensory orientation, and gait.
Description • 36 items
• Grouped into 6 systems (biomechanical constraints, stability limits/verticality, anticipatory postural adjustments, postural responses, sensory orientation, stability in gait)
• Total score of 108 points total, calculated in to a percentage score (0-100%). Also total sub-scores exist for each above listed system.
• Item-level scores range from 0 (severe impairment) to 3 (no impairment).
• Subjects are to be tested with flat heeled shoes, or with shoes and socks off.
• Subjects who must use an assistive device should be scored one category lower for that item.
• Training DVD available for purchase (http://bestest.us/) • Administration instructions can be found at http://bestest.us/training/ • Shortened into mini-BESTest and brief BESTest
Area of Assessment Balance Non-Vestibular; Gait; Strength
Body Part
ICF Domain Body Structure; Body Function; Activity
Domain
Assessment Type Performance Measure
Length of Test 06 to 30 Minutes
Time to Administer • 20-30 minutes, 30 minutes if untrained raters
Number of Items 36
Equipment Required • Stop watch
• Measuring tape mounted on wall
For more information visit www.neuropt.org or email [email protected]
• Approximately 60 cm x 60 cm block of 4 inch, medium density, Tempur® foam
• 10 degree incline ramp (at least 2 x 2 ft) • Stair step, 15 cm (6 inches) in height • 2 stacked shoe boxes (for 9 inch obstacle height) • 2.5 kg (5-lb) free weight • Firm chair with arms with 3 meters in front marked with tape
• Masking tape to mark 3 m and 6 m lengths on the floor
Training Required A training DVD is available for purchase. Workshops are available to become skilled in using the BESTest to differentiate complex balance disorders in neurological patients. Workshop participants develop the ability to design a more specific rehabilitation plan of care for balance retraining.
A web portal is available through http://bestest.us/ containing instructional videos and scoring samples of each BESTest item, as well as explanations of the six main balance categories.
Type of training required Reading an Article/Manual; Training Course
Cost Free
Actual Cost Training DVD is $200. The BESTest protocol is free, but is subject to copyright.
Age Range Elderly adult: 65+
Administration Mode
Diagnosis Geriatrics; Parkinson’s Disease
Populations Tested • Balance deficits
• Cerebellar Infarct • Parkinson's Disease (PD) • Peripheral neuropathy
• Vestibular dysfunction
• Subacute Stroke
• Multiple Sclerosis
For more information visit www.neuropt.org or email [email protected]
Standard Error of Measurement (SEM)
Community dwelling adults with and without balance dysfunction: (Unilateral and bilateral dysfunction, Parkinson's disease, peripheral neuropathy, total hip arthroplasty): (Horak et al, 2009; n = 19; age range 50-88; Session 1 n = 12, mean age = 63 (10); 5 female and 7 male; 3 Parkinsons, 2 unilateral vestibular loss, 3 bilateral vestibular loss, 1 peripheral neuropathy and total hip arthroplasty, 3 controls; Session 2 n = 11, mean age = 75 (7.6); 5 female, 6 male; 2 Parkinsons, 1 unilateral vestibular loss, 1 bilateral vestibular loss, 1 peripheral neuropathy and total hip arthroplasty, 6 controls)
• SEM calculated = 3.21
Parkinson's Disease:
(Leddy et al, 2011; n = 80; mean age = 68.2 (9.3) time since diagnosis = 8.5 (0.54) years; mean MDS-UPDRS score = 72.6 (25.1); mean Hoehn and Yahr scale stage = 2.45 (0.64), separated into fallers vs. nonfallers; subset of n = 15 used for interrater reliability testing, subset of n = 24 used for test retest reliability testing)
• SEM calculated = 2.35
(Leddy et al, 2011a; subset of subjects n = 24, MDS-UPDRS = 71 (21.9), disease duration mean 6.9 (3.38), 21% fallers)
• SEM calculated = 5.78
Subacute Stroke (Chinsongkram et al., 2014; n=70; mean age 57.0±12.2; time since stroke: 1.1±2.0 months)
SEM was not provided by this study, but was calculated.
• Standard Deviation = 28.19
• ICC = 0.99
• SEM = 2.819
Minimal Detectable Change (MDC) Community dwelling adults with and without balance dysfunction:
(Horak et al, 2009)
For more information visit www.neuropt.org or email [email protected]
• MDC calculated = 8.9
Parkinson's Disease:
(Leddy et al, 2011)
• MDC calculated = 6.5
(Leddy et al, 2011a)
• MDC calculated = 16.02
Subacute Stroke (Chinsongkram et al., 2014; n=70; mean age 57.0±12.2; time since stroke: 1.1±2.0 months))
MDC was not provided by this study, but was calculated.
• MDC = 7.81
Minimally Clinically Important Difference (MCID)
Not Established
Cut-Off Scores Balance Deficits:
(Padgett PTJ 2012 ; 1st cohort: n = 20 varied Dx (4 PD, 1 CVA, 4 MS, 1 PN, 1 tremor) and 9 healthy; 5 with positive fall history. 2nd cohort: n = 13 with MS, mean age 50, EDSS < 6 (range 0-4.5), 7 fallers)
• 69% cut off score differentiated fallers from non-fallers, and healthy from those with neurologic diagnoses. Adequate ability to detect fallers (sensitivity = 0.86, specificity = 0.95, LR+ = 17.2, LR- = 0.46, accuracy = 92%)
Parkinson’s disease:
(Leddy et al, 2011)
• 69% cut off score (sensitivity = 0.84, specificity = 0.76, LR+ = 3.49, LR- = 0.21, AUC = 0.85) to identify individual as a faller vs. non-faller
For more information visit www.neuropt.org or email [email protected]
• Sensitivity higher for BESTest as compared to Functional Gait Assessment and Berg Balance Scale
(Duncan RP 2013 PTJ; Comparative utility of BESTest, Mini BESTest, and Brief BESTest; n = 80 with idiopathic PD, mean age = 68.2 (9.7), mean MDS-UPDRS 41.3 (14.7), H & Y stage [1=4, 2=27, 2.5=30, 3=13, 4=6]; retrospective fallers n = 25 (31%), 6 month prospective fallers n = 14 (27.5%), 12 month prospective fallers n = 13 (32.5%))
• 69% cut off score to detect fallers; Adequate for detecting retrospective fallers (sensitivity = 0.84, specificity = 0.76, LR+ = 3.49, LR- = 0.21, AUC = 0.84); Adequate for predicting 6 month prospective fallers (sensitivity = 0.93, specificity = 0.84, LR+ = 5.81, LR- = 0.08, AUC = 0.89); Poor for predicting 12 month prospective falls (sensitivity = 0.46, specificity = 0.74, LR+ = 1.77, LR- = 0.73, AUC = 0.68
(Duncan 2012 (Accuracy of fall prediction in PD); Baseline n = 80 PD, six-month evaluation n = 51 {mean age = 67.5 (8.8), years post diagnosis 7.7(3.9), H & Y stage 2.4 (0.6), UPDRS 37.8 (13.1), 27% fallers}; 12-month evaluation n = 40 {mean age 67.3 (9.5), years post diagnosis 7.2 (4.1), H&Y stage 2.3 (0.6), UPDRS 39.3 (13.3), 37% fallers})
• 69% cut off score; Adequate prediction of fallers at 6 months (sensitivity = 0.93, specificity = 0.84, LR+ = 5.81, LR- = 0.08, AUC = 0.89 (CI 0.74-0.95)); Poor prediction of fallers at 12 months (sensitivity = 0.46, specificity = 0.74, LR+ = 1.77, LR- = 0.73, AUC = 0.68 (CI = 0.45- .83))
Subacute Stroke (Chinsongkram et al., 2014; n=70; mean age 57.0±12.2; time since stroke: 1.1±2.0 months))
The following cut off scores help distinguish high functional ability from low functional ability:
• >49% indicates those with high functional ability
• Mini-Best > 9 indicates high functional ability
• BBS > 19 indicates high functional ability
Normative Data Subacute Stroke (Chinsongkram et al., 2014; n=70; mean age 57.0±12.2; time since stroke: 1.1±2.0 months))
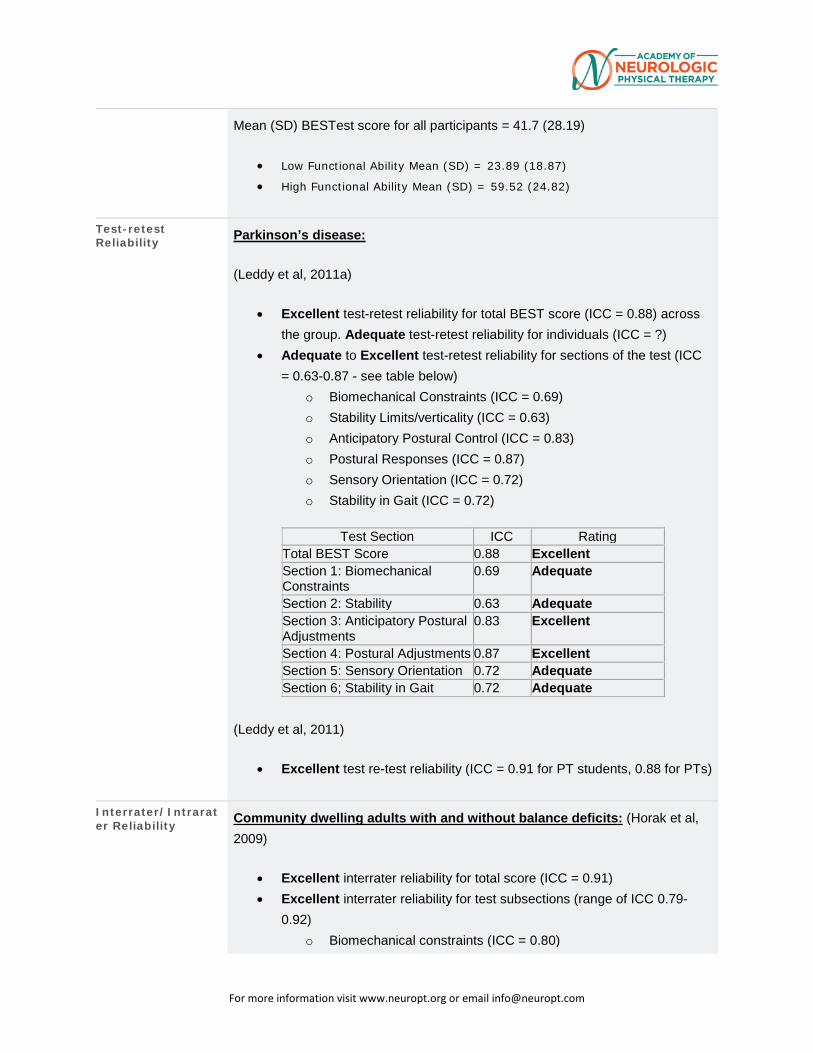
For more information visit www.neuropt.org or email [email protected]
Mean (SD) BESTest score for all participants = 41.7 (28.19)
• Low Functional Ability Mean (SD) = 23.89 (18.87)
• High Functional Ability Mean (SD) = 59.52 (24.82)
Test-retest Reliability Parkinson’s disease:
(Leddy et al, 2011a)
• Excellent test-retest reliability for total BEST score (ICC = 0.88) across the group. Adequate test-retest reliability for individuals (ICC = ?)
• Adequate to Excellent test-retest reliability for sections of the test (ICC = 0.63-0.87 - see table below)
o Biomechanical Constraints (ICC = 0.69) o Stability Limits/verticality (ICC = 0.63) o Anticipatory Postural Control (ICC = 0.83) o Postural Responses (ICC = 0.87) o Sensory Orientation (ICC = 0.72) o Stability in Gait (ICC = 0.72)
Test Section ICC Rating Total BEST Score 0.88 Excellent Section 1: Biomechanical Constraints
0.69 Adequate
Section 2: Stability 0.63 Adequate Section 3: Anticipatory Postural Adjustments
0.83 Excellent
Section 4: Postural Adjustments 0.87 Excellent Section 5: Sensory Orientation 0.72 Adequate Section 6; Stability in Gait 0.72 Adequate
(Leddy et al, 2011)
• Excellent test re-test reliability (ICC = 0.91 for PT students, 0.88 for PTs)
Interrater/Intrarater Reliability Community dwelling adults with and without balance deficits: (Horak et al,
2009)
• Excellent interrater reliability for total score (ICC = 0.91) • Excellent interrater reliability for test subsections (range of ICC 0.79-
0.92) o Biomechanical constraints (ICC = 0.80)
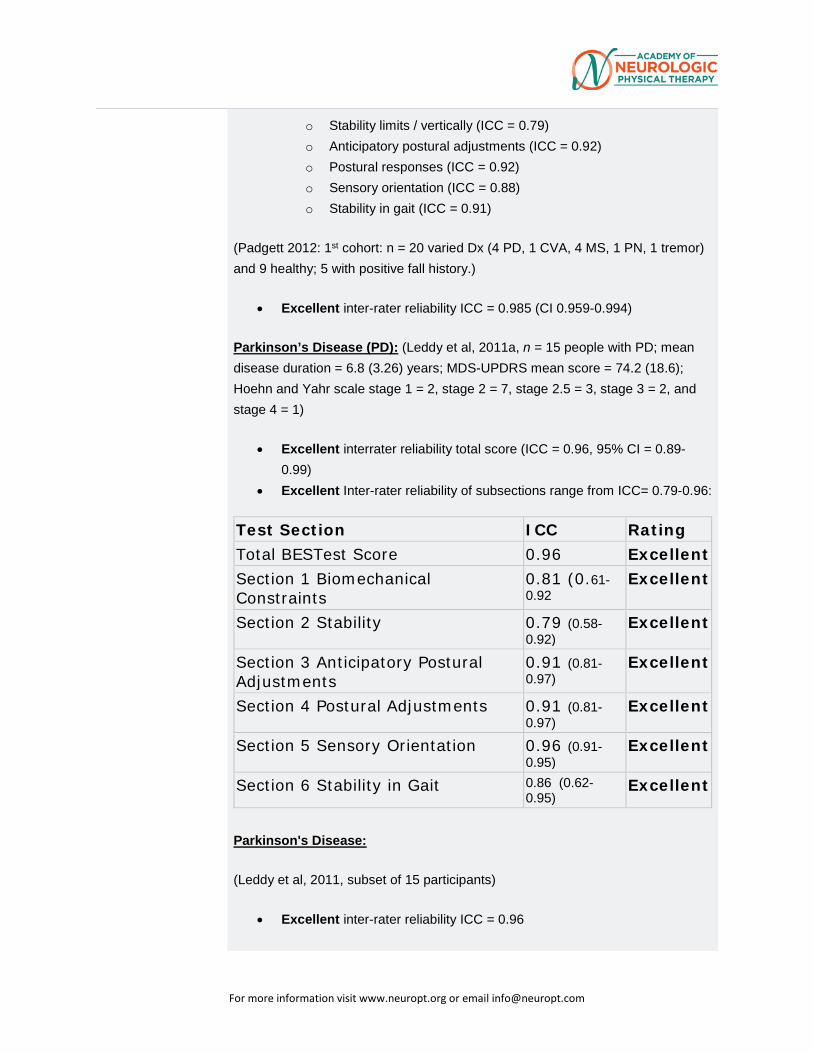
For more information visit www.neuropt.org or email [email protected]
o Stability limits / vertically (ICC = 0.79) o Anticipatory postural adjustments (ICC = 0.92) o Postural responses (ICC = 0.92) o Sensory orientation (ICC = 0.88) o Stability in gait (ICC = 0.91)
(Padgett 2012: 1st cohort: n = 20 varied Dx (4 PD, 1 CVA, 4 MS, 1 PN, 1 tremor) and 9 healthy; 5 with positive fall history.)
• Excellent inter-rater reliability ICC = 0.985 (CI 0.959-0.994)
Parkinson’s Disease (PD): (Leddy et al, 2011a, n = 15 people with PD; mean disease duration = 6.8 (3.26) years; MDS-UPDRS mean score = 74.2 (18.6); Hoehn and Yahr scale stage 1 = 2, stage 2 = 7, stage 2.5 = 3, stage 3 = 2, and stage 4 = 1)
• Excellent interrater reliability total score (ICC = 0.96, 95% CI = 0.89-0.99)
• Excellent Inter-rater reliability of subsections range from ICC= 0.79-0.96:
Test Section ICC Rating Total BESTest Score 0.96 Excellent Section 1 Biomechanical Constraints
0.81 (0.61-0.92
Excellent
Section 2 Stability 0.79 (0.58-0.92)
Excellent
Section 3 Anticipatory Postural Adjustments
0.91 (0.81-0.97)
Excellent
Section 4 Postural Adjustments 0.91 (0.81-0.97)
Excellent
Section 5 Sensory Orientation 0.96 (0.91-0.95)
Excellent
Section 6 Stability in Gait 0.86 (0.62-0.95)
Excellent
Parkinson's Disease:
(Leddy et al, 2011, subset of 15 participants)
• Excellent inter-rater reliability ICC = 0.96
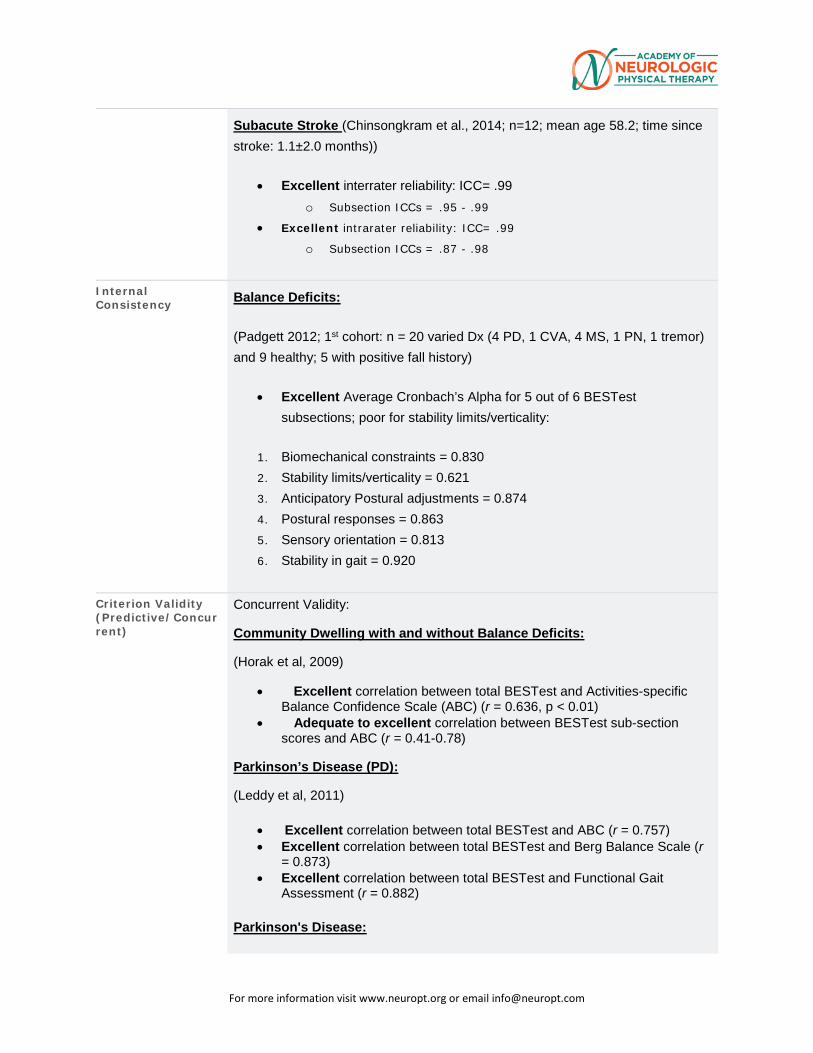
For more information visit www.neuropt.org or email [email protected]
Subacute Stroke (Chinsongkram et al., 2014; n=12; mean age 58.2; time since stroke: 1.1±2.0 months))
• Excellent interrater reliability: ICC= .99
o Subsection ICCs = .95 - .99
• Excellent intrarater reliability: ICC= .99
o Subsection ICCs = .87 - .98
Internal Consistency Balance Deficits:
(Padgett 2012; 1st cohort: n = 20 varied Dx (4 PD, 1 CVA, 4 MS, 1 PN, 1 tremor) and 9 healthy; 5 with positive fall history)
• Excellent Average Cronbach’s Alpha for 5 out of 6 BESTest subsections; poor for stability limits/verticality:
1. Biomechanical constraints = 0.830
2. Stability limits/verticality = 0.621
3. Anticipatory Postural adjustments = 0.874
4. Postural responses = 0.863
5. Sensory orientation = 0.813
6. Stability in gait = 0.920
Criterion Validity (Predictive/Concurrent)
Concurrent Validity:
Community Dwelling with and without Balance Deficits:
(Horak et al, 2009)
• Excellent correlation between total BESTest and Activities-specific Balance Confidence Scale (ABC) (r = 0.636, p < 0.01)
• Adequate to excellent correlation between BESTest sub-section scores and ABC (r = 0.41-0.78)
Parkinson’s Disease (PD):
(Leddy et al, 2011)
• Excellent correlation between total BESTest and ABC (r = 0.757) • Excellent correlation between total BESTest and Berg Balance Scale (r
= 0.873) • Excellent correlation between total BESTest and Functional Gait
Assessment (r = 0.882)
Parkinson's Disease:
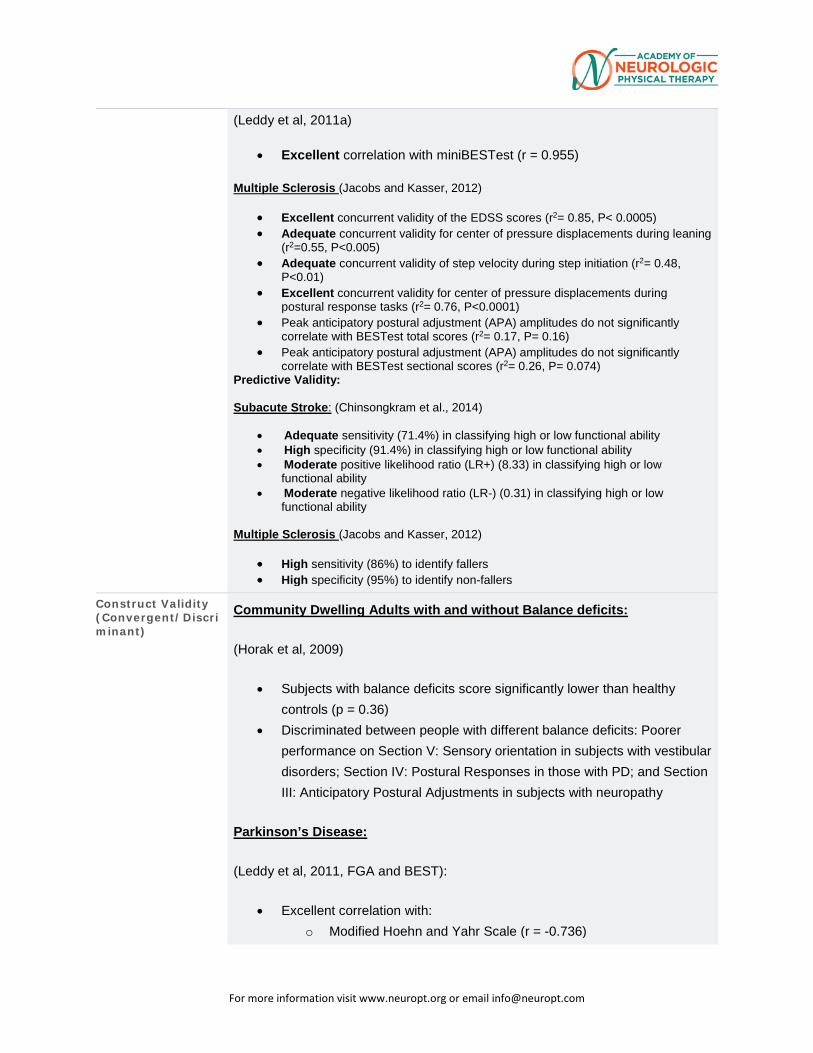
For more information visit www.neuropt.org or email [email protected]
(Leddy et al, 2011a)
• Excellent correlation with miniBESTest (r = 0.955)
Multiple Sclerosis (Jacobs and Kasser, 2012)
• Excellent concurrent validity of the EDSS scores (r2= 0.85, P< 0.0005) • Adequate concurrent validity for center of pressure displacements during leaning
(r2=0.55, P<0.005) • Adequate concurrent validity of step velocity during step initiation (r2= 0.48,
P<0.01) • Excellent concurrent validity for center of pressure displacements during
postural response tasks (r2= 0.76, P<0.0001) • Peak anticipatory postural adjustment (APA) amplitudes do not significantly
correlate with BESTest total scores (r2= 0.17, P= 0.16) • Peak anticipatory postural adjustment (APA) amplitudes do not significantly
correlate with BESTest sectional scores (r2= 0.26, P= 0.074) Predictive Validity: Subacute Stroke: (Chinsongkram et al., 2014)
• Adequate sensitivity (71.4%) in classifying high or low functional ability • High specificity (91.4%) in classifying high or low functional ability • Moderate positive likelihood ratio (LR+) (8.33) in classifying high or low
functional ability • Moderate negative likelihood ratio (LR-) (0.31) in classifying high or low
functional ability Multiple Sclerosis (Jacobs and Kasser, 2012)
• High sensitivity (86%) to identify fallers • High specificity (95%) to identify non-fallers
Construct Validity (Convergent/Discriminant)
Community Dwelling Adults with and without Balance deficits:
(Horak et al, 2009)
• Subjects with balance deficits score significantly lower than healthy controls (p = 0.36)
• Discriminated between people with different balance deficits: Poorer performance on Section V: Sensory orientation in subjects with vestibular disorders; Section IV: Postural Responses in those with PD; and Section III: Anticipatory Postural Adjustments in subjects with neuropathy
Parkinson’s Disease:
(Leddy et al, 2011, FGA and BEST):
• Excellent correlation with: o Modified Hoehn and Yahr Scale (r = -0.736)
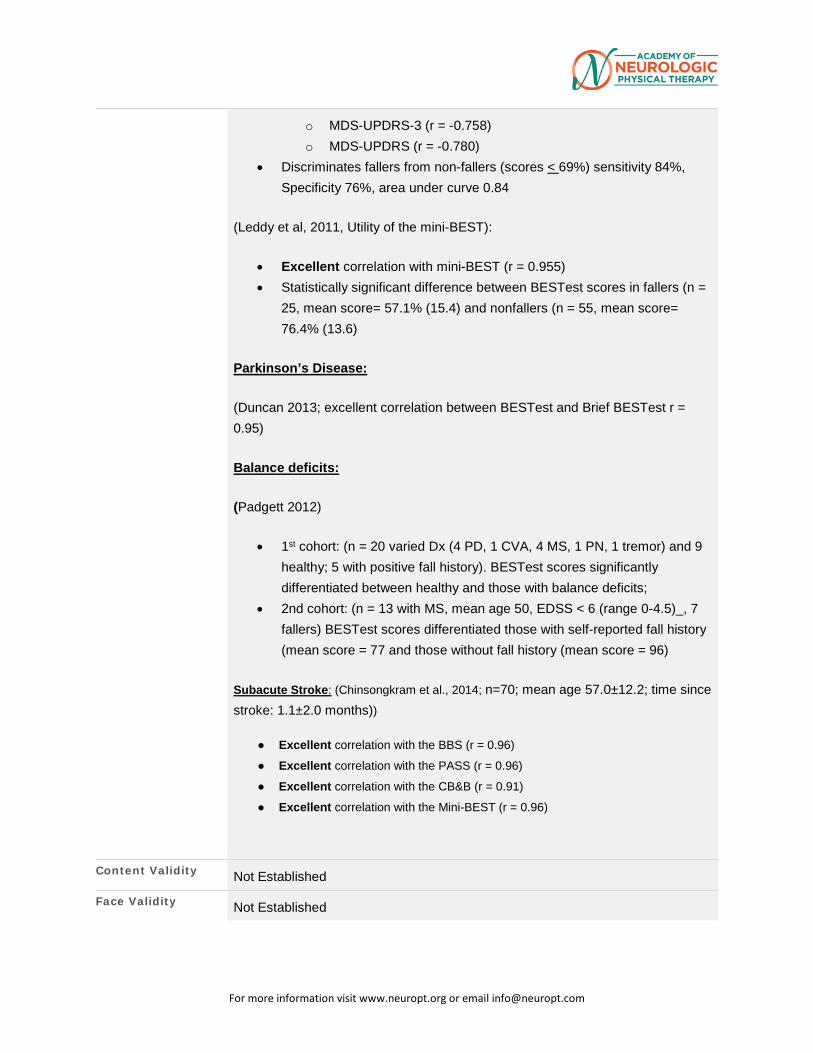
For more information visit www.neuropt.org or email [email protected]
o MDS-UPDRS-3 (r = -0.758) o MDS-UPDRS (r = -0.780)
• Discriminates fallers from non-fallers (scores < 69%) sensitivity 84%, Specificity 76%, area under curve 0.84
(Leddy et al, 2011, Utility of the mini-BEST):
• Excellent correlation with mini-BEST (r = 0.955) • Statistically significant difference between BESTest scores in fallers (n =
25, mean score= 57.1% (15.4) and nonfallers (n = 55, mean score= 76.4% (13.6)
Parkinson’s Disease:
(Duncan 2013; excellent correlation between BESTest and Brief BESTest r = 0.95)
Balance deficits:
(Padgett 2012)
• 1st cohort: (n = 20 varied Dx (4 PD, 1 CVA, 4 MS, 1 PN, 1 tremor) and 9 healthy; 5 with positive fall history). BESTest scores significantly differentiated between healthy and those with balance deficits;
• 2nd cohort: (n = 13 with MS, mean age 50, EDSS < 6 (range 0-4.5)_, 7 fallers) BESTest scores differentiated those with self-reported fall history (mean score = 77 and those without fall history (mean score = 96)
Subacute Stroke: (Chinsongkram et al., 2014; n=70; mean age 57.0±12.2; time since stroke: 1.1±2.0 months))
● Excellent correlation with the BBS (r = 0.96)
● Excellent correlation with the PASS (r = 0.96)
● Excellent correlation with the CB&B (r = 0.91)
● Excellent correlation with the Mini-BEST (r = 0.96)
Content Validity Not Established
Face Validity Not Established
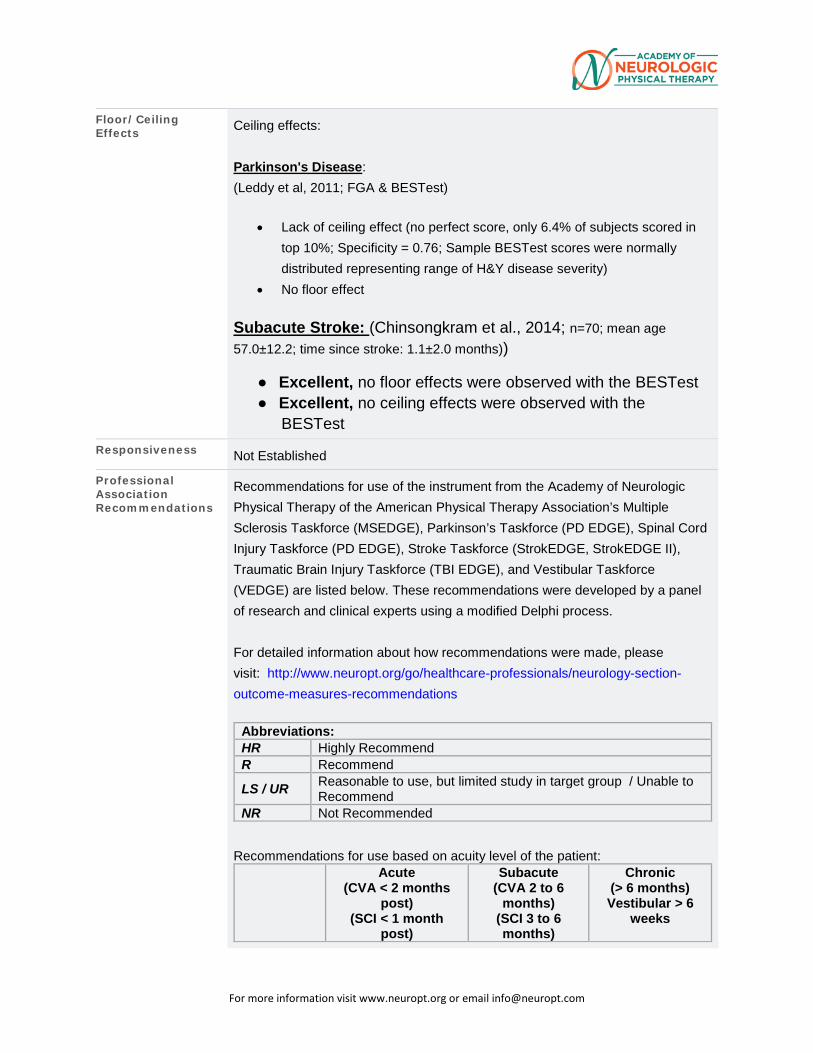
For more information visit www.neuropt.org or email [email protected]
Floor/Ceiling Effects Ceiling effects:
Parkinson's Disease: (Leddy et al, 2011; FGA & BESTest)
• Lack of ceiling effect (no perfect score, only 6.4% of subjects scored in top 10%; Specificity = 0.76; Sample BESTest scores were normally distributed representing range of H&Y disease severity)
• No floor effect
Subacute Stroke: (Chinsongkram et al., 2014; n=70; mean age 57.0±12.2; time since stroke: 1.1±2.0 months))
● Excellent, no floor effects were observed with the BESTest ● Excellent, no ceiling effects were observed with the
BESTest Responsiveness Not Established
Professional Association Recommendations
Recommendations for use of the instrument from the Academy of Neurologic Physical Therapy of the American Physical Therapy Association’s Multiple Sclerosis Taskforce (MSEDGE), Parkinson’s Taskforce (PD EDGE), Spinal Cord Injury Taskforce (PD EDGE), Stroke Taskforce (StrokEDGE, StrokEDGE II), Traumatic Brain Injury Taskforce (TBI EDGE), and Vestibular Taskforce (VEDGE) are listed below. These recommendations were developed by a panel of research and clinical experts using a modified Delphi process.
For detailed information about how recommendations were made, please visit: http://www.neuropt.org/go/healthcare-professionals/neurology-section-outcome-measures-recommendations
Abbreviations: HR Highly Recommend R Recommend LS / UR Reasonable to use, but limited study in target group / Unable to
Recommend NR Not Recommended
Recommendations for use based on acuity level of the patient: Acute
(CVA < 2 months post)
(SCI < 1 month post)
Subacute (CVA 2 to 6
months) (SCI 3 to 6 months)
Chronic (> 6 months) Vestibular > 6
weeks
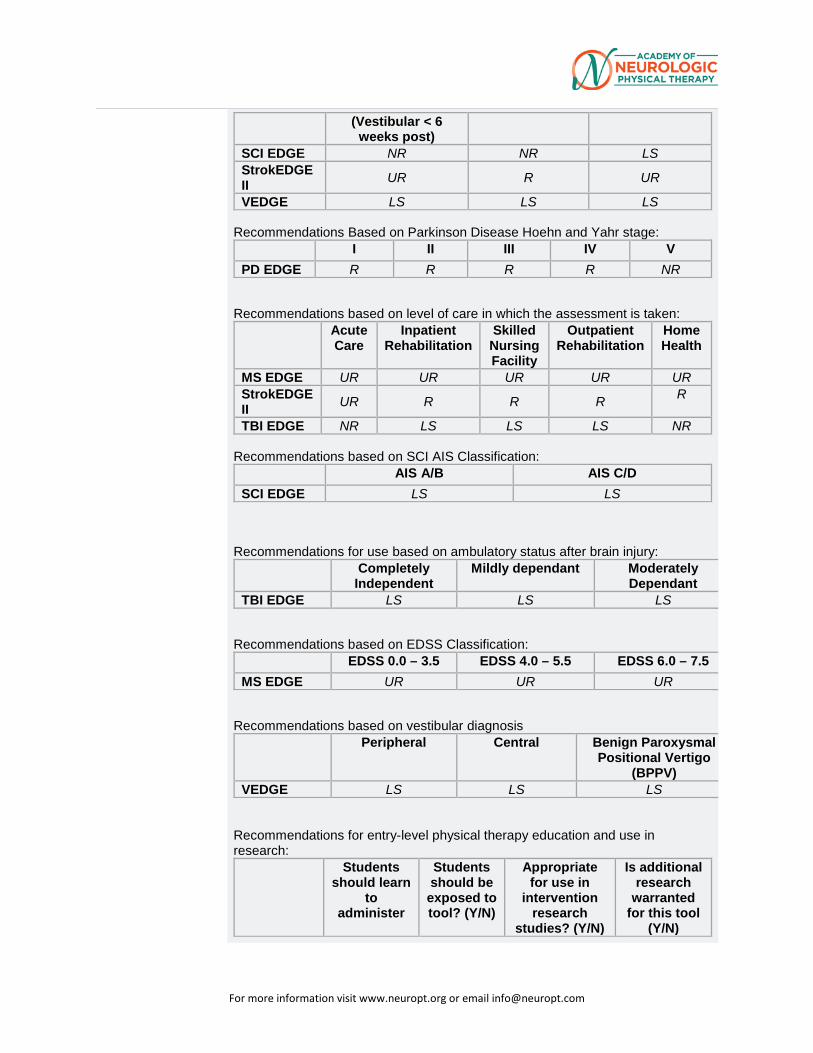
For more information visit www.neuropt.org or email [email protected]
(Vestibular < 6 weeks post)
SCI EDGE NR NR LS StrokEDGE II UR R UR VEDGE LS LS LS
Recommendations Based on Parkinson Disease Hoehn and Yahr stage: I II III IV V PD EDGE R R R R NR
Recommendations based on level of care in which the assessment is taken: Acute
Care Inpatient
Rehabilitation Skilled Nursing Facility
Outpatient Rehabilitation
Home Health
MS EDGE UR UR UR UR UR StrokEDGE II UR R R R R
TBI EDGE NR LS LS LS NR Recommendations based on SCI AIS Classification: AIS A/B AIS C/D SCI EDGE LS LS
Recommendations for use based on ambulatory status after brain injury: Completely
Independent Mildly dependant Moderately
Dependant
TBI EDGE LS LS LS Recommendations based on EDSS Classification: EDSS 0.0 – 3.5 EDSS 4.0 – 5.5 EDSS 6.0 – 7.5 MS EDGE UR UR UR
Recommendations based on vestibular diagnosis
Peripheral Central Benign Paroxysmal Positional Vertigo
(BPPV)
VEDGE LS LS LS Recommendations for entry-level physical therapy education and use in research: Students
should learn to
administer
Students should be exposed to tool? (Y/N)
Appropriate for use in
intervention research
studies? (Y/N)
Is additional research
warranted for this tool
(Y/N)
For more information visit www.neuropt.org or email [email protected]
this tool? (Y/N)
MS EDGE No No No Yes PD EDGE No Yes Yes Not reported SCI EDGE No No No Not reported StrokEDGE II No Yes Yes Not reported
TBI EDGE No No No Not reported VEDGE No Yes Yes Yes
Considerations • The BESTest is suitable for assessing balance in individuals with subacute stroke across many levels of functional ability, demonstrated by the distribution of BESTest scores.
• The BESTest allows the clinician to tailor their intervention to specific postural control systems, due to the instrument’s ability to provide information regarding particular balance systems underlying balance impairments.
• The BESTest may be preferred to the BBS and Mini-BESTest for functional classification due to its slightly larger LR+.
• The BESTest may be more preferable than other balance scales due to its lack of floor and ceiling effects.
• Unknown whether or not the BESTest may be generalizable to patients with chronic stroke, cognitive impairment (Mini-Mental State Exam < 24), lesions involving the brainstem or cerebellum, aphasia, or presence of major conditions sufficient to disturb balance.
• Strong psychometric studies in PD population with ability to detect retrospective fallers and predict falls over 6 month period with 68% cut off score
• Limited evidence of its utility in directing treatment • Time to complete BESTest may not be feasible in all clinical settings, but
is a strong tool for more in depth diagnostic assessment of balance impairment in PD
Balance Evaluation Systems Test translations:
Danish: http://fysio.dk/fafo/Maleredskaber/Maleredskaber-alfabetisk/BESTest/
Brazilian Portuguese:
Rodrigues LC, Marques AP, Barros PB, Michaelsen SM. Reliability of the Balance Evaluation Systems Test (BESTest) and BESTest sections for adults with hemiparesis. Brazilian journal of physical therapy. 2014;18(3):276-81.
For more information visit www.neuropt.org or email [email protected]
Intra- and inter-rater reliability and concurrent and convergent validity evaluated in the Adult Stroke population
These translations, and links to them, are subject to the Terms and Conditions of Use of the Rehab Measures Database. RIC is not responsible for and does not endorse the content, products or services of any third-party website, and does not make any representations regarding its quality, content or accuracy. If you would like to contribute a language translation to the RMD, please contact us at [email protected].
Do you see an error or have a suggestion for this instrument summary? Please e-mail us!
Bibliography Chinsongkram, B., Chaikeeree, N., et. al. (2014). Reliability and validity of the Balance Evaluation Systems Test (BESTest) in people with subacute stroke. Physical Therapy 94(11), 1632-1643.
Duncan, R. P., Leddy, A. L., et al. (2012). "Accuracy of fall prediction in Parkinson disease: six-month and 12-month prospective analyses." Parkinsons Dis 2012: 237673. Find it on PubMed
Duncan, R. P., Leddy, A. L., et al. (2013). "Comparative utility of the BESTest, Mini-BESTest, and Brief-BESTest for predicting falls in individuals with Parkinson disease: a cohort study." Physical therapy 93(4): 542-550.
Franchignoni, F., Horak, F., et al. (2010). "Using psychometric techniques to improve the Balance Evaluation System’s Test: the mini-BESTest." Journal of rehabilitation medicine: official journal of the UEMS European Board of Physical and Rehabilitation Medicine 42(4): 323.
Franchignoni, F., Horak, F., et al. (2010). "Using psychometric techniques to improve the Balance Evaluation Systems Test: the mini-BESTest." J Rehabil Med 42(4): 323-331. Find it on PubMed
Horak, F. B., Wrisley, D. M., et al. (2009). "The Balance Evaluation Systems Test (BESTest) to differentiate balance deficits." Physical Therapy 89(5): 484-498. Find it on PubMed
Horak, F. B., Wrisley, D. M., et al. (2009). "The Balance Evaluation Systems Test (BESTest) to differentiate balance deficits." Phys Ther 89(5): 484-498. Find it on PubMed
For more information visit www.neuropt.org or email [email protected]
Jacobs, JV. & Kasser, SL, (2012). Balance impairment in people with multiple sclerosis:
Preliminary evidence for the Balance Evaluation Systems Test. Gait & Posture 36: 414-
418.
Leddy, A. L., Crowner, B. E., et al. (2011). "Functional gait assessment and balance evaluation system test: reliability, validity, sensitivity, and specificity for identifying individuals with Parkinson disease who fall." Physical Therapy 91(1): 102-113. Find it on PubMed
Leddy, A. L., Crowner, B. E., et al. (2011). "Functional gait assessment and balance evaluation system test: reliability, validity, sensitivity, and specificity for identifying individuals with Parkinson disease who fall." Phys Ther 91(1): 102-113. Find it on PubMed
Leddy, A. L., Crowner, B. E., et al. (2011). "Utility of the Mini-BESTest, BESTest, and BESTest sections for balance assessments in individuals with Parkinson disease." J Neurol Phys Ther 35(2): 90-97. Find it on PubMed
Padgett, P. K., Jacobs, J. V., et al. (2012). "Is the BESTest at its best? A suggested brief version based on interrater reliability, validity, internal consistency, and theoretical construct." Physical therapy 92(9): 1197-1207.
Year published
Instrument in PDF Format Yes
Approval Status Approved
For more information visit www.neuropt.org or email [email protected]
5. REHAB MEASURES DATABASE—BOX AND BLOCK TEST
Link to instrument Box and Blocks Test Instructions
Title of Assessment Box and Block Test
Acronym BBT
Instrument Reviewer(s) Initially reviewed by Jason Raad, MS of the Rehabilitation Measures Team and
Dorian Rose, PT, PhD of the StrokEdge Taskforce of the Academy of Neurologic Physical Therapy - a component of APTA in 9/2011; Updated with references for Stroke and Fibromyalgia populations by Denise Toombs, SPT and Marina Yusupova, SPT in 2011; Reviewed and updated by Michele Sulwer, PT, DPT, NCS and Genevieve Pinto-Zipp, PT, EdD, of the StrokEDGE II Neurology Section, APTA, in 4/2016.
Summary Date 4/26/2012
Purpose Assesses unilateral gross manual dexterity
Description • Individuals are seated at a table, facing a rectangular box that is divided into two square compartments of equal dimension by means of a partition.
• One hundred and fifty, 2.5 cm, colored, wooden cubes or blocks are placed in one compartment or the other.
• The individual is instructed to move as many blocks as possible, one at a time, from one compartment to the other for a period of 60 seconds.
• Standardized dimensions for the test materials and procedures for test administration and scoring have been provided by Mathiowetz et al, 1985.
• To administer the test, the examiner is seated opposite the individual in order to observe test performance.
• The BBT is scored by counting the number of blocks carried over the partition from one compartment to the other during the one-minute trial period.
• Patient’s hand must cross over the partition in order for a point to be given, and blocks that drop or bounce out of the second compartment onto the floor are still rewarded with a point.
• Multiple blocks carried over at the same time count as a single point. • Higher scores on the test indicate better gross manual dexterity.
For more information visit www.neuropt.org or email [email protected]
Area of Assessment Activities of Daily Living; Coordination; Dexterity; Upper Extremity Function
Body Part Not Applicable
ICF Domain Activity
Domain Motor
Assessment Type Observer
Length of Test 05 Minutes or Less
Time to Administer 2-5 minutes
Number of Items 1
Equipment Required • Stopwatch
• Wooden box dimensioned in 53.7 cm x 25.4 cm x 8.5 cm • Partition (should be placed at the middle of the box, dividing it in two
containers of 25.4 cm each) • 150 wooden cubes (2.5 cm in size)
Training Required No Training
Type of training required No Training
Cost Not Free
Actual Cost Commercially produced versions of the test can be purchased for approximately $200.00 (as of 2011)
http://www.wisdomking.com/product/box-block-test
http://www.pattersonmedical.com/app.aspx?cmd=get_product&id=79848
http://www.medicalsuppliest.com/box-and-block-test-1
Age Range Child: 6-12 years; Adult: 18-64 years; Elderly adult: 65+
Administration Mode Paper/Pencil
Diagnosis Multiple Sclerosis; Stroke; Traumatic Brain Injury
Populations Tested • Stroke
• Multiple Sclerosis
• Traumatic Brain Injury (TBI)
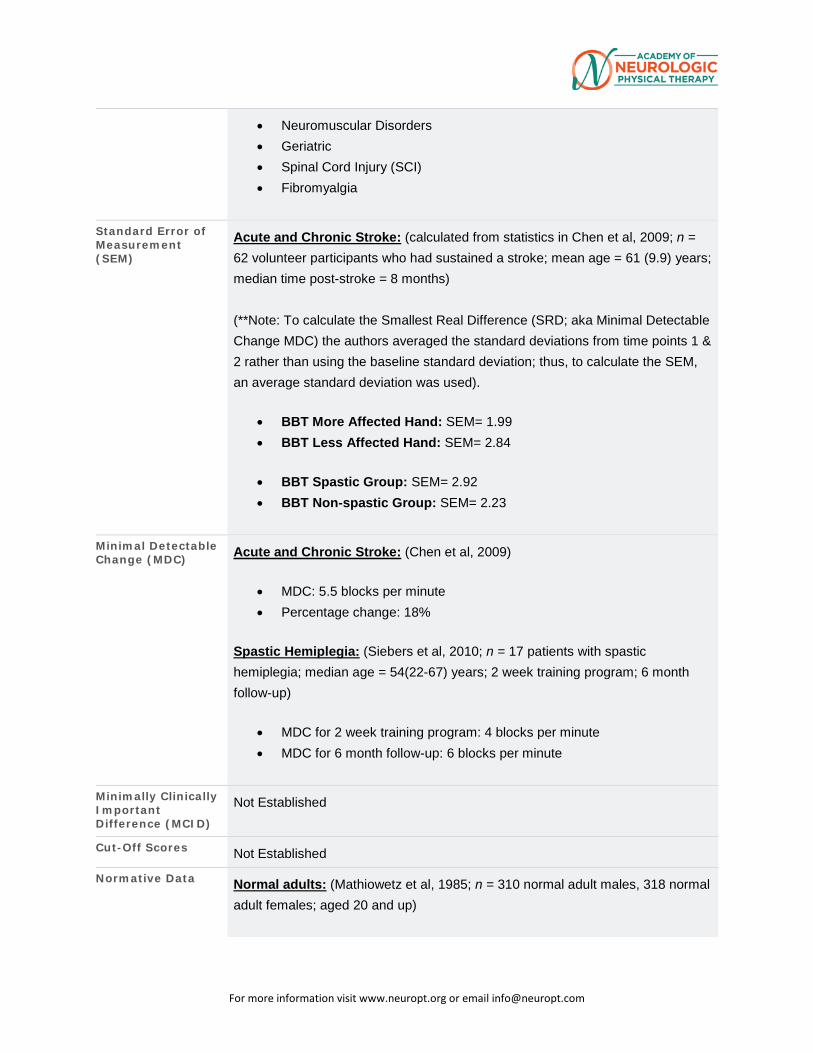
For more information visit www.neuropt.org or email [email protected]
• Neuromuscular Disorders
• Geriatric
• Spinal Cord Injury (SCI) • Fibromyalgia
Standard Error of Measurement (SEM)
Acute and Chronic Stroke: (calculated from statistics in Chen et al, 2009; n = 62 volunteer participants who had sustained a stroke; mean age = 61 (9.9) years; median time post-stroke = 8 months)
(**Note: To calculate the Smallest Real Difference (SRD; aka Minimal Detectable Change MDC) the authors averaged the standard deviations from time points 1 & 2 rather than using the baseline standard deviation; thus, to calculate the SEM, an average standard deviation was used).
• BBT More Affected Hand: SEM= 1.99
• BBT Less Affected Hand: SEM= 2.84
• BBT Spastic Group: SEM= 2.92
• BBT Non-spastic Group: SEM= 2.23
Minimal Detectable Change (MDC) Acute and Chronic Stroke: (Chen et al, 2009)
• MDC: 5.5 blocks per minute • Percentage change: 18%
Spastic Hemiplegia: (Siebers et al, 2010; n = 17 patients with spastic hemiplegia; median age = 54(22-67) years; 2 week training program; 6 month follow-up)
• MDC for 2 week training program: 4 blocks per minute
• MDC for 6 month follow-up: 6 blocks per minute
Minimally Clinically Important Difference (MCID)
Not Established
Cut-Off Scores Not Established
Normative Data Normal adults: (Mathiowetz et al, 1985; n = 310 normal adult males, 318 normal adult females; aged 20 and up)
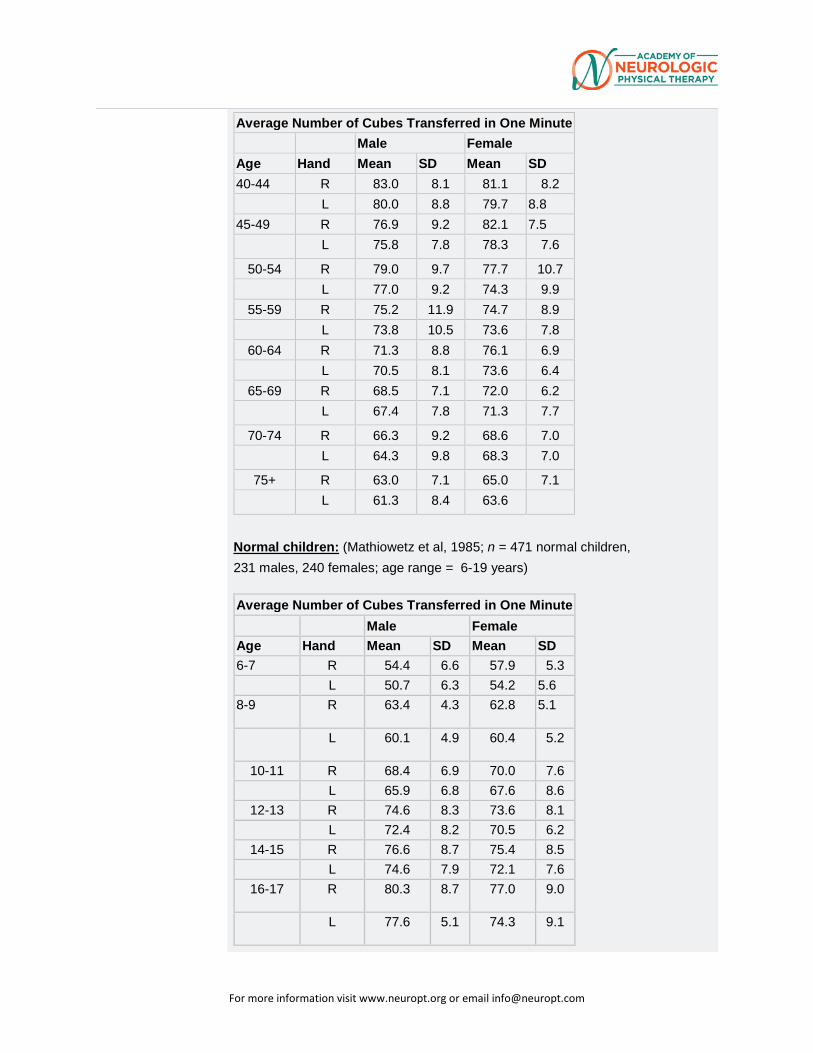
For more information visit www.neuropt.org or email [email protected]
Average Number of Cubes Transferred in One Minute Male Female
Age Hand Mean SD Mean SD 40-44 R 83.0 8.1 81.1 8.2
L 80.0 8.8 79.7 8.8 45-49 R 76.9 9.2 82.1 7.5
L 75.8 7.8 78.3 7.6 50-54 R 79.0 9.7 77.7 10.7
L 77.0 9.2 74.3 9.9 55-59 R 75.2 11.9 74.7 8.9
L 73.8 10.5 73.6 7.8 60-64 R 71.3 8.8 76.1 6.9
L 70.5 8.1 73.6 6.4 65-69 R 68.5 7.1 72.0 6.2
L 67.4 7.8 71.3 7.7 70-74 R 66.3 9.2 68.6 7.0
L 64.3 9.8 68.3 7.0 75+ R 63.0 7.1 65.0 7.1 L 61.3 8.4 63.6
Normal children: (Mathiowetz et al, 1985; n = 471 normal children, 231 males, 240 females; age range = 6-19 years)
Average Number of Cubes Transferred in One Minute Male Female
Age Hand Mean SD Mean SD 6-7 R 54.4 6.6 57.9 5.3
L 50.7 6.3 54.2 5.6 8-9 R 63.4 4.3 62.8 5.1
L 60.1 4.9 60.4 5.2
10-11 R 68.4 6.9 70.0 7.6 L 65.9 6.8 67.6 8.6
12-13 R 74.6 8.3 73.6 8.1 L 72.4 8.2 70.5 6.2
14-15 R 76.6 8.7 75.4 8.5 L 74.6 7.9 72.1 7.6
16-17 R 80.3 8.7 77.0 9.0
L 77.6 5.1 74.3 9.1
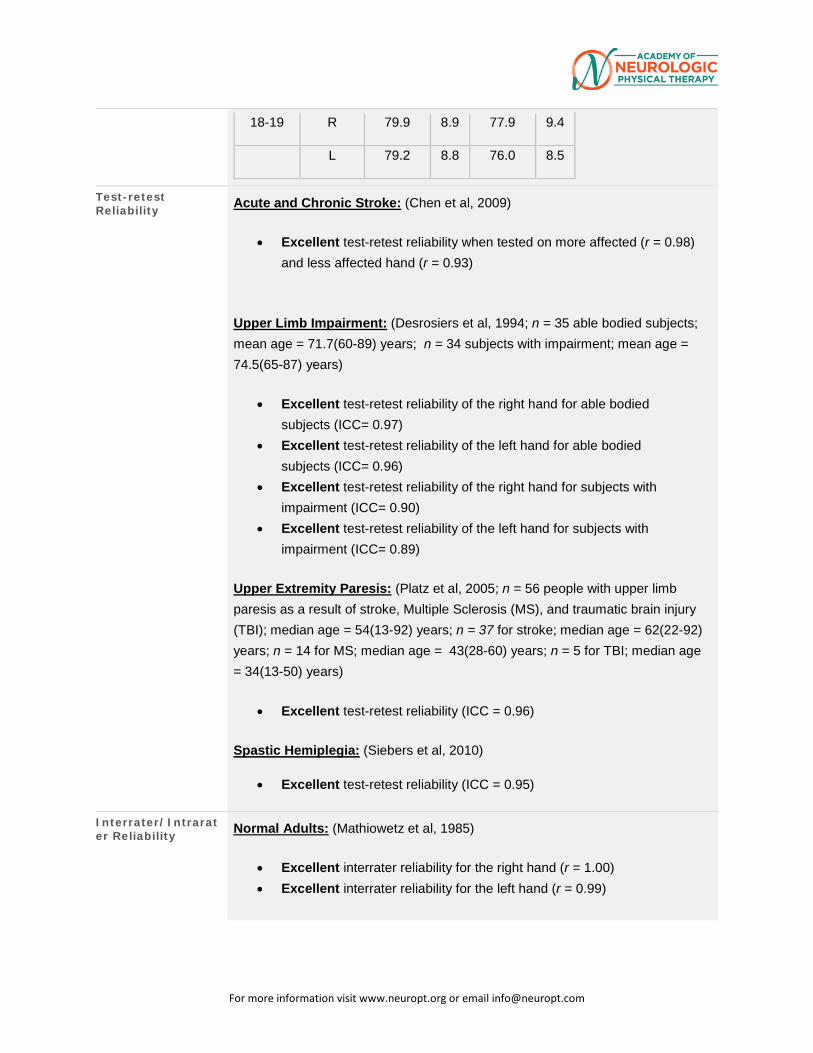
For more information visit www.neuropt.org or email [email protected]
18-19 R 79.9 8.9 77.9 9.4
L 79.2 8.8 76.0 8.5
Test-retest Reliability Acute and Chronic Stroke: (Chen et al, 2009)
• Excellent test-retest reliability when tested on more affected (r = 0.98) and less affected hand (r = 0.93)
Upper Limb Impairment: (Desrosiers et al, 1994; n = 35 able bodied subjects; mean age = 71.7(60-89) years; n = 34 subjects with impairment; mean age = 74.5(65-87) years)
• Excellent test-retest reliability of the right hand for able bodied subjects (ICC= 0.97)
• Excellent test-retest reliability of the left hand for able bodied subjects (ICC= 0.96)
• Excellent test-retest reliability of the right hand for subjects with impairment (ICC= 0.90)
• Excellent test-retest reliability of the left hand for subjects with impairment (ICC= 0.89)
Upper Extremity Paresis: (Platz et al, 2005; n = 56 people with upper limb paresis as a result of stroke, Multiple Sclerosis (MS), and traumatic brain injury (TBI); median age = 54(13-92) years; n = 37 for stroke; median age = 62(22-92) years; n = 14 for MS; median age = 43(28-60) years; n = 5 for TBI; median age = 34(13-50) years)
• Excellent test-retest reliability (ICC = 0.96)
Spastic Hemiplegia: (Siebers et al, 2010)
• Excellent test-retest reliability (ICC = 0.95)
Interrater/Intrarater Reliability Normal Adults: (Mathiowetz et al, 1985)
• Excellent interrater reliability for the right hand (r = 1.00) • Excellent interrater reliability for the left hand (r = 0.99)
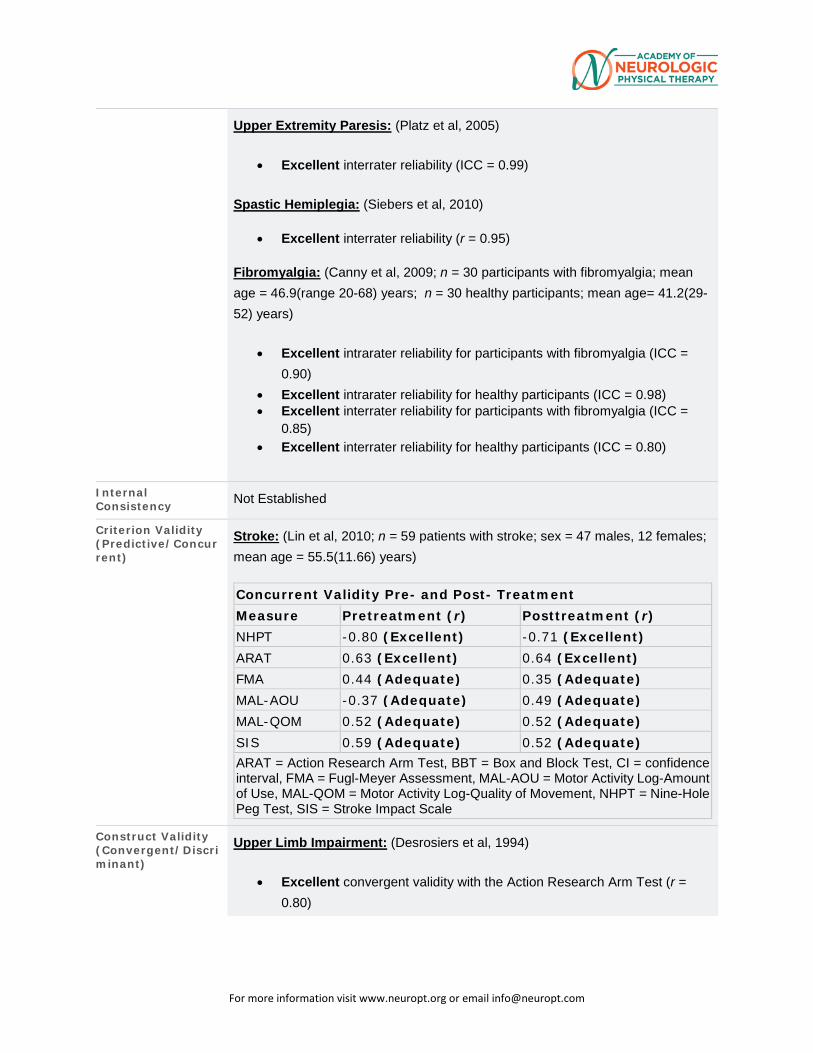
For more information visit www.neuropt.org or email [email protected]
Upper Extremity Paresis: (Platz et al, 2005)
• Excellent interrater reliability (ICC = 0.99)
Spastic Hemiplegia: (Siebers et al, 2010)
• Excellent interrater reliability (r = 0.95)
Fibromyalgia: (Canny et al, 2009; n = 30 participants with fibromyalgia; mean age = 46.9(range 20-68) years; n = 30 healthy participants; mean age= 41.2(29-52) years)
• Excellent intrarater reliability for participants with fibromyalgia (ICC = 0.90)
• Excellent intrarater reliability for healthy participants (ICC = 0.98) • Excellent interrater reliability for participants with fibromyalgia (ICC =
0.85) • Excellent interrater reliability for healthy participants (ICC = 0.80)
Internal Consistency Not Established
Criterion Validity (Predictive/Concurrent)
Stroke: (Lin et al, 2010; n = 59 patients with stroke; sex = 47 males, 12 females; mean age = 55.5(11.66) years)
Concurrent Validity Pre- and Post- Treatment Measure Pretreatment (r) Posttreatment (r) NHPT -0.80 (Excellent) -0.71 (Excellent) ARAT 0.63 (Excellent) 0.64 (Excellent) FMA 0.44 (Adequate) 0.35 (Adequate) MAL-AOU -0.37 (Adequate) 0.49 (Adequate) MAL-QOM 0.52 (Adequate) 0.52 (Adequate) SIS 0.59 (Adequate) 0.52 (Adequate) ARAT = Action Research Arm Test, BBT = Box and Block Test, CI = confidence interval, FMA = Fugl-Meyer Assessment, MAL-AOU = Motor Activity Log-Amount of Use, MAL-QOM = Motor Activity Log-Quality of Movement, NHPT = Nine-Hole Peg Test, SIS = Stroke Impact Scale
Construct Validity (Convergent/Discriminant)
Upper Limb Impairment: (Desrosiers et al, 1994)
• Excellent convergent validity with the Action Research Arm Test (r = 0.80)
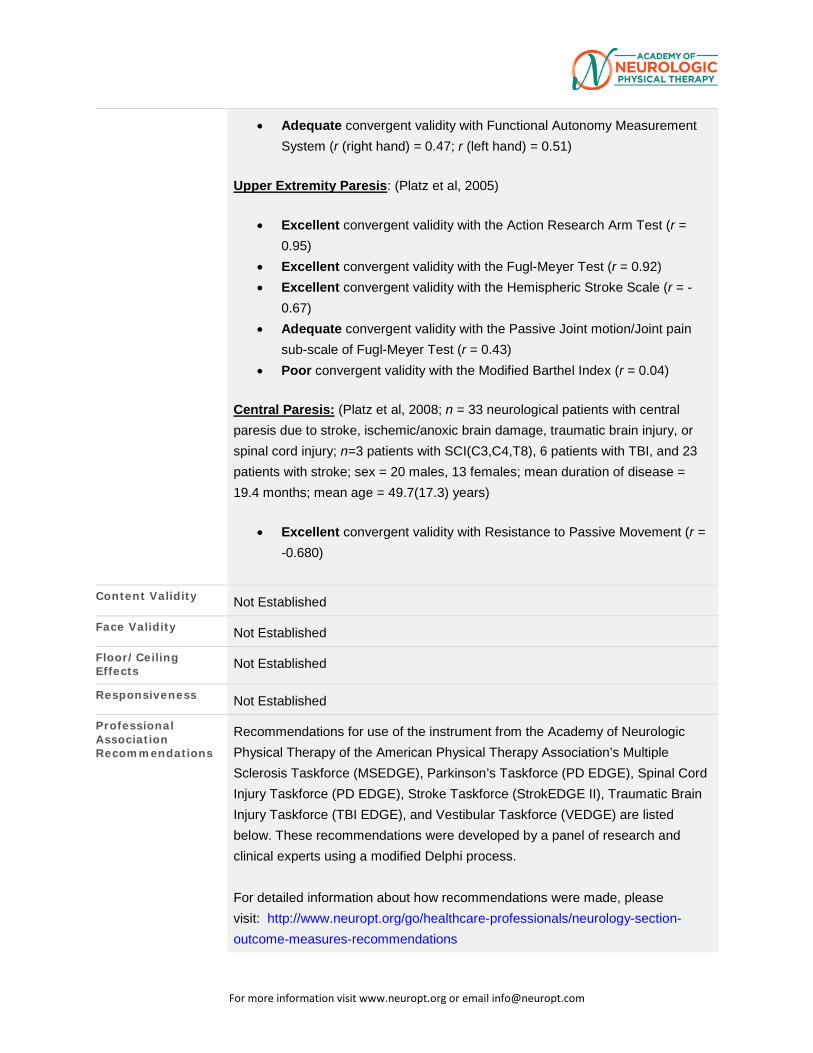
For more information visit www.neuropt.org or email [email protected]
• Adequate convergent validity with Functional Autonomy Measurement System (r (right hand) = 0.47; r (left hand) = 0.51)
Upper Extremity Paresis: (Platz et al, 2005)
• Excellent convergent validity with the Action Research Arm Test (r = 0.95)
• Excellent convergent validity with the Fugl-Meyer Test (r = 0.92) • Excellent convergent validity with the Hemispheric Stroke Scale (r = -
0.67) • Adequate convergent validity with the Passive Joint motion/Joint pain
sub-scale of Fugl-Meyer Test (r = 0.43) • Poor convergent validity with the Modified Barthel Index (r = 0.04)
Central Paresis: (Platz et al, 2008; n = 33 neurological patients with central paresis due to stroke, ischemic/anoxic brain damage, traumatic brain injury, or spinal cord injury; n=3 patients with SCI(C3,C4,T8), 6 patients with TBI, and 23 patients with stroke; sex = 20 males, 13 females; mean duration of disease = 19.4 months; mean age = 49.7(17.3) years)
• Excellent convergent validity with Resistance to Passive Movement (r = -0.680)
Content Validity Not Established
Face Validity Not Established
Floor/Ceiling Effects Not Established
Responsiveness Not Established
Professional Association Recommendations
Recommendations for use of the instrument from the Academy of Neurologic Physical Therapy of the American Physical Therapy Association’s Multiple Sclerosis Taskforce (MSEDGE), Parkinson’s Taskforce (PD EDGE), Spinal Cord Injury Taskforce (PD EDGE), Stroke Taskforce (StrokEDGE II), Traumatic Brain Injury Taskforce (TBI EDGE), and Vestibular Taskforce (VEDGE) are listed below. These recommendations were developed by a panel of research and clinical experts using a modified Delphi process.
For detailed information about how recommendations were made, please visit: http://www.neuropt.org/go/healthcare-professionals/neurology-section-outcome-measures-recommendations
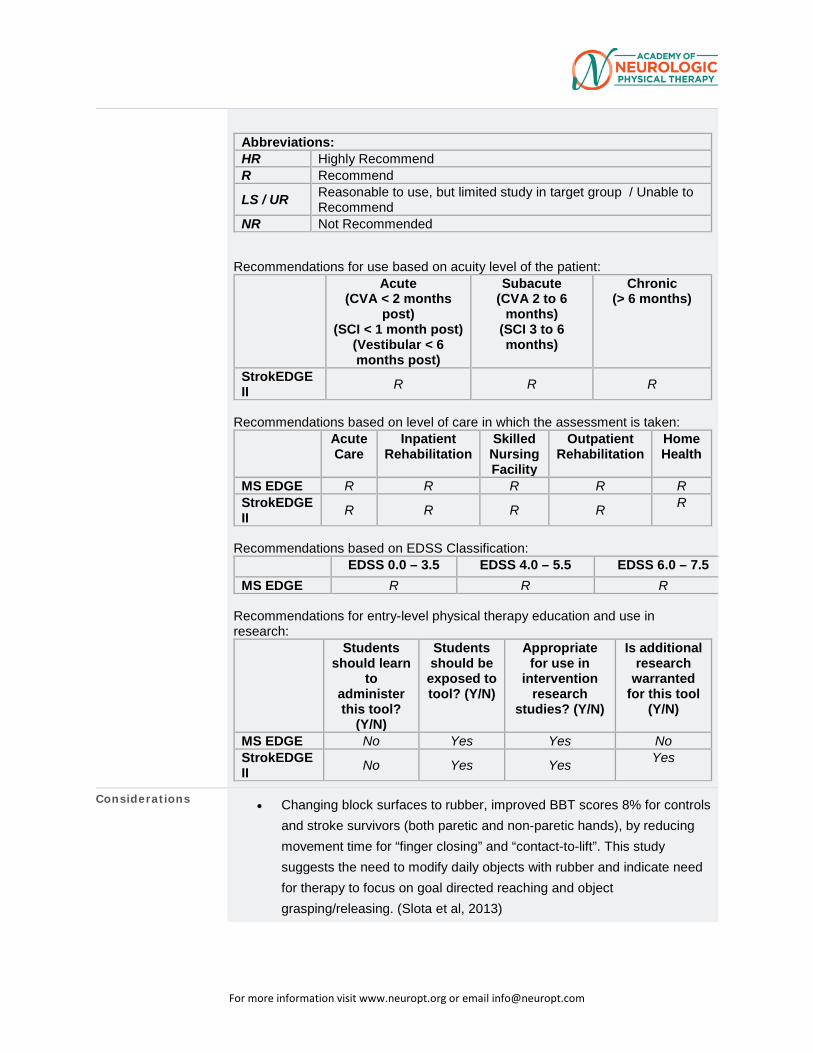
For more information visit www.neuropt.org or email [email protected]
Abbreviations: HR Highly Recommend R Recommend LS / UR Reasonable to use, but limited study in target group / Unable to
Recommend NR Not Recommended
Recommendations for use based on acuity level of the patient: Acute
(CVA < 2 months post)
(SCI < 1 month post) (Vestibular < 6 months post)
Subacute (CVA 2 to 6
months) (SCI 3 to 6 months)
Chronic (> 6 months)
StrokEDGE II R R R
Recommendations based on level of care in which the assessment is taken: Acute
Care Inpatient
Rehabilitation Skilled Nursing Facility
Outpatient Rehabilitation
Home Health
MS EDGE R R R R R StrokEDGE II R R R R R
Recommendations based on EDSS Classification: EDSS 0.0 – 3.5 EDSS 4.0 – 5.5 EDSS 6.0 – 7.5 MS EDGE R R R
Recommendations for entry-level physical therapy education and use in research: Students
should learn to
administer this tool?
(Y/N)
Students should be exposed to tool? (Y/N)
Appropriate for use in
intervention research
studies? (Y/N)
Is additional research
warranted for this tool
(Y/N)
MS EDGE No Yes Yes No StrokEDGE II No Yes Yes Yes
Considerations • Changing block surfaces to rubber, improved BBT scores 8% for controls and stroke survivors (both paretic and non-paretic hands), by reducing movement time for “finger closing” and “contact-to-lift”. This study suggests the need to modify daily objects with rubber and indicate need for therapy to focus on goal directed reaching and object grasping/releasing. (Slota et al, 2013)
For more information visit www.neuropt.org or email [email protected]
Do you see an error or have a suggestion for this instrument summary? Please e-mail us!
Bibliography Canny, M. L., Thompson, J. M., et al. (2009). "Reliability of the box and block test of manual dexterity for use with patients with fibromyalgia." Am J Occup Ther 63(4): 506-510. Find it on PubMed
Chen, H. M., Chen, C. C., et al. (2009). "Test-retest reproducibility and smallest real difference of 5 hand function tests in patients with stroke." Neurorehabil Neural Repair 23(5): 435-440. Find it on PubMed
Desrosiers, J., Bravo, G., et al. (1994). "Validation of the Box and Block Test as a measure of dexterity of elderly people: reliability, validity, and norms studies." Arch Phys Med Rehabil 75: 751-755. Find it on PubMed
Lin, K. C., Chuang, L. L., et al. (2010). "Responsiveness and validity of three dexterous function measures in stroke rehabilitation." J Rehabil Res Dev 47(6): 563-571. Find it on PubMed
Mathiowetz, V., Ferderman, S., et al. (1985). "Box and Block Test of Manual Dexterity: Norms for 6-19 Year Olds." Canadian Journal of Occupational Therapy. Revue Canadienne d'ergothérapie 52(5): 241-246. Find it on PubMed
Mathiowetz, V., Volland, G., et al. (1985). "Adult norms for the Box and Block Test of manual dexterity." Am J Occup Ther 39(3160243): 386-391. Find it on PubMed
Platz, T., Pinkowski, C., et al. (2005). "Reliability and validity of arm function assessment with standardized guidelines for the Fugl-Meyer Test, Action Research Arm Test and Box and Block Test: a multicentre study." Clin Rehabil 19(4): 404-411. Find it on PubMed
Platz, T., Vuadens, P., et al. (2008). "REPAS, a summary rating scale for resistance to passive movement: item selection, reliability and validity." Disabil Rehabil 30(1): 44-53. Find it on PubMed
Siebers, A., Oberg, U., et al. (2010). "The effect of modified constraint-induced movement therapy on spasticity and motor function of the affected arm in patients with chronic stroke." Physiother Can 62(4): 388-396. Find it on PubMed
For more information visit www.neuropt.org or email [email protected]
Slota, G., Enders, L., et al. (2013). “Improvement of hand function using different surfaces and identification of difficult movement post stroke in the Box and Block Test.” Applied Ergonomics 45: 833-838. Find it on PubMed
Year published 1957
Instrument in PDF Format Yes
Approval Status Approved
For more information visit www.neuropt.org or email [email protected]
6. REHAB MEASURES DATABASE—CANADIAN OCCUPATIONAL PERFORMANCE MEASURE
Link to instrument Available for purchase at the Canadian Association of Occupational
Therapists (external link)
Title of Assessment Canadian Occupational Performance Measure
Acronym COPM
Instrument Reviewer(s) Initially reviewed by the Rehabilitation Measures Team; Updated with references from the TBI population by Anna de Joya, PT, DSc, NCS, Coby Nirider, PT, DPT, and the TBI EDGE task force of the Academy of Neurologic Physical Therapy - a component of APTA in 2012; Updated with references for Arthritis, Pediatrics, and Ankylosing Spondylitis by Brianna DeBois, SPT, Samantha Dillon, SPT, and Jennifer Kick, SPT in 11/2012. Updated by Maggie Bland PT,DPT,NCS and Nancy Byl PT,MPH,PhD, FAPTA and the StrokEdge II task force of the Academy of Neurologic Physical Therapy - a component of APTA in 2016.
Summary Date 4-19-2016
Purpose Assesses an individual’s perceived occupational performance in the areas of self-care, productivity, and leisure.
Description The assessment involves a 5-step process nested within a semi-structured interview, typically conducted by an Occupational Therapist.
• Interview focuses on identifying activities within each performance domain that the client wants, needs, or is expected to perform.
• Following Step 3, the patient and therapist create goals for therapeutic interventions.
• The interviewer may need to supplement information gathered during the COPM interview through other techniques including direct observation, administration of standardized tests, or an assessment of the patient's environment (Law et al, 1990).
• Has been translated into 24 languages and is used in over 35 countries. Also available in Pediatric, French, Hebrew, Icelandic, Japanese, German, Danish, Swedish, Greek, Spanish, Mandarin Chinese, Korean, Russian, Slavic, Italian, Portuguese and Norwegian versions.
For more information visit www.neuropt.org or email [email protected]
• Caregiver/proxy may respond on the patient’s behalf, but they may not identify the same deficits or problems as the patient would and there may be differences in option in regard to the importance of activities.
Area of Assessment Activities of Daily Living; Functional Mobility; Life Participation; Occupational
Performance
Body Part Not Applicable
ICF Domain Participation
Domain ADL; General Health; Motor
Assessment Type Patient Reported Outcomes
Length of Test 06 to 30 Minutes
Time to Administer 10-20 minutes
Number of Items Not applicable
Equipment Required None necessary
Training Required None necessary
Type of training required Reading an Article/Manual
Cost Not Free
Actual Cost A 45-minute DVD and Workbook with COPM manual and 100 Forms is $225.45 (Canadian) or a Manual/Form Kit for $52.45 (Canadian) can be purchased from the Canadian Association of Occupational Therapists (cost determined in November, 2012)
Age Range Child: 6-12 years; Adolescent: 13-17 years; Adult: 18-64 years; Elderly
adult: 65+
Administration Mode Paper/Pencil
Diagnosis Arthritis; Cerebral Palsy; Chronic Obstructive Pulmonary Disease; Pain;
Parkinson’s Disease; Spinal Cord Injury; Stroke; Traumatic Brain Injury
Populations Tested The COPM was designed for use with all clients regardless of diagnosis (Law et al, 2004). The COPM has been validated with patients drawn from the following populations:
• Stroke
For more information visit www.neuropt.org or email [email protected]
• COPD
• Pain
• Cerebral Palsy
• Traumatic Brain Injury
• Parkinson's Disease
• Arthritis
• Pediatrics
• Ankylosing Spondylitis
Standard Error of Measurement (SEM)
Ankylosing Spondylitis: (calculated from statistics in Kjenken et al, 2005; Rescore by personal interview, n=17, mean age 46.4 (12.8) years; Rescore by telephone, n=25, mean age 48.7 (13.3) years; Rescore by mail, n=24, mean age 46.6 (12.5) years; 2 weeks between assessments, Ankylosing Spondylitis)
• Personal interview o SEM for performance=0.66 o SEM for satisfaction=0.84
• Telephone interview o SEM for performance=1.41 o SEM for satisfaction=1.86
• Mail o SEM for performance=0.99 o SEM for satisfaction=1.13
Stroke: (calculated from statistics in Cup et al, 2003, Acute Stroke) 2 to 6 months post onset
• SEM for performance=1.2 points • SEM for satisfaction=1.9 points
Minimal Detectable Change (MDC)
Ankylosing Spondylitis: (calculated from statistics in Kjeken et al, 2005)
• Personal interview o MDC for performance=1.59 o MDC for satisfaction - 1.80
• Telephone interview o MDC for performance=2.33 o MDC for satisfaction=2.63
• Mail o MDC for performance=1.95 o MDC for satisfaction=2.08
Osteoarthritis: (calculated by MacDermid et al, 2009 from Kjeken et al, 2005; n=87, women, mean age=62.7 (5.4) years, Hand Osteoarthritis)
• MDC= 5 Stroke: (calculated from statistics in Cup et al, 2003, Acute Stroke) 2 to 6 months post onset
• MDC for performance=1.7 points • MDC for satisfaction=2.7 points
For more information visit www.neuropt.org or email [email protected]
Minimally Clinically Important Difference (MCID)
Not Established
Cut-Off Scores Not Established
Normative Data Acute Stroke: (Cup et al, 2003; n=26; mean age=68 (15) years; mean time between assessments=8 days (2.5) days, range 5–16 days, Acute Stroke) Mean performance and satisfaction scores Mode number of problems identified over two assessments 3 to 5
• Interview 1: mean performance score 3.5 (SD 1.8, range 1.0–7.0)
• Interview 2: mean performance score 3.7 (SD 1.9, range 1.0–6.8) • Interview 1: mean satisfaction score 3.3 (SD 1.9, range 1.0–7.5) • Interview 2: mean satisfaction score 3.5 (SD 2.1, range 1.0–7.4)
Test-retest Reliability Adults with impairment in 1 or more ADL: (Eyssen et al, 2005; n=95; mean age 47 (15) years; various diagnoses; COPM administered twice, 7 days between assessments)
• Adequate test-retest reliability (ICC=0.67 performance and 0.69 satisfaction)
Ankylosing Spondylitis: (Kjenken et al, 2005)
• Excellent test-retest reliability by personal interview (ICC=0.92 performance and ICC=0.93 satisfaction)
• Adequate test-retest reliability by telephone (ICC=0.73 performance and ICC=0.73 satisfaction)
• Excellent test-retest reliability by mail (ICC=0.90 performance and ICC=0.90 satisfaction)
COPD: (Sewell & Singh, 2001, COPD)
• Excellent test-retest reliability (ICC=0.81 performance and ICC=0.76 satisfaction)
Stroke: (Cup et al, 2003; 2 to 6 months post onset, Acute Stroke)
• Excellent test-retest reliability o r=0.87 performance o r=0.88 satisfaction
Interrater/Intrarater Reliability
Acquired Brain Injury: (Jenkinson et al, 2007; Community dwelling individuals; n=34 (TBI=21; CVA=11; Others=2); total of 15 patients with ABI were involved in the stability study, ABI) Consistency of self- and relative ratings for no intervention group:
• No significant difference in COPM performance ratings for participants (M=4.62 (1.72)) and relatives (M=4.49 (1.86)); t=0.30, p=0.77)
For more information visit www.neuropt.org or email [email protected]
• No significant difference in COPM satisfaction ratings for participants (M=4.24(1.89)) and relatives (M=5.01 (1.57)); t =-1.79, p =0.078)
• Participants rated their functional abilities on the Patient Competency Rating Scale (PCRS) (M=111.92 (17.58)) at a higher level than their relatives (M=105.75 (20.46)); however, no significant difference (t (62)=1.29, p =0.20)
• Participants’ self-ratings relatively consistent with their relatives’ ratings
Test–re-test reliability coefficients for the COPM ratings over the 8-week interval were all significant
• Excellent (r=0.75–0.86) for relative ratings; Adequate (r=0.53–0.67) for self-ratings
Stroke: (Cup et al, 2003; n=26; mean age=68 (15); gender; 11 males, 15 females; time post stroke: 24 patients 6 months post stroke, 2 patients 2 months post stroke, Stroke) Test retest reliability: interval=8 days
• Spearman’s rho correlation coefficient for the performance scores=0.89 (p <0.001) and for the satisfaction scores 0.88 (p < 0.001)
Internal Consistency Cerebral Palsy: (Cusik et al, 2007; n=42; mean age=3.9 years; time post diagnosis unknown; GMPM Level 1, Spastic Hemiplegic Cerebral Palsy)
• Using an adapted form of the COPM competed by a parent proxy (deleted the categories of ‘‘paid/unpaid work’’ and ‘‘household management”), internal consistency reliability was found to be acceptable for Performance (Cronbach’s α=0.73) and Satisfaction (Cronbach’s α=0.83).
Stroke: (Cup et al, 2003, Acute Stroke) 26 participants were asked to identify problems over the course of two interviews. During the initial COPM interview 115 problems were identified. In the second interview 112 problems were identified. 64 problems (56%) mentioned in the first interview were also mentioned in the second interview.
Criterion Validity (Predictive/Concurrent) Arthritis:
(Ripat et al, 2001; n=13, stage 2 or stage 3 RA, Rheumatoid Arthritis) • Total Perfomance Scores on the COPM were not significantly
correlated to total scores on the disability index of the Health Assessment Questionnaire (HAQ)
o r =-0.37*, p=0.22
• 36 out of 50 activities identified on the COPM exactly matched activities included in the disability dimension of the HAQ. Individual performance scores on the COPM were significantly related to scores on the matched HAQ components and matched HAQ activities
o r=-0.52*, p<0.01
For more information visit www.neuropt.org or email [email protected]
o r=-0.67*, p<0.01
*Pearson product-moment correlation coefficient
Community Dwelling Disabled Individuals: (McColl et al, 2000; n=61; disability unspecified, Community Dwelling Disabled Individuals)
• Participants identified 481 problems on the COPM and the Perceived Problem Check List (PPCL)
• 54 similar problems were identified on both measures: o 24% of PPCL problems were similar to COPM o 21% of COPM problems were similar to PPCL
• Problems mentioned on both measures include: o Transportation and errands o Dressing o Toileting o Climbing stairs o Cooking o Cleaning o Socializing
(Martini et al 2014) Adults post stroke (6 community dwelling,> one year post stroke) and children post stroke (8 children performing below the 15th% on the Movement Assessment Battery for Children) were videotaped and rated twice (separated by two weeks) by 3 different raters (research assistant, Occupational Therapist [OT] and OT student). The objective was to determine responsiveness, inter rater and test retest (2 weeks) reliability for the PQRS (Operational Definitions [OD] and Generic systems-[G]) as well as convergent validity between the PQRS-OD, the PQRS-G and the COPM Performance Scores. In terms of convergent validity there was:
• PreTest • Poor, virtually no convergent validity between PQRS-G or
PQRS-OD with COPM Performance (-0.37 to 0.10) and COPM Satisfaction (-0.23 to -0.07)
• Post test: • Poor to Adequate convergent validity based on multiple
raters for PQRS-G and PQRS-OD and COPM Performance ( 0.20 to 0.53)
• Poor convergent validity for PQRS-G and PQRS-OD and COPM Satisfaction (0.04 to 0.29 )
For more information visit www.neuropt.org or email [email protected]
• Change scores • Poor to Adequate correlations between PQRS-G and PQRS-
OD and COPM Performance (-0.12 to 0.35) and COPM Satisfaction (017-0.58)
• Correlations between change scores on the PQRS and the COPM were higher for research assistant raters (-0.14 to 0.58) and OT student raters (-0.20 to - 0.47) compared to licensed OT’s (-0.12 to -0.21)
(Hill et al, 2014). This study evaluated 49 community dwelling individuals (mean age of 59.67 (14.14), 72 (58.8) months post stroke to determine if there was a correlation between sensory discrimination (Touch-Test, similar to Semmes Weinstein Monofilaments) and valued activities (functional performance on the COMP).
• Good to excellent correlations were found between individuals who
scored high on the COPM (5.9-9.6) and low on the Touch-Test
(X2=9.80 (P<0.05);
• No significant relationships were reported between the COPM scores
below the median (1.2-5.8) and overall hand sensation ((X2=.523;
P=0.97)
• Little to no correlations were reported between touch sensation of
the hand and performance of valued activities for those who scored
low on the COPM
• No significant relationships were reported for subjects scoring above
or below the median for specific hand testing locations and COPM
scores
• Subjects with minimal to moderate sensation impairments did not
report speech or communication as a valued activity
• Subjects with severe impaired sensation did not report exercise as a
valued activity.
Construct Validity (Convergent/Discriminant)
Discriminant Validity: Acquired Brain Injury: (Jenkinson et al, 2007; Community dwelling individuals; n=34 (TBI=21; CVA=11; Others=2) , ABI)
PCRS Discrepancy
HADS Depression
HADS Anxiety
Health and Safety Subtest of
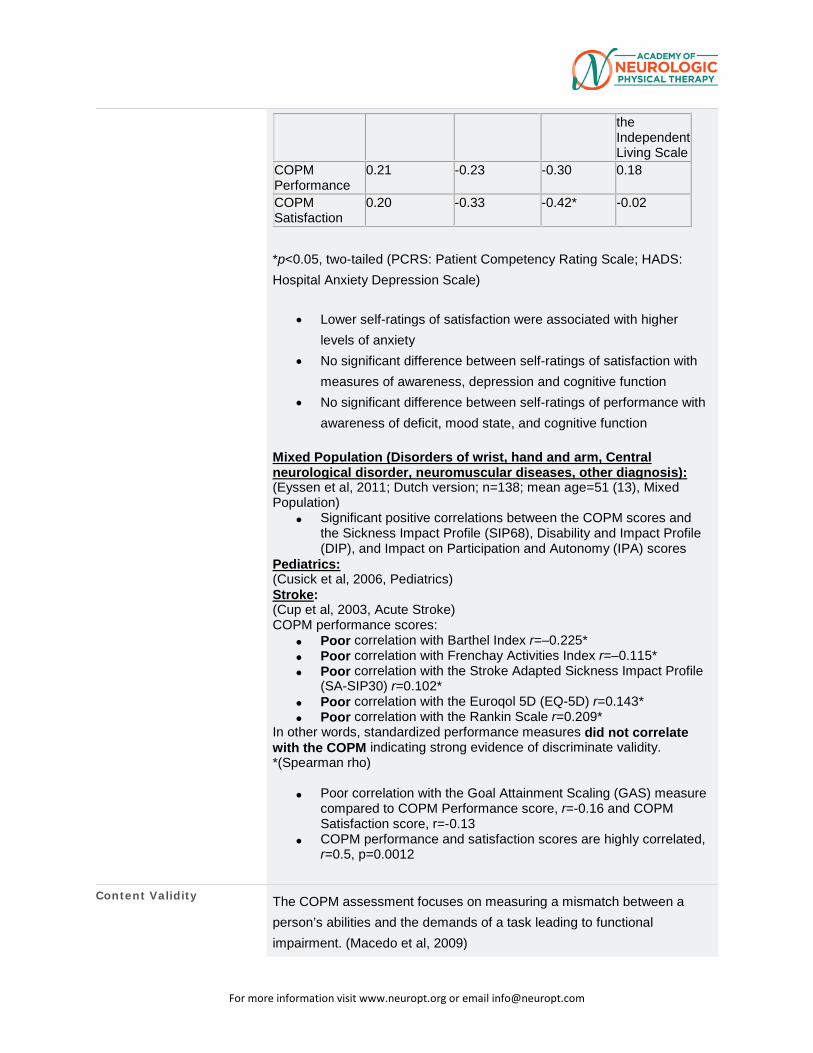
For more information visit www.neuropt.org or email [email protected]
the Independent Living Scale
COPM Performance
0.21 -0.23 -0.30 0.18
COPM Satisfaction
0.20 -0.33 -0.42* -0.02
*p<0.05, two-tailed (PCRS: Patient Competency Rating Scale; HADS: Hospital Anxiety Depression Scale)
• Lower self-ratings of satisfaction were associated with higher levels of anxiety
• No significant difference between self-ratings of satisfaction with measures of awareness, depression and cognitive function
• No significant difference between self-ratings of performance with awareness of deficit, mood state, and cognitive function
Mixed Population (Disorders of wrist, hand and arm, Central neurological disorder, neuromuscular diseases, other diagnosis): (Eyssen et al, 2011; Dutch version; n=138; mean age=51 (13), Mixed Population)
• Significant positive correlations between the COPM scores and the Sickness Impact Profile (SIP68), Disability and Impact Profile (DIP), and Impact on Participation and Autonomy (IPA) scores
Pediatrics: (Cusick et al, 2006, Pediatrics) Stroke: (Cup et al, 2003, Acute Stroke) COPM performance scores:
• Poor correlation with Barthel Index r=–0.225* • Poor correlation with Frenchay Activities Index r=–0.115* • Poor correlation with the Stroke Adapted Sickness Impact Profile
(SA-SIP30) r=0.102* • Poor correlation with the Euroqol 5D (EQ-5D) r=0.143* • Poor correlation with the Rankin Scale r=0.209*
In other words, standardized performance measures did not correlate with the COPM indicating strong evidence of discriminate validity. *(Spearman rho)
• Poor correlation with the Goal Attainment Scaling (GAS) measure compared to COPM Performance score, r=-0.16 and COPM Satisfaction score, r=-0.13
• COPM performance and satisfaction scores are highly correlated, r=0.5, p=0.0012
Content Validity The COPM assessment focuses on measuring a mismatch between a person’s abilities and the demands of a task leading to functional impairment. (Macedo et al, 2009)
For more information visit www.neuropt.org or email [email protected]
Face Validity Not Established
Floor/Ceiling Effects Not Established
Responsiveness Research (Law et al 2004) suggests:
• A change of 2 or more points is clinically significant
• Changes in scores from assessment to re-assessment tend to be meaningful
Acquired Brain Injury: (Phipps et al, 2007; n=155 (TBI=38, CVA=117); Time from admission to discharge (TBI=141.26 (85.10); Right CVA=97.45 (72.99); Left CVA=96.47 (65.97), ABI)
• Significant change in performance ratings and satisfaction ratings from admission to discharge for entire sample and also for each diagnostic group
(Jenkinson et al, 2007; Community dwelling individuals; n=34 (TBI=21; CVA=11; Others=2); total of 10 patients involved in an 8-week intervention group, ABI)
• Significant improvement in COPM performance self-ratings (p=0.018) and satisfaction self-ratings (p=0.013) between the pre- and post-assessment
• Significant improvement in relatives’ ratings of performance between the pre- and post-assessment (p=0.008)
• Improvement for relatives’ ratings of satisfaction between the pre- and post-assessment was not significant (p>0.05)
Arthritis: (Macedo et al, 2009, Rheumatoid Arthritis)
• Means Changes in Satisfaction and Performance were found to be both clinically and statistically significant
Cerebral Palsy: (Cusick et al, 2007, Spastic Hemiplegic Cerebral Palsy)
• The adapted COPM demonstrates an ability to detect change above the published minimum clinically important difference of 2 points
Mixed neurologic sample: (Bodium, 1999; in-patient rehabilitation; n=17; admission to discharge=10 weeks, Mixed Neurologic Sample)
• significant differences in improvement in self-ratings of performance and satisfaction
Mixed neurological, orthopedic and cardiology sample:
For more information visit www.neuropt.org or email [email protected]
(Wressle et al, 2002; n=155 experiment group and 55 in control group within geriatric, stroke and home rehabilitation; median age=80 experiment group and 79 control group; assessment after discharge=2-4 weeks with 88 patients in control group; 30 in control group, Mixed patients)
• Significant differences between groups: more patients in the experiment group perceived that treatment goals were identified, were able to recall the goals, felt that they were active participants in the goal formulation process, and perceived themselves better able to manage after completed rehabilitation compared with patients in the control group
Mixed Population (Disorders of wrist, hand and arm, Central neurological disorder, neuromuscular diseases, other diagnosis): (Eyssen et al, 2011; Dutch version; n=138; mean age=51 (13), Mixed Population)
• Significant differences between assessment and reassessment scores (p<0.001)
• The AUC ranged from 0.79 to 0.85, and the optimal cut-off values for the performance scores and satisfaction scores ranged from 0.9 to 1.9
Neuro Rehabilitation: (Chenq et al, 2002; n=12, 7=cerebrovascular accident, 2=spinal cord injuries, & 3=TBI; mean age 42.5; Taiwanese sample, Neuro Rehabilitation)
• Mean changes in Satisfaction and Performance were found to be both clinically and statistically significant
Pain: (Carpenter et al, 2001; n=87 completed the COPM at baseline, end of program and 3 month post intervention; mean age=44, range=19 to 72 years, Pain)
• Changes in satisfaction and performance scores were found to be statistically and clinically significant
Traumatic Brain Injury: (Trombly et al, 1998; Outpatient therapy services; n=16; gender=7 female and 9 male; mean age=43 (12.6); time since injury=22 (5.4), TBI)
• Performance self-ratings were significantly better (p<0.001), and satisfaction self-ratings were significant as well (p=0.001) after treatment than before (discharge: 4-23 weeks after admission; mean=12.3 weeks)
• No significant difference from discharge to follow up (4-8 weeks after discharge)
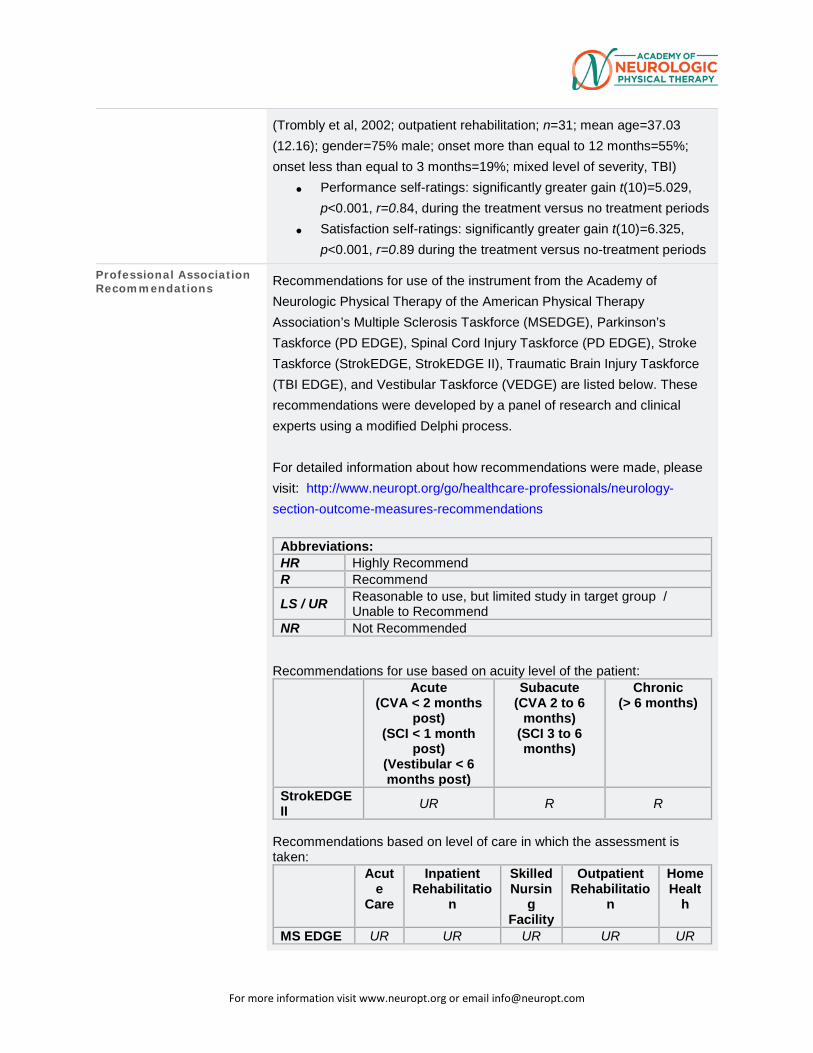
For more information visit www.neuropt.org or email [email protected]
(Trombly et al, 2002; outpatient rehabilitation; n=31; mean age=37.03 (12.16); gender=75% male; onset more than equal to 12 months=55%; onset less than equal to 3 months=19%; mixed level of severity, TBI)
• Performance self-ratings: significantly greater gain t(10)=5.029, p<0.001, r=0.84, during the treatment versus no treatment periods
• Satisfaction self-ratings: significantly greater gain t(10)=6.325, p<0.001, r=0.89 during the treatment versus no-treatment periods
Professional Association Recommendations Recommendations for use of the instrument from the Academy of
Neurologic Physical Therapy of the American Physical Therapy Association’s Multiple Sclerosis Taskforce (MSEDGE), Parkinson’s Taskforce (PD EDGE), Spinal Cord Injury Taskforce (PD EDGE), Stroke Taskforce (StrokEDGE, StrokEDGE II), Traumatic Brain Injury Taskforce (TBI EDGE), and Vestibular Taskforce (VEDGE) are listed below. These recommendations were developed by a panel of research and clinical experts using a modified Delphi process.
For detailed information about how recommendations were made, please visit: http://www.neuropt.org/go/healthcare-professionals/neurology-section-outcome-measures-recommendations
Abbreviations: HR Highly Recommend R Recommend LS / UR Reasonable to use, but limited study in target group /
Unable to Recommend NR Not Recommended
Recommendations for use based on acuity level of the patient: Acute
(CVA < 2 months post)
(SCI < 1 month post)
(Vestibular < 6 months post)
Subacute (CVA 2 to 6
months) (SCI 3 to 6 months)
Chronic (> 6 months)
StrokEDGE II UR R R
Recommendations based on level of care in which the assessment is taken: Acut
e Care
Inpatient Rehabilitatio
n
Skilled Nursin
g Facility
Outpatient Rehabilitatio
n
Home Healt
h
MS EDGE UR UR UR UR UR
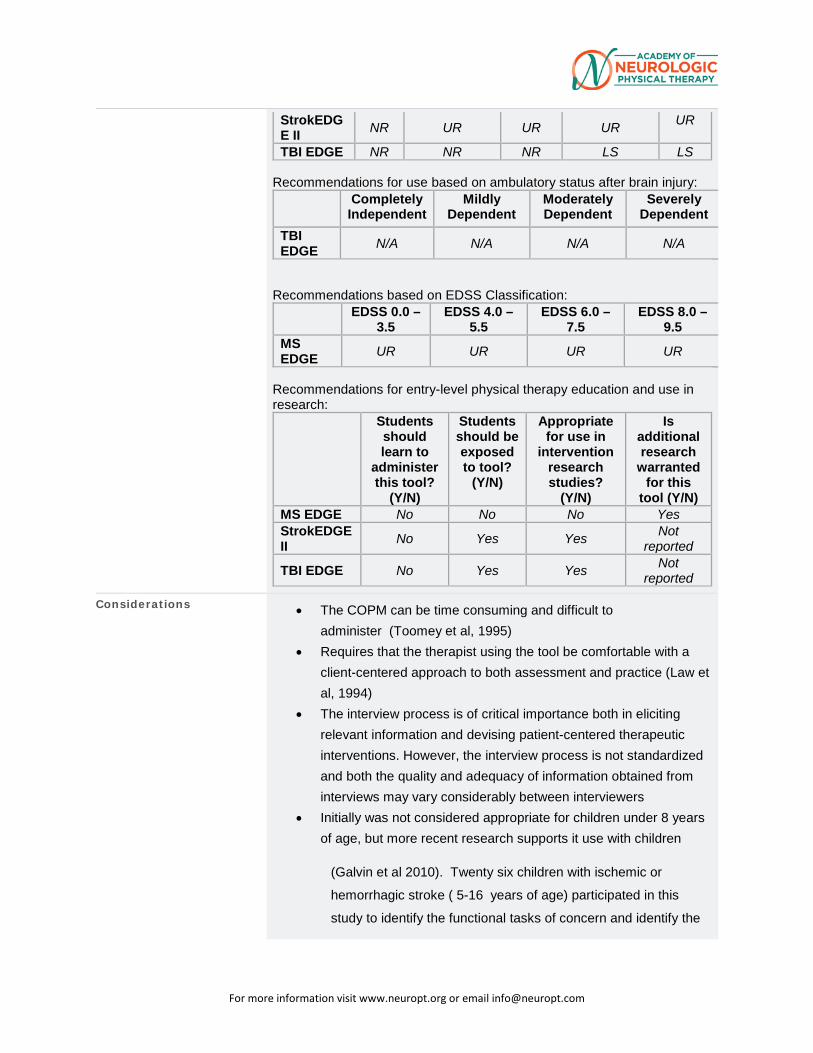
For more information visit www.neuropt.org or email [email protected]
StrokEDGE II NR UR UR UR UR
TBI EDGE NR NR NR LS LS Recommendations for use based on ambulatory status after brain injury: Completely
Independent Mildly
Dependent Moderately Dependent
Severely Dependent
TBI EDGE N/A N/A N/A N/A
Recommendations based on EDSS Classification: EDSS 0.0 –
3.5 EDSS 4.0 –
5.5 EDSS 6.0 –
7.5 EDSS 8.0 –
9.5 MS EDGE UR UR UR UR
Recommendations for entry-level physical therapy education and use in research: Students
should learn to
administer this tool?
(Y/N)
Students should be exposed to tool?
(Y/N)
Appropriate for use in
intervention research studies?
(Y/N)
Is additional research
warranted for this
tool (Y/N) MS EDGE No No No Yes StrokEDGE II No Yes Yes Not
reported TBI EDGE No Yes Yes Not
reported
Considerations • The COPM can be time consuming and difficult to administer (Toomey et al, 1995)
• Requires that the therapist using the tool be comfortable with a client-centered approach to both assessment and practice (Law et al, 1994)
• The interview process is of critical importance both in eliciting relevant information and devising patient-centered therapeutic interventions. However, the interview process is not standardized and both the quality and adequacy of information obtained from interviews may vary considerably between interviewers
• Initially was not considered appropriate for children under 8 years of age, but more recent research supports it use with children
(Galvin et al 2010). Twenty six children with ischemic or
hemorrhagic stroke ( 5-16 years of age) participated in this
study to identify the functional tasks of concern and identify the
For more information visit www.neuropt.org or email [email protected]
most valued functional activities as measured by the COPM
when completed by the children and by the parents). The
satisfaction and performance parts of the COPM were not
administered. A total of 103 goals were identified.
• Preschool aged children had the most concerns about self
care (45%) and productivity (36% ) with less concern about
leisure (19%)
• School aged children had the most concerns about self
care (46%) and leisure activities (36%)
• Parents had concerns about their children’s self care
(47%), productivity (27%) and leisure activities (26%)
Do you see an error or have a suggestion for this instrument summary? Please e-mail us!
Bibliography Bodiam, C. (1999). "The use of the Canadian Occupational Performance Measure for the assessment of outcome on a neurorehabilitation unit." The British Journal of Occupational Therapy 62(3): 123-126.
Bowie, C., Shackleton, T., et al. (1999). "Exploring the responsiveness of the COPM in an outpatient rehabilitation program." Unpublished manuscript.
Carpenter, L., Baker, G. A., et al. (2001). "The use of the Canadian occupational performance measure as an outcome of a pain management program." Can J Occup Ther 68(1): 16-22. Find it on PubMed
Chenq, Y. H., Rodger, S., et al. (2002). "Experiences with the COPM and client-centred practice in adult neurorehabilitation in Taiwan." Occup Ther Int 9(3): 167-184. Find it on PubMed
Cup, E. H., Scholte op Reimer, W. J., et al. (2003). "Reliability and validity of the Canadian Occupational Performance Measure in stroke patients." Clin Rehabil 17(4): 402-409. Find it on PubMed
For more information visit www.neuropt.org or email [email protected]
Cusick, A., Lannin, N. A., et al. (2007). "Adapting the Canadian Occupational Performance Measure for use in a paediatric clinical trial." Disabil Rehabil 29(10): 761-766. Find it on PubMed
Cusick, A., McIntyre, S., et al. (2006). "A comparison of goal attainment scaling and the Canadian Occupational Performance Measure for paediatric rehabilitation research." Pediatr Rehabil 9(2): 149-157. Find it on PubMed
Dedding, C., Cardol, M., et al. (2004). "Validity of the Canadian Occupational Performance Measure: a client-centred outcome measurement." Clin Rehabil 18(6): 660-667. Find it on PubMed
Eyssen, I. C., Beelen, A., et al. (2005). "The reproducibility of the Canadian Occupational Performance Measure." Clin Rehabil 19(8): 888-894. Find it on PubMed
Galvin J, Randall M, Hewish S, Rice J, MacKay MT. (2010) Family-centred outcome measurement following paediatric stroke. Australian occupational therapy journal. 57(3):152-8. Hill VA, Fisher T, Schmid AA, Crabtree J, Page SJ. (2014) Relationship between touch sensation of the affected hand and performance of valued activities in individuals with chronic stroke. Topics in stroke rehabilitation. 21(4):339-46.
Jenkinson, N., Ownsworth, T., et al. (2007). "Utility of the Canadian Occupational Performance Measure in community-based brain injury rehabilitation." Brain Inj 21(12): 1283-1294. Find it on PubMed
Kjeken, I., Dagfinrud, H., et al. (2005). "Activity limitations and participation restrictions in women with hand osteoarthritis: patients' descriptions and associations between dimensions of functioning." Ann Rheum Dis 64(11): 1633-1638. Find it on PubMed
Kjeken, I., Dagfinrud, H., et al. (2005). "Reliability of the Canadian Occupational Performance Measure in patients with ankylosing spondylitis." J Rheumatol 32(8): 1503-1509. Find it on PubMed
Law, M., Baptiste, S., et al. (2004, 2005). "COPM Questions and Answers." from http://www.caot.ca/copm/questions.html. MacDermid, J. C., Grewal, R., et al. (2009). "Using an evidence-based approach to
For more information visit www.neuropt.org or email [email protected]
measure outcomes in clinical practice." Hand Clin 25(1): 97-111, vii. Find it on PubMed
Macedo, A. M., Oakley, S. P., et al. (2009). "Functional and work outcomes improve in patients with rheumatoid arthritis who receive targeted, comprehensive occupational therapy." Arthritis Rheum 61(11): 1522-1530. Find it on PubMed
Martini R, Rios J, Polatajko H, Wolf T, McEwen S. (2015) The performance quality rating scale (PQRS): reliability, convergent validity, and internal responsiveness for two scoring systems. Disability and rehabilitation. 37(3):231-8. Find PubMed
McColl, M. A., Paterson, M., et al. (2000). "Validity and community utility of the Canadian Occupational Performance Measure." Can J Occup Ther 67(1): 22-30. Find it on PubMed
Phipps, S. and Richardson, P. (2007). "Occupational therapy outcomes for clients with traumatic brain injury and stroke using the Canadian Occupational Performance Measure." The American journal of occupational therapy 61(3): 328-334.
Ripat, J., Etcheverry, E., et al. (2001). "A comparison of the Canadian Occupational Performance Measure and the Health Assessment Questionnaire." Can J Occup Ther 68(4): 247-253. Find it on PubMed
Sewell, L. and Singh, S. (2001). "The Canadian Occupational Performance Measure: is it a Reliable Measure in Clients with Chronic Obstructive Pulmonary Disease?" The British Journal of Occupational Therapy 64(6): 305-310.
Toomey, M., Nicholson, D., et al. (1995). "The clinical utility of the Canadian Occupational Performance Measure." Can J Occup Ther 62(5): 242-249. Find it on PubMed
Trombly, C. A., Radomski, M. V., et al. (1998). "Achievement of self-identified goals by adults with traumatic brain injury: Phase I." The American Journal of Occupational Therapy 52(10): 810-818.
For more information visit www.neuropt.org or email [email protected]
Trombly, C. A., Radomski, M. V., et al. (2002). "Occupational therapy and achievement of self-identified goals by adults with acquired brain injury: phase II." Am J Occup Ther 56(5): 489-498. Find it on PubMed
Wressle, E., Eeg-Olofsson, A. M., et al. (2002). "Improved client participation in the rehabilitation process using a client-centred goal formulation structure." Journal of Rehabilitation Medicine 34(1): 5-11.
Year published 1991
Instrument in PDF Format Yes
Approval Status Approved
For more information visit www.neuropt.org or email [email protected]
7. REHAB MEASURES: CHEDOKE ARM AND HAND ACTIVITY INVENTORY
Link to instrument Chedoke Arm and Hand Activity Inventory - 13
Title of Assessment Chedoke Arm and Hand Activity Inventory - 13
Acronym CAHAI – 13
Instrument Reviewer(s) Initially reviewed by Dorian Rose, PhD, PT and the Stroke Edge Taskforce of the Academy of Neurologic Physical Therapy - a component of APTA, Updated by Maggie Bland PT,DPT,NCS and Nancy Byl, PT, MPH, PhD, FAPTA and the StrokEdge II Task Force of the Academy of Neurologic Physical Therapy - a component of APTA in 2016.
Summary Date 2/29/2016
Purpose The purpose of this measure is to evaluate the functional ability of the paretic arm and hand to perform tasks.
Description The CAHAI is a performance test using functional items. It is not designed to measure the client’s ability to complete the task using only their unaffected hand, but rather to encourage bilateral function.
The original test consists of 13 functional tasks to complete (open jar of coffee, call 911, draw a line with a ruler, put toothpaste on toothbrush, cut medium consistency putty, pour a glass of water, wring out washcloth, clean pair of eyeglasses, zip up a zipper, do up 5 buttons, dry back with towel, place container on table, carry bag upstairs). Additional shorter versions exist as well: CAHAI-7, CAHAI-8, and CAHAI-9.
Area of Assessment Activities of Daily Living; Upper Extremity Function
Body Part Upper Extremity
ICF Domain Activity
Domain ADL; Motor
Assessment Type Performance Measure
Length of Test 06 to 30 Minutes
For more information visit www.neuropt.org or email [email protected]
Time to Administer 30 minutes.
Number of Items 13
Equipment Required • Jar of coffee
• Phone
• Ruler and pen
• Toothpaste and toothbrush
• Knife
• Fork
• Putty
• Glass of water
• Wet washcloth
• Eyeglasses
• Jacket and zipper
• Shirt with 5 buttons
• Towel
• Rubbermaid 38 liter container (50x37x27cm) with 10 lb. weight
• Plastic grocery bag with 4 lb. weight
Training Required Read the administration and scoring manual
Type of training required reading an article/manual
Cost Free
Actual Cost $0.00
Age Range Not specified
Administration Mode Paper/Pencil
Diagnosis Movement Disorders
For more information visit www.neuropt.org or email [email protected]
Populations Tested Upper Extremity Paralysis
Standard Error of Measurement (SEM)
Not Established.
Minimal Detectable Change (MDC)
Upper Extremity Paralysis
(Barreca et al, 2005)
• MDC (90) = 6.3 points
Minimally Clinically Important Difference (MCID)
Upper Extremity Paralysis
(Siven et al, 2011) Systematic Review
• MCID (chronic) = 6.3 points
Cut-Off Scores Not Established.
Normative Data Not Established.
Test-retest Reliability Upper Extremity Paralysis:
(Barreca et al, 2005)
• Excellent reliability (ICC = 0.96)
Interrater/Intrarater Reliability
Upper Extremity Paralysis:
(Barreca et al, 2005)
• Excellent reliability (ICC = 0.98)
Internal Consistency Upper Extremity Paralysis:
(Barreca et al, 2006) Comparison of the CAHAI-13 to other measures in people 20-108 days post-stroke
("Psychometric properties: Reliability")
• Excellent reliability (ICC = 0.98)
• Excellent Internal consistency: r=0.98
Criterion Validity (Predictive/Concurrent)
Not Established.
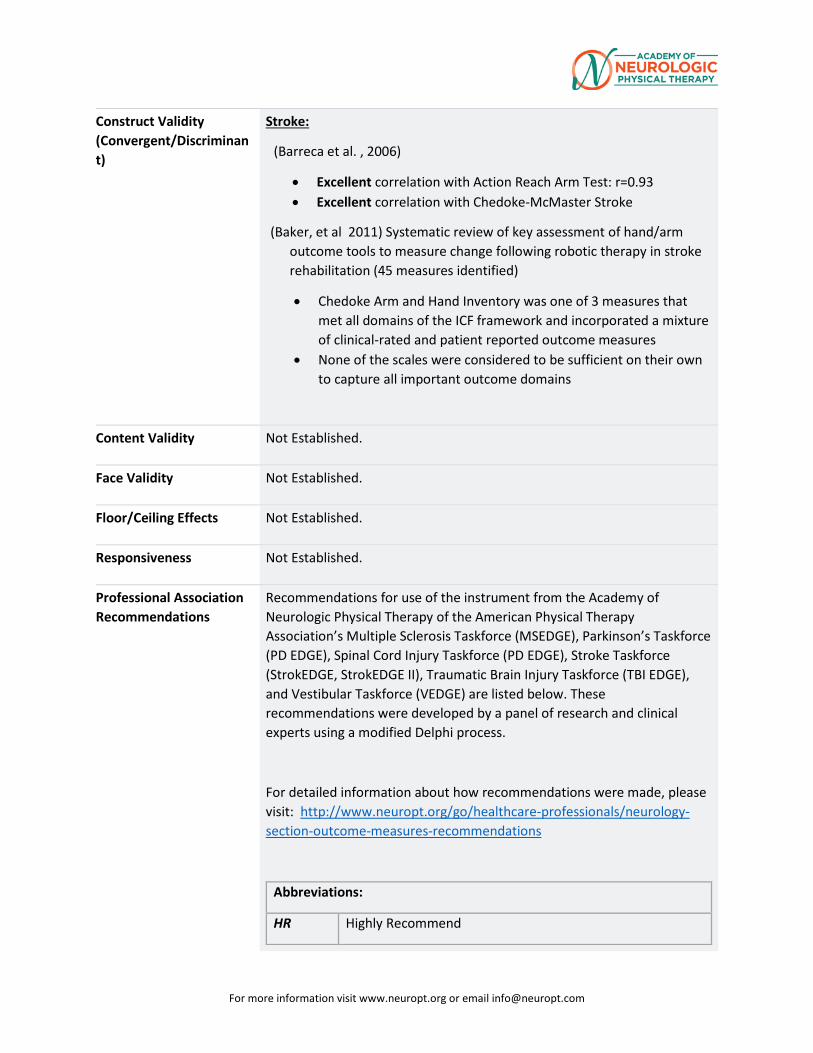
For more information visit www.neuropt.org or email [email protected]
Construct Validity (Convergent/Discriminant)
Stroke:
(Barreca et al. , 2006)
• Excellent correlation with Action Reach Arm Test: r=0.93 • Excellent correlation with Chedoke-McMaster Stroke
(Baker, et al 2011) Systematic review of key assessment of hand/arm outcome tools to measure change following robotic therapy in stroke rehabilitation (45 measures identified)
• Chedoke Arm and Hand Inventory was one of 3 measures that met all domains of the ICF framework and incorporated a mixture of clinical-rated and patient reported outcome measures
• None of the scales were considered to be sufficient on their own to capture all important outcome domains
Content Validity Not Established.
Face Validity Not Established.
Floor/Ceiling Effects Not Established.
Responsiveness Not Established.
Professional Association Recommendations
Recommendations for use of the instrument from the Academy of Neurologic Physical Therapy of the American Physical Therapy Association’s Multiple Sclerosis Taskforce (MSEDGE), Parkinson’s Taskforce (PD EDGE), Spinal Cord Injury Taskforce (PD EDGE), Stroke Taskforce (StrokEDGE, StrokEDGE II), Traumatic Brain Injury Taskforce (TBI EDGE), and Vestibular Taskforce (VEDGE) are listed below. These recommendations were developed by a panel of research and clinical experts using a modified Delphi process.
For detailed information about how recommendations were made, please visit: http://www.neuropt.org/go/healthcare-professionals/neurology-section-outcome-measures-recommendations
Abbreviations:
HR Highly Recommend
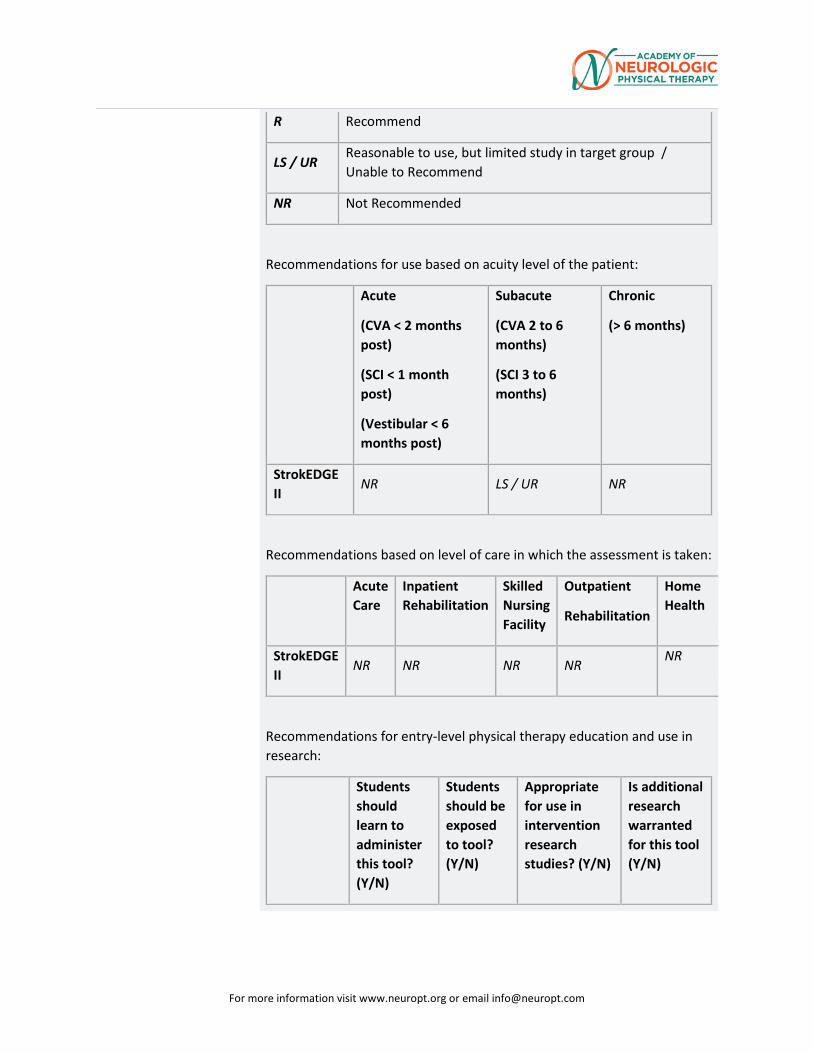
For more information visit www.neuropt.org or email [email protected]
R Recommend
LS / UR Reasonable to use, but limited study in target group / Unable to Recommend
NR Not Recommended
Recommendations for use based on acuity level of the patient:
Acute
(CVA < 2 months post)
(SCI < 1 month post)
(Vestibular < 6 months post)
Subacute
(CVA 2 to 6 months)
(SCI 3 to 6 months)
Chronic
(> 6 months)
StrokEDGE II
NR LS / UR NR
Recommendations based on level of care in which the assessment is taken:
Acute Care
Inpatient Rehabilitation
Skilled Nursing Facility
Outpatient
Rehabilitation
Home Health
StrokEDGE II
NR NR NR NR NR
Recommendations for entry-level physical therapy education and use in research:
Students should learn to administer this tool? (Y/N)
Students should be exposed to tool? (Y/N)
Appropriate for use in intervention research studies? (Y/N)
Is additional research warranted for this tool (Y/N)
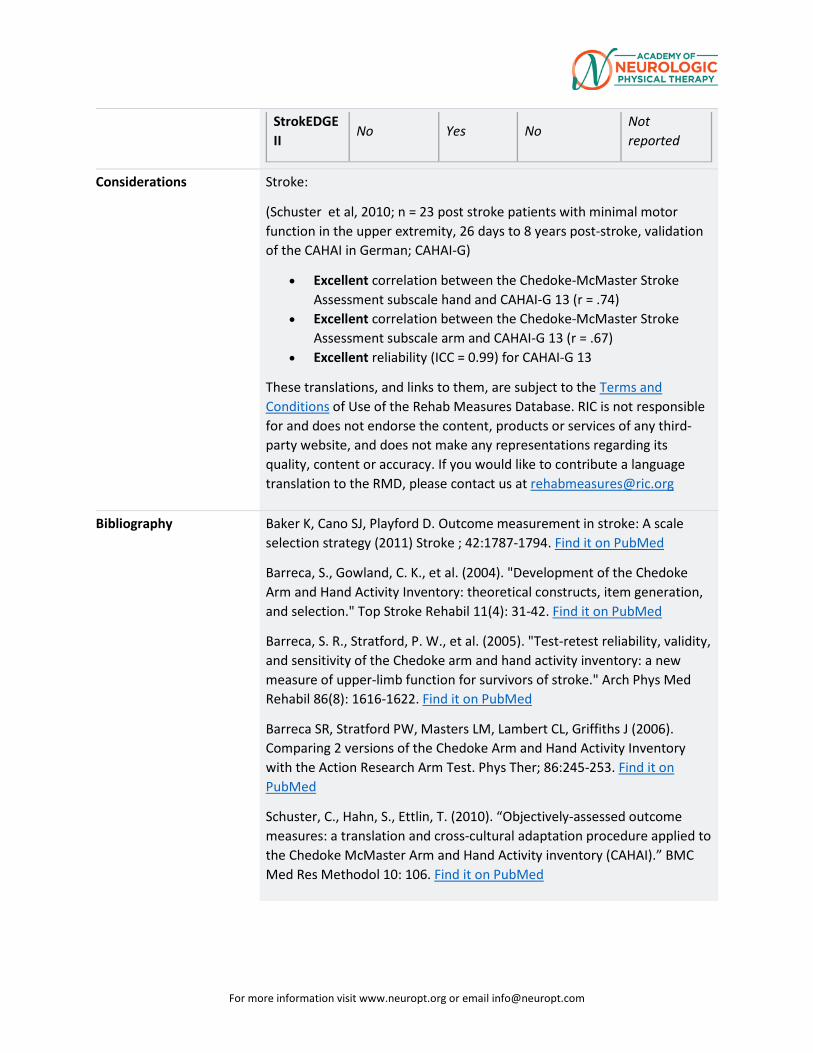
For more information visit www.neuropt.org or email [email protected]
StrokEDGE II
No Yes No Not reported
Considerations Stroke:
(Schuster et al, 2010; n = 23 post stroke patients with minimal motor function in the upper extremity, 26 days to 8 years post-stroke, validation of the CAHAI in German; CAHAI-G)
• Excellent correlation between the Chedoke-McMaster Stroke Assessment subscale hand and CAHAI-G 13 (r = .74)
• Excellent correlation between the Chedoke-McMaster Stroke Assessment subscale arm and CAHAI-G 13 (r = .67)
• Excellent reliability (ICC = 0.99) for CAHAI-G 13
These translations, and links to them, are subject to the Terms and Conditions of Use of the Rehab Measures Database. RIC is not responsible for and does not endorse the content, products or services of any third-party website, and does not make any representations regarding its quality, content or accuracy. If you would like to contribute a language translation to the RMD, please contact us at [email protected]
Bibliography Baker K, Cano SJ, Playford D. Outcome measurement in stroke: A scale selection strategy (2011) Stroke ; 42:1787-1794. Find it on PubMed
Barreca, S., Gowland, C. K., et al. (2004). "Development of the Chedoke Arm and Hand Activity Inventory: theoretical constructs, item generation, and selection." Top Stroke Rehabil 11(4): 31-42. Find it on PubMed
Barreca, S. R., Stratford, P. W., et al. (2005). "Test-retest reliability, validity, and sensitivity of the Chedoke arm and hand activity inventory: a new measure of upper-limb function for survivors of stroke." Arch Phys Med Rehabil 86(8): 1616-1622. Find it on PubMed
Barreca SR, Stratford PW, Masters LM, Lambert CL, Griffiths J (2006). Comparing 2 versions of the Chedoke Arm and Hand Activity Inventory with the Action Research Arm Test. Phys Ther; 86:245-253. Find it on PubMed
Schuster, C., Hahn, S., Ettlin, T. (2010). “Objectively-assessed outcome measures: a translation and cross-cultural adaptation procedure applied to the Chedoke McMaster Arm and Hand Activity inventory (CAHAI).” BMC Med Res Methodol 10: 106. Find it on PubMed
For more information visit www.neuropt.org or email [email protected]
Sivan, M., O’Connor, R.J., et al. (2011). “Systematic review of outcome measures used in the evaluation of robot-assisted upper limb exercise in stroke.” J Rehabil Med 43: 181-189. Find it on PubMed
Year published 2004
Instrument in PDF Format
Yes
Approval Status Approved
For more information visit www.neuropt.org or email [email protected]
8. REHAB MEASURES: CHEDOKE MCMASTER STROKE ASSESSMENT MEASURE
Link to instrument Chedoke-McMaster Stroke Assessment Measure Manual and Scoring Form (other languages available below)
Title of Assessment Chedoke-McMaster Stroke Assessment Measure
Acronym CMSA
Instrument Reviewer(s) Reviewed by Michele Sulwer, PT, DPT, NCS and Genevieve Pinto-Zipp, PT, EdD of the StrokEDGE II, Neurology Section, APTA in 3/2016
Summary Date March 2016
Purpose Assesses physical impairment and disability in clients with stroke and other neurological impairment
Description The CMSA is composed of two inventories:
1. Impairment Inventory: Used to determine the presence and severity of common physical impairments. It has six dimensions:
1) Recovery stage of the arm 2) Hand 3) Leg 4) Foot 5) Postural control 6) Shoulder pain
Each dimension is measured on a 7-point scale, each point corresponds to seven stages of motor recovery. The 7-point scale for shoulder pain is based on pain severity.
2. Activity Inventory measures clinically important changes in the client's functional ability. This Activity Inventory is made up of a gross motor function and walking subscale.
• The Gross Motor Function index consists of the 10 following items:
1. Supine to side lying on strong side
2. Supine to side lying on weak side
3. Side lying to long sitting through strong side
4. Side lying to sitting on side of the bed through strong side
For more information visit www.neuropt.org or email [email protected]
5. Side lying to sitting on side of the bed through weak side
6. Standing
7. Transfer to and from bed toward strong side
8. Transfer to and from bed toward weak side
9. Transfer up and down from floor to chair
10. Transfer up and down from floor and standing.
• The Walking Index consists of the 5 following items:
1. Walking indoors
2. Walking outdoors, over rough ground, ramps, and curbs
3. Walking outdoors several blocks
4. Stairs
5. Age and sex appropriate walking distance in meters for 2 minutes.
• Impairment Inventory is scored on a 7-point scale, where:
o 1 = Flaccid paralysis
o 2 = Spasticity is present and felt as a resistance to passive movement
o 3 = Marked spasticity but voluntary movement present within synergistic patterns
o 4 = Spasticity decreases
o 5 = Spasticity wanes but is evident with rapid movement at the extremes of range
o 6 = Coordination and patterns of movement are near normal
o 7 = Normal movement.
• The 7-point scale corresponds to seven stages of motor recovery. The 7-point scale for shoulder pain is based on pain severity.
• The minimum score for the Impairment Inventory is 6 and the maximum score is 42 (Gowland et al, 1993).
For more information visit www.neuropt.org or email [email protected]
• The Activity Inventory is also scored on a 7-point scale, based on the amount of assistance the individual with stroke requires. It is categorized by:
o The need for assistance from another person
o The need for equipment, or
o The need for extra time to accomplish a task.
• For the Activity Inventory, the scoring key from the Functional Independence Measure is used, where:
o 1 = The client needs total assistance
o 2 = Maximal assistance
o 3 = Moderate assistance
o 4 = Minimal assistance
o 5 = Clients needs supervision
o 6 = Client is modified independent (needs assistance from devices)
o 7 = Client is timely and safely independent.
• The maximum score is 100, where higher scores reflect normal function (Finch et al, 2002; Gowland et al, 1993).
• The maximum score for the gross motor function index is 70
• The maximum score for the walking index is 30 (Gowland et al, 1993).
• A 2-point bonus should be assigned for those who walk appropriate distances in meters based on norms for the patient's age and sex, on item 15 (the 2-Minute Walk Test) (Huijbregts at al, 2000)
Area of Assessment Functional Mobility
Body Part Not Applicable
ICF Domain Body Function; Activity
Domain Motor

For more information visit www.neuropt.org or email [email protected]
Assessment Type Observer
Length of Test 31 to 60 Minutes
Time to Administer 45-60 minutes
Number of Items Not applicable
Equipment Required • An adjustable table
• Chair with armrests
• Floor mat
• Pillows
• A pitcher with water
• A measuring cup
• A ball 2.5 inches in diameter
• A footstool
• A 2m line marked on the floor
• Stopwatch
Training Required The administrative guidelines can be used to learn how to administer the test. However, a training workshop is recommended to increase confidence in the ability to administer and score the measure accurately.
A training workshop is also recommended if the measure is intended to be used to collect data for research purposes.
Further information about training can be found at the instrument's website.
Type of training required Reading an Article/Manual
Cost Free
Actual Cost Free
For more information visit www.neuropt.org or email [email protected]
Age Range Adult: 18-64 years; Elderly adult: 65+
Administration Mode Paper/Pencil
Diagnosis Stroke
Populations Tested • Stroke
• Brain Injury
• Other Neurological Disorders
Standard Error of Measurement (SEM)
Not Established
Minimal Detectable Change (MDC)
Not Established
Minimally Clinically Important Difference (MCID)
Acute Stroke: (Gowland et al 1993; n = 32; mean age = 64; mean time since stroke onset = 9 months)
• MCID = 8 points (total CMSA via stroke patients) and 7 points (total CMSA via caregivers of stroke patients).
Cut-Off Scores > 9 on the leg and postural control scores indicates that the individual is able to ambulate independently. (Stevenson, 1999)
Normative Data Not Established
Test-retest Reliability Acute Stroke: (Gowland et al, 1993)
• Excellent test-retest reliability, Disability Inventory (ICC = 0.98)
Interrater/Intrarater Reliability
Acute Stroke: (Gowland et al, 1993)
• Excellent inter-rater reliability, Impairment inventory ICC = 0.97
• Excellent inter-rater reliability, Disability inventory ICC = 0.99
• Excellent intra-rater reliability, Impairment inventory ICC = 0.98
Internal Consistency Acute Stroke: (Gowland et al, 1993)
• Excellent internal consistency, Total scale ICC = 0.98
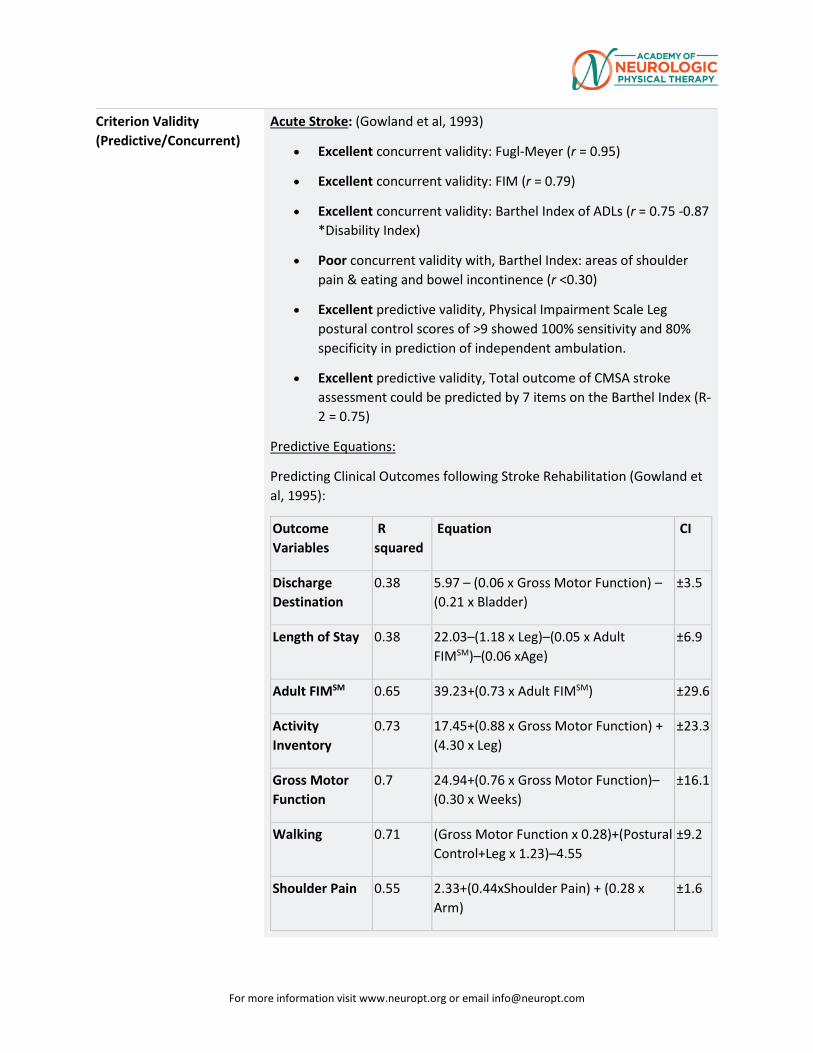
For more information visit www.neuropt.org or email [email protected]
Criterion Validity (Predictive/Concurrent)
Acute Stroke: (Gowland et al, 1993)
• Excellent concurrent validity: Fugl-Meyer (r = 0.95)
• Excellent concurrent validity: FIM (r = 0.79)
• Excellent concurrent validity: Barthel Index of ADLs (r = 0.75 -0.87 *Disability Index)
• Poor concurrent validity with, Barthel Index: areas of shoulder pain & eating and bowel incontinence (r <0.30)
• Excellent predictive validity, Physical Impairment Scale Leg postural control scores of >9 showed 100% sensitivity and 80% specificity in prediction of independent ambulation.
• Excellent predictive validity, Total outcome of CMSA stroke assessment could be predicted by 7 items on the Barthel Index (R-2 = 0.75)
Predictive Equations:
Predicting Clinical Outcomes following Stroke Rehabilitation (Gowland et al, 1995):
Outcome Variables
R squared
Equation CI
Discharge Destination
0.38 5.97 – (0.06 x Gross Motor Function) – (0.21 x Bladder)
±3.5
Length of Stay 0.38 22.03–(1.18 x Leg)–(0.05 x Adult FIMSM)–(0.06 xAge)
±6.9
Adult FIMSM 0.65 39.23+(0.73 x Adult FIMSM) ±29.6
Activity Inventory
0.73 17.45+(0.88 x Gross Motor Function) + (4.30 x Leg)
±23.3
Gross Motor Function
0.7 24.94+(0.76 x Gross Motor Function)–(0.30 x Weeks)
±16.1
Walking 0.71 (Gross Motor Function x 0.28)+(Postural Control+Leg x 1.23)–4.55
±9.2
Shoulder Pain 0.55 2.33+(0.44xShoulder Pain) + (0.28 x Arm)
±1.6
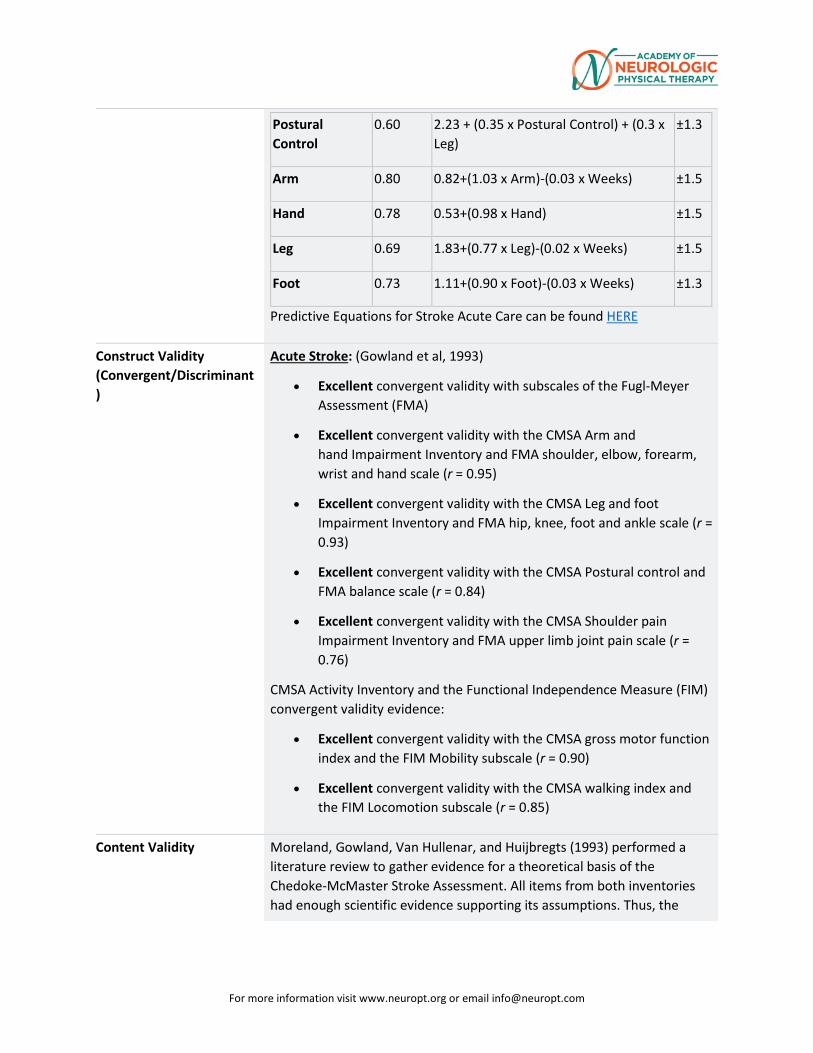
For more information visit www.neuropt.org or email [email protected]
Postural Control
0.60 2.23 + (0.35 x Postural Control) + (0.3 x Leg)
±1.3
Arm 0.80 0.82+(1.03 x Arm)-(0.03 x Weeks) ±1.5
Hand 0.78 0.53+(0.98 x Hand) ±1.5
Leg 0.69 1.83+(0.77 x Leg)-(0.02 x Weeks) ±1.5
Foot 0.73 1.11+(0.90 x Foot)-(0.03 x Weeks) ±1.3
Predictive Equations for Stroke Acute Care can be found HERE
Construct Validity (Convergent/Discriminant)
Acute Stroke: (Gowland et al, 1993)
• Excellent convergent validity with subscales of the Fugl-Meyer Assessment (FMA)
• Excellent convergent validity with the CMSA Arm and hand Impairment Inventory and FMA shoulder, elbow, forearm, wrist and hand scale (r = 0.95)
• Excellent convergent validity with the CMSA Leg and foot Impairment Inventory and FMA hip, knee, foot and ankle scale (r = 0.93)
• Excellent convergent validity with the CMSA Postural control and FMA balance scale (r = 0.84)
• Excellent convergent validity with the CMSA Shoulder pain Impairment Inventory and FMA upper limb joint pain scale (r = 0.76)
CMSA Activity Inventory and the Functional Independence Measure (FIM) convergent validity evidence:
• Excellent convergent validity with the CMSA gross motor function index and the FIM Mobility subscale (r = 0.90)
• Excellent convergent validity with the CMSA walking index and the FIM Locomotion subscale (r = 0.85)
Content Validity Moreland, Gowland, Van Hullenar, and Huijbregts (1993) performed a literature review to gather evidence for a theoretical basis of the Chedoke-McMaster Stroke Assessment. All items from both inventories had enough scientific evidence supporting its assumptions. Thus, the
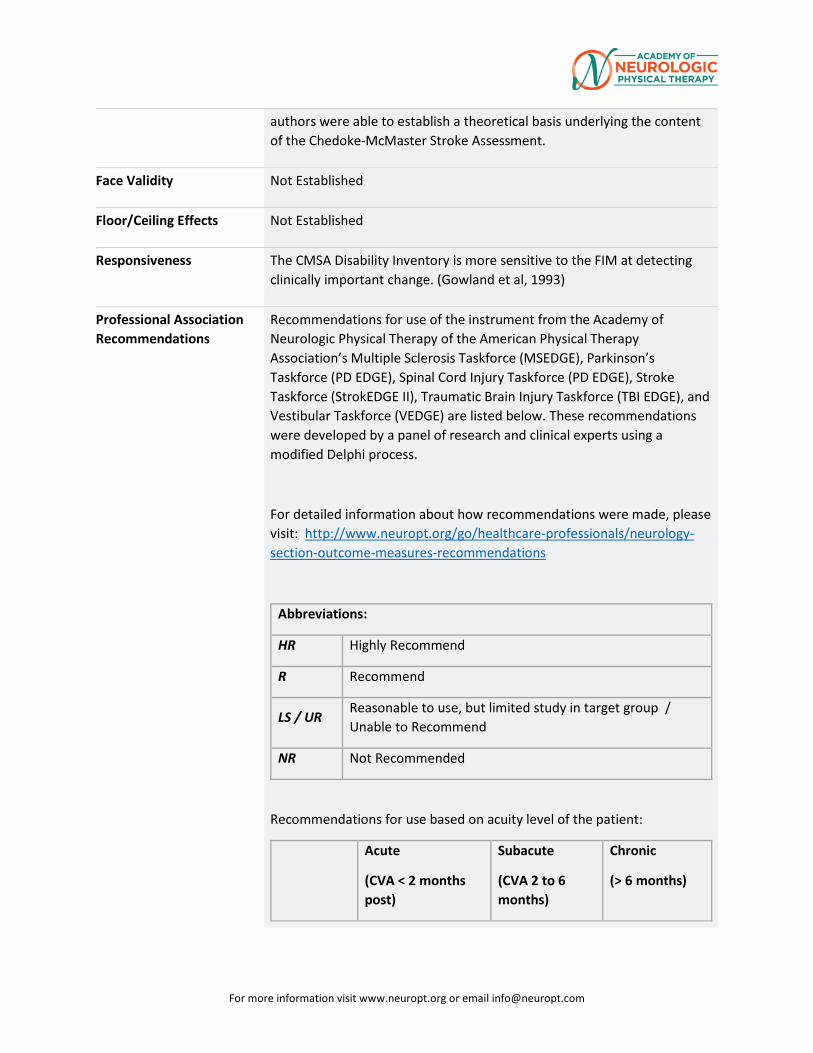
For more information visit www.neuropt.org or email [email protected]
authors were able to establish a theoretical basis underlying the content of the Chedoke-McMaster Stroke Assessment.
Face Validity Not Established
Floor/Ceiling Effects Not Established
Responsiveness The CMSA Disability Inventory is more sensitive to the FIM at detecting clinically important change. (Gowland et al, 1993)
Professional Association Recommendations
Recommendations for use of the instrument from the Academy of Neurologic Physical Therapy of the American Physical Therapy Association’s Multiple Sclerosis Taskforce (MSEDGE), Parkinson’s Taskforce (PD EDGE), Spinal Cord Injury Taskforce (PD EDGE), Stroke Taskforce (StrokEDGE II), Traumatic Brain Injury Taskforce (TBI EDGE), and Vestibular Taskforce (VEDGE) are listed below. These recommendations were developed by a panel of research and clinical experts using a modified Delphi process.
For detailed information about how recommendations were made, please visit: http://www.neuropt.org/go/healthcare-professionals/neurology-section-outcome-measures-recommendations
Abbreviations:
HR Highly Recommend
R Recommend
LS / UR Reasonable to use, but limited study in target group / Unable to Recommend
NR Not Recommended
Recommendations for use based on acuity level of the patient:
Acute
(CVA < 2 months post)
Subacute
(CVA 2 to 6 months)
Chronic
(> 6 months)
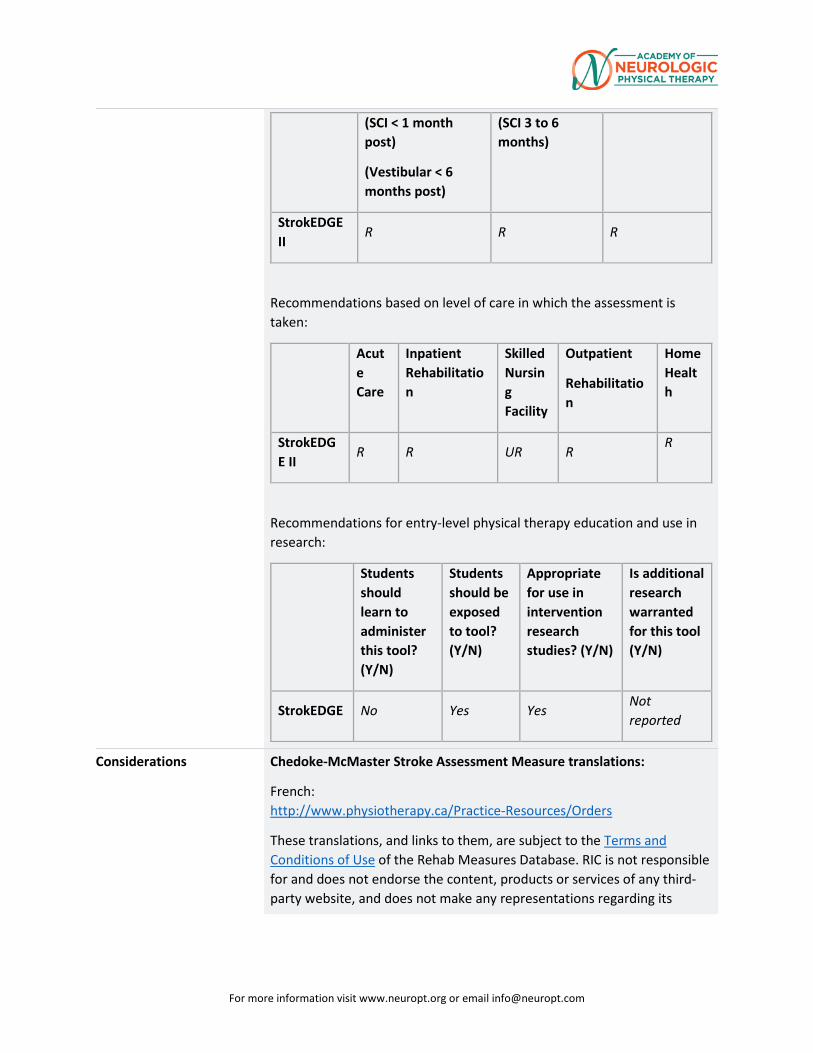
For more information visit www.neuropt.org or email [email protected]
(SCI < 1 month post)
(Vestibular < 6 months post)
(SCI 3 to 6 months)
StrokEDGE II
R R R
Recommendations based on level of care in which the assessment is taken:
Acute Care
Inpatient Rehabilitation
Skilled Nursing Facility
Outpatient
Rehabilitation
Home Health
StrokEDGE II
R R UR R R
Recommendations for entry-level physical therapy education and use in research:
Students should learn to administer this tool? (Y/N)
Students should be exposed to tool? (Y/N)
Appropriate for use in intervention research studies? (Y/N)
Is additional research warranted for this tool (Y/N)
StrokEDGE No Yes Yes Not reported
Considerations Chedoke-McMaster Stroke Assessment Measure translations:
French: http://www.physiotherapy.ca/Practice-Resources/Orders
These translations, and links to them, are subject to the Terms and Conditions of Use of the Rehab Measures Database. RIC is not responsible for and does not endorse the content, products or services of any third-party website, and does not make any representations regarding its
For more information visit www.neuropt.org or email [email protected]
quality, content or accuracy. If you would like to contribute a language translation to the RMD, please contact us at [email protected].
Do you see an error or have a suggestion for this instrument summary? Please e-mail us!
Bibliography Gowland, C., Stratford, P., et al. (1993). "Measuring physical impairment and disability with the Chedoke-McMaster Stroke Assessment." Stroke 24(1): 58. Find it on PubMed
Huijbregts, M., Gowland, C., et al. (2000). "Measuring clinically-important change with the activity inventory of the Chedoke McMaster Stroke Assessment." Physiotherapy Canada 52(4): 295-304.
Morland, J., Gowland, C., et al. (1993). "Theoretical basis of the Chedoke-McMaster Stroke Assessment." Physiotherapy Canada 45: 231-231.
Year published 1993
Instrument in PDF Format Yes
Approval Status Approved
For more information visit www.neuropt.org or email [email protected]
9. REHAB MEASURES DATABASE—DASH Link to instrument DASH Website
Title of Assessment Disabilities of the Arm, Shoulder, and Hand Questionnaire
Acronym DASH
Instrument Reviewer(s) Initially reviewed by Jill Smiley, MPH and Allison Todd in 5/2012; Updated by
Franco Calabrese, SPT, Adam Fagan, SPT, and Patrick Galvin, SPT in 11/2012. Updated by Melissa M. Eden PT, DPT, OCS. Reviewed by Dorian Rose, PhD, PT StrokEDGE II Task Force November 2017.
Summary Date 8/7/2014
Purpose The DASH is designed to evaluate disorders and measure disability of the upper extremities, and monitor change or function over time.
Description Developed jointly by the Institute for Work & Health and the American Academy of Orthopaedic Surgeons (AAOS).
The DASH was first published in 1996. It has 2 shortened versions, the QuickDASH and the QuickDASH-9. The DASH has been formally translated into 41 versions. There are 18 translations in progress.
The DASH is a 30-item self-report questionnaire designed to assess musculoskeletal disorders of the upper limbs. It has two, 4-item, optional modules used to measure symptoms and function in athletes, artists, and workers who require a high level of function.
Scoring the DASH:
• The 30-item disability/symptom section (item responses range from 1 (e.g. no difficulty, not at all, not limited, none, strongly disagree) to 5 (e.g. unable, extremely, unable, strongly agree))
• Scoring: [(sum of n / n) - 1] x 25; n = number of completed responses (see test sheet for more information)
o The DASH should not be scored if more than three items are missing
• Optional 4-item high performance section
o Add values of each response, then divide by 4, subtract 1 and multiply by 25: [((sum of values/4) - 1)*25]
o Optional modules should not be scored if items are missing
For more information visit www.neuropt.org or email [email protected]
• More information, including a PDF of the DASH, can be found on the DASH website
Area of Assessment Upper Extremity Function
Body Part Upper Extremity
ICF Domain Body Structure; Body Function; Activity; Participation
Domain ADL; Motor
Assessment Type Patient Reported Outcomes
Length of Test 06 to 30 Minutes
Time to Administer 05 to 30 Minutes
Number of Items 30 (34, if option high performance section is needed)
Equipment Required None
Training Required No Training
Type of training required No Training
Cost Free
Actual Cost Free
Age Range Adult: 18-64 years
Administration Mode Paper/Pencil
Diagnosis Arthritis; Geriatrics; Movement Disorders; Multiple Sclerosis; Pain; Stroke
Populations Tested • Adults with wrist, hand, elbow and should disorders
• Rheumatoid Arthritis
• Psoriatic Arthritis and Inflammatory Disease
• Athletes
• Carpal Tunnel Syndrome
• Elbow Arthroplasty
• Neck Pain
• Proximal Humeral Fractures
• Trauma Disorders
• Post-Operative Upper Extremity Surgery
• Multiple Sclerosis
• Adhesive Capsulitis
For more information visit www.neuropt.org or email [email protected]
• Non-traumatic neck complaints with Upper Extremity symptoms
• Shoulder Impingement • Stroke
Standard Error of Measurement (SEM)
Intercollegiate Athletes: (Hsu et al, 2010; n = 321; mean age 19.4 (17.6-22.6) years; Pre-competition physical, Intercollegiate Athletes)
• 3.61 (Calculated from MDC = 1.96 x SEM x square root of 2; 10 = 1.96 x SEM x square root of 2)
Osteoarthritis: (Vermeulen et al, 2009; n = 19, Primary Thumb Carpometacarpal Osteoarthritis; evaluated at 0, 3, 6 and 12 months, Osteoarthritis)
Analysis of the Change in DASH Score From Preoperative Clinical Evaluations
Mean SD SEM Lower Upper
DASH 0 to DASH 3 -14.93 9.63 2.27 -10.14 -19.72 DASH 0 to DASH 6 -20.54 14.58 3.26 -13.71 -27.36 DASH 0 to DASH 12 -20.83 20.09 4.49 -11.42 -30.23
*Paired differences of the DASH scores. DASH 0 is mean DASH score preoperative, DASH 3 is mean DASH score at 3 months, DASH 6 is mean DASH score at 6 months, and DASH 12 is mean DASH score at 12 months. Proximal Humeral Fractures: (Slobogean et al, 2010; n = 61, mean age = 69, Proximal Humeral Fractures)
• Calculated using SEM = Standard Deviation of first outcome * square root (1-ICC)
• SEM = 21.7 * square root (1 - 0.928) = 5.82
Adults with musculoskeletal upper extremity problems:
(Schmitt J.S., Di Fabio R.P., 2004)
• SEM = 5.22
(Beaton D.E., Katz J.N., Fossel A.H., Wright J.G., Tarasuk V., Bombardier C., 2001)
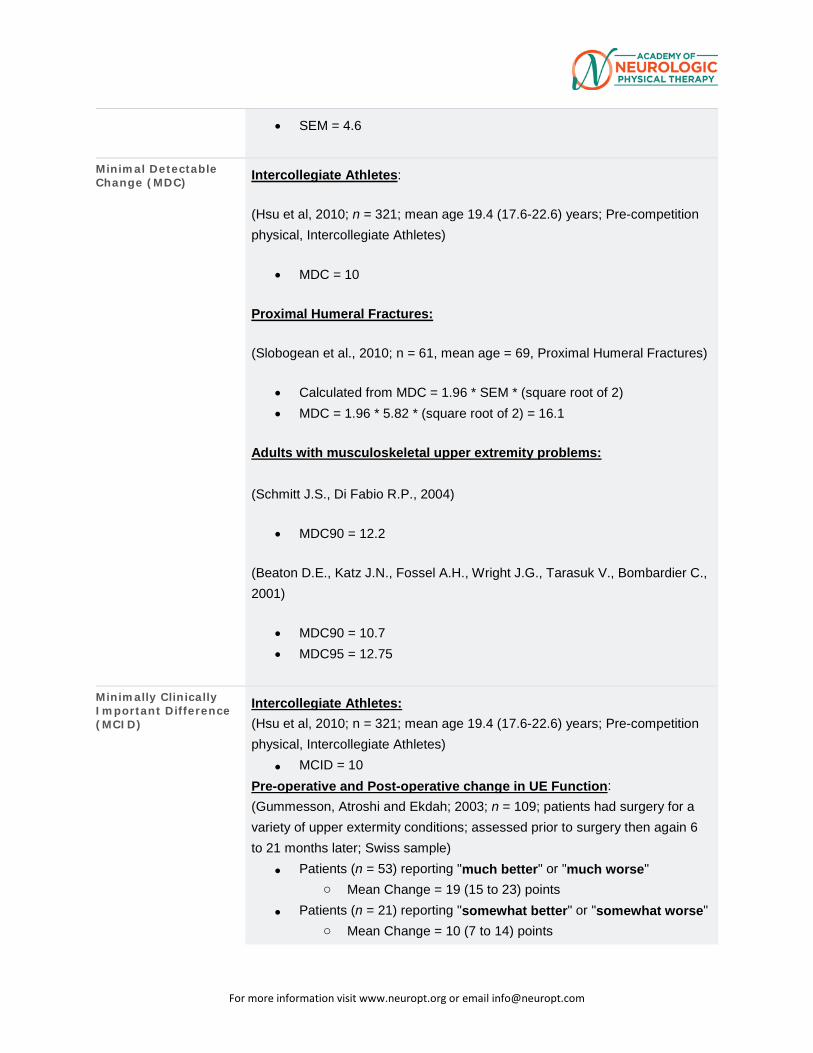
For more information visit www.neuropt.org or email [email protected]
• SEM = 4.6
Minimal Detectable Change (MDC) Intercollegiate Athletes:
(Hsu et al, 2010; n = 321; mean age 19.4 (17.6-22.6) years; Pre-competition physical, Intercollegiate Athletes)
• MDC = 10
Proximal Humeral Fractures:
(Slobogean et al., 2010; n = 61, mean age = 69, Proximal Humeral Fractures)
• Calculated from MDC = 1.96 * SEM * (square root of 2) • MDC = 1.96 * 5.82 * (square root of 2) = 16.1
Adults with musculoskeletal upper extremity problems:
(Schmitt J.S., Di Fabio R.P., 2004)
• MDC90 = 12.2
(Beaton D.E., Katz J.N., Fossel A.H., Wright J.G., Tarasuk V., Bombardier C., 2001)
• MDC90 = 10.7
• MDC95 = 12.75
Minimally Clinically Important Difference (MCID)
Intercollegiate Athletes: (Hsu et al, 2010; n = 321; mean age 19.4 (17.6-22.6) years; Pre-competition physical, Intercollegiate Athletes)
• MCID = 10
Pre-operative and Post-operative change in UE Function: (Gummesson, Atroshi and Ekdah; 2003; n = 109; patients had surgery for a variety of upper extermity conditions; assessed prior to surgery then again 6 to 21 months later; Swiss sample)
• Patients (n = 53) reporting "much better" or "much worse" o Mean Change = 19 (15 to 23) points
• Patients (n = 21) reporting "somewhat better" or "somewhat worse" o Mean Change = 10 (7 to 14) points
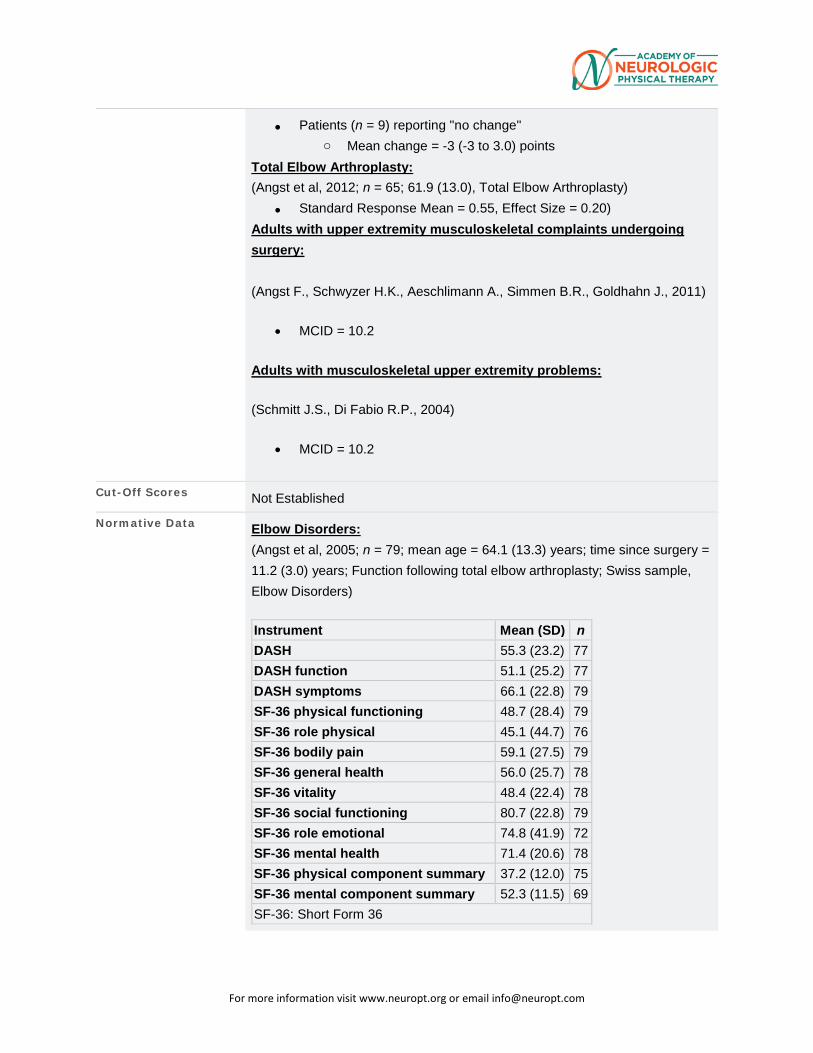
For more information visit www.neuropt.org or email [email protected]
• Patients (n = 9) reporting "no change" o Mean change = -3 (-3 to 3.0) points
Total Elbow Arthroplasty: (Angst et al, 2012; n = 65; 61.9 (13.0), Total Elbow Arthroplasty)
• Standard Response Mean = 0.55, Effect Size = 0.20) Adults with upper extremity musculoskeletal complaints undergoing surgery: (Angst F., Schwyzer H.K., Aeschlimann A., Simmen B.R., Goldhahn J., 2011)
• MCID = 10.2
Adults with musculoskeletal upper extremity problems:
(Schmitt J.S., Di Fabio R.P., 2004)
• MCID = 10.2
Cut-Off Scores Not Established
Normative Data Elbow Disorders: (Angst et al, 2005; n = 79; mean age = 64.1 (13.3) years; time since surgery = 11.2 (3.0) years; Function following total elbow arthroplasty; Swiss sample, Elbow Disorders) Instrument Mean (SD) n DASH 55.3 (23.2) 77 DASH function 51.1 (25.2) 77 DASH symptoms 66.1 (22.8) 79 SF-36 physical functioning 48.7 (28.4) 79 SF-36 role physical 45.1 (44.7) 76 SF-36 bodily pain 59.1 (27.5) 79 SF-36 general health 56.0 (25.7) 78 SF-36 vitality 48.4 (22.4) 78 SF-36 social functioning 80.7 (22.8) 79 SF-36 role emotional 74.8 (41.9) 72 SF-36 mental health 71.4 (20.6) 78 SF-36 physical component summary 37.2 (12.0) 75 SF-36 mental component summary 52.3 (11.5) 69 SF-36: Short Form 36
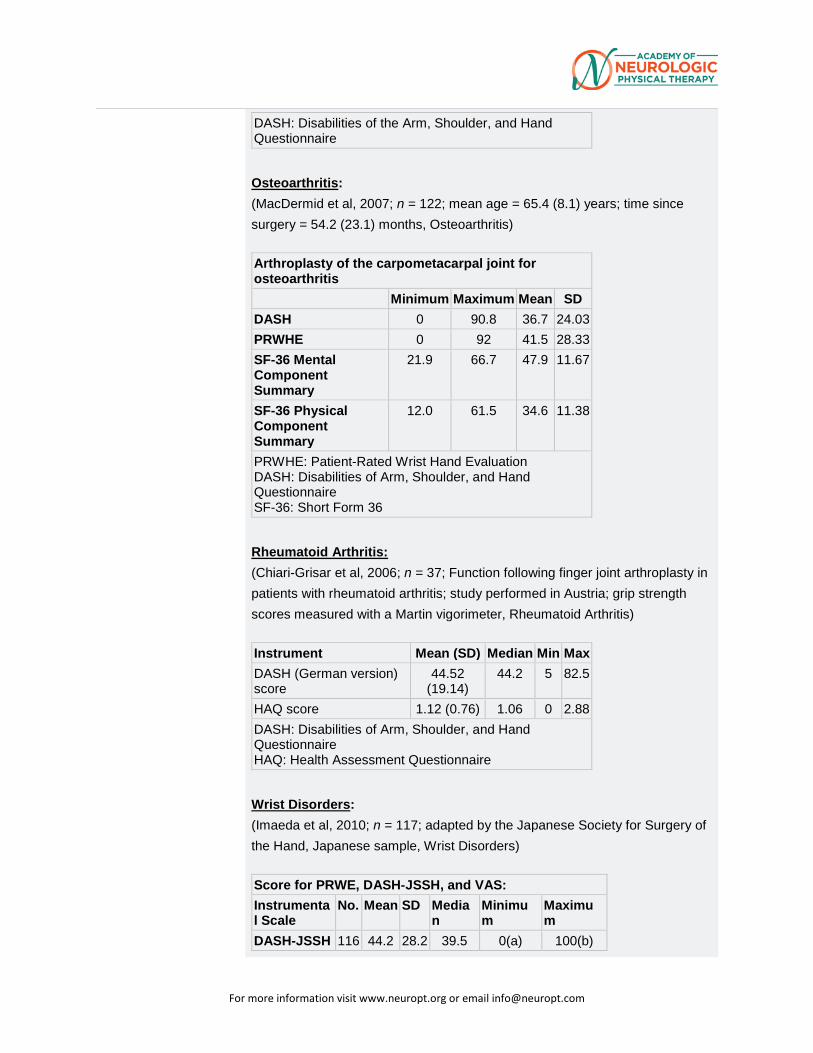
For more information visit www.neuropt.org or email [email protected]
DASH: Disabilities of the Arm, Shoulder, and Hand Questionnaire
Osteoarthritis: (MacDermid et al, 2007; n = 122; mean age = 65.4 (8.1) years; time since surgery = 54.2 (23.1) months, Osteoarthritis) Arthroplasty of the carpometacarpal joint for osteoarthritis
Minimum Maximum Mean SD DASH 0 90.8 36.7 24.03 PRWHE 0 92 41.5 28.33 SF-36 Mental Component Summary
21.9 66.7 47.9 11.67
SF-36 Physical Component Summary
12.0 61.5 34.6 11.38
PRWHE: Patient-Rated Wrist Hand Evaluation DASH: Disabilities of Arm, Shoulder, and Hand Questionnaire SF-36: Short Form 36
Rheumatoid Arthritis: (Chiari-Grisar et al, 2006; n = 37; Function following finger joint arthroplasty in patients with rheumatoid arthritis; study performed in Austria; grip strength scores measured with a Martin vigorimeter, Rheumatoid Arthritis) Instrument Mean (SD) Median Min Max DASH (German version) score
44.52 (19.14)
44.2 5 82.5
HAQ score 1.12 (0.76) 1.06 0 2.88 DASH: Disabilities of Arm, Shoulder, and Hand Questionnaire HAQ: Health Assessment Questionnaire
Wrist Disorders: (Imaeda et al, 2010; n = 117; adapted by the Japanese Society for Surgery of the Hand, Japanese sample, Wrist Disorders) Score for PRWE, DASH-JSSH, and VAS: Instrumental Scale
No. Mean SD Median
Minimum
Maximum
DASH-JSSH 116 44.2 28.2 39.5 0(a) 100(b)
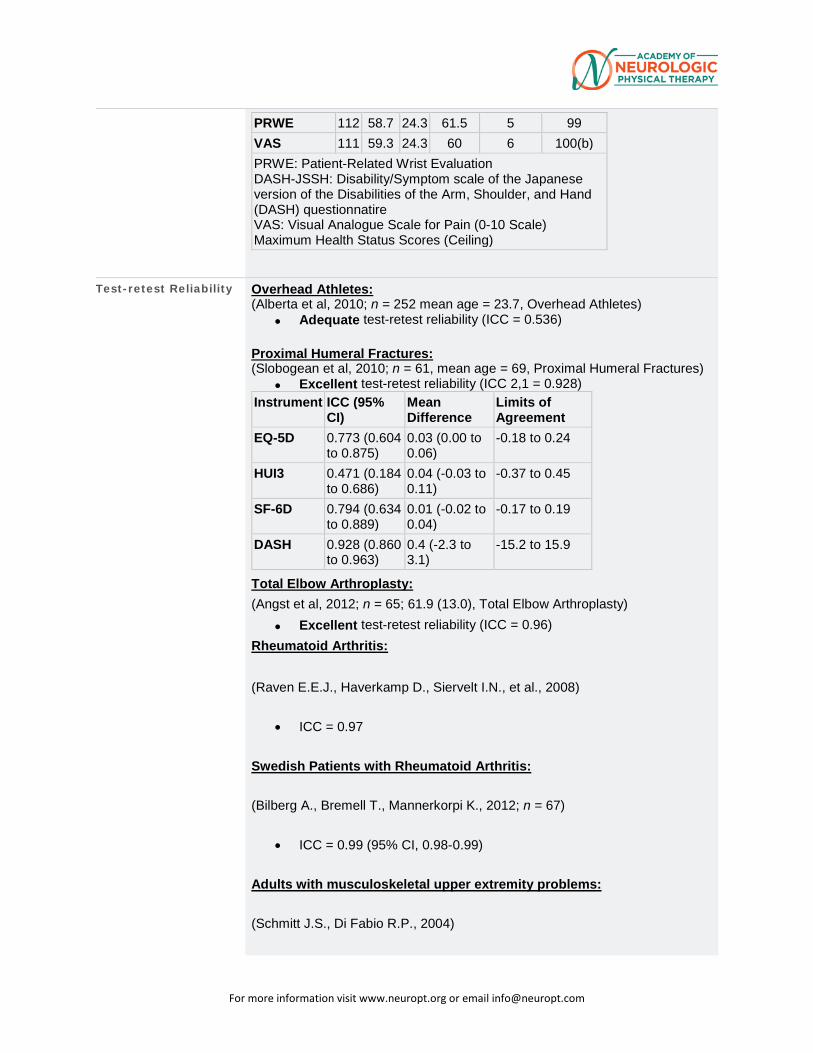
For more information visit www.neuropt.org or email [email protected]
PRWE 112 58.7 24.3 61.5 5 99 VAS 111 59.3 24.3 60 6 100(b) PRWE: Patient-Related Wrist Evaluation DASH-JSSH: Disability/Symptom scale of the Japanese version of the Disabilities of the Arm, Shoulder, and Hand (DASH) questionnatire VAS: Visual Analogue Scale for Pain (0-10 Scale) Maximum Health Status Scores (Ceiling)
Test-retest Reliability Overhead Athletes: (Alberta et al, 2010; n = 252 mean age = 23.7, Overhead Athletes)
• Adequate test-retest reliability (ICC = 0.536) Proximal Humeral Fractures: (Slobogean et al, 2010; n = 61, mean age = 69, Proximal Humeral Fractures)
• Excellent test-retest reliability (ICC 2,1 = 0.928) Instrument ICC (95%
CI) Mean Difference
Limits of Agreement
EQ-5D 0.773 (0.604 to 0.875)
0.03 (0.00 to 0.06)
-0.18 to 0.24
HUI3 0.471 (0.184 to 0.686)
0.04 (-0.03 to 0.11)
-0.37 to 0.45
SF-6D 0.794 (0.634 to 0.889)
0.01 (-0.02 to 0.04)
-0.17 to 0.19
DASH 0.928 (0.860 to 0.963)
0.4 (-2.3 to 3.1)
-15.2 to 15.9
Total Elbow Arthroplasty: (Angst et al, 2012; n = 65; 61.9 (13.0), Total Elbow Arthroplasty)
• Excellent test-retest reliability (ICC = 0.96) Rheumatoid Arthritis: (Raven E.E.J., Haverkamp D., Siervelt I.N., et al., 2008)
• ICC = 0.97
Swedish Patients with Rheumatoid Arthritis:
(Bilberg A., Bremell T., Mannerkorpi K., 2012; n = 67)
• ICC = 0.99 (95% CI, 0.98-0.99)
Adults with musculoskeletal upper extremity problems:
(Schmitt J.S., Di Fabio R.P., 2004)
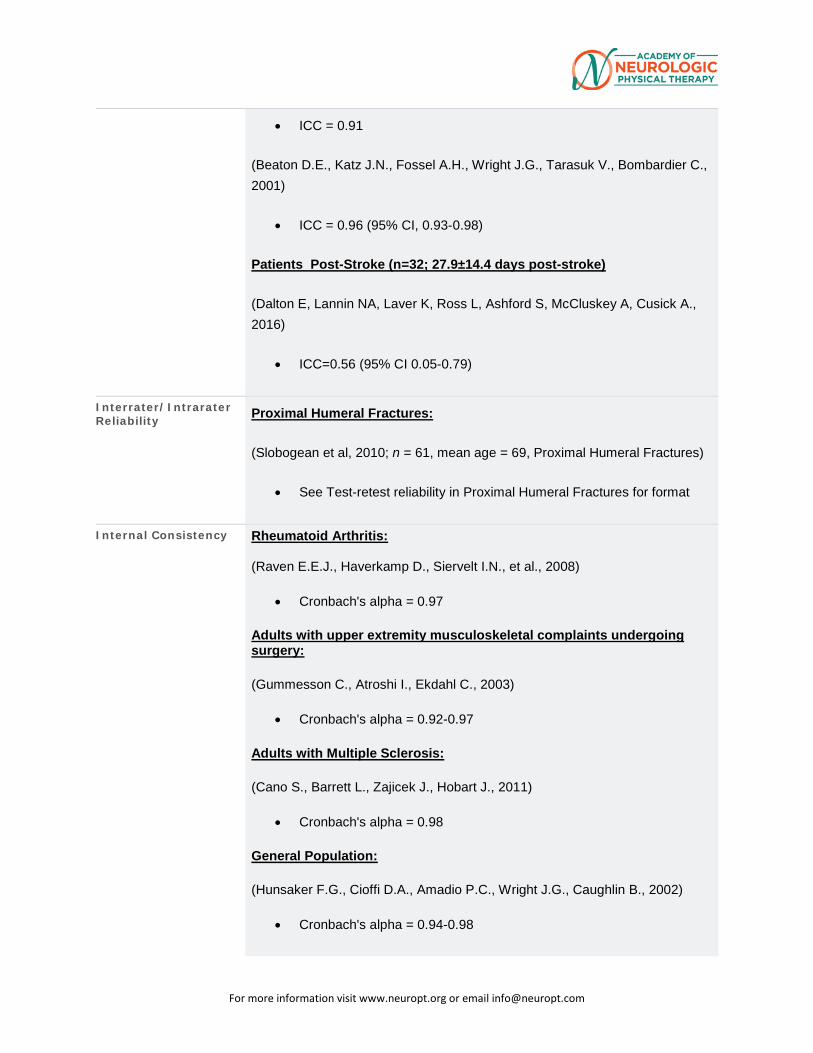
For more information visit www.neuropt.org or email [email protected]
• ICC = 0.91
(Beaton D.E., Katz J.N., Fossel A.H., Wright J.G., Tarasuk V., Bombardier C., 2001)
• ICC = 0.96 (95% CI, 0.93-0.98)
Patients Post-Stroke (n=32; 27.9±14.4 days post-stroke)
(Dalton E, Lannin NA, Laver K, Ross L, Ashford S, McCluskey A, Cusick A., 2016)
• ICC=0.56 (95% CI 0.05-0.79)
Interrater/Intrarater Reliability Proximal Humeral Fractures:
(Slobogean et al, 2010; n = 61, mean age = 69, Proximal Humeral Fractures)
• See Test-retest reliability in Proximal Humeral Fractures for format
Internal Consistency Rheumatoid Arthritis: (Raven E.E.J., Haverkamp D., Siervelt I.N., et al., 2008)
• Cronbach's alpha = 0.97
Adults with upper extremity musculoskeletal complaints undergoing surgery:
(Gummesson C., Atroshi I., Ekdahl C., 2003)
• Cronbach's alpha = 0.92-0.97
Adults with Multiple Sclerosis:
(Cano S., Barrett L., Zajicek J., Hobart J., 2011)
• Cronbach's alpha = 0.98
General Population:
(Hunsaker F.G., Cioffi D.A., Amadio P.C., Wright J.G., Caughlin B., 2002)
• Cronbach's alpha = 0.94-0.98
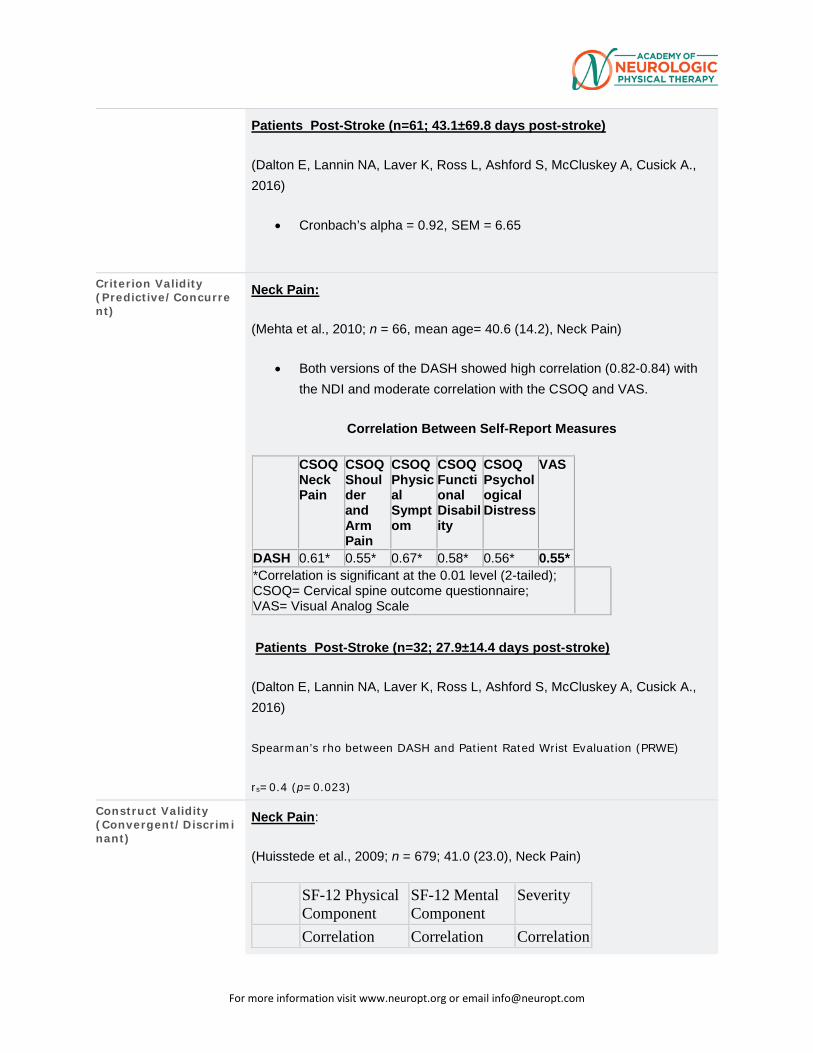
For more information visit www.neuropt.org or email [email protected]
Patients Post-Stroke (n=61; 43.1±69.8 days post-stroke)
(Dalton E, Lannin NA, Laver K, Ross L, Ashford S, McCluskey A, Cusick A., 2016)
• Cronbach’s alpha = 0.92, SEM = 6.65
Criterion Validity (Predictive/Concurrent)
Neck Pain:
(Mehta et al., 2010; n = 66, mean age= 40.6 (14.2), Neck Pain)
• Both versions of the DASH showed high correlation (0.82-0.84) with the NDI and moderate correlation with the CSOQ and VAS.
Correlation Between Self-Report Measures
CSOQ Neck Pain
CSOQ Shoulder and Arm Pain
CSOQ Physical Symptom
CSOQ Functional Disability
CSOQ Psychological Distress
VAS
DASH 0.61* 0.55* 0.67* 0.58* 0.56* 0.55* *Correlation is significant at the 0.01 level (2-tailed); CSOQ= Cervical spine outcome questionnaire; VAS= Visual Analog Scale
Patients Post-Stroke (n=32; 27.9±14.4 days post-stroke)
(Dalton E, Lannin NA, Laver K, Ross L, Ashford S, McCluskey A, Cusick A., 2016)
Spearman’s rho between DASH and Patient Rated Wrist Evaluation (PRWE)
rs=0.4 (p=0.023)
Construct Validity (Convergent/Discriminant)
Neck Pain:
(Huisstede et al., 2009; n = 679; 41.0 (23.0), Neck Pain)
SF-12 Physical Component
SF-12 Mental Component
Severity
Correlation Correlation Correlation
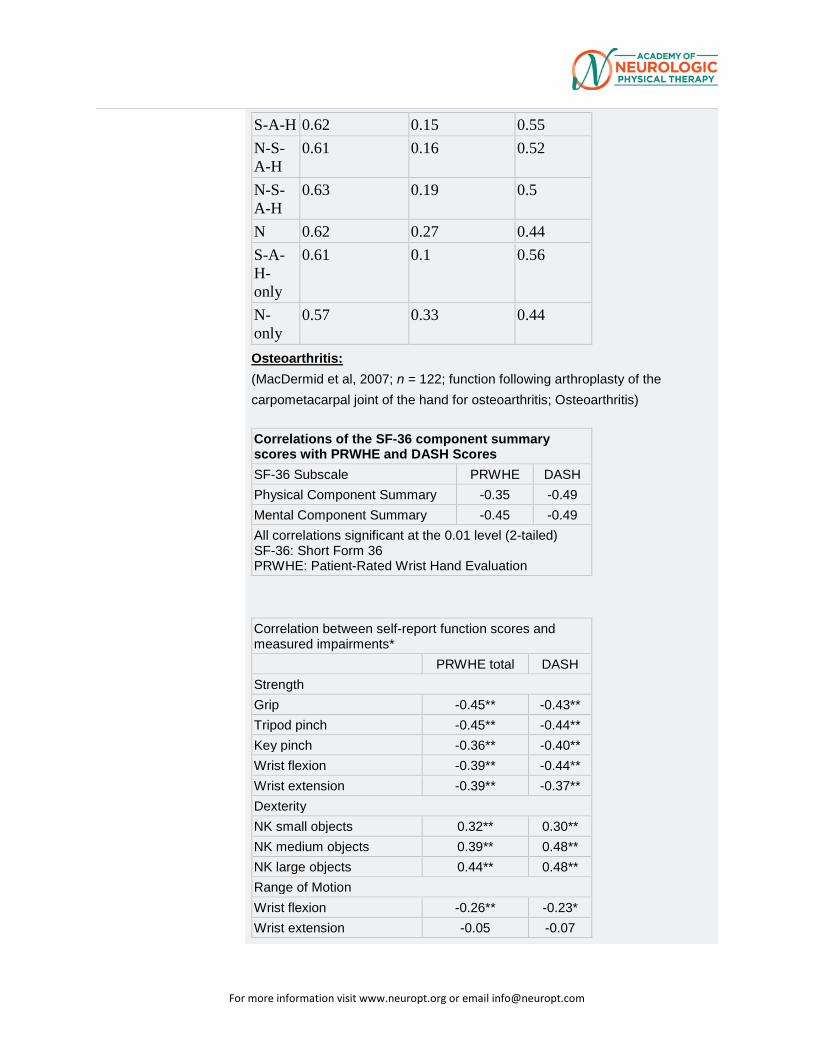
For more information visit www.neuropt.org or email [email protected]
S-A-H 0.62 0.15 0.55 N-S-A-H
0.61 0.16 0.52
N-S-A-H
0.63 0.19 0.5
N 0.62 0.27 0.44 S-A-H- only
0.61 0.1 0.56
N-only
0.57 0.33 0.44
Osteoarthritis: (MacDermid et al, 2007; n = 122; function following arthroplasty of the carpometacarpal joint of the hand for osteoarthritis; Osteoarthritis) Correlations of the SF-36 component summary scores with PRWHE and DASH Scores SF-36 Subscale PRWHE DASH Physical Component Summary -0.35 -0.49 Mental Component Summary -0.45 -0.49 All correlations significant at the 0.01 level (2-tailed) SF-36: Short Form 36 PRWHE: Patient-Rated Wrist Hand Evaluation
Correlation between self-report function scores and measured impairments*
PRWHE total DASH Strength Grip -0.45** -0.43** Tripod pinch -0.45** -0.44** Key pinch -0.36** -0.40** Wrist flexion -0.39** -0.44** Wrist extension -0.39** -0.37** Dexterity NK small objects 0.32** 0.30** NK medium objects 0.39** 0.48** NK large objects 0.44** 0.48** Range of Motion Wrist flexion -0.26** -0.23* Wrist extension -0.05 -0.07
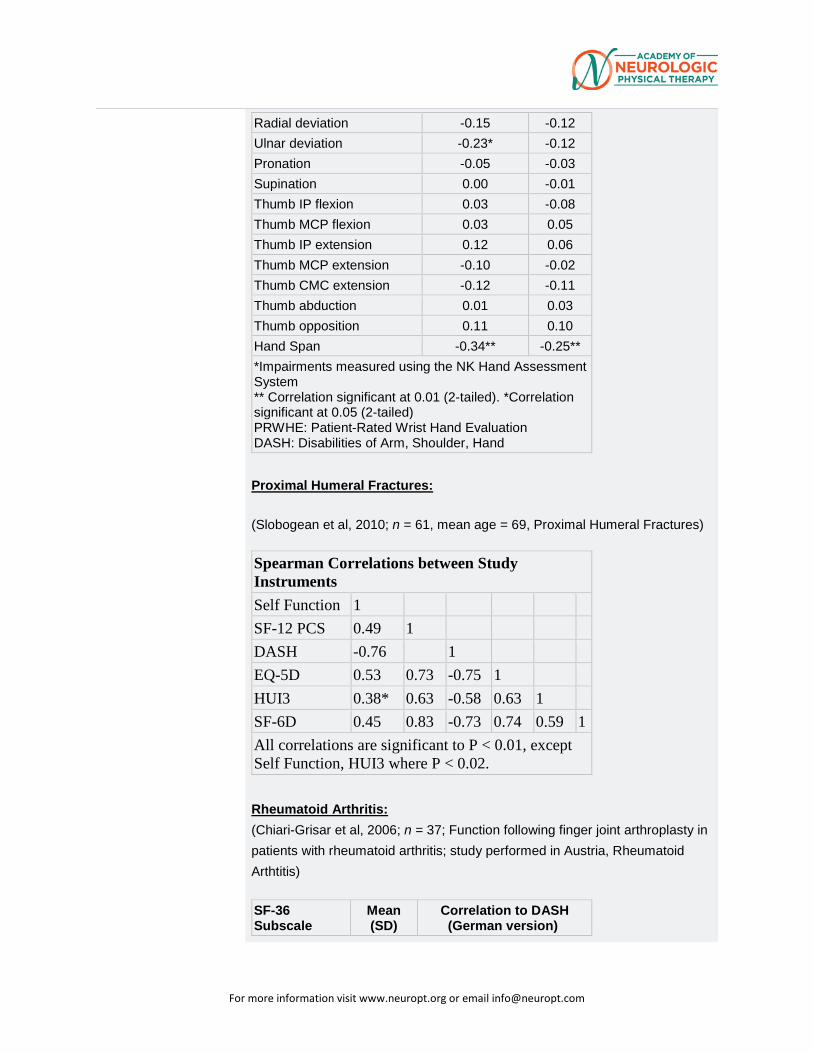
For more information visit www.neuropt.org or email [email protected]
Radial deviation -0.15 -0.12 Ulnar deviation -0.23* -0.12 Pronation -0.05 -0.03 Supination 0.00 -0.01 Thumb IP flexion 0.03 -0.08 Thumb MCP flexion 0.03 0.05 Thumb IP extension 0.12 0.06 Thumb MCP extension -0.10 -0.02 Thumb CMC extension -0.12 -0.11 Thumb abduction 0.01 0.03 Thumb opposition 0.11 0.10 Hand Span -0.34** -0.25** *Impairments measured using the NK Hand Assessment System ** Correlation significant at 0.01 (2-tailed). *Correlation significant at 0.05 (2-tailed) PRWHE: Patient-Rated Wrist Hand Evaluation DASH: Disabilities of Arm, Shoulder, Hand
Proximal Humeral Fractures:
(Slobogean et al, 2010; n = 61, mean age = 69, Proximal Humeral Fractures)
Spearman Correlations between Study Instruments Self Function 1
SF-12 PCS 0.49 1
DASH -0.76
1
EQ-5D 0.53 0.73 -0.75 1
HUI3 0.38* 0.63 -0.58 0.63 1
SF-6D 0.45 0.83 -0.73 0.74 0.59 1 All correlations are significant to P < 0.01, except Self Function, HUI3 where P < 0.02.
Rheumatoid Arthritis: (Chiari-Grisar et al, 2006; n = 37; Function following finger joint arthroplasty in patients with rheumatoid arthritis; study performed in Austria, Rheumatoid Arthtitis) SF-36 Subscale
Mean (SD)
Correlation to DASH (German version)
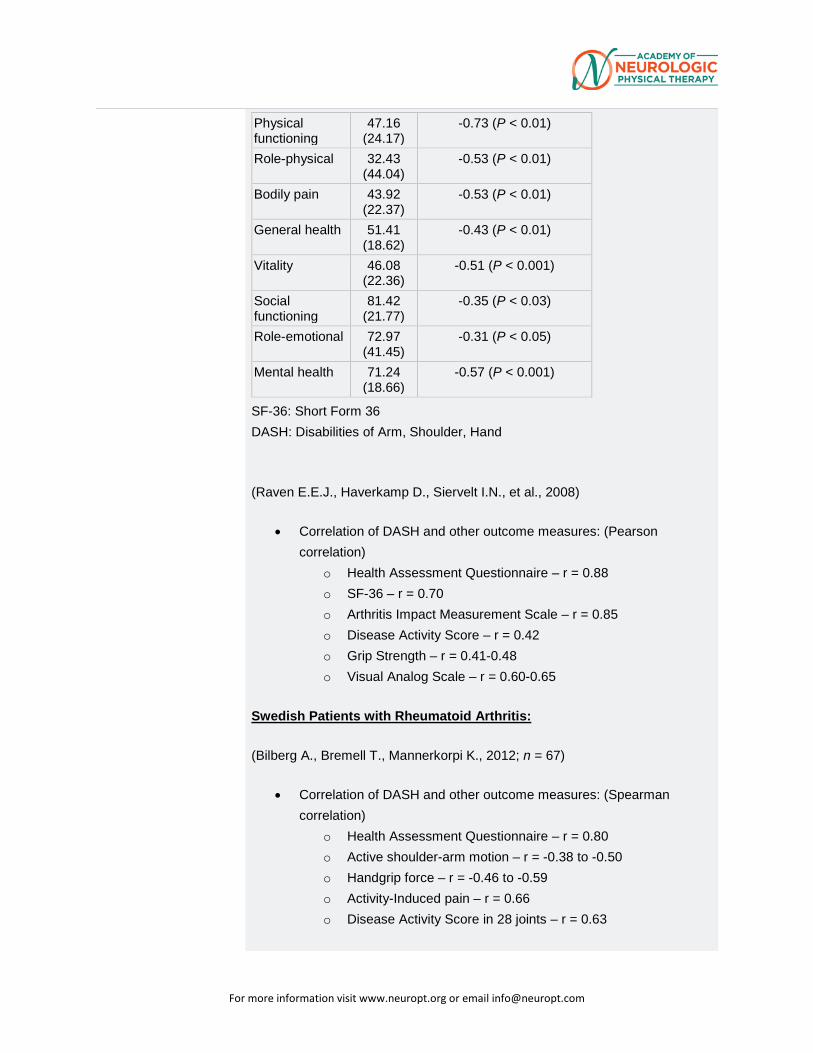
For more information visit www.neuropt.org or email [email protected]
Physical functioning
47.16 (24.17)
-0.73 (P < 0.01)
Role-physical 32.43 (44.04)
-0.53 (P < 0.01)
Bodily pain 43.92 (22.37)
-0.53 (P < 0.01)
General health 51.41 (18.62)
-0.43 (P < 0.01)
Vitality 46.08 (22.36)
-0.51 (P < 0.001)
Social functioning
81.42 (21.77)
-0.35 (P < 0.03)
Role-emotional 72.97 (41.45)
-0.31 (P < 0.05)
Mental health 71.24 (18.66)
-0.57 (P < 0.001)
SF-36: Short Form 36
DASH: Disabilities of Arm, Shoulder, Hand
(Raven E.E.J., Haverkamp D., Siervelt I.N., et al., 2008)
• Correlation of DASH and other outcome measures: (Pearson correlation)
o Health Assessment Questionnaire – r = 0.88
o SF-36 – r = 0.70
o Arthritis Impact Measurement Scale – r = 0.85
o Disease Activity Score – r = 0.42
o Grip Strength – r = 0.41-0.48
o Visual Analog Scale – r = 0.60-0.65
Swedish Patients with Rheumatoid Arthritis:
(Bilberg A., Bremell T., Mannerkorpi K., 2012; n = 67)
• Correlation of DASH and other outcome measures: (Spearman correlation)
o Health Assessment Questionnaire – r = 0.80
o Active shoulder-arm motion – r = -0.38 to -0.50
o Handgrip force – r = -0.46 to -0.59
o Activity-Induced pain – r = 0.66
o Disease Activity Score in 28 joints – r = 0.63
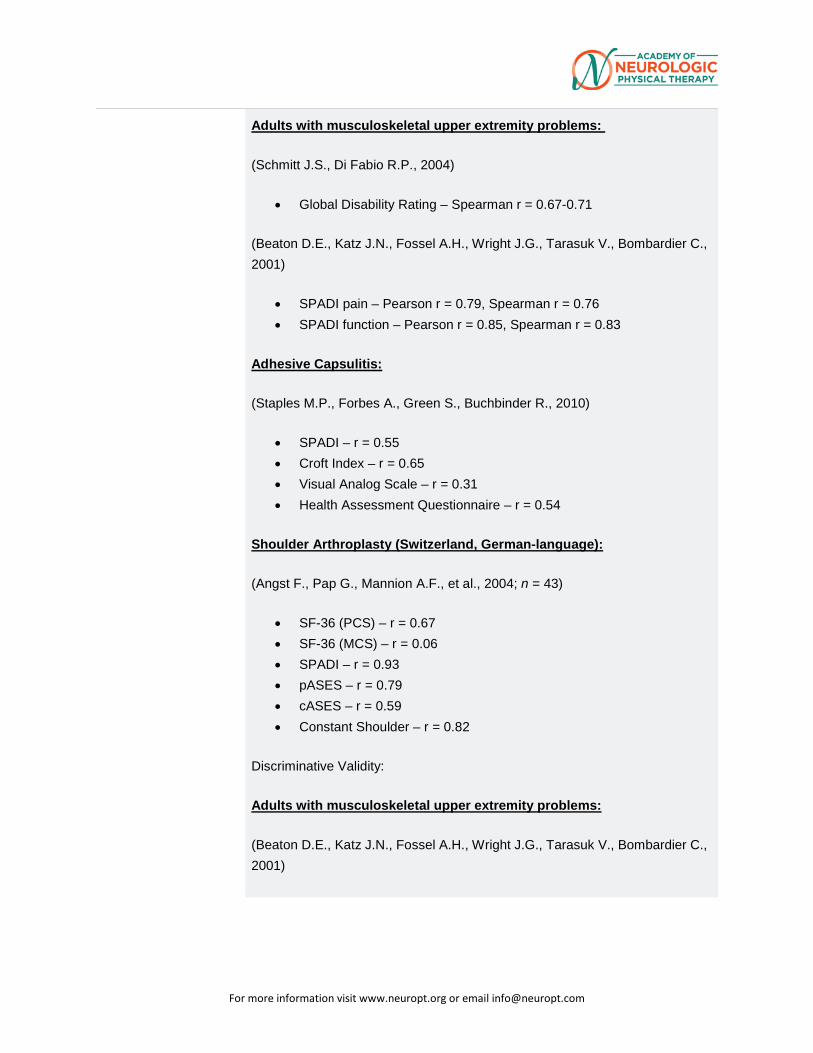
For more information visit www.neuropt.org or email [email protected]
Adults with musculoskeletal upper extremity problems:
(Schmitt J.S., Di Fabio R.P., 2004)
• Global Disability Rating – Spearman r = 0.67-0.71
(Beaton D.E., Katz J.N., Fossel A.H., Wright J.G., Tarasuk V., Bombardier C., 2001)
• SPADI pain – Pearson r = 0.79, Spearman r = 0.76
• SPADI function – Pearson r = 0.85, Spearman r = 0.83
Adhesive Capsulitis:
(Staples M.P., Forbes A., Green S., Buchbinder R., 2010)
• SPADI – r = 0.55
• Croft Index – r = 0.65
• Visual Analog Scale – r = 0.31
• Health Assessment Questionnaire – r = 0.54
Shoulder Arthroplasty (Switzerland, German-language):
(Angst F., Pap G., Mannion A.F., et al., 2004; n = 43)
• SF-36 (PCS) – r = 0.67
• SF-36 (MCS) – r = 0.06
• SPADI – r = 0.93
• pASES – r = 0.79
• cASES – r = 0.59
• Constant Shoulder – r = 0.82
Discriminative Validity:
Adults with musculoskeletal upper extremity problems:
(Beaton D.E., Katz J.N., Fossel A.H., Wright J.G., Tarasuk V., Bombardier C., 2001)
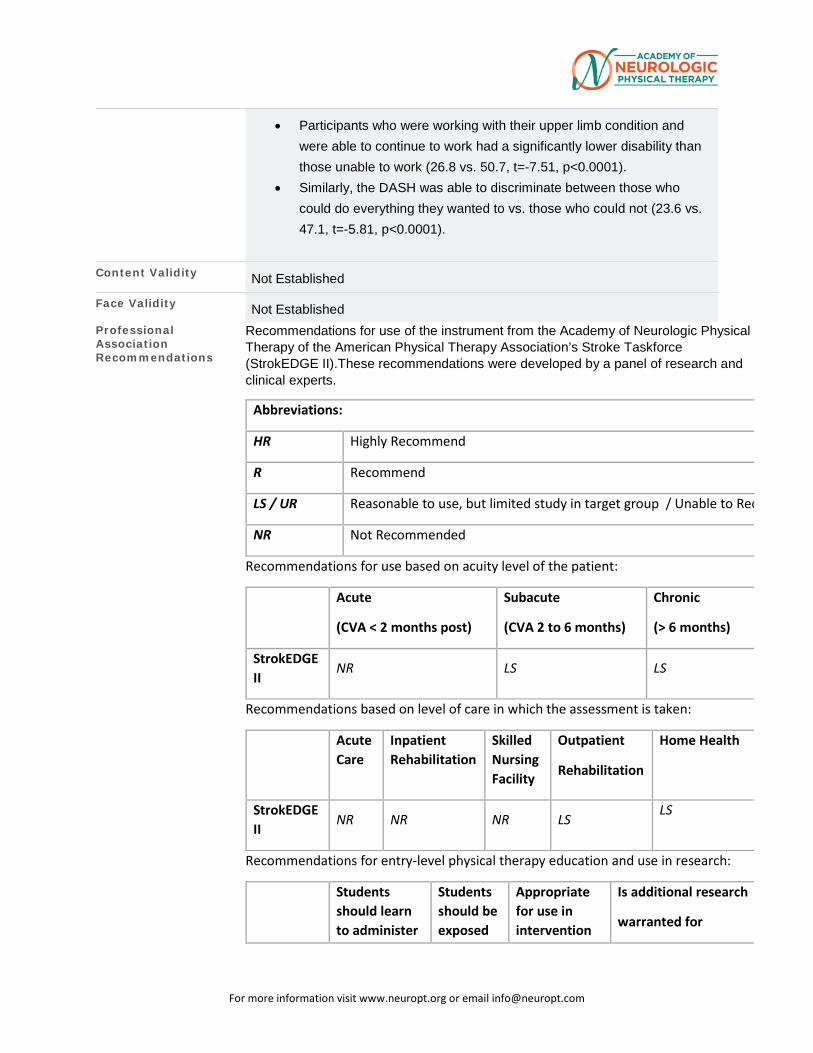
For more information visit www.neuropt.org or email [email protected]
• Participants who were working with their upper limb condition and were able to continue to work had a significantly lower disability than those unable to work (26.8 vs. 50.7, t=-7.51, p<0.0001).
• Similarly, the DASH was able to discriminate between those who could do everything they wanted to vs. those who could not (23.6 vs. 47.1, t=-5.81, p<0.0001).
Content Validity Not Established
Face Validity Not Established
Professional Association Recommendations
Recommendations for use of the instrument from the Academy of Neurologic Physical Therapy of the American Physical Therapy Association’s Stroke Taskforce (StrokEDGE II).These recommendations were developed by a panel of research and clinical experts.
Abbreviations:
HR Highly Recommend
R Recommend
LS / UR Reasonable to use, but limited study in target group / Unable to Rec
NR Not Recommended
Recommendations for use based on acuity level of the patient:
Acute
(CVA < 2 months post)
Subacute
(CVA 2 to 6 months)
Chronic
(> 6 months)
StrokEDGE II
NR LS LS
Recommendations based on level of care in which the assessment is taken:
Acute Care
Inpatient Rehabilitation
Skilled Nursing Facility
Outpatient
Rehabilitation
Home Health
StrokEDGE II
NR NR NR LS LS
Recommendations for entry-level physical therapy education and use in research:
Students should learn to administer
Students should be exposed
Appropriate for use in intervention
Is additional research
warranted for

For more information visit www.neuropt.org or email [email protected]
this tool? (Y/N)
to tool? (Y/N)
research studies? (Y/N)
this tool (Y/N)
StrokEDGE II
N Y Y Y
Bibliography Dalton E, Lannin NA, Laver K, Rose L, et al. Validity, reliability and ease of use of the disabilities of arm, shoulder and hand questionnaire in adults following stroke. Disabilty and Rehabilitation. 2017; 39:2504-2511. Find it on PubMed
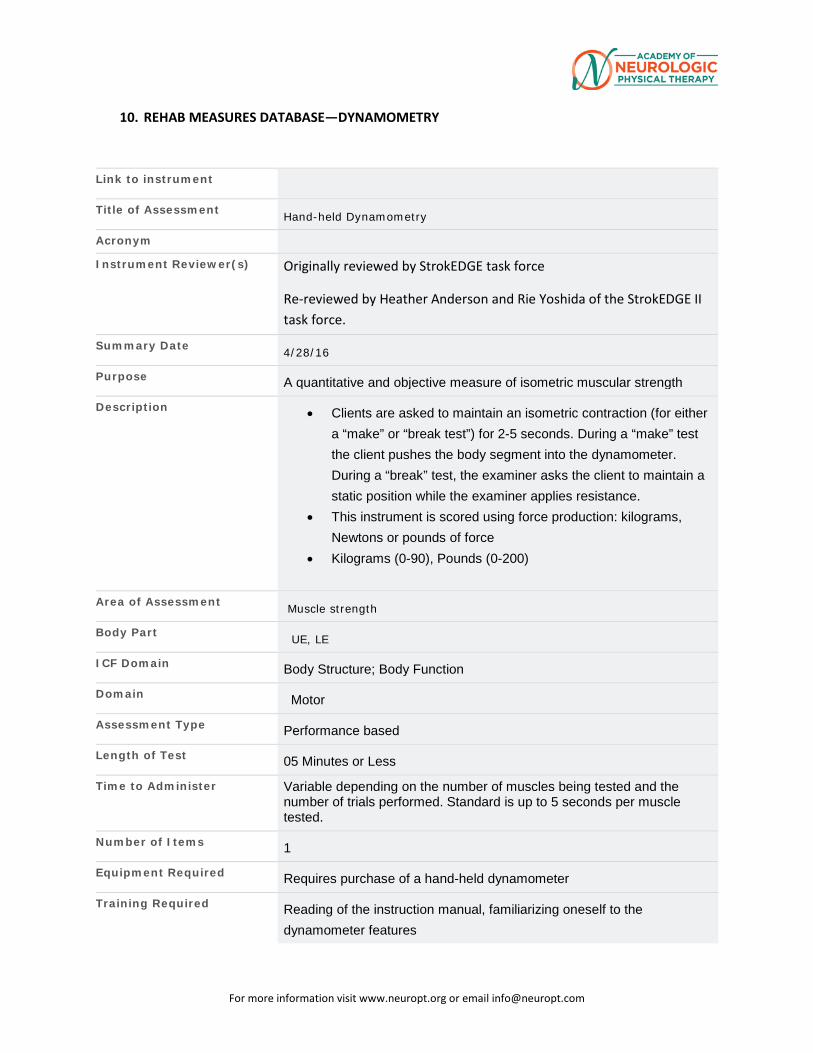
For more information visit www.neuropt.org or email [email protected]
10. REHAB MEASURES DATABASE—DYNAMOMETRY
Link to instrument
Title of Assessment Hand-held Dynamometry
Acronym
Instrument Reviewer(s) Originally reviewed by StrokEDGE task force
Re-reviewed by Heather Anderson and Rie Yoshida of the StrokEDGE II task force.
Summary Date 4/28/16
Purpose A quantitative and objective measure of isometric muscular strength
Description • Clients are asked to maintain an isometric contraction (for either a “make” or “break test”) for 2-5 seconds. During a “make” test the client pushes the body segment into the dynamometer. During a “break” test, the examiner asks the client to maintain a static position while the examiner applies resistance.
• This instrument is scored using force production: kilograms, Newtons or pounds of force
• Kilograms (0-90), Pounds (0-200)
Area of Assessment Muscle strength
Body Part UE, LE
ICF Domain Body Structure; Body Function
Domain Motor
Assessment Type Performance based
Length of Test 05 Minutes or Less
Time to Administer Variable depending on the number of muscles being tested and the number of trials performed. Standard is up to 5 seconds per muscle tested.
Number of Items 1
Equipment Required Requires purchase of a hand-held dynamometer
Training Required Reading of the instruction manual, familiarizing oneself to the dynamometer features
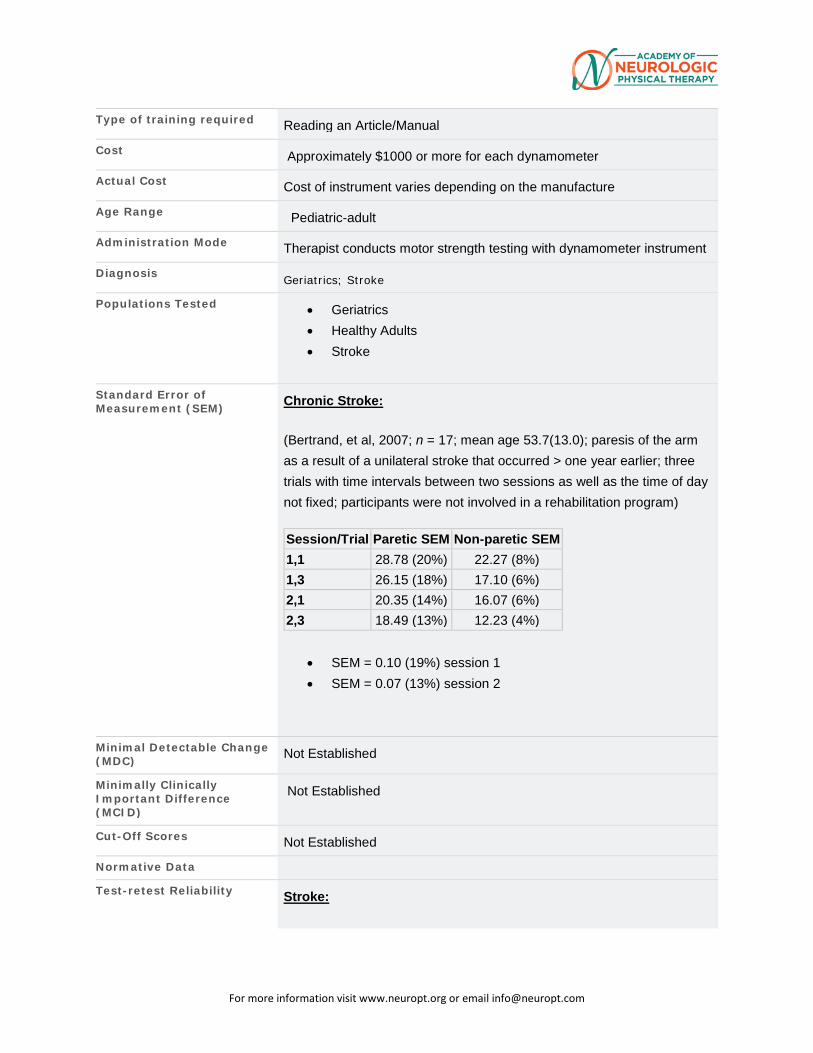
For more information visit www.neuropt.org or email [email protected]
Type of training required Reading an Article/Manual
Cost Approximately $1000 or more for each dynamometer
Actual Cost Cost of instrument varies depending on the manufacture
Age Range Pediatric-adult
Administration Mode Therapist conducts motor strength testing with dynamometer instrument
Diagnosis Geriatrics; Stroke
Populations Tested • Geriatrics
• Healthy Adults
• Stroke
Standard Error of Measurement (SEM) Chronic Stroke:
(Bertrand, et al, 2007; n = 17; mean age 53.7(13.0); paresis of the arm as a result of a unilateral stroke that occurred > one year earlier; three trials with time intervals between two sessions as well as the time of day not fixed; participants were not involved in a rehabilitation program)
Session/Trial Paretic SEM Non-paretic SEM 1,1 28.78 (20%) 22.27 (8%) 1,3 26.15 (18%) 17.10 (6%) 2,1 20.35 (14%) 16.07 (6%) 2,3 18.49 (13%) 12.23 (4%)
• SEM = 0.10 (19%) session 1
• SEM = 0.07 (13%) session 2
Minimal Detectable Change (MDC) Not Established
Minimally Clinically Important Difference (MCID)
Not Established
Cut-Off Scores Not Established
Normative Data
Test-retest Reliability Stroke:
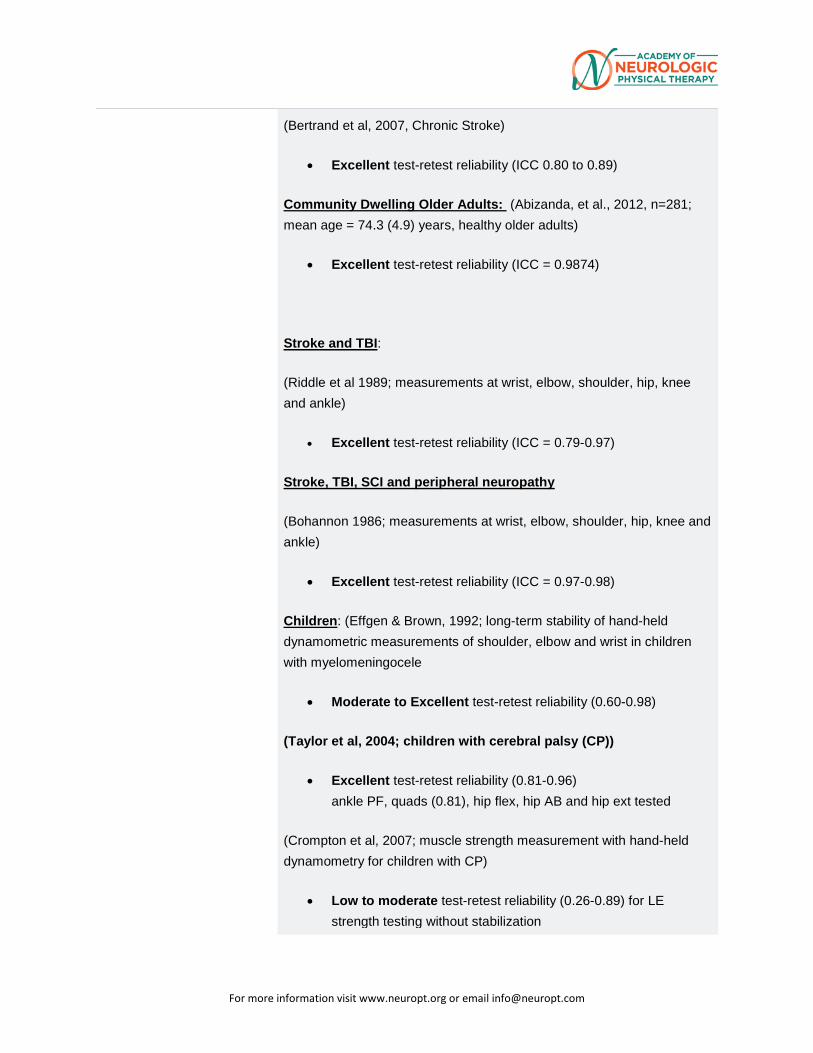
For more information visit www.neuropt.org or email [email protected]
(Bertrand et al, 2007, Chronic Stroke)
• Excellent test-retest reliability (ICC 0.80 to 0.89)
Community Dwelling Older Adults: (Abizanda, et al., 2012, n=281; mean age = 74.3 (4.9) years, healthy older adults)
• Excellent test-retest reliability (ICC = 0.9874)
Stroke and TBI:
(Riddle et al 1989; measurements at wrist, elbow, shoulder, hip, knee and ankle)
• Excellent test-retest reliability (ICC = 0.79-0.97)
Stroke, TBI, SCI and peripheral neuropathy
(Bohannon 1986; measurements at wrist, elbow, shoulder, hip, knee and ankle)
• Excellent test-retest reliability (ICC = 0.97-0.98)
Children: (Effgen & Brown, 1992; long-term stability of hand-held dynamometric measurements of shoulder, elbow and wrist in children with myelomeningocele
• Moderate to Excellent test-retest reliability (0.60-0.98)
(Taylor et al, 2004; children with cerebral palsy (CP))
• Excellent test-retest reliability (0.81-0.96) ankle PF, quads (0.81), hip flex, hip AB and hip ext tested
(Crompton et al, 2007; muscle strength measurement with hand-held dynamometry for children with CP)
• Low to moderate test-retest reliability (0.26-0.89) for LE strength testing without stabilization
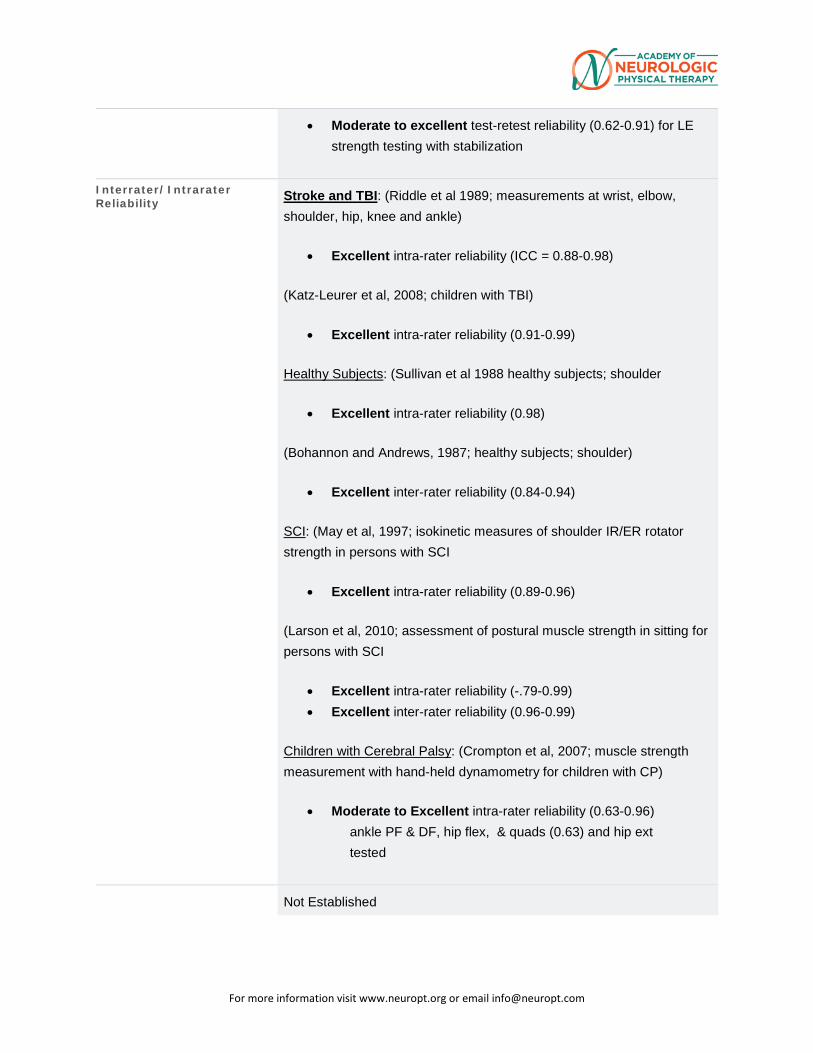
For more information visit www.neuropt.org or email [email protected]
• Moderate to excellent test-retest reliability (0.62-0.91) for LE strength testing with stabilization
Interrater/Intrarater Reliability Stroke and TBI: (Riddle et al 1989; measurements at wrist, elbow,
shoulder, hip, knee and ankle)
• Excellent intra-rater reliability (ICC = 0.88-0.98)
(Katz-Leurer et al, 2008; children with TBI)
• Excellent intra-rater reliability (0.91-0.99)
Healthy Subjects: (Sullivan et al 1988 healthy subjects; shoulder
• Excellent intra-rater reliability (0.98)
(Bohannon and Andrews, 1987; healthy subjects; shoulder)
• Excellent inter-rater reliability (0.84-0.94)
SCI: (May et al, 1997; isokinetic measures of shoulder IR/ER rotator strength in persons with SCI
• Excellent intra-rater reliability (0.89-0.96)
(Larson et al, 2010; assessment of postural muscle strength in sitting for persons with SCI
• Excellent intra-rater reliability (-.79-0.99) • Excellent inter-rater reliability (0.96-0.99)
Children with Cerebral Palsy: (Crompton et al, 2007; muscle strength measurement with hand-held dynamometry for children with CP)
• Moderate to Excellent intra-rater reliability (0.63-0.96) ankle PF & DF, hip flex, & quads (0.63) and hip ext tested
Not Established
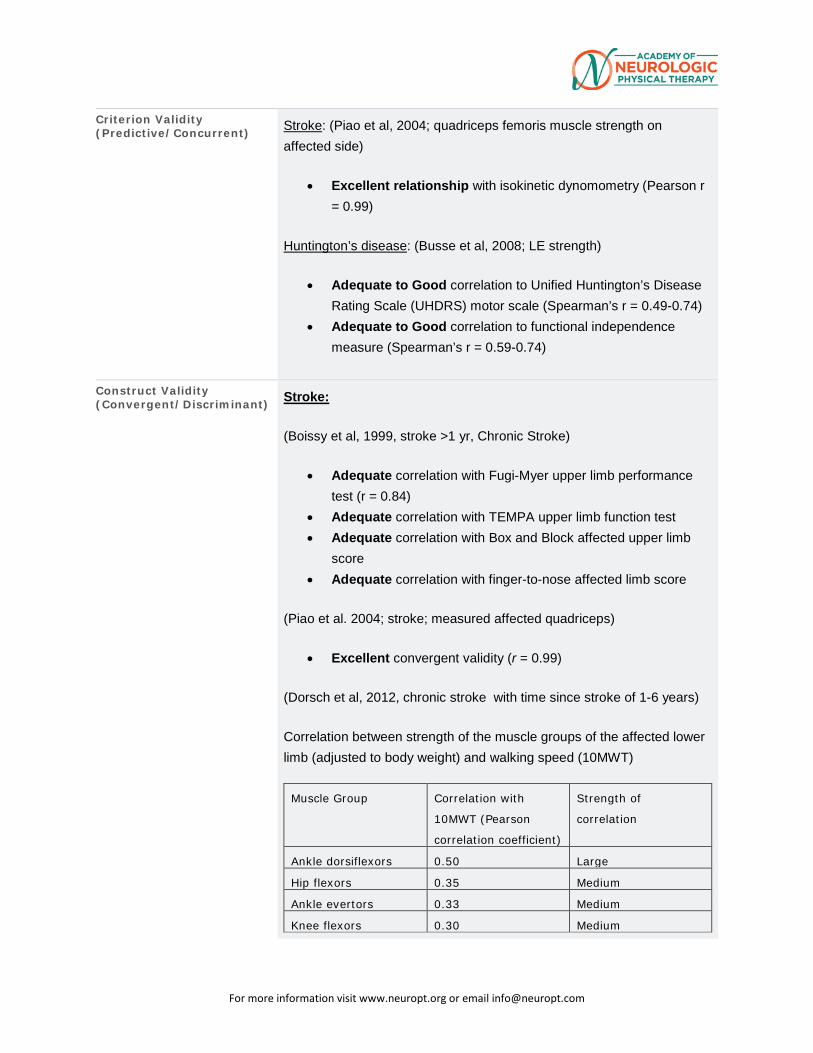
For more information visit www.neuropt.org or email [email protected]
Criterion Validity (Predictive/Concurrent) Stroke: (Piao et al, 2004; quadriceps femoris muscle strength on
affected side)
• Excellent relationship with isokinetic dynomometry (Pearson r = 0.99)
Huntington’s disease: (Busse et al, 2008; LE strength)
• Adequate to Good correlation to Unified Huntington’s Disease Rating Scale (UHDRS) motor scale (Spearman’s r = 0.49-0.74)
• Adequate to Good correlation to functional independence measure (Spearman’s r = 0.59-0.74)
Construct Validity (Convergent/Discriminant) Stroke:
(Boissy et al, 1999, stroke >1 yr, Chronic Stroke)
• Adequate correlation with Fugi-Myer upper limb performance test (r = 0.84)
• Adequate correlation with TEMPA upper limb function test • Adequate correlation with Box and Block affected upper limb
score • Adequate correlation with finger-to-nose affected limb score
(Piao et al. 2004; stroke; measured affected quadriceps)
• Excellent convergent validity (r = 0.99)
(Dorsch et al, 2012, chronic stroke with time since stroke of 1-6 years)
Correlation between strength of the muscle groups of the affected lower limb (adjusted to body weight) and walking speed (10MWT)
Muscle Group Correlation with
10MWT (Pearson
correlation coefficient)
Strength of
correlation
Ankle dorsiflexors 0.50 Large
Hip flexors 0.35 Medium
Ankle evertors 0.33 Medium
Knee flexors 0.30 Medium
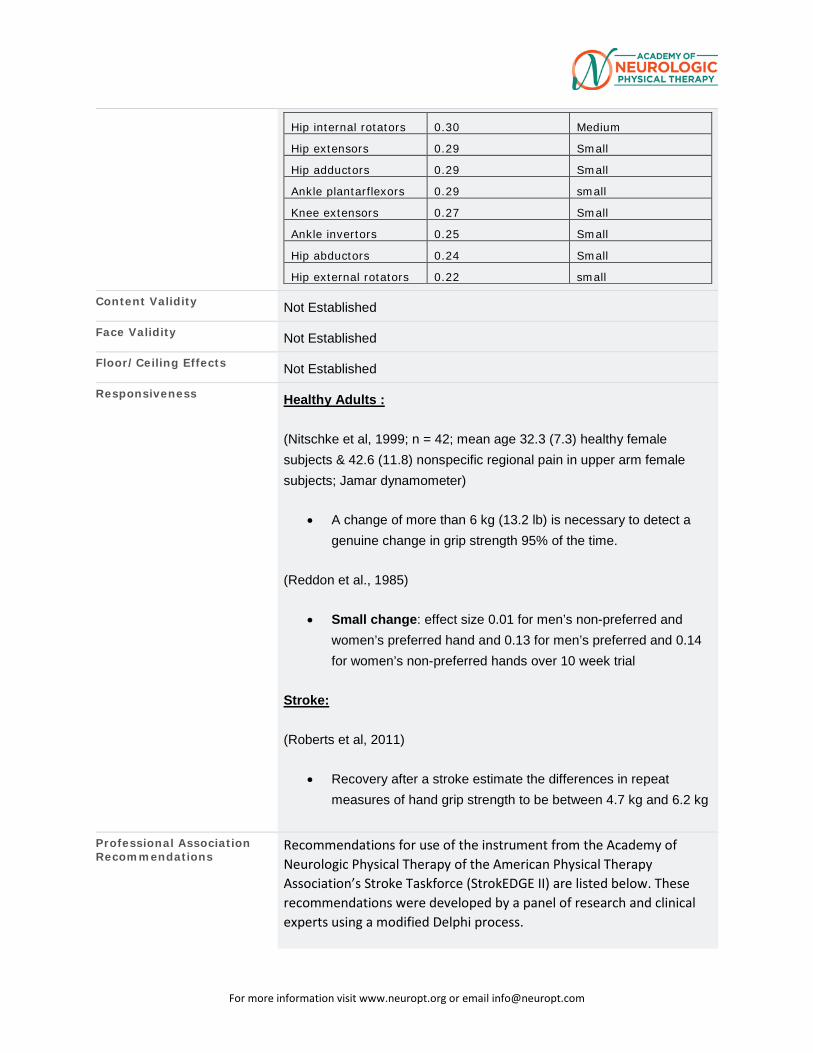
For more information visit www.neuropt.org or email [email protected]
Hip internal rotators 0.30 Medium
Hip extensors 0.29 Small
Hip adductors 0.29 Small
Ankle plantarflexors 0.29 small
Knee extensors 0.27 Small
Ankle invertors 0.25 Small
Hip abductors 0.24 Small
Hip external rotators 0.22 small
Content Validity Not Established
Face Validity Not Established
Floor/Ceiling Effects Not Established
Responsiveness Healthy Adults :
(Nitschke et al, 1999; n = 42; mean age 32.3 (7.3) healthy female subjects & 42.6 (11.8) nonspecific regional pain in upper arm female subjects; Jamar dynamometer)
• A change of more than 6 kg (13.2 lb) is necessary to detect a genuine change in grip strength 95% of the time.
(Reddon et al., 1985)
• Small change: effect size 0.01 for men’s non-preferred and women’s preferred hand and 0.13 for men’s preferred and 0.14 for women’s non-preferred hands over 10 week trial
Stroke:
(Roberts et al, 2011)
• Recovery after a stroke estimate the differences in repeat measures of hand grip strength to be between 4.7 kg and 6.2 kg
Professional Association Recommendations
Recommendations for use of the instrument from the Academy of Neurologic Physical Therapy of the American Physical Therapy Association’s Stroke Taskforce (StrokEDGE II) are listed below. These recommendations were developed by a panel of research and clinical experts using a modified Delphi process.
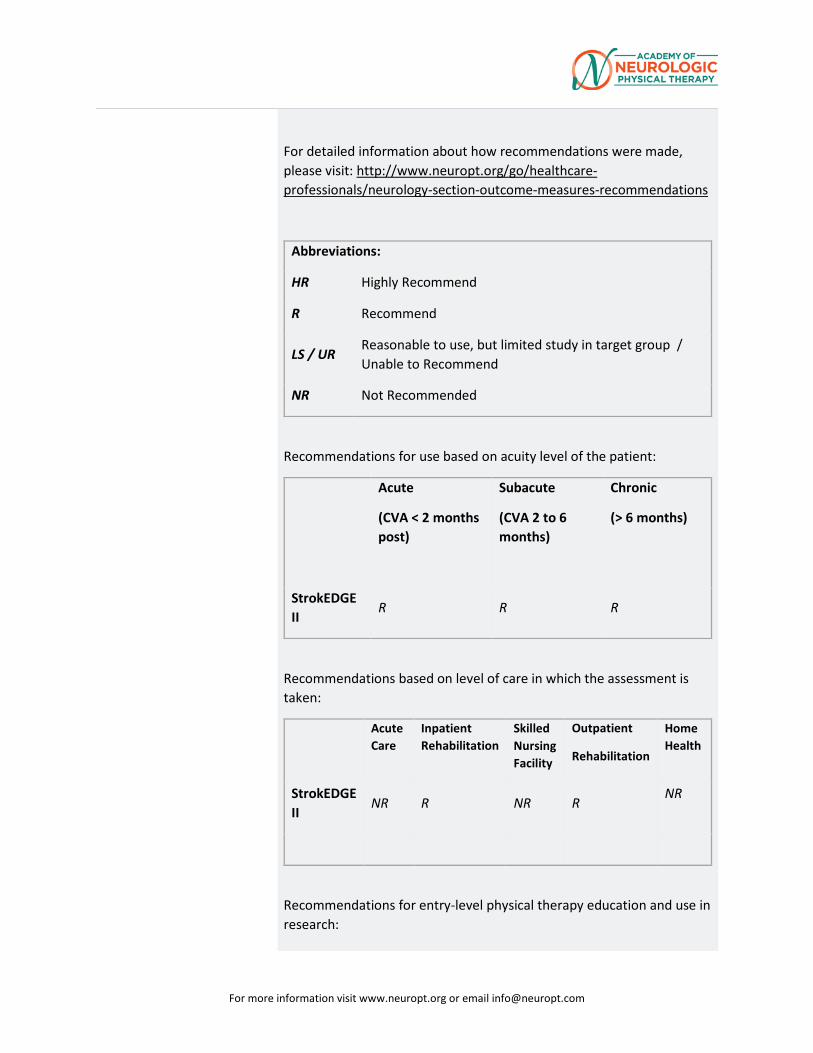
For more information visit www.neuropt.org or email [email protected]
For detailed information about how recommendations were made, please visit: http://www.neuropt.org/go/healthcare-professionals/neurology-section-outcome-measures-recommendations
Abbreviations:
HR Highly Recommend
R Recommend
LS / UR Reasonable to use, but limited study in target group / Unable to Recommend
NR Not Recommended
Recommendations for use based on acuity level of the patient:
Acute
(CVA < 2 months post)
Subacute
(CVA 2 to 6 months)
Chronic
(> 6 months)
StrokEDGE II
R R R
Recommendations based on level of care in which the assessment is taken:
Acute Care
Inpatient Rehabilitation
Skilled Nursing Facility
Outpatient
Rehabilitation
Home Health
StrokEDGE II
NR R NR R NR
Recommendations for entry-level physical therapy education and use in research:
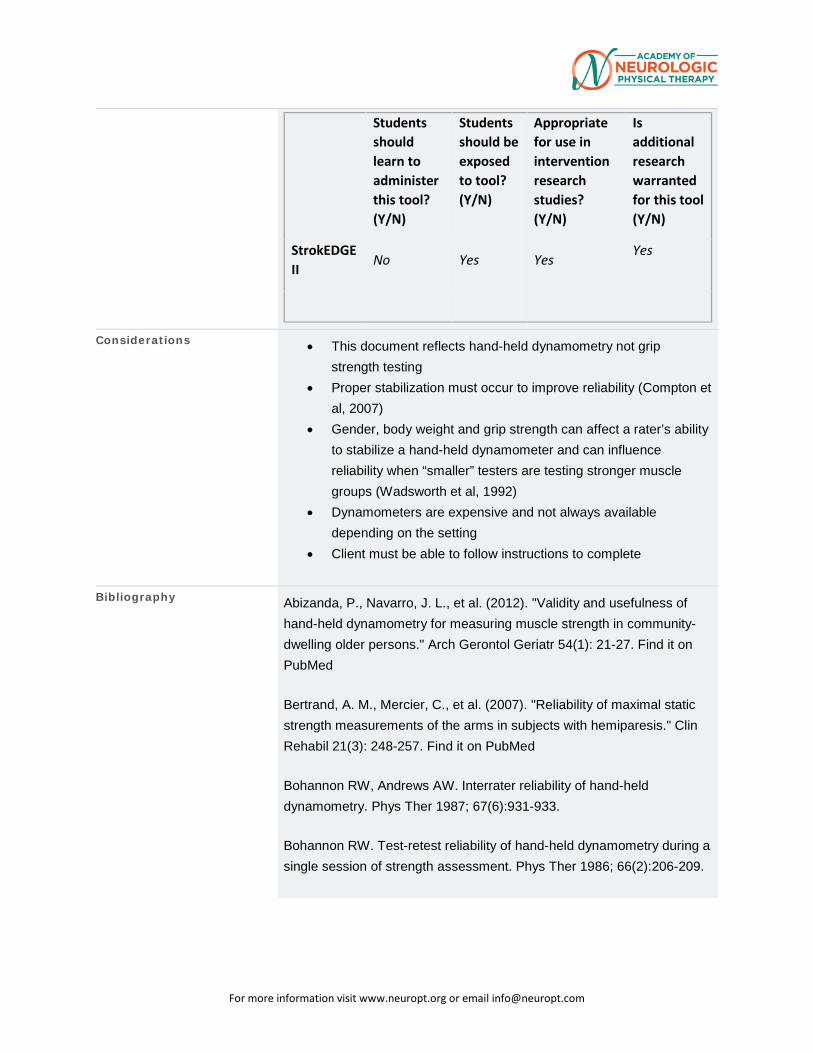
For more information visit www.neuropt.org or email [email protected]
Students should learn to administer this tool? (Y/N)
Students should be exposed to tool? (Y/N)
Appropriate for use in intervention research studies? (Y/N)
Is additional research warranted for this tool (Y/N)
StrokEDGE II
No Yes Yes Yes
Considerations • This document reflects hand-held dynamometry not grip strength testing
• Proper stabilization must occur to improve reliability (Compton et al, 2007)
• Gender, body weight and grip strength can affect a rater’s ability to stabilize a hand-held dynamometer and can influence reliability when “smaller” testers are testing stronger muscle groups (Wadsworth et al, 1992)
• Dynamometers are expensive and not always available depending on the setting
• Client must be able to follow instructions to complete
Bibliography Abizanda, P., Navarro, J. L., et al. (2012). "Validity and usefulness of hand-held dynamometry for measuring muscle strength in community-dwelling older persons." Arch Gerontol Geriatr 54(1): 21-27. Find it on PubMed
Bertrand, A. M., Mercier, C., et al. (2007). "Reliability of maximal static strength measurements of the arms in subjects with hemiparesis." Clin Rehabil 21(3): 248-257. Find it on PubMed
Bohannon RW, Andrews AW. Interrater reliability of hand-held dynamometry. Phys Ther 1987; 67(6):931-933.
Bohannon RW. Test-retest reliability of hand-held dynamometry during a single session of strength assessment. Phys Ther 1986; 66(2):206-209.
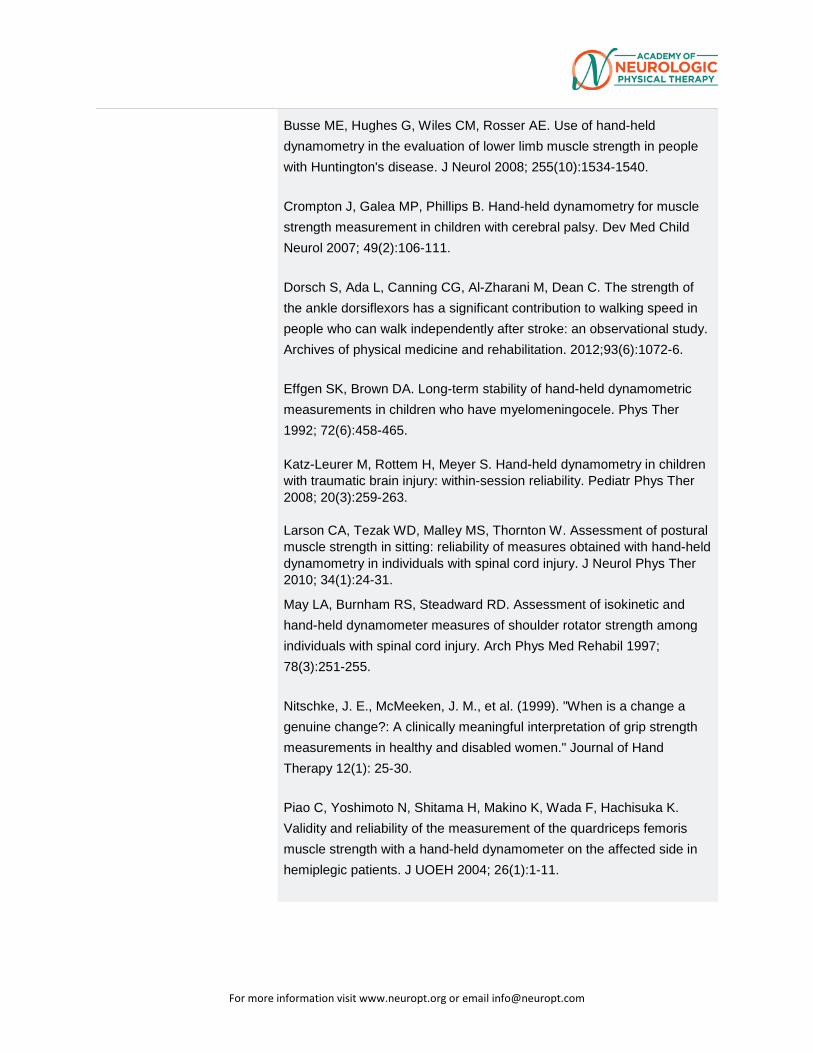
For more information visit www.neuropt.org or email [email protected]
Busse ME, Hughes G, Wiles CM, Rosser AE. Use of hand-held dynamometry in the evaluation of lower limb muscle strength in people with Huntington's disease. J Neurol 2008; 255(10):1534-1540.
Crompton J, Galea MP, Phillips B. Hand-held dynamometry for muscle strength measurement in children with cerebral palsy. Dev Med Child Neurol 2007; 49(2):106-111.
Dorsch S, Ada L, Canning CG, Al-Zharani M, Dean C. The strength of the ankle dorsiflexors has a significant contribution to walking speed in people who can walk independently after stroke: an observational study. Archives of physical medicine and rehabilitation. 2012;93(6):1072-6.
Effgen SK, Brown DA. Long-term stability of hand-held dynamometric measurements in children who have myelomeningocele. Phys Ther 1992; 72(6):458-465.
Katz-Leurer M, Rottem H, Meyer S. Hand-held dynamometry in children with traumatic brain injury: within-session reliability. Pediatr Phys Ther 2008; 20(3):259-263. Larson CA, Tezak WD, Malley MS, Thornton W. Assessment of postural muscle strength in sitting: reliability of measures obtained with hand-held dynamometry in individuals with spinal cord injury. J Neurol Phys Ther 2010; 34(1):24-31.
May LA, Burnham RS, Steadward RD. Assessment of isokinetic and hand-held dynamometer measures of shoulder rotator strength among individuals with spinal cord injury. Arch Phys Med Rehabil 1997; 78(3):251-255.
Nitschke, J. E., McMeeken, J. M., et al. (1999). "When is a change a genuine change?: A clinically meaningful interpretation of grip strength measurements in healthy and disabled women." Journal of Hand Therapy 12(1): 25-30.
Piao C, Yoshimoto N, Shitama H, Makino K, Wada F, Hachisuka K. Validity and reliability of the measurement of the quardriceps femoris muscle strength with a hand-held dynamometer on the affected side in hemiplegic patients. J UOEH 2004; 26(1):1-11.
For more information visit www.neuropt.org or email [email protected]
Reddon, J. R., Stefanyk, W. O., et al. (1985). "Hand dynamometer: effects of trials and sessions." Percept Mot Skills 61(3 Pt 2): 1195-1198. Find it on PubMed
Riddle DL, Finucane SD, Rothstein JM, Walker ML. Intrasession and intersession reliability of hand-held dynamometer measurements taken on brain-damaged patients. Phys Ther 1989; 69(3):182-194.
Roberts, H. C., Denison, H. J., et al. (2011). "A review of the measurement of grip strength in clinical and epidemiological studies: towards a standardised approach." Age Ageing 40(4): 423-429. Find it on PubMed
Sullivan SJ, Chesley A, Hebert G, McFaull S, Scullion D. The validity and reliability of hand-held dynamometry in assessing isometric external rotator performance. J Orthop Sports Phys Ther 1988; 10(6):213-217.
Taylor NF, Dodd KJ, Graham HK. Test-retest reliability of hand-held dynamometric strength testing in young people with cerebral palsy. Arch Phys Med Rehabil 2004; 85(1):77-80.
Wadsworth C, Nielsen DH, Corcoran DS, Phillips CE, Sannes TL. Interrater reliability of hand-held dynamometry: effects of rater gender, body weight, and grip strength. J Orthop Sports Phys Ther 1992; 16(2):74-81.
Year published
Instrument in PDF Format Yes
Approval Status

For more information visit www.neuropt.org or email [email protected]

For more information visit www.neuropt.org or email [email protected]
11. REHAB MEASURES DATABASE—EURO-QUALITY OF LIFE
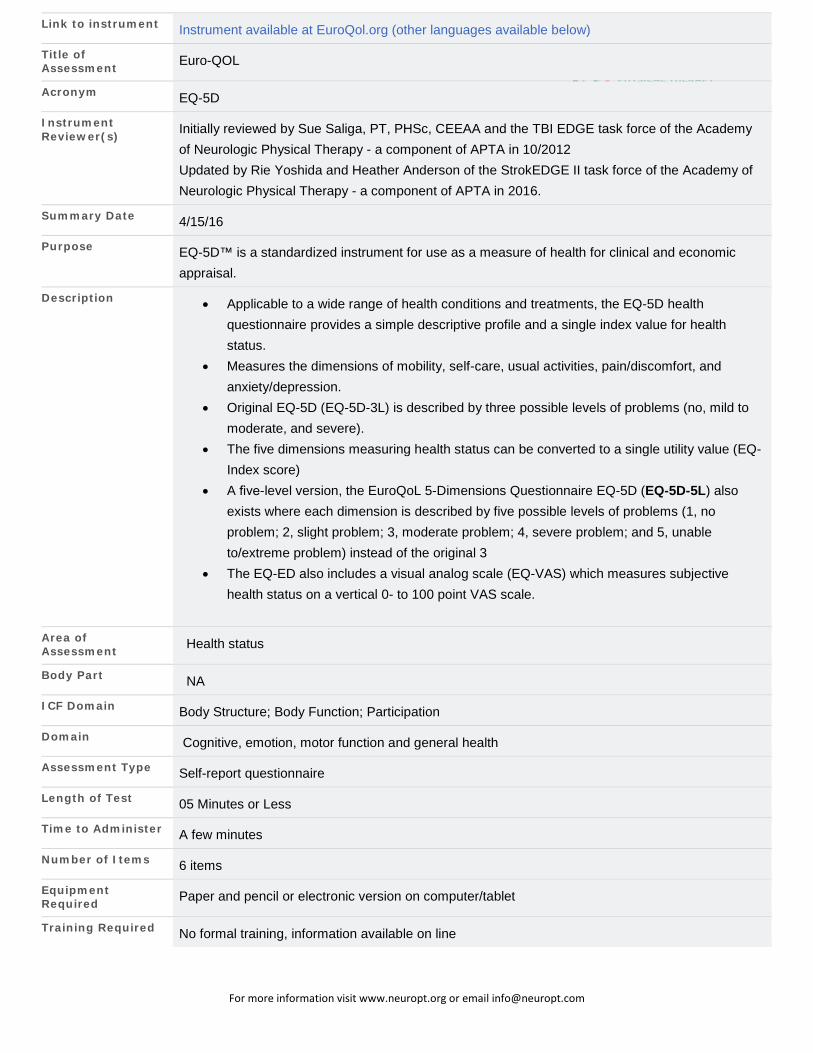
For more information visit www.neuropt.org or email [email protected]
Link to instrument Instrument available at EuroQol.org (other languages available below)
Title of Assessment Euro-QOL
Acronym EQ-5D
Instrument Reviewer(s) Initially reviewed by Sue Saliga, PT, PHSc, CEEAA and the TBI EDGE task force of the Academy
of Neurologic Physical Therapy - a component of APTA in 10/2012 Updated by Rie Yoshida and Heather Anderson of the StrokEDGE II task force of the Academy of Neurologic Physical Therapy - a component of APTA in 2016.
Summary Date 4/15/16
Purpose EQ-5D™ is a standardized instrument for use as a measure of health for clinical and economic appraisal.
Description • Applicable to a wide range of health conditions and treatments, the EQ-5D health questionnaire provides a simple descriptive profile and a single index value for health status.
• Measures the dimensions of mobility, self-care, usual activities, pain/discomfort, and anxiety/depression.
• Original EQ-5D (EQ-5D-3L) is described by three possible levels of problems (no, mild to moderate, and severe).
• The five dimensions measuring health status can be converted to a single utility value (EQ-Index score)
• A five-level version, the EuroQoL 5-Dimensions Questionnaire EQ-5D (EQ-5D-5L) also exists where each dimension is described by five possible levels of problems (1, no problem; 2, slight problem; 3, moderate problem; 4, severe problem; and 5, unable to/extreme problem) instead of the original 3
• The EQ-ED also includes a visual analog scale (EQ-VAS) which measures subjective health status on a vertical 0- to 100 point VAS scale.
Area of Assessment Health status
Body Part NA
ICF Domain Body Structure; Body Function; Participation
Domain Cognitive, emotion, motor function and general health
Assessment Type Self-report questionnaire
Length of Test 05 Minutes or Less
Time to Administer A few minutes
Number of Items 6 items
Equipment Required Paper and pencil or electronic version on computer/tablet
Training Required No formal training, information available on line
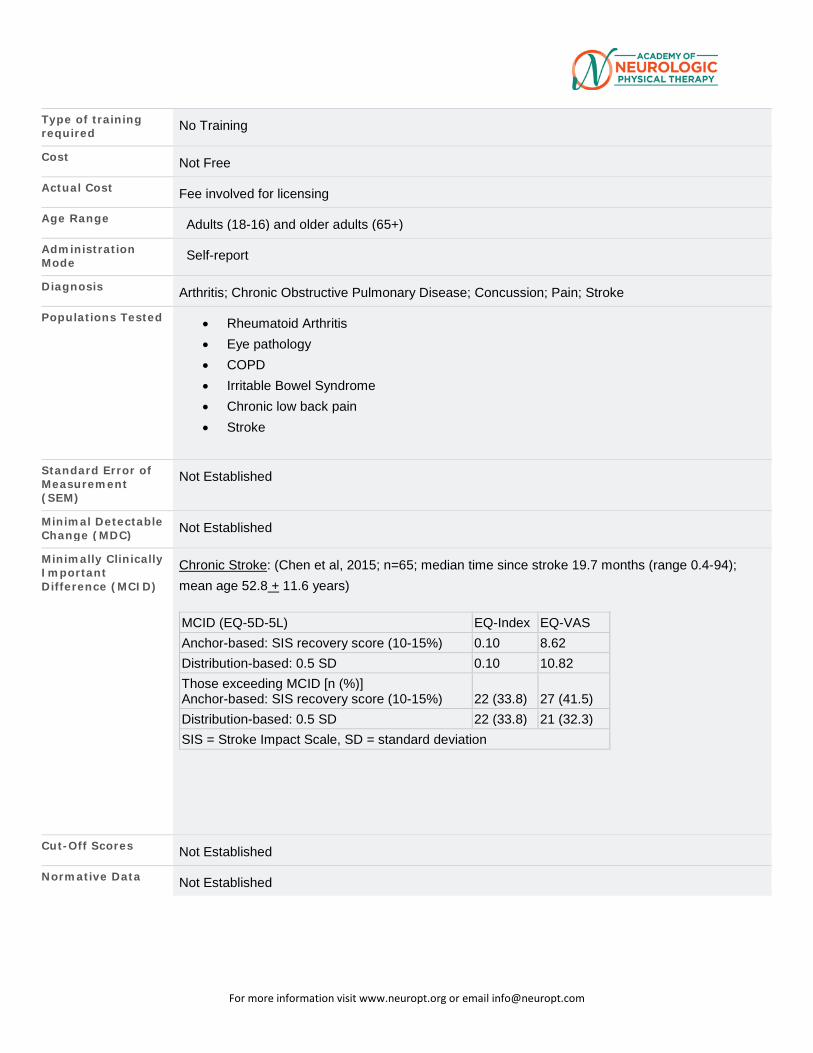
For more information visit www.neuropt.org or email [email protected]
Type of training required No Training
Cost Not Free
Actual Cost Fee involved for licensing
Age Range Adults (18-16) and older adults (65+)
Administration Mode Self-report
Diagnosis Arthritis; Chronic Obstructive Pulmonary Disease; Concussion; Pain; Stroke
Populations Tested • Rheumatoid Arthritis • Eye pathology • COPD • Irritable Bowel Syndrome • Chronic low back pain • Stroke
Standard Error of Measurement (SEM)
Not Established
Minimal Detectable Change (MDC) Not Established
Minimally Clinically Important Difference (MCID)
Chronic Stroke: (Chen et al, 2015; n=65; median time since stroke 19.7 months (range 0.4-94); mean age 52.8 + 11.6 years)
MCID (EQ-5D-5L) EQ-Index EQ-VAS Anchor-based: SIS recovery score (10-15%) 0.10 8.62 Distribution-based: 0.5 SD 0.10 10.82 Those exceeding MCID [n (%)] Anchor-based: SIS recovery score (10-15%)
22 (33.8)
27 (41.5)
Distribution-based: 0.5 SD 22 (33.8) 21 (32.3) SIS = Stroke Impact Scale, SD = standard deviation
Cut-Off Scores Not Established
Normative Data Not Established
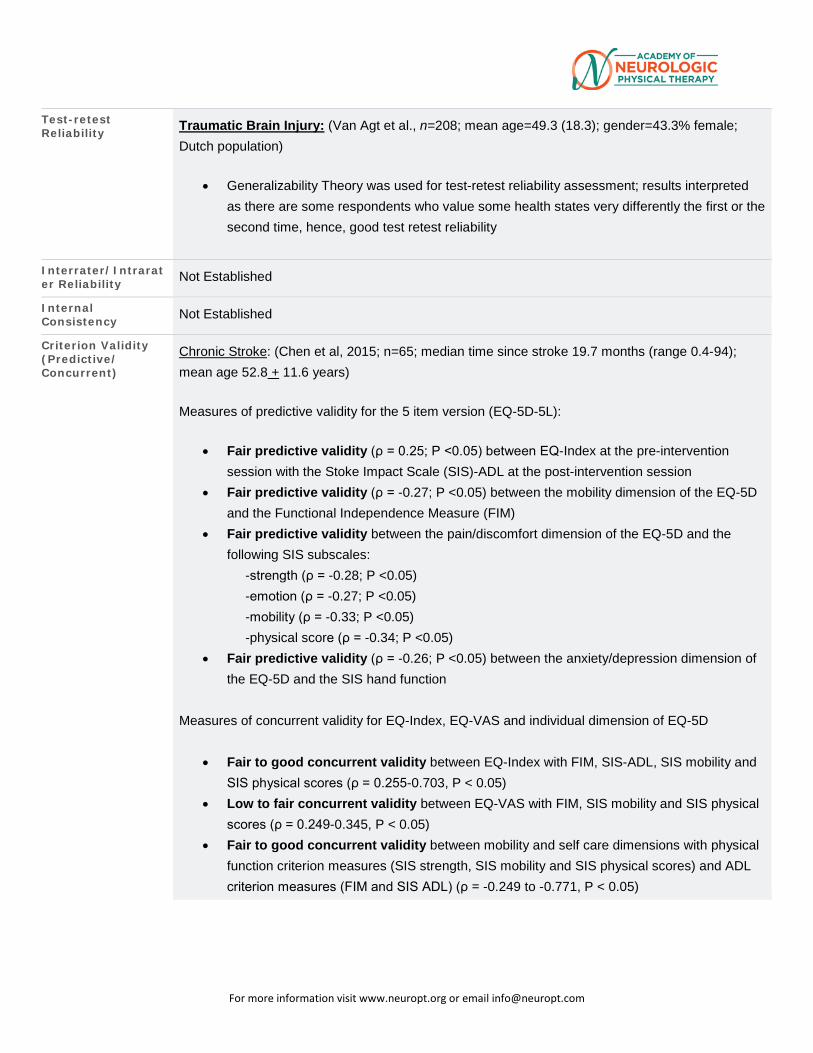
For more information visit www.neuropt.org or email [email protected]
Test-retest Reliability Traumatic Brain Injury: (Van Agt et al., n=208; mean age=49.3 (18.3); gender=43.3% female;
Dutch population)
• Generalizability Theory was used for test-retest reliability assessment; results interpreted as there are some respondents who value some health states very differently the first or the second time, hence, good test retest reliability
Interrater/Intrarater Reliability Not Established
Internal Consistency Not Established
Criterion Validity (Predictive/ Concurrent)
Chronic Stroke: (Chen et al, 2015; n=65; median time since stroke 19.7 months (range 0.4-94); mean age 52.8 + 11.6 years)
Measures of predictive validity for the 5 item version (EQ-5D-5L):
• Fair predictive validity (ρ = 0.25; P <0.05) between EQ-Index at the pre-intervention session with the Stoke Impact Scale (SIS)-ADL at the post-intervention session
• Fair predictive validity (ρ = -0.27; P <0.05) between the mobility dimension of the EQ-5D and the Functional Independence Measure (FIM)
• Fair predictive validity between the pain/discomfort dimension of the EQ-5D and the following SIS subscales: -strength (ρ = -0.28; P <0.05) -emotion (ρ = -0.27; P <0.05) -mobility (ρ = -0.33; P <0.05) -physical score (ρ = -0.34; P <0.05)
• Fair predictive validity (ρ = -0.26; P <0.05) between the anxiety/depression dimension of the EQ-5D and the SIS hand function
Measures of concurrent validity for EQ-Index, EQ-VAS and individual dimension of EQ-5D
• Fair to good concurrent validity between EQ-Index with FIM, SIS-ADL, SIS mobility and SIS physical scores (ρ = 0.255-0.703, P < 0.05)
• Low to fair concurrent validity between EQ-VAS with FIM, SIS mobility and SIS physical scores (ρ = 0.249-0.345, P < 0.05)
• Fair to good concurrent validity between mobility and self care dimensions with physical function criterion measures (SIS strength, SIS mobility and SIS physical scores) and ADL criterion measures (FIM and SIS ADL) (ρ = -0.249 to -0.771, P < 0.05)
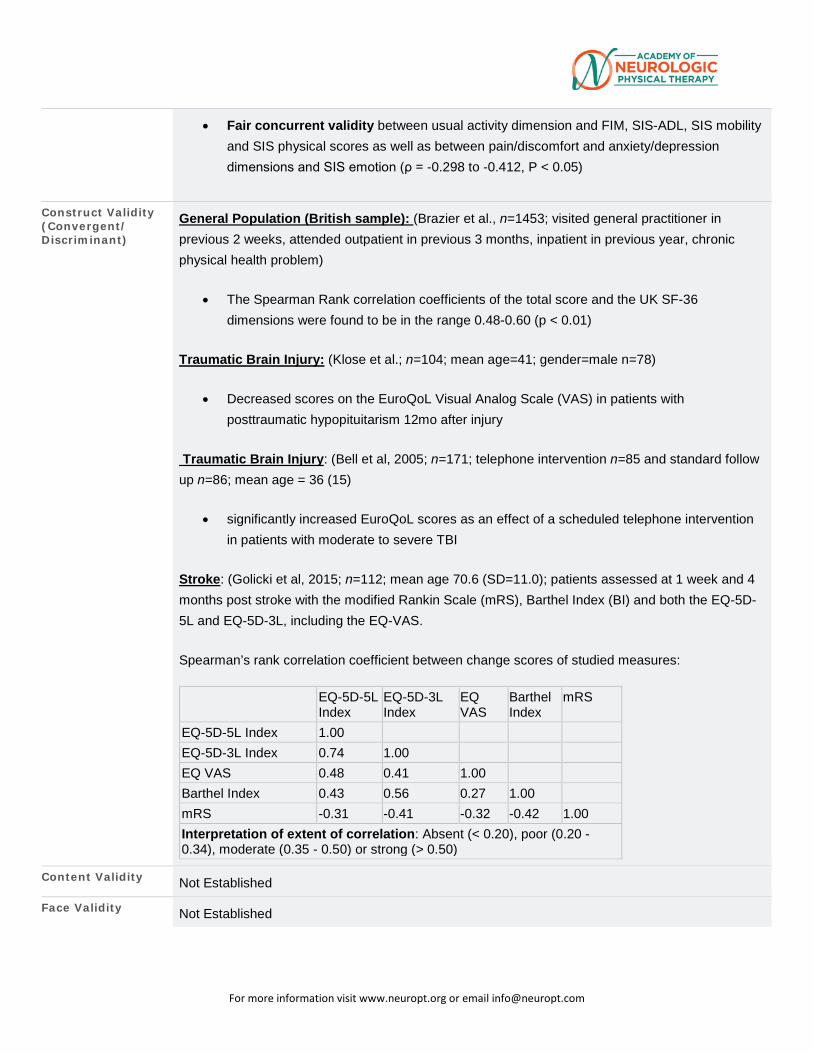
For more information visit www.neuropt.org or email [email protected]
• Fair concurrent validity between usual activity dimension and FIM, SIS-ADL, SIS mobility and SIS physical scores as well as between pain/discomfort and anxiety/depression dimensions and SIS emotion (ρ = -0.298 to -0.412, P < 0.05)
Construct Validity (Convergent/ Discriminant)
General Population (British sample): (Brazier et al., n=1453; visited general practitioner in previous 2 weeks, attended outpatient in previous 3 months, inpatient in previous year, chronic physical health problem)
• The Spearman Rank correlation coefficients of the total score and the UK SF-36 dimensions were found to be in the range 0.48-0.60 (p < 0.01)
Traumatic Brain Injury: (Klose et al.; n=104; mean age=41; gender=male n=78)
• Decreased scores on the EuroQoL Visual Analog Scale (VAS) in patients with posttraumatic hypopituitarism 12mo after injury
Traumatic Brain Injury: (Bell et al, 2005; n=171; telephone intervention n=85 and standard follow up n=86; mean age = 36 (15)
• significantly increased EuroQoL scores as an effect of a scheduled telephone intervention in patients with moderate to severe TBI
Stroke: (Golicki et al, 2015; n=112; mean age 70.6 (SD=11.0); patients assessed at 1 week and 4 months post stroke with the modified Rankin Scale (mRS), Barthel Index (BI) and both the EQ-5D-5L and EQ-5D-3L, including the EQ-VAS.
Spearman’s rank correlation coefficient between change scores of studied measures:
EQ-5D-5L Index
EQ-5D-3L Index
EQ VAS
Barthel Index
mRS
EQ-5D-5L Index 1.00 EQ-5D-3L Index 0.74 1.00 EQ VAS 0.48 0.41 1.00 Barthel Index 0.43 0.56 0.27 1.00 mRS -0.31 -0.41 -0.32 -0.42 1.00 Interpretation of extent of correlation: Absent (< 0.20), poor (0.20 - 0.34), moderate (0.35 - 0.50) or strong (> 0.50)
Content Validity Not Established
Face Validity Not Established
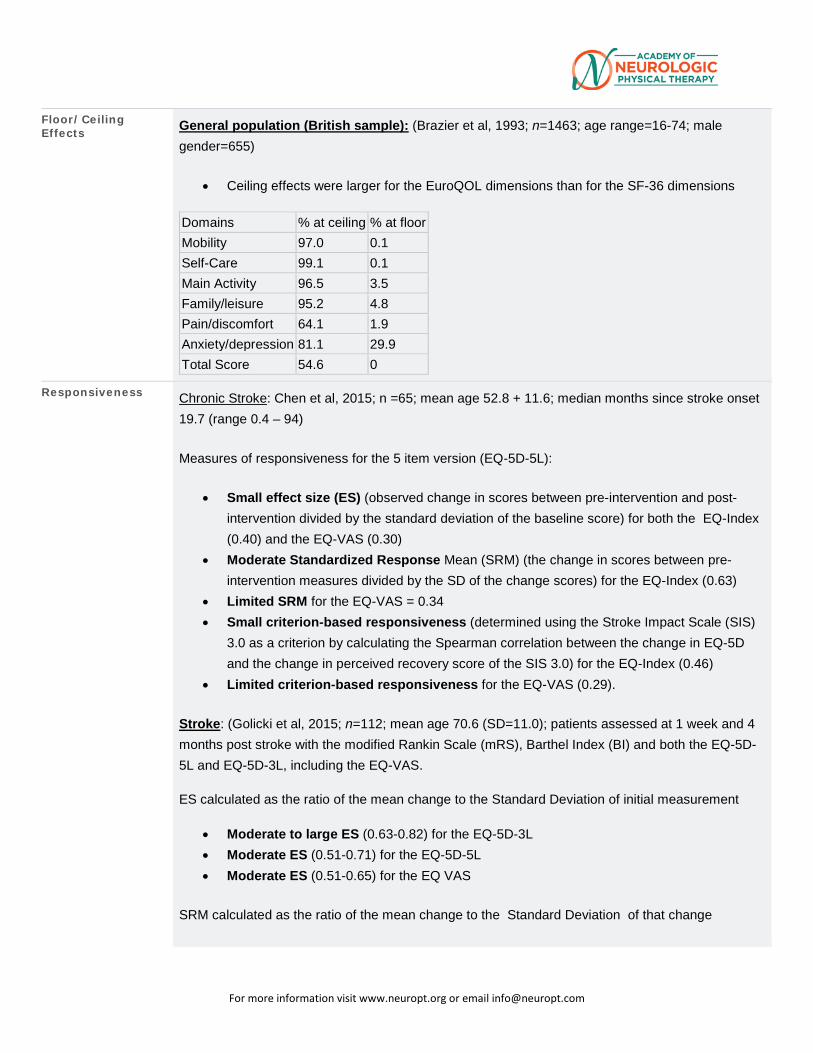
For more information visit www.neuropt.org or email [email protected]
Floor/Ceiling Effects General population (British sample): (Brazier et al, 1993; n=1463; age range=16-74; male
gender=655)
• Ceiling effects were larger for the EuroQOL dimensions than for the SF-36 dimensions
Domains % at ceiling % at floor Mobility 97.0 0.1 Self-Care 99.1 0.1 Main Activity 96.5 3.5 Family/leisure 95.2 4.8 Pain/discomfort 64.1 1.9 Anxiety/depression 81.1 29.9 Total Score 54.6 0
Responsiveness Chronic Stroke: Chen et al, 2015; n =65; mean age 52.8 + 11.6; median months since stroke onset 19.7 (range 0.4 – 94)
Measures of responsiveness for the 5 item version (EQ-5D-5L):
• Small effect size (ES) (observed change in scores between pre-intervention and post-intervention divided by the standard deviation of the baseline score) for both the EQ-Index (0.40) and the EQ-VAS (0.30)
• Moderate Standardized Response Mean (SRM) (the change in scores between pre-intervention measures divided by the SD of the change scores) for the EQ-Index (0.63)
• Limited SRM for the EQ-VAS = 0.34 • Small criterion-based responsiveness (determined using the Stroke Impact Scale (SIS)
3.0 as a criterion by calculating the Spearman correlation between the change in EQ-5D and the change in perceived recovery score of the SIS 3.0) for the EQ-Index (0.46)
• Limited criterion-based responsiveness for the EQ-VAS (0.29).
Stroke: (Golicki et al, 2015; n=112; mean age 70.6 (SD=11.0); patients assessed at 1 week and 4 months post stroke with the modified Rankin Scale (mRS), Barthel Index (BI) and both the EQ-5D-5L and EQ-5D-3L, including the EQ-VAS.
ES calculated as the ratio of the mean change to the Standard Deviation of initial measurement
• Moderate to large ES (0.63-0.82) for the EQ-5D-3L • Moderate ES (0.51-0.71) for the EQ-5D-5L • Moderate ES (0.51-0.65) for the EQ VAS
SRM calculated as the ratio of the mean change to the Standard Deviation of that change
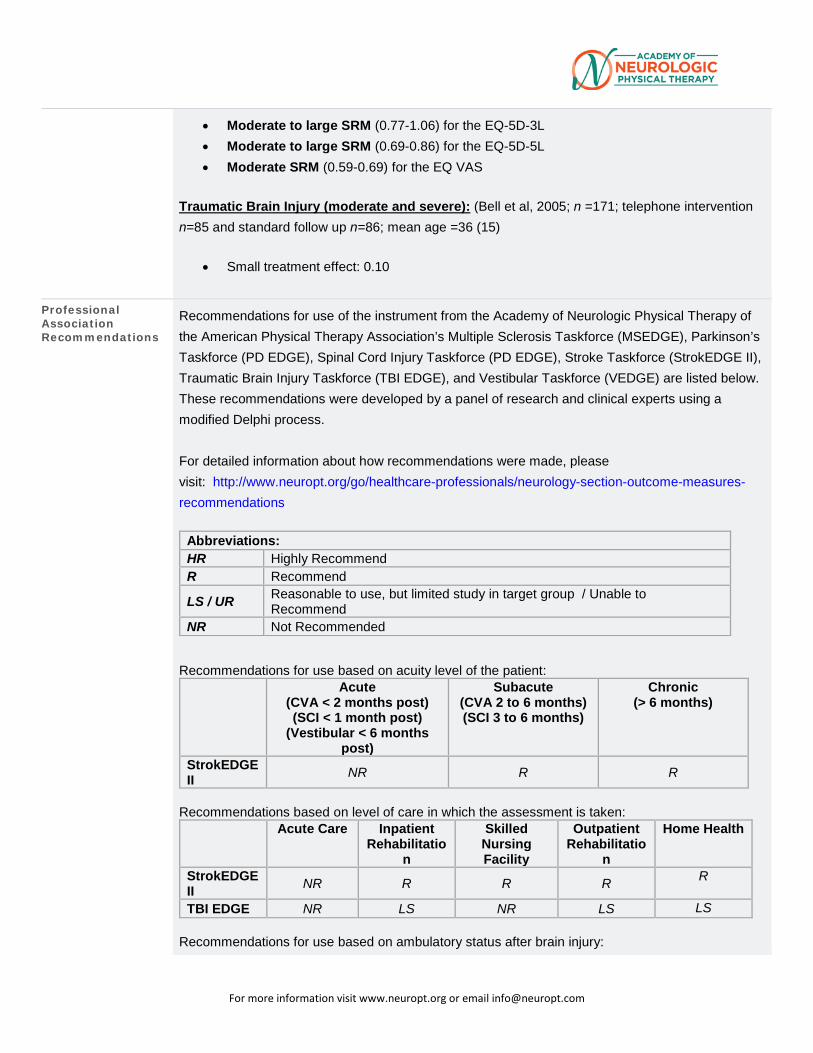
For more information visit www.neuropt.org or email [email protected]
• Moderate to large SRM (0.77-1.06) for the EQ-5D-3L • Moderate to large SRM (0.69-0.86) for the EQ-5D-5L • Moderate SRM (0.59-0.69) for the EQ VAS
Traumatic Brain Injury (moderate and severe): (Bell et al, 2005; n =171; telephone intervention n=85 and standard follow up n=86; mean age =36 (15)
• Small treatment effect: 0.10
Professional Association Recommendations
Recommendations for use of the instrument from the Academy of Neurologic Physical Therapy of the American Physical Therapy Association’s Multiple Sclerosis Taskforce (MSEDGE), Parkinson’s Taskforce (PD EDGE), Spinal Cord Injury Taskforce (PD EDGE), Stroke Taskforce (StrokEDGE II), Traumatic Brain Injury Taskforce (TBI EDGE), and Vestibular Taskforce (VEDGE) are listed below. These recommendations were developed by a panel of research and clinical experts using a modified Delphi process. For detailed information about how recommendations were made, please visit: http://www.neuropt.org/go/healthcare-professionals/neurology-section-outcome-measures-recommendations
Abbreviations: HR Highly Recommend R Recommend LS / UR Reasonable to use, but limited study in target group / Unable to
Recommend NR Not Recommended
Recommendations for use based on acuity level of the patient:
Acute (CVA < 2 months post) (SCI < 1 month post)
(Vestibular < 6 months post)
Subacute (CVA 2 to 6 months) (SCI 3 to 6 months)
Chronic (> 6 months)
StrokEDGE II NR R R
Recommendations based on level of care in which the assessment is taken:
Acute Care Inpatient Rehabilitatio
n
Skilled Nursing Facility
Outpatient Rehabilitatio
n
Home Health
StrokEDGE II NR R R R R
TBI EDGE NR LS NR LS LS Recommendations for use based on ambulatory status after brain injury:
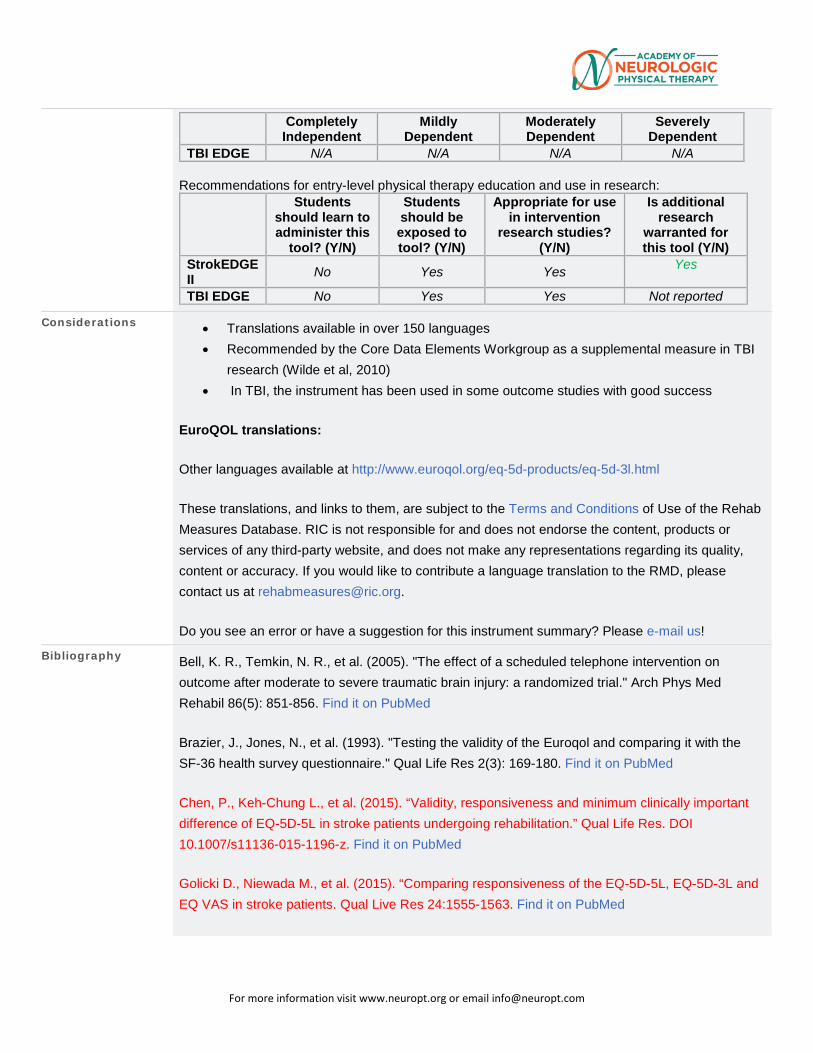
For more information visit www.neuropt.org or email [email protected]
Completely Independent
Mildly Dependent
Moderately Dependent
Severely Dependent
TBI EDGE N/A N/A N/A N/A Recommendations for entry-level physical therapy education and use in research:
Students should learn to administer this
tool? (Y/N)
Students should be exposed to tool? (Y/N)
Appropriate for use in intervention
research studies? (Y/N)
Is additional research
warranted for this tool (Y/N)
StrokEDGE II No Yes Yes Yes
TBI EDGE No Yes Yes Not reported
Considerations • Translations available in over 150 languages • Recommended by the Core Data Elements Workgroup as a supplemental measure in TBI
research (Wilde et al, 2010) • In TBI, the instrument has been used in some outcome studies with good success
EuroQOL translations:
Other languages available at http://www.euroqol.org/eq-5d-products/eq-5d-3l.html
These translations, and links to them, are subject to the Terms and Conditions of Use of the Rehab Measures Database. RIC is not responsible for and does not endorse the content, products or services of any third-party website, and does not make any representations regarding its quality, content or accuracy. If you would like to contribute a language translation to the RMD, please contact us at [email protected].
Do you see an error or have a suggestion for this instrument summary? Please e-mail us!
Bibliography Bell, K. R., Temkin, N. R., et al. (2005). "The effect of a scheduled telephone intervention on outcome after moderate to severe traumatic brain injury: a randomized trial." Arch Phys Med Rehabil 86(5): 851-856. Find it on PubMed
Brazier, J., Jones, N., et al. (1993). "Testing the validity of the Euroqol and comparing it with the SF-36 health survey questionnaire." Qual Life Res 2(3): 169-180. Find it on PubMed
Chen, P., Keh-Chung L., et al. (2015). “Validity, responsiveness and minimum clinically important difference of EQ-5D-5L in stroke patients undergoing rehabilitation.” Qual Life Res. DOI 10.1007/s11136-015-1196-z. Find it on PubMed
Golicki D., Niewada M., et al. (2015). “Comparing responsiveness of the EQ-5D-5L, EQ-5D-3L and EQ VAS in stroke patients. Qual Live Res 24:1555-1563. Find it on PubMed
For more information visit www.neuropt.org or email [email protected]
Klose, M., Watt, T., et al. (2007). "Posttraumatic hypopituitarism is associated with an unfavorable body composition and lipid profile, and decreased quality of life 12 months after injury." J Clin Endocrinol Metab 92(10): 3861-3868. Find it on PubMed
van Agt, H. M., Essink-Bot, M. L., et al. (1994). "Test-retest reliability of health state valuations collected with the EuroQol questionnaire." Soc Sci Med 39(11): 1537-1544. Find it on PubMed
Wilde, E. A., Whiteneck, G. G., et al. (2010). "Recommendations for the use of common outcome measures in traumatic brain injury research." Arch Phys Med Rehabil 91(11): 1650-1660 e1617. Find it on PubMed
Year published
Instrument in PDF Format Yes
Approval Status Approved
For more information visit www.neuropt.org or email [email protected]
12. REHAB MEASURES: FUNCTION IN SITTING TEST
Link to instrument Training and documentation available from Samuel Merrit University's website
Title of Assessment Function in Sitting Test
Acronym FIST
Instrument Reviewer(s) Initially reviewed by Heidi Roth, DHS, PT, NCS and the TBI EDGE task forc of the Academy of Neurologic Physical Therapy - a component of APTA i 5/2012; Reviewed by Michele Sulwer, PT, DPT, NCS and Maggie Bland, P DPT, of the StrokEDGE II Task Force of the Neurology Section, of the APT 02/2017.
Summary Date 11/27/2012; 2/2/2017
Purpose Bedside evaluation of sitting balance stated to evaluate sensory, motor, proactive, reactive and steady state balance factors.
Description • 14 items
• Ordinal Scale (0-4) for each test item:
o 4: Independent, Completes the task independently and successfully
o 3: Needs Cues, Completes the task independently and successfully; may need verbal / tactile cues or more time
o 2: Upper extremity support, Unable to complete task without using upper extremities for support or assistance
o 1: Needs assistance, Unable to complete task successfully without physical assistance
o 0: Complete assistance, Requires complete physical assistance to perform task successfully, is unable to complete task successfully with physical assistance, or dependent
• Testing Instructions:
o One trial of each item is allowed
For more information visit www.neuropt.org or email [email protected]
o Verbal directions and demonstration are given as needed by the therapist
o Standard Position: Individual seated at edge of hospital bed with half of upper leg supported (neutral abd/adduction / rotation), hips and knees at 90 degrees and feet flat in support
o Hands are placed in lap unless needed for support
o See Gorman et al, 2010 for measure
Area of Assessment Balance Non-Vestibular
Body Part
ICF Domain Activity
Domain
Assessment Type Performance Measure
Length of Test 06 to 30 Minutes
Time to Administer Less than 15 minutes
Number of Items 14
Equipment Required • Standard hospital bed (without air mattress)
• Stopwatch
Training Required
Type of training required
Cost Free
Actual Cost Free
Age Range
Administration Mode
For more information visit www.neuropt.org or email [email protected]
Diagnosis Stroke; Traumatic Brain Injury
Populations Tested • Acute Stroke
• Population-based, inpatient sample of adults with sitting balance dysfunction, excluding persons with SCI, signigicant bracing/orthotics, and inability to perform testing safely
Standard Error of Measurement (SEM)
Acute Stroke: (Gorman et al, 2010; n=31, age 61.5 (10.9) years, <=3 months post stroke, Modified Rankin Scale of moderate / moderately severe / severe)
• SEM= 2.03
Adults With Sitting Balance Dysfunction: (Gorman, Harro, Platko and Greenwald, 2014, n=125, age=60.0 (16.6) years)
• SEM= 1.40
Balance Participants: (Gorman, Rivera, and McCarthy, 2014) (n=6; Mean Age= 68.7) ***Medical diagnoses of the balance participants included Parkinson’s disease (n=1), multiple sclerosis (n=1), and cerebrovascular accident (n=5).
• SEM= 3.58
Minimal Detectable Change (MDC) Acute Stroke: (Calculated from Gorman et al, 2010)
• MDC=5.63
Adults With Sitting Balance Dysfunction: (Gorman, Harro, Platko & Greenwald, 2014)
• MDC=5.5
Minimally Clinically Important Difference (MCID)
Adults With Sitting Balance Dysfunction: (Gorman, Harro, Platko & Greenwald, 2014)
• MCID> 6.5
Cut-Off Scores Not Established
Normative Data Not Established
Test-retest Reliability Balance Participants: (Gorman, Rivera, and McCarthy, 2014), n=6; mean age = 68.7
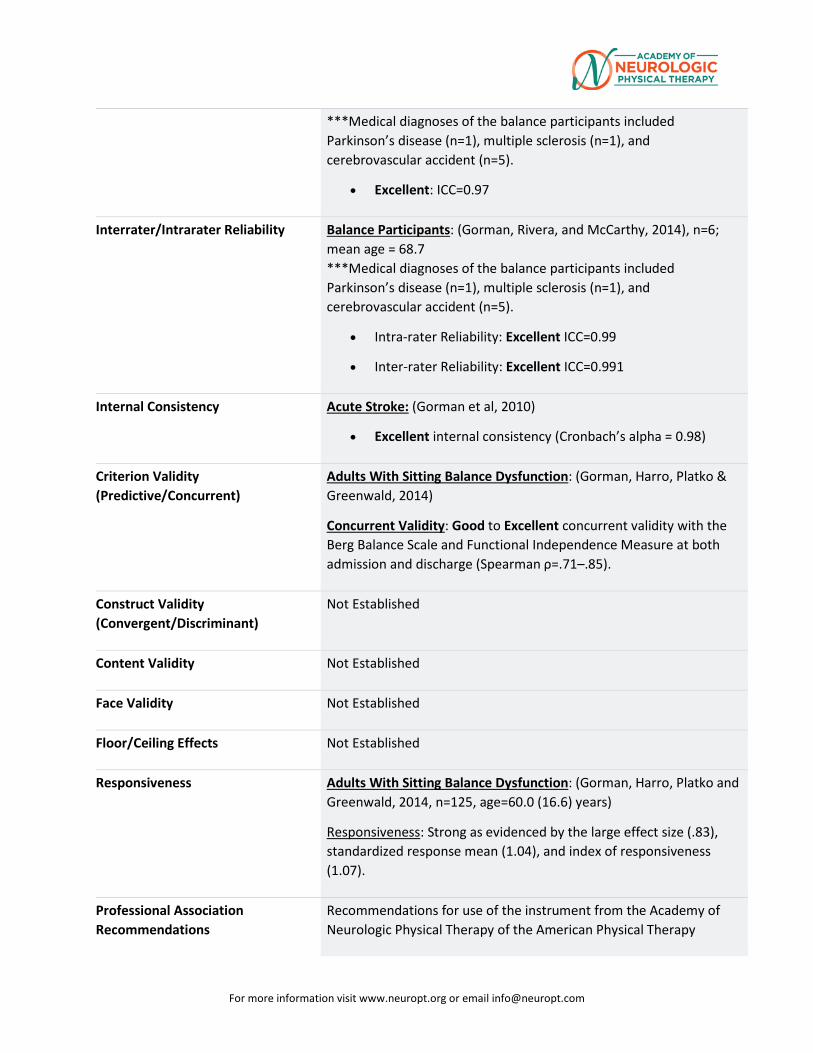
For more information visit www.neuropt.org or email [email protected]
***Medical diagnoses of the balance participants included Parkinson’s disease (n=1), multiple sclerosis (n=1), and cerebrovascular accident (n=5).
• Excellent: ICC=0.97
Interrater/Intrarater Reliability Balance Participants: (Gorman, Rivera, and McCarthy, 2014), n=6; mean age = 68.7 ***Medical diagnoses of the balance participants included Parkinson’s disease (n=1), multiple sclerosis (n=1), and cerebrovascular accident (n=5).
• Intra-rater Reliability: Excellent ICC=0.99
• Inter-rater Reliability: Excellent ICC=0.991
Internal Consistency Acute Stroke: (Gorman et al, 2010)
• Excellent internal consistency (Cronbach’s alpha = 0.98)
Criterion Validity (Predictive/Concurrent)
Adults With Sitting Balance Dysfunction: (Gorman, Harro, Platko & Greenwald, 2014)
Concurrent Validity: Good to Excellent concurrent validity with the Berg Balance Scale and Functional Independence Measure at both admission and discharge (Spearman ρ=.71–.85).
Construct Validity (Convergent/Discriminant)
Not Established
Content Validity Not Established
Face Validity Not Established
Floor/Ceiling Effects Not Established
Responsiveness Adults With Sitting Balance Dysfunction: (Gorman, Harro, Platko and Greenwald, 2014, n=125, age=60.0 (16.6) years)
Responsiveness: Strong as evidenced by the large effect size (.83), standardized response mean (1.04), and index of responsiveness (1.07).
Professional Association Recommendations
Recommendations for use of the instrument from the Academy of Neurologic Physical Therapy of the American Physical Therapy
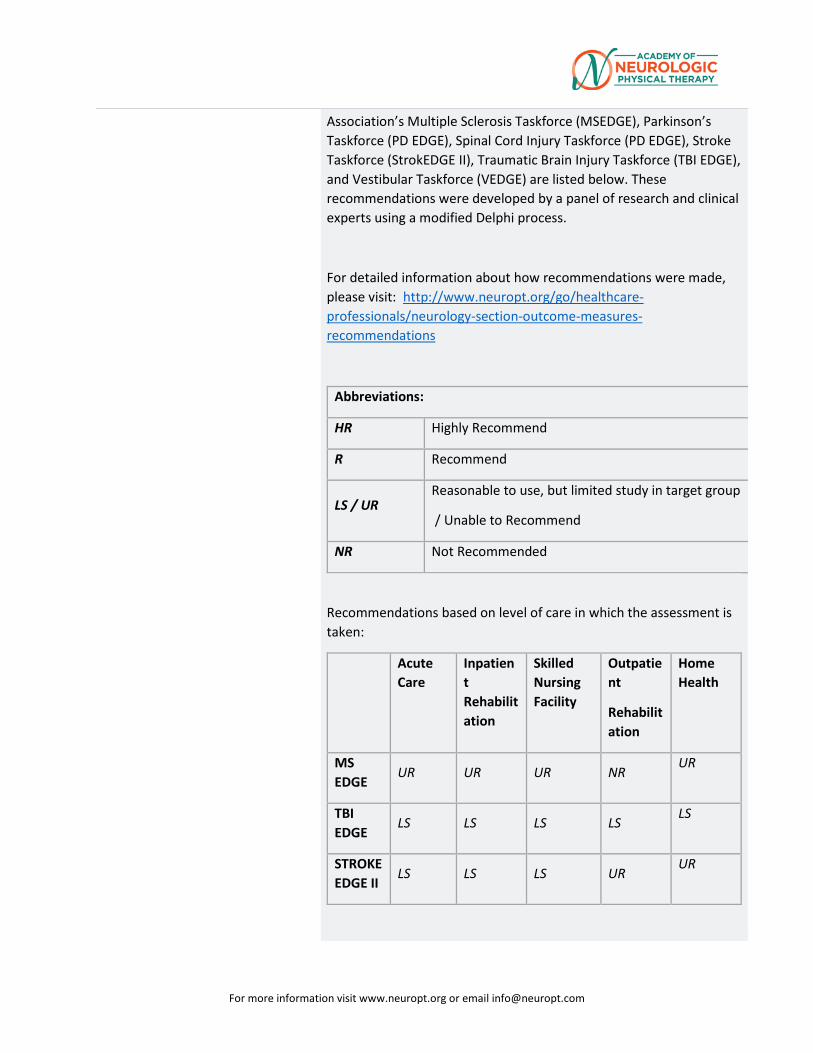
For more information visit www.neuropt.org or email [email protected]
Association’s Multiple Sclerosis Taskforce (MSEDGE), Parkinson’s Taskforce (PD EDGE), Spinal Cord Injury Taskforce (PD EDGE), Stroke Taskforce (StrokEDGE II), Traumatic Brain Injury Taskforce (TBI EDGE), and Vestibular Taskforce (VEDGE) are listed below. These recommendations were developed by a panel of research and clinical experts using a modified Delphi process.
For detailed information about how recommendations were made, please visit: http://www.neuropt.org/go/healthcare-professionals/neurology-section-outcome-measures-recommendations
Abbreviations:
HR Highly Recommend
R Recommend
LS / UR Reasonable to use, but limited study in target group
/ Unable to Recommend
NR Not Recommended
Recommendations based on level of care in which the assessment is taken:
Acute Care
Inpatient Rehabilitation
Skilled Nursing Facility
Outpatient
Rehabilitation
Home Health
MS EDGE
UR UR UR NR UR
TBI EDGE
LS LS LS LS LS
STROKE EDGE II
LS LS LS UR UR
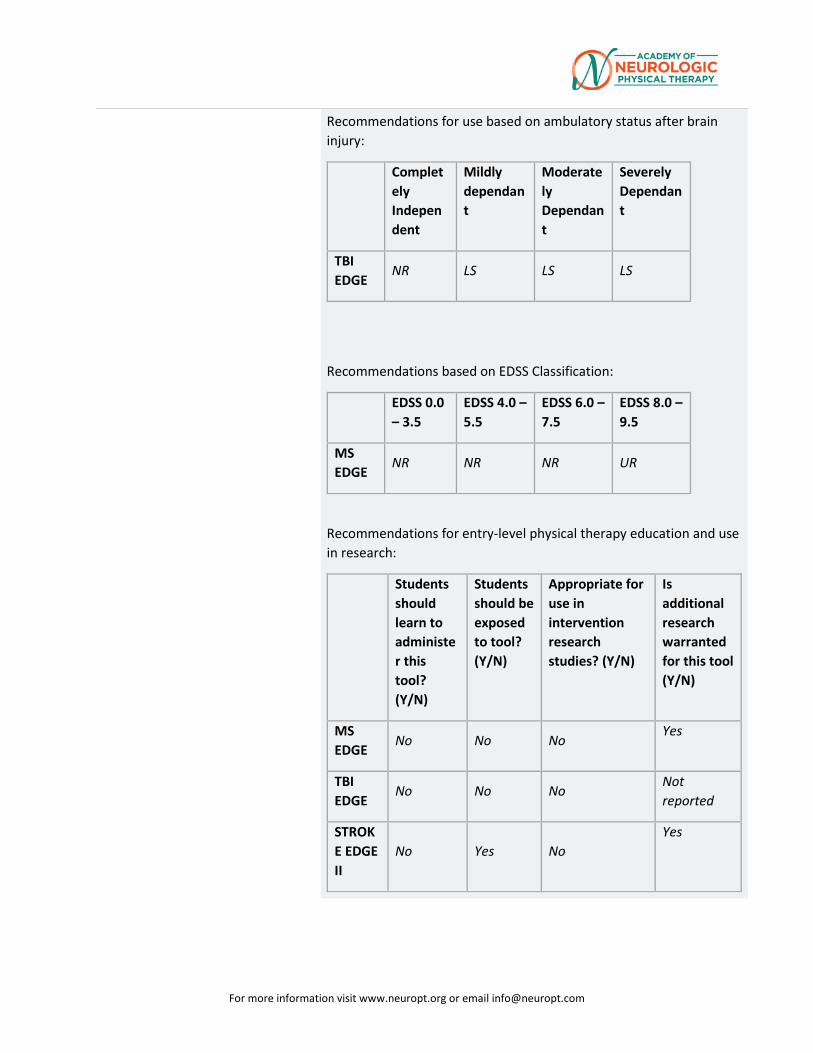
For more information visit www.neuropt.org or email [email protected]
Recommendations for use based on ambulatory status after brain injury:
Completely Independent
Mildly dependant
Moderately Dependant
Severely Dependant
TBI EDGE
NR LS LS LS
Recommendations based on EDSS Classification:
EDSS 0.0 – 3.5
EDSS 4.0 – 5.5
EDSS 6.0 – 7.5
EDSS 8.0 – 9.5
MS EDGE
NR NR NR UR
Recommendations for entry-level physical therapy education and use in research:
Students should learn to administer this tool? (Y/N)
Students should be exposed to tool? (Y/N)
Appropriate for use in intervention research studies? (Y/N)
Is additional research warranted for this tool (Y/N)
MS EDGE
No No No Yes
TBI EDGE
No No No Not reported
STROKE EDGE II
No Yes No Yes
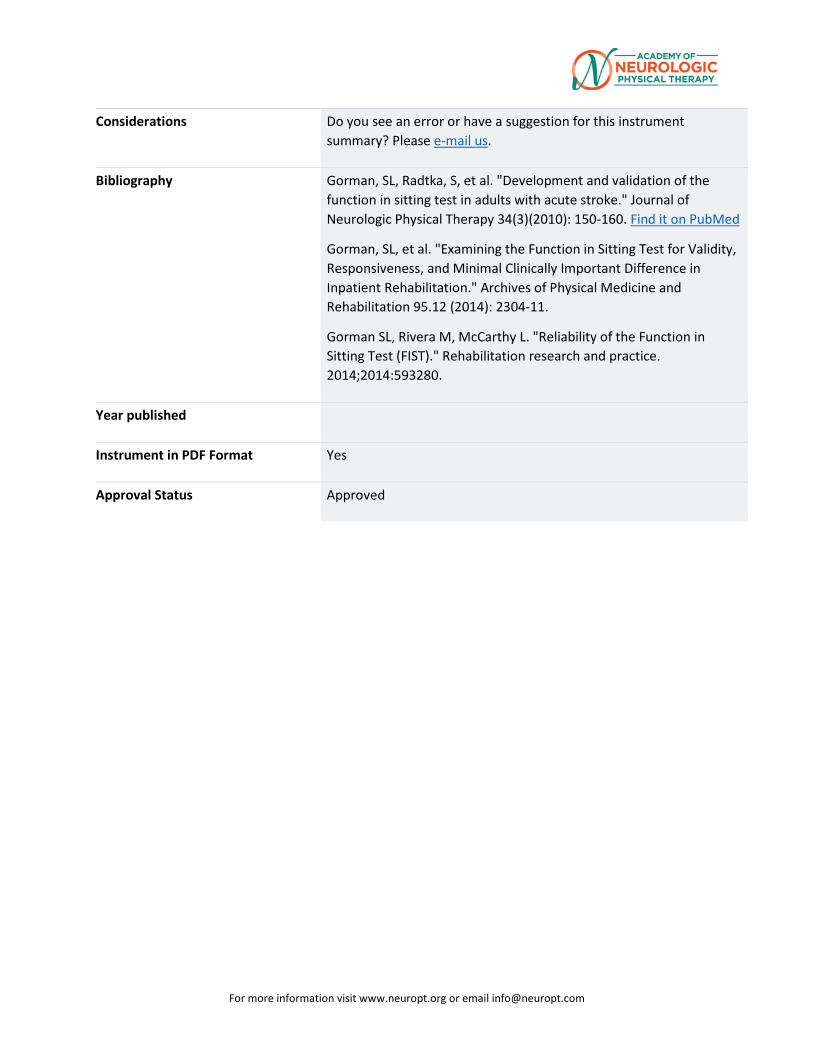
For more information visit www.neuropt.org or email [email protected]
Considerations Do you see an error or have a suggestion for this instrument summary? Please e-mail us.
Bibliography Gorman, SL, Radtka, S, et al. "Development and validation of the function in sitting test in adults with acute stroke." Journal of Neurologic Physical Therapy 34(3)(2010): 150-160. Find it on PubMed
Gorman, SL, et al. "Examining the Function in Sitting Test for Validity, Responsiveness, and Minimal Clinically Important Difference in Inpatient Rehabilitation." Archives of Physical Medicine and Rehabilitation 95.12 (2014): 2304-11.
Gorman SL, Rivera M, McCarthy L. "Reliability of the Function in Sitting Test (FIST)." Rehabilitation research and practice. 2014;2014:593280.
Year published
Instrument in PDF Format Yes
Approval Status Approved
For more information visit www.neuropt.org or email [email protected]
13. REHAB MEASURES DATABASE—FUNCTIONAL INDEPENDENCE MEASURE (FIM)
Link to instrument Uniform Data System for Medical Rehabilitation (external link)
Title of Assessment FIM® instrument (FIM); FIM® is a trademark of the Uniform Data System fro Medical Rehabilitation, a division of UB Foundation Activities, Inc.
Acronym
Instrument Reviewer(s) Initially reviewed by the Rehabilitation Measures Team; Updated by Eileen Tseng, PT, DPT, NCS, Rachel Tappan, PT, NCS, and the SCI EDGE task force of the Academy of Neurologic Physical Therapy - a component of APTA in 2012; Updated by Tammie Keller, PT, DPT, MS and the TBI EDGE task force of the Academy of Neurologic Physical Therapy - a component of APTA; Updated by Deb Kegelmeyer, PT, DPT, MS, GCS and the PD EDGE task force of the Academy of Neurologic Physical Therapy - a component of APTA in 2013. Updated by Maggie Bland, PT, DPT, NCS and Nancy Byl PT, MPH, PhD, FAPTA and the Stroke Edge II Task Force in 2016.
Summary Date 10/6/2015; 9/27/16
Purpose Provides a uniform system of measurement for disability based on the International Classification of Impairment, Disabilities and Handicaps; measures the level of a patient's disability and indicates how much assistance is required for the individual to carry out activities of daily living.
Description Contains 18 items composed of:
13 motor tasks
5 cognitive tasks (considered basic activities of daily living)
Tasks are rated on a 7 point ordinal scale that ranges from total assistance (or complete dependence) to complete independence
Scores range from 18 (lowest) to 126 (highest) indicating level of function
Scores are generally rated at admission and discharge
Dimensions assessed include:
Eating
Grooming
For more information visit www.neuropt.org or email [email protected]
Bathing
Upper body dressing
Lower body dressing
Toileting
Bladder management
Bowel management
Bed to chair transfer
Toilet transfer
Shower transfer
Locomotion (ambulatory or wheelchair level)
Stairs
Cognitive comprehension
Expression
Social interaction
Problem solving
Memory
FIM Instrument Scoring Criteria: (refer to the users manual for more information)
FIM Instrument Scoring Criteria:
No Helper Required
Score Description
7 Complete Independence
6 Modified Independence (patient requires use of a device, but no physical assistance)
Helper (Modified Dependence)
Score Description
5 Supervision or Setup
4 Minimal Contact Assistance (patient can perform 75% or more of task)
For more information visit www.neuropt.org or email [email protected]
3 Moderate Assistance (patient can perform 50% to 74% of task)
Helper (Complete Dependence)
Score Description
2 Maximal Assistance (patient can perform 25% to 49% of taks)
1 Total assistance (patient can perform less than 25% of the task or requires more than one person to assist)
Area of Assessment Activities of Daily Living
Body Part Not Applicable
ICF Domain Activity
Domain ADL; Cognition; Motor
Assessment Type Observer
Length of Test 31 to 60 Minutes
Time to Administer 30-45 minutes
Number of Items 18
Equipment Required May vary based on level and impairment category measured.
Training Required Yes, certification in administering the FIM instrument is required prior to use. Training is available through UDSMR at: www.udsmr.org.
Type of training required
Reading an Article/Manual
Cost Not Free
Actual Cost A license to use the FIM instrument may be obtained at: http://www.udsmr.org.
For more information visit www.neuropt.org or email [email protected]
Fees vary depending upon type of use.
Age Range Adult: 18-64 years; Elderly adult: 65+
Administration Mode Paper/Pencil
Diagnosis Geriatrics; Multiple Sclerosis; Pain; Spinal Cord Injury; Stroke
Populations Tested Brain Injury
Geriatrics
Multiple Sclerosis
Orthopedic Conditions including Low Back Pain
Parkinson's Disease
Spinal Cord Injury
Stroke
Standard Error of Measurement (SEM)
Not Established
Minimal Detectable Change (MDC)
Not Established
Minimally Clinically Important Difference (MCID)
Stroke:
(Beninato et al, 2006; n = 113; mean age = 63.9 (14.3) years; mean FIM score at admission = 63.4 (24.4) points, Acute Stroke)
FIM Total Score = 22 points
FIM Motor Subscale = 17 points
FIM Cognitive Subscale = 3 points
Cut-Off Scores Not Established
Normative Data SCI:
(Hall et al, 1999; cross-sectional data from SCI Model Systems National Database; average of 8 days post injury [SD = 13 days]; sample size varying pending time post injury, Acute SCI)
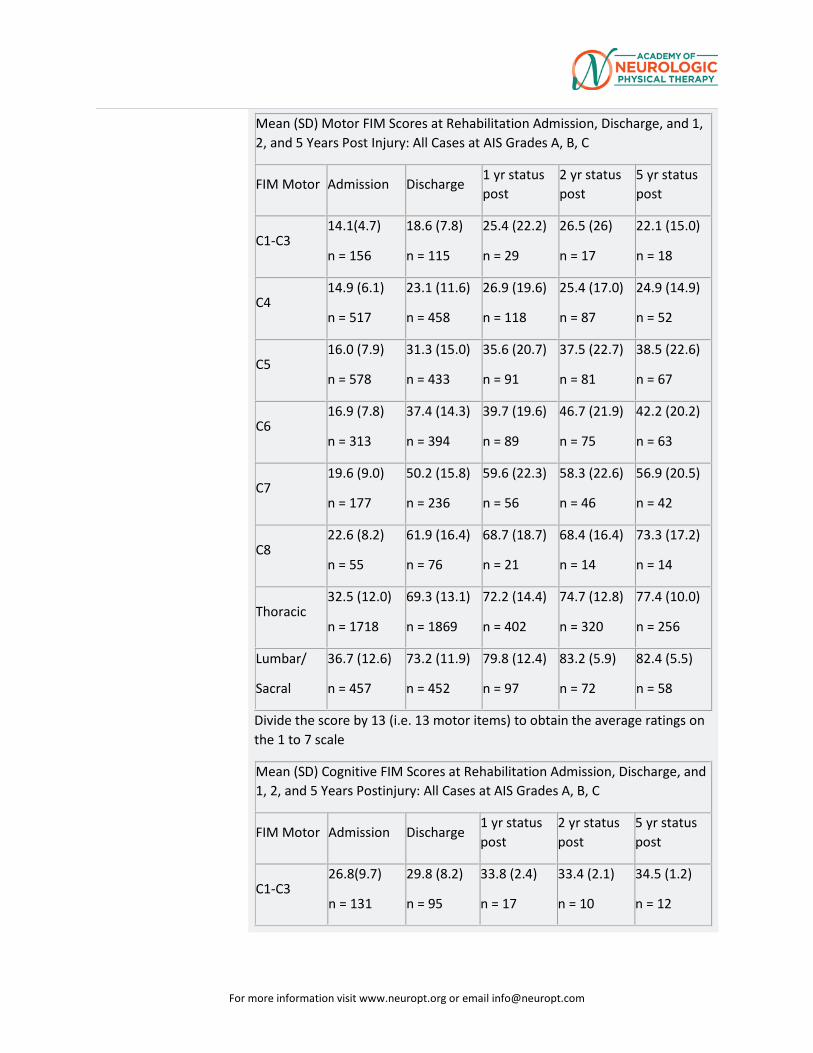
For more information visit www.neuropt.org or email [email protected]
Mean (SD) Motor FIM Scores at Rehabilitation Admission, Discharge, and 1, 2, and 5 Years Post Injury: All Cases at AIS Grades A, B, C
FIM Motor Admission Discharge 1 yr status post
2 yr status post
5 yr status post
C1-C3 14.1(4.7)
n = 156
18.6 (7.8)
n = 115
25.4 (22.2)
n = 29
26.5 (26)
n = 17
22.1 (15.0)
n = 18
C4 14.9 (6.1)
n = 517
23.1 (11.6)
n = 458
26.9 (19.6)
n = 118
25.4 (17.0)
n = 87
24.9 (14.9)
n = 52
C5 16.0 (7.9)
n = 578
31.3 (15.0)
n = 433
35.6 (20.7)
n = 91
37.5 (22.7)
n = 81
38.5 (22.6)
n = 67
C6 16.9 (7.8)
n = 313
37.4 (14.3)
n = 394
39.7 (19.6)
n = 89
46.7 (21.9)
n = 75
42.2 (20.2)
n = 63
C7 19.6 (9.0)
n = 177
50.2 (15.8)
n = 236
59.6 (22.3)
n = 56
58.3 (22.6)
n = 46
56.9 (20.5)
n = 42
C8 22.6 (8.2)
n = 55
61.9 (16.4)
n = 76
68.7 (18.7)
n = 21
68.4 (16.4)
n = 14
73.3 (17.2)
n = 14
Thoracic 32.5 (12.0)
n = 1718
69.3 (13.1)
n = 1869
72.2 (14.4)
n = 402
74.7 (12.8)
n = 320
77.4 (10.0)
n = 256
Lumbar/
Sacral
36.7 (12.6)
n = 457
73.2 (11.9)
n = 452
79.8 (12.4)
n = 97
83.2 (5.9)
n = 72
82.4 (5.5)
n = 58
Divide the score by 13 (i.e. 13 motor items) to obtain the average ratings on the 1 to 7 scale
Mean (SD) Cognitive FIM Scores at Rehabilitation Admission, Discharge, and 1, 2, and 5 Years Postinjury: All Cases at AIS Grades A, B, C
FIM Motor Admission Discharge 1 yr status post
2 yr status post
5 yr status post
C1-C3 26.8(9.7)
n = 131
29.8 (8.2)
n = 95
33.8 (2.4)
n = 17
33.4 (2.1)
n = 10
34.5 (1.2)
n = 12
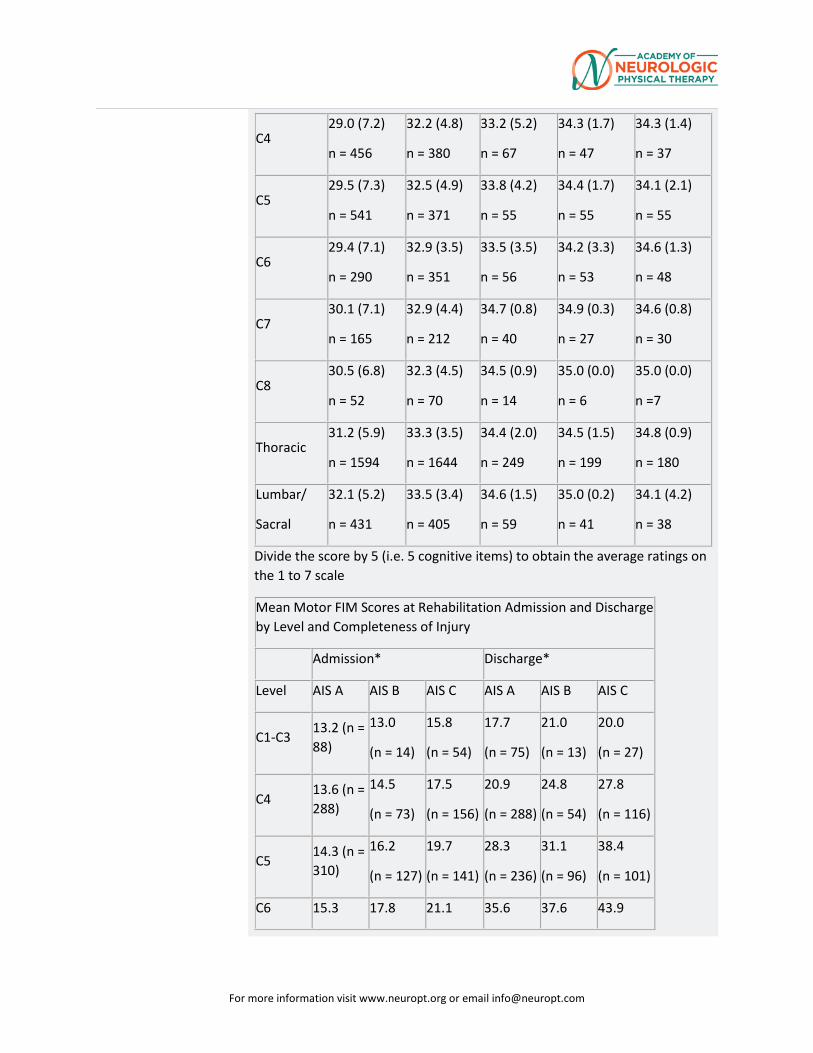
For more information visit www.neuropt.org or email [email protected]
C4 29.0 (7.2)
n = 456
32.2 (4.8)
n = 380
33.2 (5.2)
n = 67
34.3 (1.7)
n = 47
34.3 (1.4)
n = 37
C5 29.5 (7.3)
n = 541
32.5 (4.9)
n = 371
33.8 (4.2)
n = 55
34.4 (1.7)
n = 55
34.1 (2.1)
n = 55
C6 29.4 (7.1)
n = 290
32.9 (3.5)
n = 351
33.5 (3.5)
n = 56
34.2 (3.3)
n = 53
34.6 (1.3)
n = 48
C7 30.1 (7.1)
n = 165
32.9 (4.4)
n = 212
34.7 (0.8)
n = 40
34.9 (0.3)
n = 27
34.6 (0.8)
n = 30
C8 30.5 (6.8)
n = 52
32.3 (4.5)
n = 70
34.5 (0.9)
n = 14
35.0 (0.0)
n = 6
35.0 (0.0)
n =7
Thoracic 31.2 (5.9)
n = 1594
33.3 (3.5)
n = 1644
34.4 (2.0)
n = 249
34.5 (1.5)
n = 199
34.8 (0.9)
n = 180
Lumbar/
Sacral
32.1 (5.2)
n = 431
33.5 (3.4)
n = 405
34.6 (1.5)
n = 59
35.0 (0.2)
n = 41
34.1 (4.2)
n = 38
Divide the score by 5 (i.e. 5 cognitive items) to obtain the average ratings on the 1 to 7 scale
Mean Motor FIM Scores at Rehabilitation Admission and Discharge by Level and Completeness of Injury
Admission* Discharge*
Level AIS A AIS B AIS C AIS A AIS B AIS C
C1-C3 13.2 (n = 88)
13.0
(n = 14)
15.8
(n = 54)
17.7
(n = 75)
21.0
(n = 13)
20.0
(n = 27)
C4 13.6 (n = 288)
14.5
(n = 73)
17.5
(n = 156)
20.9
(n = 288)
24.8
(n = 54)
27.8
(n = 116)
C5 14.3 (n = 310)
16.2
(n = 127)
19.7
(n = 141)
28.3
(n = 236)
31.1
(n = 96)
38.4
(n = 101)
C6 15.3 17.8 21.1 35.6 37.6 43.9
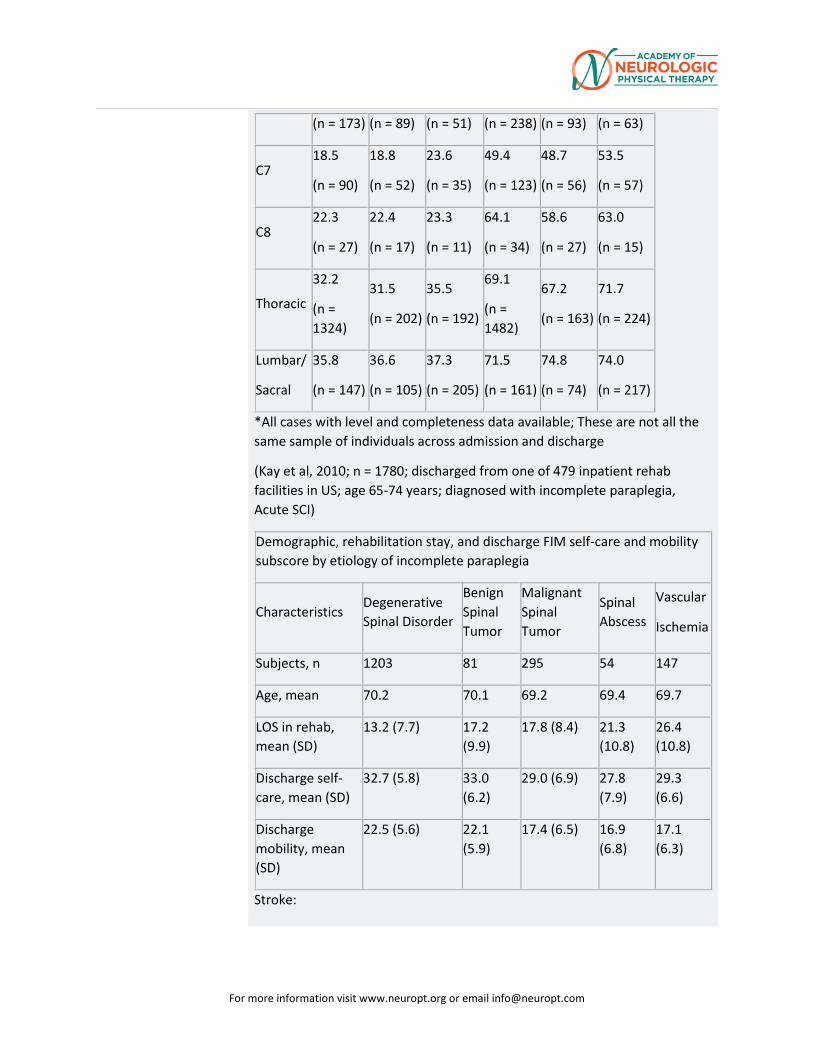
For more information visit www.neuropt.org or email [email protected]
(n = 173) (n = 89) (n = 51) (n = 238) (n = 93) (n = 63)
C7 18.5
(n = 90)
18.8
(n = 52)
23.6
(n = 35)
49.4
(n = 123)
48.7
(n = 56)
53.5
(n = 57)
C8 22.3
(n = 27)
22.4
(n = 17)
23.3
(n = 11)
64.1
(n = 34)
58.6
(n = 27)
63.0
(n = 15)
Thoracic
32.2
(n = 1324)
31.5
(n = 202)
35.5
(n = 192)
69.1
(n = 1482)
67.2
(n = 163)
71.7
(n = 224)
Lumbar/
Sacral
35.8
(n = 147)
36.6
(n = 105)
37.3
(n = 205)
71.5
(n = 161)
74.8
(n = 74)
74.0
(n = 217)
*All cases with level and completeness data available; These are not all the same sample of individuals across admission and discharge
(Kay et al, 2010; n = 1780; discharged from one of 479 inpatient rehab facilities in US; age 65-74 years; diagnosed with incomplete paraplegia, Acute SCI)
Demographic, rehabilitation stay, and discharge FIM self-care and mobility subscore by etiology of incomplete paraplegia
Characteristics Degenerative Spinal Disorder
Benign Spinal Tumor
Malignant Spinal Tumor
Spinal Abscess
Vascular
Ischemia
Subjects, n 1203 81 295 54 147
Age, mean 70.2 70.1 69.2 69.4 69.7
LOS in rehab, mean (SD)
13.2 (7.7) 17.2 (9.9)
17.8 (8.4) 21.3 (10.8)
26.4 (10.8)
Discharge self-care, mean (SD)
32.7 (5.8) 33.0 (6.2)
29.0 (6.9) 27.8 (7.9)
29.3 (6.6)
Discharge mobility, mean (SD)
22.5 (5.6) 22.1 (5.9)
17.4 (6.5) 16.9 (6.8)
17.1 (6.3)
Stroke:
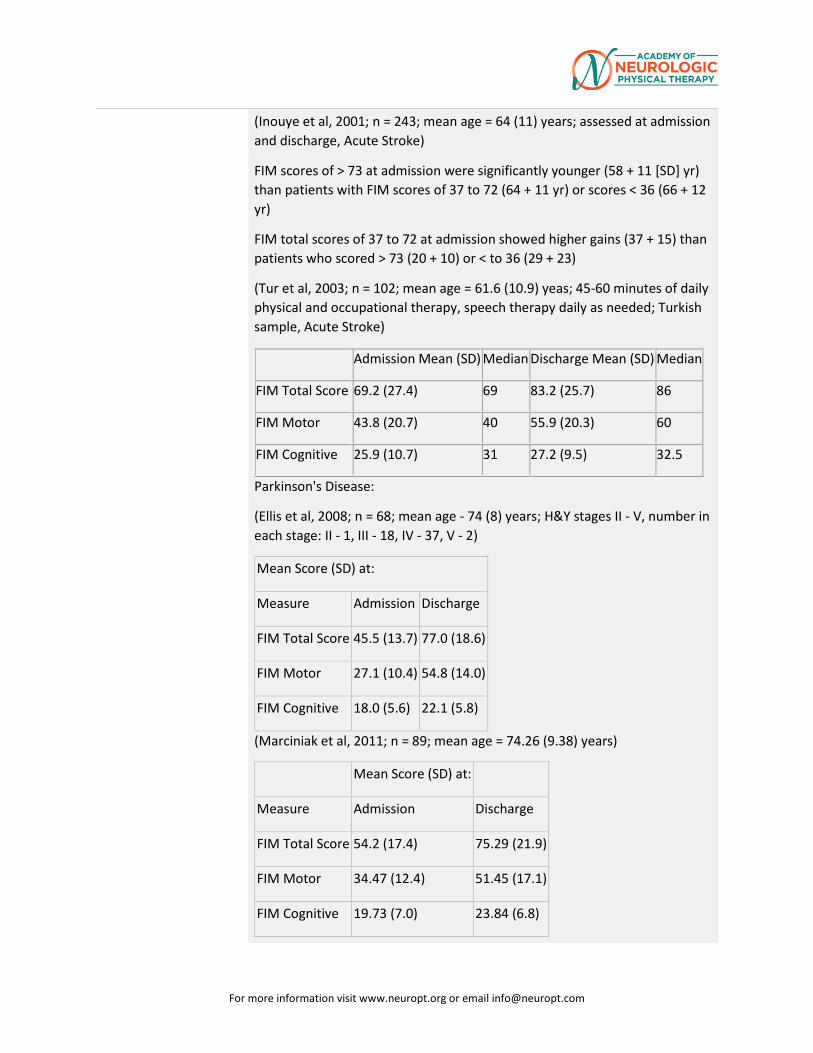
For more information visit www.neuropt.org or email [email protected]
(Inouye et al, 2001; n = 243; mean age = 64 (11) years; assessed at admission and discharge, Acute Stroke)
FIM scores of > 73 at admission were significantly younger (58 + 11 [SD] yr) than patients with FIM scores of 37 to 72 (64 + 11 yr) or scores < 36 (66 + 12 yr)
FIM total scores of 37 to 72 at admission showed higher gains (37 + 15) than patients who scored > 73 (20 + 10) or < to 36 (29 + 23)
(Tur et al, 2003; n = 102; mean age = 61.6 (10.9) yeas; 45-60 minutes of daily physical and occupational therapy, speech therapy daily as needed; Turkish sample, Acute Stroke)
Admission Mean (SD) Median Discharge Mean (SD) Median
FIM Total Score 69.2 (27.4) 69 83.2 (25.7) 86
FIM Motor 43.8 (20.7) 40 55.9 (20.3) 60
FIM Cognitive 25.9 (10.7) 31 27.2 (9.5) 32.5
Parkinson's Disease:
(Ellis et al, 2008; n = 68; mean age - 74 (8) years; H&Y stages II - V, number in each stage: II - 1, III - 18, IV - 37, V - 2)
Mean Score (SD) at:
Measure Admission Discharge
FIM Total Score 45.5 (13.7) 77.0 (18.6)
FIM Motor 27.1 (10.4) 54.8 (14.0)
FIM Cognitive 18.0 (5.6) 22.1 (5.8)
(Marciniak et al, 2011; n = 89; mean age = 74.26 (9.38) years)
Mean Score (SD) at:
Measure Admission Discharge
FIM Total Score 54.2 (17.4) 75.29 (21.9)
FIM Motor 34.47 (12.4) 51.45 (17.1)
FIM Cognitive 19.73 (7.0) 23.84 (6.8)
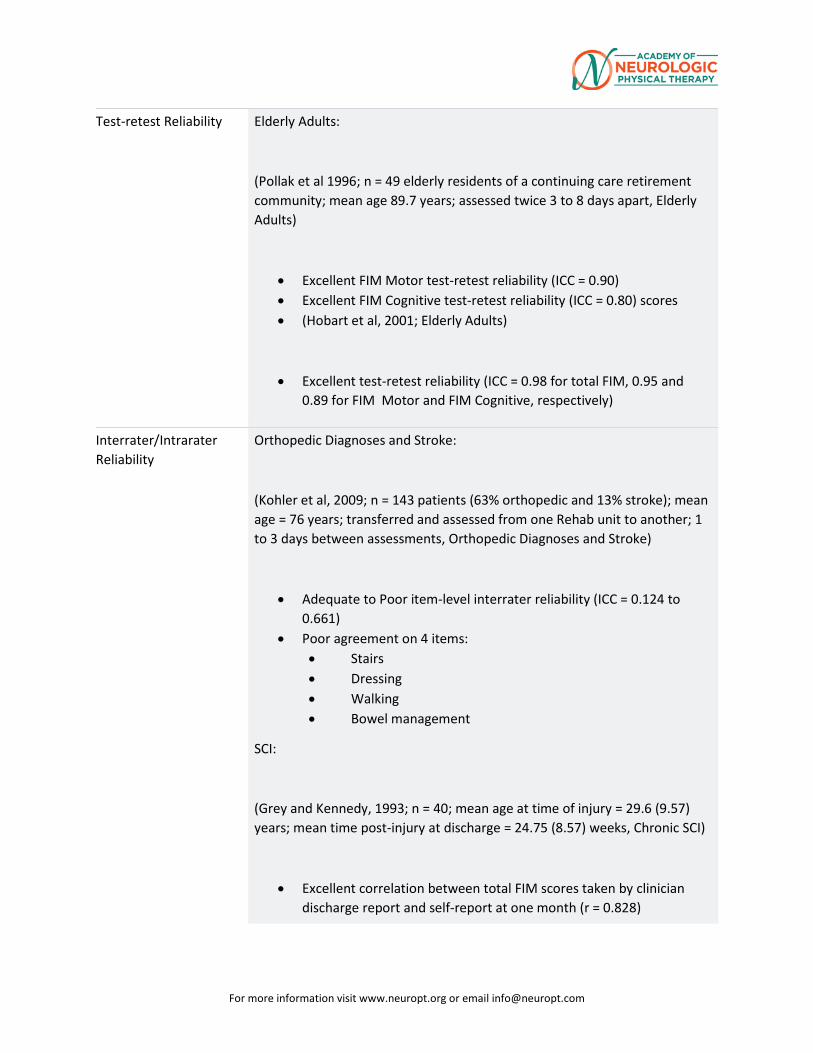
For more information visit www.neuropt.org or email [email protected]
Test-retest Reliability Elderly Adults:
(Pollak et al 1996; n = 49 elderly residents of a continuing care retirement community; mean age 89.7 years; assessed twice 3 to 8 days apart, Elderly Adults)
• Excellent FIM Motor test-retest reliability (ICC = 0.90) • Excellent FIM Cognitive test-retest reliability (ICC = 0.80) scores • (Hobart et al, 2001; Elderly Adults)
• Excellent test-retest reliability (ICC = 0.98 for total FIM, 0.95 and 0.89 for FIM Motor and FIM Cognitive, respectively)
Interrater/Intrarater Reliability
Orthopedic Diagnoses and Stroke:
(Kohler et al, 2009; n = 143 patients (63% orthopedic and 13% stroke); mean age = 76 years; transferred and assessed from one Rehab unit to another; 1 to 3 days between assessments, Orthopedic Diagnoses and Stroke)
• Adequate to Poor item-level interrater reliability (ICC = 0.124 to 0.661)
• Poor agreement on 4 items: • Stairs • Dressing • Walking • Bowel management
SCI:
(Grey and Kennedy, 1993; n = 40; mean age at time of injury = 29.6 (9.57) years; mean time post-injury at discharge = 24.75 (8.57) weeks, Chronic SCI)
• Excellent correlation between total FIM scores taken by clinician discharge report and self-report at one month (r = 0.828)
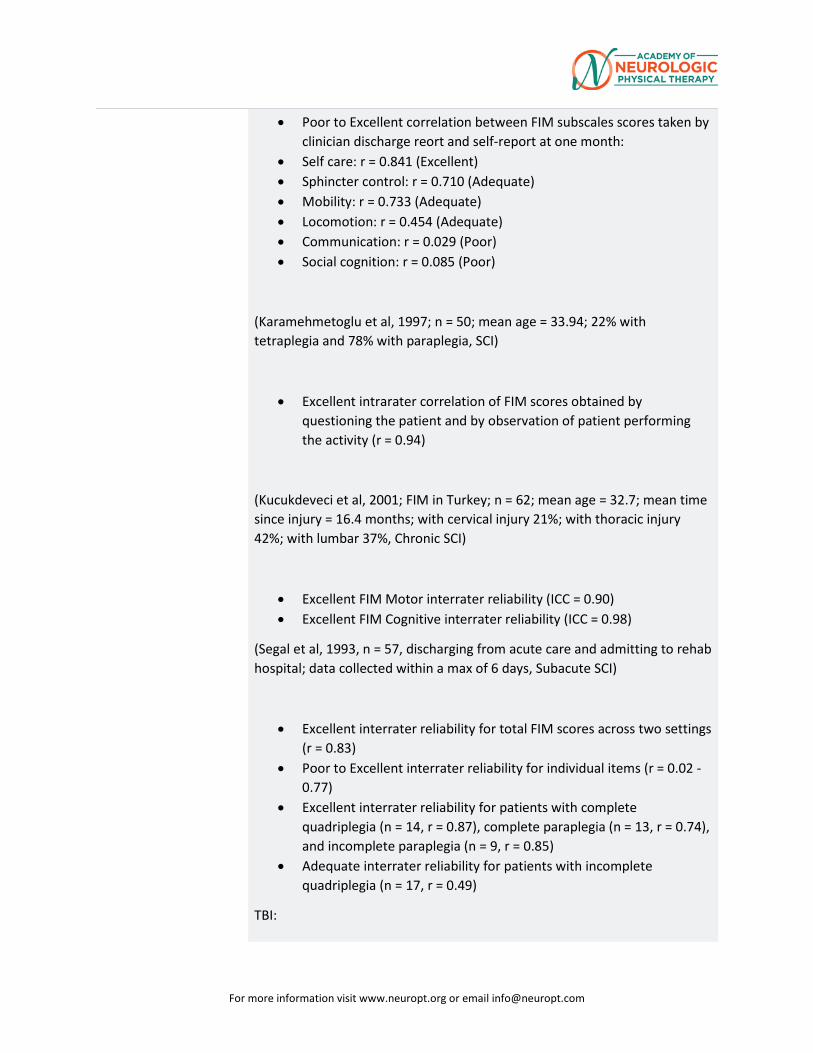
For more information visit www.neuropt.org or email [email protected]
• Poor to Excellent correlation between FIM subscales scores taken by clinician discharge reort and self-report at one month:
• Self care: r = 0.841 (Excellent) • Sphincter control: r = 0.710 (Adequate) • Mobility: r = 0.733 (Adequate) • Locomotion: r = 0.454 (Adequate) • Communication: r = 0.029 (Poor) • Social cognition: r = 0.085 (Poor)
(Karamehmetoglu et al, 1997; n = 50; mean age = 33.94; 22% with tetraplegia and 78% with paraplegia, SCI)
• Excellent intrarater correlation of FIM scores obtained by questioning the patient and by observation of patient performing the activity (r = 0.94)
(Kucukdeveci et al, 2001; FIM in Turkey; n = 62; mean age = 32.7; mean time since injury = 16.4 months; with cervical injury 21%; with thoracic injury 42%; with lumbar 37%, Chronic SCI)
• Excellent FIM Motor interrater reliability (ICC = 0.90) • Excellent FIM Cognitive interrater reliability (ICC = 0.98)
(Segal et al, 1993, n = 57, discharging from acute care and admitting to rehab hospital; data collected within a max of 6 days, Subacute SCI)
• Excellent interrater reliability for total FIM scores across two settings (r = 0.83)
• Poor to Excellent interrater reliability for individual items (r = 0.02 - 0.77)
• Excellent interrater reliability for patients with complete quadriplegia (n = 14, r = 0.87), complete paraplegia (n = 13, r = 0.74), and incomplete paraplegia (n = 9, r = 0.85)
• Adequate interrater reliability for patients with incomplete quadriplegia (n = 17, r = 0.49)
TBI:
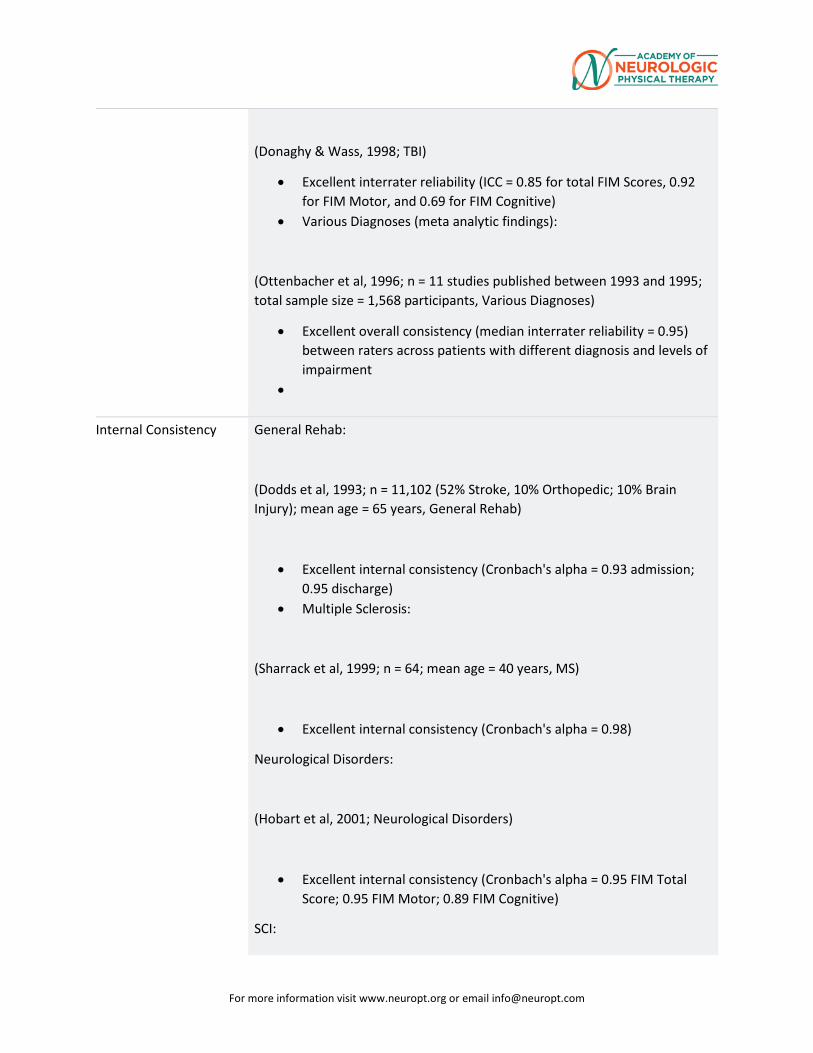
For more information visit www.neuropt.org or email [email protected]
(Donaghy & Wass, 1998; TBI)
• Excellent interrater reliability (ICC = 0.85 for total FIM Scores, 0.92 for FIM Motor, and 0.69 for FIM Cognitive)
• Various Diagnoses (meta analytic findings):
(Ottenbacher et al, 1996; n = 11 studies published between 1993 and 1995; total sample size = 1,568 participants, Various Diagnoses)
• Excellent overall consistency (median interrater reliability = 0.95) between raters across patients with different diagnosis and levels of impairment
•
Internal Consistency General Rehab:
(Dodds et al, 1993; n = 11,102 (52% Stroke, 10% Orthopedic; 10% Brain Injury); mean age = 65 years, General Rehab)
• Excellent internal consistency (Cronbach's alpha = 0.93 admission; 0.95 discharge)
• Multiple Sclerosis:
(Sharrack et al, 1999; n = 64; mean age = 40 years, MS)
• Excellent internal consistency (Cronbach's alpha = 0.98)
Neurological Disorders:
(Hobart et al, 2001; Neurological Disorders)
• Excellent internal consistency (Cronbach's alpha = 0.95 FIM Total Score; 0.95 FIM Motor; 0.89 FIM Cognitive)
SCI:
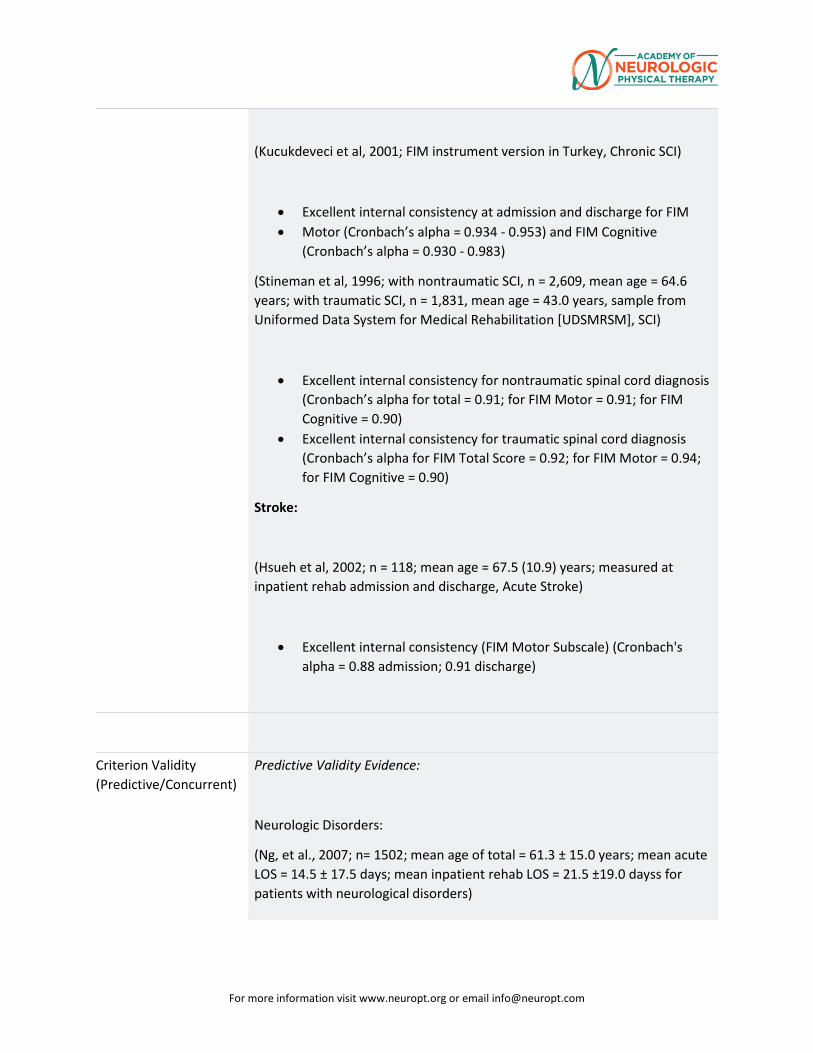
For more information visit www.neuropt.org or email [email protected]
(Kucukdeveci et al, 2001; FIM instrument version in Turkey, Chronic SCI)
• Excellent internal consistency at admission and discharge for FIM • Motor (Cronbach’s alpha = 0.934 - 0.953) and FIM Cognitive
(Cronbach’s alpha = 0.930 - 0.983)
(Stineman et al, 1996; with nontraumatic SCI, n = 2,609, mean age = 64.6 years; with traumatic SCI, n = 1,831, mean age = 43.0 years, sample from Uniformed Data System for Medical Rehabilitation [UDSMRSM], SCI)
• Excellent internal consistency for nontraumatic spinal cord diagnosis (Cronbach’s alpha for total = 0.91; for FIM Motor = 0.91; for FIM Cognitive = 0.90)
• Excellent internal consistency for traumatic spinal cord diagnosis (Cronbach’s alpha for FIM Total Score = 0.92; for FIM Motor = 0.94; for FIM Cognitive = 0.90)
Stroke:
(Hsueh et al, 2002; n = 118; mean age = 67.5 (10.9) years; measured at inpatient rehab admission and discharge, Acute Stroke)
• Excellent internal consistency (FIM Motor Subscale) (Cronbach's alpha = 0.88 admission; 0.91 discharge)
Criterion Validity (Predictive/Concurrent)
Predictive Validity Evidence:
Neurologic Disorders:
(Ng, et al., 2007; n= 1502; mean age of total = 61.3 ± 15.0 years; mean acute LOS = 14.5 ± 17.5 days; mean inpatient rehab LOS = 21.5 ±19.0 dayss for patients with neurological disorders)
For more information visit www.neuropt.org or email [email protected]
• Admission motor FIM scores (β = 0.55) and admission cognitive FIM scores (β = 0.38) had the highest impact on discharge total FIM scores
Stroke:
(Inouye et al, 2001; n = 243; mean age = 64 (11) years; assessed at admission and discharge, Acute Stroke)
• Patients with FIM total scores of 37 to 72 at admission showed higher gains (37 + 15) than patients who scored > 73 (20 + 10) or < to 36 (29 + 23)
(Denti et al. 2004; n = 359; mean age = 80.8 (4.7) years; time between stroke onset and admission = 22.3 (14.6) days, Acute Stroke)
• FIM total scores at admission were found to be the most powerful predictor of Montebello Rehabilitation Factor Scores (Beta coefficient = 0.42)
(Salter et al, 2010) 134 patients, a mean age of 68.64 (± 14.2) years old, and an average of 31.84 (± 59.2) days post-stroke, receiving care in an inpatient rehabilitation setting, were tested with the FIM at admission and discharge .
• There was excellent, positive and significant correlations with performance on the FIM (total and motor) with the Clinical Outcome Variables Scale [COVS] (0.823 and 0.771 respectively).
• The COVS and FIM had excellent correlation (-0.61,-0.69)) with length of stay (P<0.01), such that lower scores at admission meant shorter length of stay.
(Ward et al, 2011) Thirty inpatients with first ischaemic stroke were evaluated with the FIM, the SIS-16 and the STREAM at admission:
• The FIM score was significantly (P<0.001) and highly correlated (excellent) with the predicted length of stay (-0.9438 ) and the actual length of stay (-0.6846)
• The validity of the FIM for predicting the LOS was higher (-0.9438) than the SIS-16 (-0.6743) and the STREAM (-0.8011)
• The validity of the FIM associated with the actual LOS was lower (-0.6846) compared to the SIS-16 (-0.7953) and the STREAM Total (-0.7972).
(Yang et al, 2013). In a prospective observational study of 122 patients with a first time stroke admitted to a rehabilitation center over a 12 month period:
For more information visit www.neuropt.org or email [email protected]
• The FIM score on admission and discharge significantly predicted the Pittsburgh Rehabilitation Participation Scale [PRPS] (0.53; P<0.0001 and 0.40; P<0.001 respectively)
• The level of participation on discharge (PRPS score) was predicted by functional status on admission (FIM; 0.309), cognitive impairment (Elderly Cognitive Assessment Questionnaire-ECAQ; 0.249) and fatigue (Fatigue Severity Scale-FSS; -0.304) .
• Patients with lower levels of participation were more likely to be functionally dependent, cognitively impaired and have more fatigue.
(O’Brien et al, 2013). A sample of 371,211 Medicare beneficiaries who were receiving services in an inpatient rehabilitation facility (IRF) within 60 days post stroke (> 65 years of age, 43.7% male, 41.7% right sided impairment, 796% white) were evaluated with the FIM at admission and discharge. In addition, the change in LOS at the IRF and community discharge was compared over time with the implementation of a prospective payment system (PPS) for individuals on Medicare.
• Average LOS decreased a total of 3.8 days (from 17.9 in 2002 to 16.1 days in 2007)
• Mean admission FIM scores decreased a total of 4.4 points ( from 57.2 to 53.8 points)
• The mean discharge FIM sores decreased a total of 3.6 points ( from 80.1 to 76.5 points) in 4 of 5 years with no significant decline in 2004.
• Frequency of community discharges declined steadily with an average overall decrease of 5.4 % (from 6.6% to 61.2%) over the 5.5 years of study
• Controlling for study year and covariates, each day in IRF was associated with an increase of 0.50 discharge points (95% CI = 0.48, 0.52)
• The association between LOS and discharge destination was excellent, averaging 0.997 (95% CI = 0.994, 0.999) based on the co-variates of admission FIM, age, gender, ethnicity, side of lesion, complications and year.
(Van Heugten et al, 2015) Systematic review of studies (51) investigating convergent, criterion and predictive validity of cognitive dysfunction in patients in the acute phase (4 weeks) post stroke using multi-domain instruments .
For more information visit www.neuropt.org or email [email protected]
• The Conistat, Montreal Cognitive Assessment [MOCA] and Functional Independence Measure-Cognitive showed adequate predictive validity
(Bates, 2015-Part 1) A retrospective analysis of 4020 veterns receiving consultative or comprehensive rehabilitation care post-stroke. The study examined initial characteristics of veterans predictive of grade IV achievement on the FIM.
• The final model contained the following variables: age, initial physical grade, initial cognitive stage, renal failure, nutritional compromise, type of rehabilitation services, and recovery time between admission and discharge assessments. A point system was assigned to each of the above variables, such that the clinician could enter in the above information and determine the likelihood of a patient achieving a grade IV. The area under the ROC curve was adequate of the derivation and validation cohorts (0.84 and 0.83, respectively). The Hosmer-Lemeshow statistic was not significant (p = 0.93).
(Bates, 2015-Part 2)
• The above model (Bates, 2015-Part1) was enhanced to become a prognostic index, predicting likelihood of recovery to or above the grade VI benchmark (Modified Independent). There was adequate fit with a non-significant Hosmer-Lemeshow statistic of P = 0.38 and Adequate area under the curve of 0.83 in the derivation cohort and 0.82 in the validation cohort. A similar predictive equation was derived with the sum score quartiles slightly modified.
• (Huang, 2010) Fifty-eight participants an average of 17.85 (range, 7-
88) months post-stroke participated in distributed constraint induced therapy two hours per day, five days a week for three weeks. Assessments were administered prior and after therapy, and a Chi-squared Automatic Interaction Detector method was used to identify the strongest predictors of change on the Stroke Impact Scale. Participants with an initial Total FIM score ≤ 109 at admission, improved significantly more (p = 0.006) on the Stroke Impact Scale and on measures of activities of daily living and instrumental activities of daily living at completion of the intervention.
(Lin, 2010) Seventy-four participants an average age of 54.11 (± 11.44) years old and 17.46 (± 17.67) months post-stroke were seen for upper extremity intervention. Participants received constraint-induced movement therapy, bilateral arm training, or conventional rehabilitation for two hour sessions,
For more information visit www.neuropt.org or email [email protected]
five times per week for three weeks. Assessments were done at baseline and post-intervention.
• Poor to excellent predictive validity was found between the domains of the Stroke Impact Scale and the FIM (0.26-0.70, p < 0.05)
• Poor to excellent predictive validity was found between the domains of the Stroke Specific Quality of Life Scale and the FIM (0.22-0.63, p < 0.01). The language, personality, thinking, and vision domains were not significant.
Concurrent Validity Evidence:
Rehabilitation Patients:
(Heinemann et al, 1994; Rehabilitation Patients) Admission FIM Motor Scores accounted for 52% of variance in discharge motor function among TBI patients, admission FIM Cognitive Scores accounted for 46% of variance in discharge cognitive function – admission motor FIM was the most significant predictor of length of stay.
(Montecchi et al, 2013) In 59 patients with mean age of 48.90 (± 14.01) years old, admitted to the intensive care unit acutely post acquired brain injury (from trauma, hypoxia, hemorrhage or ischemia), a new Trunk Recovery Scale (TRS) was developed.
• Excellent correlation between the FIM-Motor and the TRS (0.849)
Stroke:
(Hsueh et al, 2002; Acute Stroke)
Excellent correlation between the FIM Motor Subscale and the 10-item version of the Barthel Index (BI) (r = 0.92 (at admission) - 0.94 (at discharge))
Excellent agreement between the FIM Motor Subscale and 5-item version of BI (r = 0.74 (at admission) - 0.94 (at discharge)
(Ward et al 2011) On admission to the acute rehabilitation ward, the FIM and the STREAM were found to be highly correlated in thirty patients acute post ischemic stroke.(0.7766; P<0.0001)
(Shindo et al, 2015) To explore the concurrent validity of the FIM scale with the Simple Test of Evaluation Hand Function [STEF], 34 inpatients (33-86
For more information visit www.neuropt.org or email [email protected]
years of age) sub acute post stroke (less than 60 days post episode) were evaluated at admission. The STEF had statistically significant, adequate correlations with the FIMTM: FIM Total score (0.444;P<0.009), FIM motor (0.411;P<0.016) and FIM self care (0.402; P<0.019) .
(Sasaki et al, 2014) The aim of this study was to explore the validity of the Cognitive Behavioral Rating Sale ( CBRS) with the FIM discharge data on 100 patients, mean age of 72.2 (± 10.9) years old and 61.0 (±61.2) days post-stroke. The Spearman Rank Correlation Coefficient was excellent between the CBRS and the FIM total Score (-0.70; p<0.01), the Cognitive FIM (-0.72; P<0.01), and the Motor FIM (-0.63; p<0.01) for patients post stroke.
(Caglar, 2014) A retrospective analysis on 142 patients post-stroke that went to an IRF. A linear regression was run to determine which factors contributed to Motor-FIM (M-FIM) gain and Cognitive-FIM (C-FIM) gain.
• The adjusted R2 was 0.173 (p = 0.000) for M-FIM gain and the significant factors were the admission M-FIM (B = 0.809, SE = 0.199, β = -0.446, p = 0.000) and if the patient had diabetes Mellitus (B = 14.269, SE = 6.775, β = -0.177, p = 0.037).
• The adjusted R2 was 0.146 (p = 0.001) for C-FIM gain and the significant factors were the admission C-FIM (B = -4.068, SE = 1.048, β = -0.369, p = 0.000) and if the patient had diabetes Mellitus (B = 36.226, SE = 17.904, β = -0.175, p = 0.045).
(Cooke, 2010) One hundred and ninty-seven, first stroke participants were included an average of 45.4 ± 67.6 days post-stroke to examine the relationship of clock drawing post-stroke.
• A significant relationship was found between the FIM-Motor and the Clock Drawing Test (Exp (B) = 0.984, p = 0.030).
Construct Validity (Convergent/Discriminant)
Convergent Validity Evidence (extent to which the screening instrument corresponds to similar instruments measuring the same function ( expressed as a correlation):
SCI:
(Ditunno, et al., 2007; n = 141, mean age = 32 years; Entered into study within 8 weeks of onset of SCI; data taken at entry, 3 and 6 and 12 months, subjects required to have score of < 4 on the Locomotor FIM (LFIM) at entry, Acute SCI)
• Excellent correlation between total FIM score and WISCI at 3,6, and 12 months (Spearman’s r = 0.73 - 0.77)
For more information visit www.neuropt.org or email [email protected]
• Excellent correlation between total FIM score and Berg Balance Scale (Spearman’s r = 0.72 - 0.77) at 3, 6, and 12 months
• Excellent correlation between LFIM score and Walking Index for Spinal Cord Injury (WISCI) at 3, 6, and 12 months (Spearman’s r = 0.88 - 0.92)
• Excellent correlation between LFIM score and Berg Balance Scale (Spearman’s r = 0.86 - 0.89) at 3, 6, and 12 months
• Excellent correlation between LFIM score and 50-Foot Walk Test at 3, 6, and 12 months (Spearman’s r = 0.66 - 0.80)
• A comparison of simultaneous performance of the WISCI and the LFIM indicated 1 FIM level per multiple WISCI levels
(Donnelly et al, 2004; n = 41; mean age = 49(118.1); mean time since injury = 52 (73.1) days; with paraplegia, n = 18; with tetraplegia, n = 20; Incomplete, n = 27; complete, n = 11, SCI)
• Adequate correlation between admission and discharge scores of the FIM Total Score and the Canadian Occupational Performance Measure (COPM) Performance (r = 0.388 - 0.452) and COPM Satisfaction (r = 0.513 - 0.514)
• Adequate correlation between change scores of the FIM Total Score and FIM motor with COPM Performance (r = 0.364, r = 0.351) and Satisfaction (r = 0.497, r = 0.497) from admission to discharge
• (Fujiwara et al, 1999; n = 14; C6 level of injury, mean age = 30.7 years; mean length of time from injury = 462.0 days, Chronic SCI)
• Excellent correlation of FIM motor score and AIS motor score (Spearman’s rank correlation coefficient = 0.73)
• Excellent correlation of shoulder strength (sum of MMT for serratus anterior, upper pectoralis major, and latissiums dorsi) and FIM motor score (Spearman’s rank correlation coefficient = 0.95)
• Excellent correlation of AIS shoulder strength score (deltoid) and FIM transfer score (Spearman’s r = 0.93)
(Saboe et al, 1997; n = 160; mean age = 30 (13) years; assessed at admission, discharge, and 2 years post injury; Length of stay at tertiary care hospital 144 (111) days Chronic SCI)
• Excellent correlation of FIM score 2 years post injury with admission and discharge ASIA motor (Spearman’s r = 0.68 - 0.80), ASIA light
For more information visit www.neuropt.org or email [email protected]
touch (Spearman’s r = 0.75 - 0.76), ASIA pinprick (Spearman’s r = 0.73 - 0.76), and Computed Vibration (Spearman’s r = 0.64 - 0.67)
• Adequate correlation of FIM score 2 years post injury with admission bony injury level (Spearman’s r = 0.53) and admission and discharge ASIA Impairment (Spearman’s r = 0.50 - 0.53)
• 56% of the variance of FIM scores 2 years post injury is accounted for with ASIA admission light touch scores with age being the next largest contributing factor
• (Yavuz et al, 1998; n = 29; mean age = 37 years; mean time between onset and rehab admission = 20 weeks, mean length of stay in inpatient rehab = 18 weeks, Subacute SCI) Excellent correlation of FIM score with ASIA motor (r = 0.91)
• Adequate correlation of FIM score with ASIA light touch (r = 0.58) and ASIA pinprick (r = 0.55)
• Excellent correlation of Quadriplegia Index of Function and FIM (r = 0.97)
Stroke:
(Tur et al, 2003; Acute Stroke)
• Adequate correlation with length of hospital stay (r = -0.39) • Adequate to Excellent correlation with Brunnstrom’s motor recovery
stages in upper extremity, lower extremity, and hand at admission and discharge (r = 0.51 - 0.68)
(Van Heugten et al, 2015) Systematic review of studies (51) investigating convergent, criterion and predictive validity of cognitive dysfunction in patients in the acute phase (4 weeks) post stroke using multi-domain instruments .
• No instrument (including the FIM) assessed all of the commonly affected cognitive domains after a stroke
• Strong significant intercorrelations were found between the Occupational Therapy Cognitive Assessment (LOTCA), the MMSE and the FIM-Cognitive subscale
(Canbek, 2013) Fifty-five participants who experienced their first-ever stroke and went to an IRF an average of 8± 5 days post-stroke.
• Poor to Excellent construct validity was seen between the FIM-Motor and the Tinetti POMA
Tinetti POMA Balance Domain Gait Domain
For more information visit www.neuropt.org or email [email protected]
Admission FIM-Motor
0.688 0.616 0.610
Discharge FIM-Motor
0.609 0.588 0.536
Change FIM-Motor 0.389 0.277 0.396 (Kucukdeveci, 2013) One hundred and eighty-eight community dwelling participants (mean age 63.1 ±12 years), a median of 27 (range 3-240) months post-stroke were evaluated on the FIM and the World Health Organization Disability Assessment Schedule (WHODAS-II).
• Adequate to Excellent convergent validity was found. All correlations significant at p < 0.001.
FIM Motor FIM Cognitive WHODAS-II understanding and communicating
-0.54 -0.74
WHODAS-II getting around -0.86 -0.45 WHODAS-II self-care -0.88 -0.46 WHODAS-II getting along with people -0.55 -0.71 WHODAS-II life activities (work items removed)
-0.74 -0.45
WHODAS-II participation in society -0.72 -0.52 WHODAS-II total (work items removed) -0.85 -0.68 WHODAS-II activities -0.85 -0.64 WHODAS-II participation -0.77 -0.67 WHODAS-II -12 (work items removed) -0.86 -0.65 WHODAS-II-10 -0.83 -0.65
(Ottiger et al A new multidisciplinary observation scale for inpatients post stroke based on the ICF model of activity and participation was created to document outcomes post stroke (LIMOS). This scale included four components of the ICF:1). interpersonal activities, [mobility and self-care,; 2}. Communication; 3} Knowledge and general tasks; 4) domestic life. The activities were rated as limitations or restriction in domains as: none, slight, moderate, severe or complete. This new scale was correlated with FIM scores.
• Excellent convergent validity was found between the LIMOS and the FIM (r=0.89; P<0.0001)
• An excellent association was reported between the FIM mobility subscale and the LIMOS mobility subscale (r=0.90; P<0.0001)
• Adequate to excellent associations were found between the subscales of the LIMOS (self care, general tasks, domestic life) and the subscales of the FIM (r=0.36-0.79)
For more information visit www.neuropt.org or email [email protected]
Discriminate Validity Evidence:
Rehabilitative patients:
(Hobart et al, 2001; n = 169; neurological rehab patient: MS, stroke, TBI, other)
• FIM total and FIM motor scores correlated more strongly with OPCS disability scores, LHS scores, SF-36 physical component scores and WAIS – verbal IQ, than with measures of mental health status or psychological distress (SF36 mental component, General Health Questionnaire)
• FIM Cognitive Scores correlated most strongly with OPCS Disability scores and WAIS-verbal IQ scores and weakly with LHS, SF-36 physical and mental components, and the General Health Questionnaire (ABIEBR)
Stroke:
(Brock et al, 2002; Rasch analysis; n = 106; mean age = 68.7 (11.3) years; median time since onset = 11 days, Acute Stroke)
• Difficult items on motor portion of the scale discriminated better among higher functioning patients
• Raw FIM scores (as opposed to score subjected to Rasch analysis) may underestimate change
(Cavanagh et al, 2000; ischemic and hemorrhagic stroke patients, Stroke)
• Simple 2-factor model of the FIM instrument may not be sufficient to describe disability following stroke (66% of variance)
• May not adequately measure within patient change whereas a 3-factor model (self-care, cognition and elimination) accounted for more variance (74.2%)
Content Validity The FIM instrument was based on the results of a literature review of published and unpublished measures as well as input provided by an expert
For more information visit www.neuropt.org or email [email protected]
panel. Face and content validity were determined using subject matter experts (Granger, Hamilton, Keith, Zielezny, & Sherwins, 1986).
Content validity was established through a pilot study done at 11 centers (n = 110 patients evaluated; Keith & Granger, 1987).
SCI:
(Jackson et al, 2008; n = 54 expert raters assessed locomotion measures as: 1) valid or useful, 2) useful but requires validation or changes/improvements, or 3) not useful or valid for research in SCI, SCI)
FIM – Locomotion item was rated as Valid/Useful by 6%, Useful But Requires Validation or Changes by36% , and Not Useful or Valid for Research in SCI by 58%
Traumatic Brain Injury:
(Hall et al, 2001; TBI)
Although the FIM instrument is reliable and key validity characteristics have been established, it has only 5 items directly addressing cognitive, behavioral, and communication issues, which limits its content validity for TBI
Face Validity SCI:
(Grey and Kennedy, 1993; Chronic SCI)
Face validity was evaluated by asking clinicians specific questions addressing:
• Difficulty of understanding (88% had no difficulty) • Unnecessary items (97% reported no unnecessary items • Items that should be added (83% felt no extra items needed)
Floor/Ceiling Effects Rehabilitation Patients:
(Coster et al, 2006; n = 516 subjects with neurologic, orthopedic, or complex medical conditions; mean age = 68.3 (14.97) years; discharged from tertiary care or rehab hospital, Rehabilitation Patients)
• Ceiling effect on FIM motor scale after discharge ranging from 10% at 1 month to 15% at 12 months
For more information visit www.neuropt.org or email [email protected]
• Ceiling effect on the FIM cognitive scale after discharge for 70% of subjects at 1 month, reducing to 53% at 12 months
SCI:
(Grey and Kennedy, 1993; Chronic SCI)
• 92% of subjects and 88% of clinicians reported a max score on communication
• 75% of subjects and 73% of clinicians reported a max score on social cognition
(Hall et al, 1999; Acute SCI)
Percentage of Floor and Ceiling FIM Scores by Level of Injury
Admission Discharge 1 yr 2 yrs 5 yrs
High Tetraplegia: C1 (no motor ceiling effect)
Motor Floor effect(%)* 86 21 28 25 13
Cognitive Ceiling effect(%)~ 59 80 89 96 98
Low Tetraplegia: C5-C8
Motor Floor effect(%)* 61 3 5 4 3
Motor Ceiling effect(%)~ 0 4 15 18 16
Cognitive Ceiling effect(%)~ 67 86 95 99 96
Paraplegia (no motor floor effect)
Motor Ceiling effect(%)~ 0 36 55 66 75
Cognitive Ceiling effect (%)~ 76 90 97 98 99
* Floor effect: Score of 1; Ceiling effect: Score of 6 or 7
Stroke:
(Brock et al, 2002; Acute Stroke)
For more information visit www.neuropt.org or email [email protected]
• Minimal ceiling effect: 16% achieved ceiling on FIM Motor Subscale during inpatient rehabilitation
(Dromerick et al, 2003; n = 95, Acute Stroke)
• No floor or ceiling effects at either time using the FIM instrument
(Hsueh et al, 2002; Acute Stroke)
FIM Motor subscale:
• Minimal floor effect at admission to inpatient rehab (5.8%) and at discharge from inpatient rehab (3.5%)
• No ceiling effect at admission to inpatient rehab (0%) and at discharge from inpatient rehab (0%)
Responsiveness Rehabilitation Patients:
(Coster et al, 2006; Rehabilitation Patients)
• Small, positive effect size observed for FIM motor (SRM = 0.73 to 1.05) and FIM cognitive (SRM = 0.34 to 0.35) Small to Moderate, negative effect size observed for FIM motor (SRM = 1.3 to 1.31) and FIM cognitive (SRM = 1.34 to 2.24)
• For FIM motor, 15-36% of subjects presented with positive change exceeding the MDC and 15- 25% with negative change exceeding the MDC
• For FIM cognitive, 8-9% of subjects presented with positive change exceeding the MDC and 20-24% presented with negative change exceeding the MDC
SCI:
(Spooren et al, 2006; n = 60; mean age = 38.9 years old; first measurement taken when subjects were first able to sit up in a chair for 3 hours, Acute SCI)
For more information visit www.neuropt.org or email [email protected]
• Large effect size for all subjects regardless of AIS classification between initial measurement (T1) and 3 months later (T2) as well as between initial measurement (T1) and discharge from rehab (T3)
• Small to moderate effect size for subjects between T2 and T3 (ES = 0.37-0.79)
Stroke:
(Hsueh et al, 2002; Acute Stroke)
Motor subscale:
• Large effect size with standardized response mean = 1.3
(Ward et al, 2011) A prospective cohort study of 30 subjects newly diagnosed with ischemic stroke (mean days since stroke onset 7.8 days (± 3.5)) was designed to demonstrate sensitivity of the FIM to change in an acute rehabilitation setting.
• The FIM score on admission was significantly associated (adequate to excellent correlations) with discharge destination as well as predicted and actual length of stay.
• The SRM (admission to discharge change score) was 2.34 for the motor FIM (P<0.0001). This FIM SRM was greater than the SRM for the SIS-16 and SRM for the STREAM.
(Salter et al, 2010) Following admission and discharge of 292 patients post stroke (134 with complete data and 158 with incomplete data, respectively an average of 31.8 and 67.3 days post stroke), FIMTM scores improved significantly (P<0001) from admission to discharge from a mean of 73.86 (24.13) to 95.70 (24.65) . The SRM was 1.36.
Professional Association Recommendations
Recommendations for use of the instrument from the Academy of Neurologic Physical Therapy of the American Physical Therapy Association’s Multiple Sclerosis Taskforce (MSEDGE), Parkinson’s Taskforce (PD EDGE), Spinal Cord Injury Taskforce (PD EDGE), Stroke Taskforce (StrokEDGE II), Traumatic Brain Injury Taskforce (TBI EDGE), and Vestibular Taskforce (VEDGE) are listed below. These recommendations were developed by a panel of research and clinical experts using a modified Delphi process.
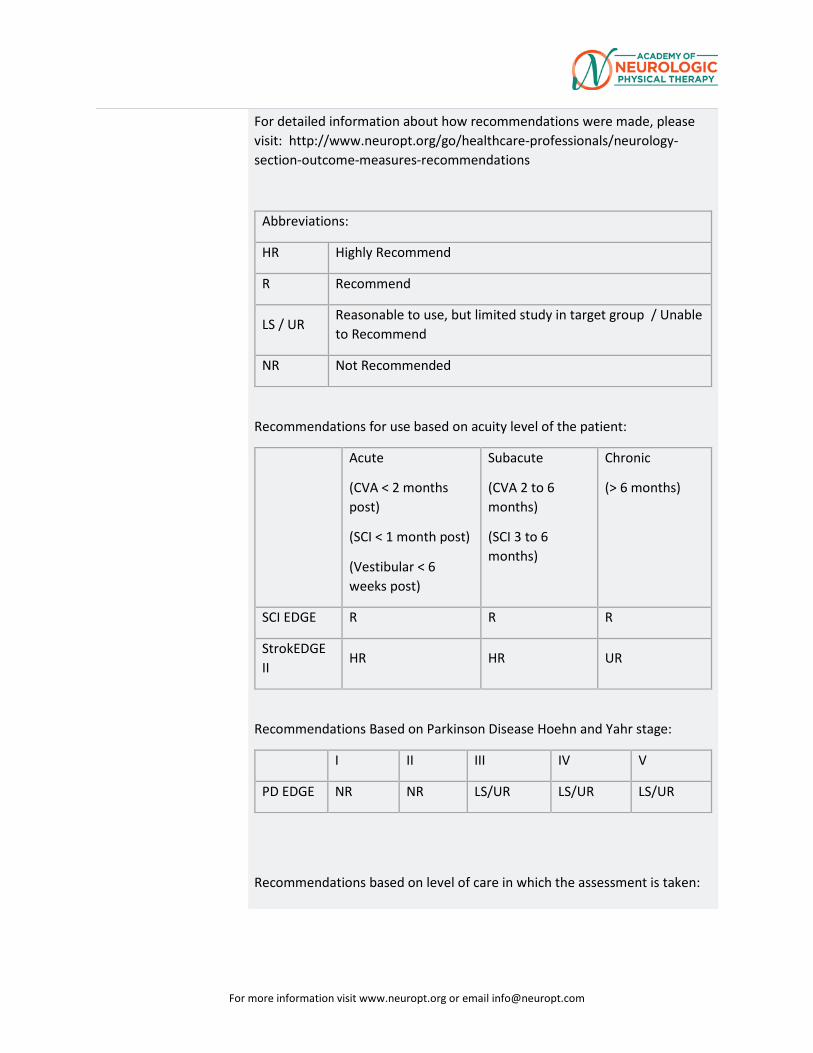
For more information visit www.neuropt.org or email [email protected]
For detailed information about how recommendations were made, please visit: http://www.neuropt.org/go/healthcare-professionals/neurology-section-outcome-measures-recommendations
Abbreviations:
HR Highly Recommend
R Recommend
LS / UR Reasonable to use, but limited study in target group / Unable to Recommend
NR Not Recommended
Recommendations for use based on acuity level of the patient:
Acute
(CVA < 2 months post)
(SCI < 1 month post)
(Vestibular < 6 weeks post)
Subacute
(CVA 2 to 6 months)
(SCI 3 to 6 months)
Chronic
(> 6 months)
SCI EDGE R R R
StrokEDGE II
HR HR UR
Recommendations Based on Parkinson Disease Hoehn and Yahr stage:
I II III IV V
PD EDGE NR NR LS/UR LS/UR LS/UR
Recommendations based on level of care in which the assessment is taken:
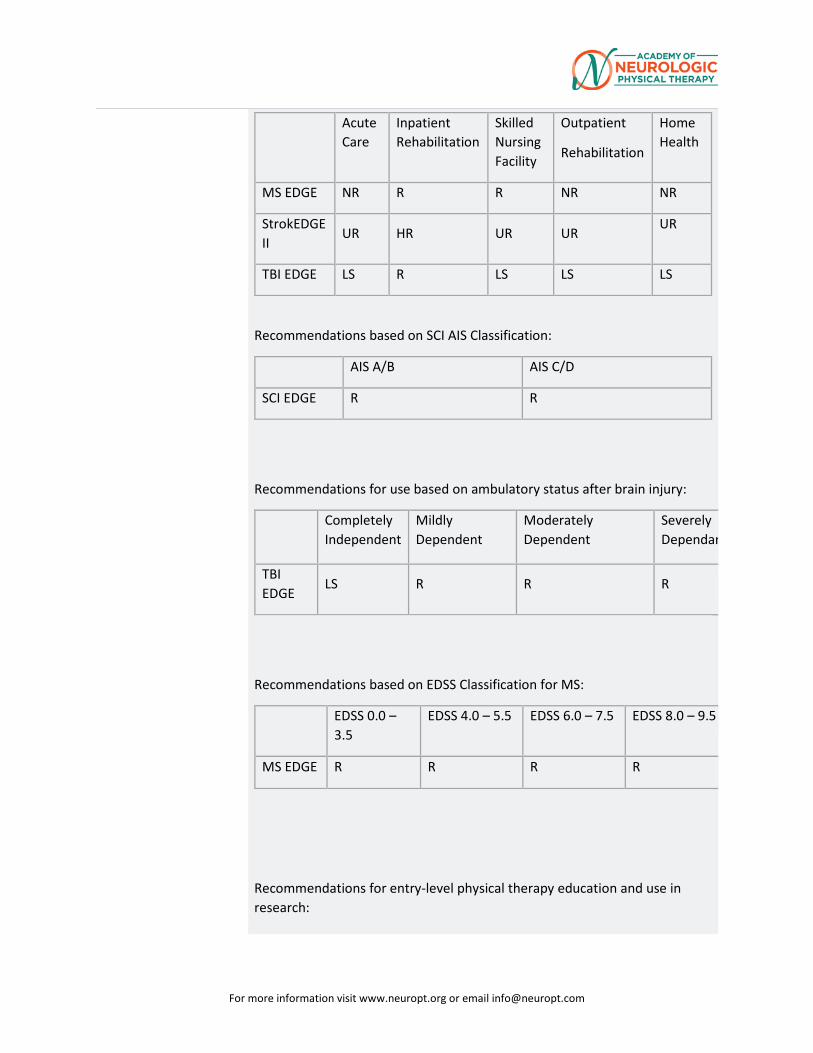
For more information visit www.neuropt.org or email [email protected]
Acute Care
Inpatient Rehabilitation
Skilled Nursing Facility
Outpatient
Rehabilitation
Home Health
MS EDGE NR R R NR NR
StrokEDGE II
UR HR UR UR UR
TBI EDGE LS R LS LS LS
Recommendations based on SCI AIS Classification:
AIS A/B AIS C/D
SCI EDGE R R
Recommendations for use based on ambulatory status after brain injury:
Completely Independent
Mildly Dependent
Moderately Dependent
Severely Dependan
TBI EDGE
LS R R R
Recommendations based on EDSS Classification for MS:
EDSS 0.0 – 3.5
EDSS 4.0 – 5.5 EDSS 6.0 – 7.5 EDSS 8.0 – 9.5
MS EDGE R R R R
Recommendations for entry-level physical therapy education and use in research:
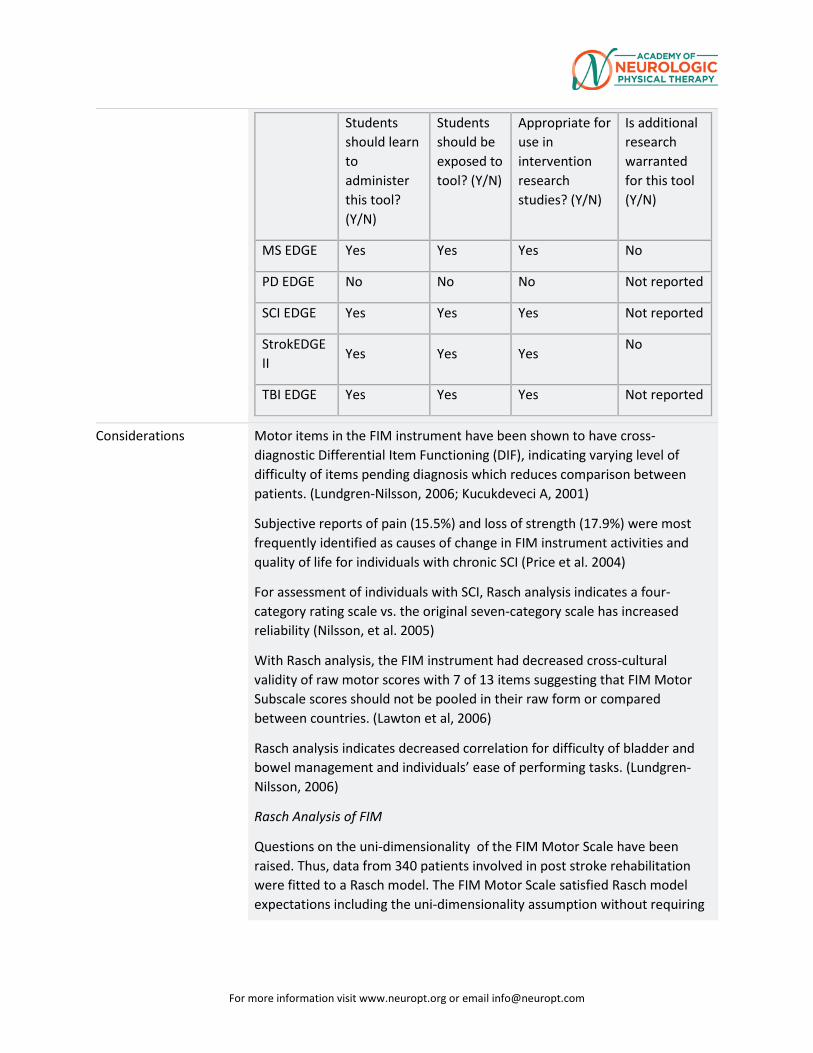
For more information visit www.neuropt.org or email [email protected]
Students should learn to administer this tool? (Y/N)
Students should be exposed to tool? (Y/N)
Appropriate for use in intervention research studies? (Y/N)
Is additional research warranted for this tool (Y/N)
MS EDGE Yes Yes Yes No
PD EDGE No No No Not reported
SCI EDGE Yes Yes Yes Not reported
StrokEDGE II
Yes Yes Yes No
TBI EDGE Yes Yes Yes Not reported
Considerations Motor items in the FIM instrument have been shown to have cross-diagnostic Differential Item Functioning (DIF), indicating varying level of difficulty of items pending diagnosis which reduces comparison between patients. (Lundgren-Nilsson, 2006; Kucukdeveci A, 2001)
Subjective reports of pain (15.5%) and loss of strength (17.9%) were most frequently identified as causes of change in FIM instrument activities and quality of life for individuals with chronic SCI (Price et al. 2004)
For assessment of individuals with SCI, Rasch analysis indicates a four-category rating scale vs. the original seven-category scale has increased reliability (Nilsson, et al. 2005)
With Rasch analysis, the FIM instrument had decreased cross-cultural validity of raw motor scores with 7 of 13 items suggesting that FIM Motor Subscale scores should not be pooled in their raw form or compared between countries. (Lawton et al, 2006)
Rasch analysis indicates decreased correlation for difficulty of bladder and bowel management and individuals’ ease of performing tasks. (Lundgren-Nilsson, 2006)
Rasch Analysis of FIM
Questions on the uni-dimensionality of the FIM Motor Scale have been raised. Thus, data from 340 patients involved in post stroke rehabilitation were fitted to a Rasch model. The FIM Motor Scale satisfied Rasch model expectations including the uni-dimensionality assumption without requiring
For more information visit www.neuropt.org or email [email protected]
deletion of any of the 13 items. This analysis reinforces that the FIM Motor Scale contains clinically important items. (Lungren Nilsson et al 2011)
A secondary Rasch analysis combning the FIM and the Nottingham Extended Activities of Daily Living (NEADL) assessment was done on 188 participants (average of 19.45 ± 15.96 months post-stroke) from an upper extremity intervention trial. The scoring on the FIM was recoded to a 3-point scale to indicate degrees of independence and the final model (from both assessments) contained 36-items, the bowel management item was removed as it was highly correlated (0.81) with the bladder management item (Chen, 2013).
The Barthel Index is commonly administered by nursing and medical staff to measure functional recovery following an inpatient stay for patients post stroke or neurologic disorders while the rehabilitation staff use the FIM. The Barthel Index can be measured directly or estimated from the Northwick Park Dependency Scale (NPDS) or the FIM. Following hospital discharge of 717 patients (TBI and stroke), there was excellent agreement of intra-class correlations between the total scores on the FIM and the NPDS (0.93; P<0.001; 95% CI 0.92-0.94). Item by item agreement ranged from adequate ( 0. 41;dressing) to excellent (0.77;mobility) with the average absolute item % agreement from 7l.l% (Dressing) to 90.6% (transfers). (Turner et al, 2010)
Comments from StrokEdge Task Force Members
The FIM instrument must be administered by a trained and certified evaluator and ideally scored by consensus with a multi-disciplinary team. Although the FIM instrument was originally developed to address issues of sensitivity and comprehensiveness for Barthel Index (BI), subsequent studies demonstrated that psychometric properties of the FIM instrument and BI are similar (Hsueh et al, 2002; Stroke EDGE task force)
“The FIM instrument does not contain key activity or participation elements of patient recovery important for measuring outcome and burden of illness (e.g., return to work, relationships, social and recreational pastimes, etc.)”( Nichol et al., 2011) The FIM instrument is appropriate for patients at all levels of EDSS; rating reflects limited responsiveness data, training required, and copyright issues (MS EDGE task force)
Diversity Sensitivity of FIM
The FIM instrument was examined in white, black, and Hispanic people post-stroke that were admitted to inpatient rehabilitation. FIM scores were
For more information visit www.neuropt.org or email [email protected]
tracked at admission, discharge, three and 12 months after discharge. At three months, black and Hispanic patients had lower FIM totals when compared to whites. In addition, total FIM ratings increased for all three group form discharge to three months post, but then showed little change after. Racial/ethnic group, age, length of stay and medical comorbidities were significant predictors of total FIM ratings over the four time points. (Berges et al, 2012; Stroke EDGE task force)
FIM converted to other Languages
(Miki et al, 2015). Internal consistency and reliability were measured with the Japanese FIM+FAM-J in 42 patients a mean 30.2 (± 21.2) days post CVA .
• Excellent internal consistency was observed for the FIM+FAM-J (full scale [0.968], motor scale [0.954] and cognitive subscales [0.949])
• Excellent intra rater reliability was observed within the FIM+FAM-J full scale, motor subscale and cognitive subscale ((0.83, 0.80 and 0.98 respectively).
• Excellent criterion validity was measured between the FIM+FAM-j full scale and the Motor Scale with the Barthel Index [ BI], the National Institutes of Health Stroke Scale [NIHSS], modified Rankin Scale [mRS] and Brunnstrom Recovery State [BRS L/E] (r=0.83, -0.75, -0.82 and 0.79 respectively with the total scale and 0.88, -0.77, -0.87, and 0.83 respectively for the motor scale)
• Adequate criterion validity of the FIM+FAM-J cognitive scale with the BI, NIHSS, mRS and BRSL/E (0.56, -0.53,-0.54 and 0.53 respectively)
• Adequate correlations with the Mini Mental Status Examination [MMSE] and the Frontal Assessment Battery [FAB] ( 0.60 and 0.58) but a floor effect with the Catherine Bergego Scale [CBS].
(Naghdi et al, 2016) Two raters administered the Persian FIM and the Barthel Index to 40 patient, mean age of 60 (±14.9) years old and an average of 21 (± 23) months post first stroke .
• Excellent intra-rater reliability was measured {0.88-0.98) • Internal consistency of the PFIM was excellent, ranging from 0.70 to
0.96 • Construct validity was supported by a significant Pearson Correlation
between the PFIM and the Persian Barthel Index (r=0.95)
Systematic Reviews
In a systematic review of outcome measures used with patients post stroke participating in robot-assisted exercise trials (RAET), the FIMTM Motor Scale
For more information visit www.neuropt.org or email [email protected]
was used as a measure of activity level in 9 of 28 RAET trials. With scores ranging from 13-91, the MCID was 11. The FIM Motor Scale had high/excellent reliability (test-retest and inter-rater reliability) and high/excellent validity (>0.75) However, the FIM Motor Scale had only moderate responsiveness (0.4-0.74), with chronic stroke survivors with severe impairments (persisting beyond 6 months) demonstrating little change on the FIM Motor Scale. As a measure of global physical activities, the FIM Motor Scale may be impacted by many other factors beyond specific arm function. The CAHAI or the ARAT may be a more appropriate arm outcome measure for stroke survivors with severe impairments. (Sivan et al, 2011)
Do you see an error or have a suggestion for this instrument summary? Please e-mail us!
Bibliography Bates, B.E., Xie, D., et al. (2015). “Development and validation of prognostic indices for recovery of physical functioning following stroke: part 1.” American Academy of Physical Medicine and Rehabilitation 7: 685-698.
Bates, B.E., Xie, D., et al. (2015). “Development and validation of prognostic indices for recovery of physical functioning following stroke: part 2.” American Academy of Physical Medicine and Rehabilitation 7: 699-710.
Berges, I.M., Kuo, Y.F., et al. (2012). “Recovery of functional status after stroke in tri-ethnic population.” Physical Medicine and Rehabilitaiton 4(4): 290-295.
Beninato, M., Gill-Body, K. M., et al. (2006). "Determination of the minimal clinically important difference in the FIM instrument in patients with stroke." Arch Phys Med Rehabil 87(1): 32-39. Find it on PubMed
Brock, K. A., Goldie, P. A., et al. (2002). "Evaluating the effectiveness of stroke rehabilitation: choosing a discriminative measure." Arch Phys Med Rehabil 83: 92-99. Find it on PubMed
Caglar, N.S., Erdem, I.H., et al. (2014). “Where are we in terms of poststroke functional outcomes and risk factors.” NeuroRehabilitation 34: 391-399.
Canbek, J., Fulk, G. et al. (2013). “Test-restest reliability and construct validity of the Tinetti Performance-Oriented Mobility Assessment in people with stroke.” J Neurol Phys Ther 37:14-19.
Cavanagh, S. J., Hogan, K., et al. (2000). "Stroke-specific FIM models in an urban population." J Neurosci Nurs 32(1): 17-21. Find it on PubMed
For more information visit www.neuropt.org or email [email protected]
Chen, H., Wu, C., et al. (2013). “Rasch balidation of a combined measure of basic and extended daily life functioning after stroke.” Neurorehabilitation and Neural Repair 27(2):125-132..
Cooke, D.M., Gustafsson, L., et al. (2010). “Clock drawing from the occupational therapy adult perceptual screening test: its correlation with demographic and clinical factors in the stroke population.” Australian Occupational Therapy Journal 57: 183-189. Find it on PubMed
Coster, W. J., Haley, S. M., et al. (2006). "Measuring patient-reported outcomes after discharge from inpatient rehabilitation settings." J Rehabil Med 38(4): 237-242. Find it on PubMed
Denti, L., Agosti, M., et al. (2008). "Outcome predictors of rehabilitation for first stroke in the elderly." Eur J Phys Rehabil Med 44(1): 3-11. Find it on PubMed
Ditunno, J. F., Jr., Barbeau, H., et al. (2007). "Validity of the walking scale for spinal cord injury and other domains of function in a multicenter clinical trial." Neurorehabil Neural Repair 21(6): 539-550. Find it on PubMed
Dodds, T. A., Martin, D. P., et al. (1993). "A validation of the functional independence measurement and its performance among rehabilitation inpatients." Arch Phys Med Rehabil 74(5): 531-536. Find it on PubMed
Donaghy, S. and Wass, P. J. (1998). "Interrater reliability of the Functional Assessment Measure in a brain injury rehabilitation program." Arch Phys Med Rehabil 79(10): 1231-1236. Find it on PubMed
Donnelly, C., Eng, J. J., et al. (2004). "Client-centred assessment and the identification of meaningful treatment goals for individuals with a spinal cord injury." Spinal Cord 42(5): 302-307. Find it on PubMed
Dromerick, A. W., Edwards, D. F., et al. (2003). "Sensitivity to changes in disability after stroke: a comparison of four scales useful in clinical trials." Journal of Rehabilitation Research and Development 40(1): 1-8. Find it on PubMed
Ellis, T., Katz, D. I., et al. (2008). "Effectiveness of an inpatient multidisciplinary rehabilitation program for people with Parkinson disease." Physical therapy 88(7): 812-819.
Fujiwara, T., Hara, Y., et al. (1999). "Relationship between shoulder muscle strength and functional independence measure (FIM) score among C6 tetraplegics." Spinal Cord 37(1): 58-61. Find it on PubMed
For more information visit www.neuropt.org or email [email protected]
Granger, C. V., Hamilton, B. B., et al. (1986). "Advances in functional assessment for medical rehabilitation." Topics in Geriatric Rehabilitation 1(3): 59-74.
Grey, N. and Kennedy, P. (1993). "The Functional Independence Measure: a comparative study of clinician and self ratings." Paraplegia 31(7): 457-461. Find it on PubMed
Hall, K. M., Bushnik, T., et al. (2001). "Assessing traumatic brain injury outcome measures for long-term follow-up of community-based individuals." Arch Phys Med Rehabil 82(3): 367-374. Find it on PubMed
Hall, K. M., Cohen, M. E., et al. (1999). "Characteristics of the Functional Independence Measure in traumatic spinal cord injury." Arch Phys Med Rehabil 80(11): 1471-1476. Find it on PubMed
Heinemann, A. W., Linacre, J. M., et al. (1994). "Prediction of rehabilitation outcomes with disability measures." Arch Phys Med Rehabil 75(2): 133-143. Find it on PubMed
Hobart, J. C., Lamping, D. L., et al. (2001). "Evidence-based measurement: which disability scale for neurologic rehabilitation?" Neurology 57(11524472): 639-644. Find it on PubMed
Hsueh, I. P., Lin, J. H., et al. (2002). "Comparison of the psychometric characteristics of the functional independence measure, 5 item Barthel index, and 10 item Barthel index in patients with stroke." Journal of Neurology, Neurosurgery and Psychiatry 73(2): 188-190. Find it on PubMed
Huang, Y., Wu, C. (2010). “Predictors of change in quality of life after distributed constraint-induced therapy in patients with chronic stroke.” Neurorehabilitation and Neural Repair 24(6): 559-566.
Inouye, M., Hashimoto, H., et al. (2001). "Influence of admission functional status on functional change after stroke rehabilitation." Am J Phys Med Rehabil 80(2): 121-125; quiz 126, 146. Find it on PubMed
Jackson, A. B., Carnel, C. T., et al. (2008). "Outcome measures for gait and ambulation in the spinal cord injury population." J Spinal Cord Med 31(5): 487-499. Find it on PubMed
Karamehmetoglu, S. S., Karacan, I., et al. (1997). "The functional independence measure in spinal cord injured patients: comparison of questioning with observational rating." Spinal Cord 35(1): 22-25. Find it on PubMed
Kay, E., Deutsch, A., et al. (2010). "Effects of gender on inpatient rehabilitation outcomes in the elderly with incomplete paraplegia from
For more information visit www.neuropt.org or email [email protected]
nontraumatic spinal cord injury." J Spinal Cord Med 33(4): 379-386. Find it on PubMed
Keith, R. A., Granger, C. V., et al. (1987). "The functional independence measure: a new tool for rehabilitation." Adv Clin Rehabil 1(3503663): 6-18. Find it on PubMed
Kohler, F., Dickson, H., et al. (2009). "Agreement of functional independence measure item scores in patients transferred from one rehabilitation setting to another." Eur J Phys Rehabil Med 45(4): 479-485. Find it on PubMed
Kucukdeveci, A. A., Sehim, K., et al. (2013). “The reliability and validity of the World Health Organization Disability Assessment Schedule (WHODAS-II) in stroke.” Disability & Rehabilitation 35(3): 214-220.
Kucukdeveci, A. A., Yavuzer, G., et al. (2001). "Adaptation of the Functional Independence Measure for use in Turkey." Clin Rehabil 15(3): 311-319. Find it on PubMed
Lawton, G., Lundgren-Nilsson, Å., et al. (2006). "Cross-cultural validity of FIM in spinal cord injury." Spinal Cord 44(12): 746-752. Find it on PubMed
Lin, K., Fu, T., et al. (2010). “Psychometric comparisons of the Stroke Impact Scale 3.0 and Stroke-Specific Quality of Life Scale.” Qual Life Res 19:435-443.
Lundgren-Nilsson, Å., Tennant, A., et al. (2006). "Cross-diagnostic validity in a generic instrument: an example from the Functional Independence Measure in Scandinavia." Health and Quality of Life Outcomes 4(1): 55. Find it on PubMed
Lundgren Nilsson, A. and A. (2011) Tennant, Past and present issues in Rasch analysis: the functional independence measure (FIM) revisited. J Rehabil Med 43(10): p. 884-91. Marciniak, C. M., Choo, C. M., et al. (2011). "Do co-morbidities and cognition impact functional change and discharge needs in Parkinson disease?" American Journal of Physical Medicine & Rehabilitation 90(4): 272-280.
Miki, E., et al. 2015 Validity and reliability of the Japanese version of the FIM + FAM in patients with cerebrovascular accident. Scand J Occup Ther. 1-7.
Montecchi, M.G., et al.,(2013) Trunk Recovery Scale: a new tool to measure posture control in patients with severe acquired brain injury. A study of the psychometric properties. Eur J Phys Rehabil Med 49(3): p. 341-51. Naghdi, S., et al.2016 Cross-cultural validation of the Persian version of the Functional Independence Measure for patients with stroke. Disabil Rehabil. 38(3): p. 289-98.
For more information visit www.neuropt.org or email [email protected]
Ng, Y. S., Jung, H., et al. (2007). "Results from a prospective acute inpatient rehabilitation database: clinical characteristics and functional outcomes using the Functional Independence Measure." Ann Acad Med Singapore 36(1): 3-10. Find it on PubMed
Nichol, A. D., Higgins, A. M., et al. (2011). "Measuring functional and quality of life outcomes following major head injury: common scales and checklists." Injury 42(3): 281-287. Find it on PubMed
Nilsson, A. L., Sunnerhagen, K. S., et al. (2005). "Scoring alternatives for FIM in neurological disorders applying Rasch analysis." Acta Neurol Scand 111(4): 264-273. Find it on PubMed
O'Brien, S.R., et al. (2013) Shorter length of stay is associated with worse functional outcomes for medicare beneficiaries with stroke. Phys Ther 93(12): p. 1592-602
Ottiger, B., et al. (2015) Validation of the new Lucerne ICF based Multidisciplinary Observation Scale (LIMOS) for stroke patients. PLoS One 10(6): p. e0130925.
Ottenbacher, K. J., Hsu, Y., et al. (1996). "The reliability of the functional independence measure: a quantitative review." Arch Phys Med Rehabil 77: 1226-1232. Find it on PubMed
Pollak, N., Rheault, W., et al. (1996). "Reliability and validity of the FIM for persons aged 80 years and above from a multilevel continuing care retirement community." Arch Phys Med Rehabil 77(10): 1056-1061. Find it on PubMed
Price, G. L., Kendall, M., et al. (2004). "Perceived causes of change in function and quality of life for people with long duration spinal cord injury." Clin Rehabil 18(2): 164-171. Find it on PubMed
Saboe, L. A., Darrah, J. M., et al. (1997). "Early predictors of functional independence 2 years after spinal cord injury." Arch Phys Med Rehabil 78(6): 644-650. Find it on PubMed
Salter, K., et al. 2010 Clinical Outcome Variables Scale: A retrospective validation study in patients after stroke. J Rehabil Med 42(7): p. 609-13.
Sasaki, T., et al. 2014 Reliability, validity, and factor structure of the Cognitive Behavioral Rating Scale for stroke patients. Int J Rehabil Res 37(4): p. 343-8.
For more information visit www.neuropt.org or email [email protected]
Segal, M. E., Ditunno, J. F., et al. (1993). "Interinstitutional agreement of individual functional independence measure (FIM) items measured at two sites on one sample of SCI patients." Paraplegia 31(8259324): 622-631.
Sharrack, B., Hughes, R. A., et al. (1999). "The psychometric properties of clinical rating scales used in multiple sclerosis." Brain 122 ( Pt 1): 141-159. Find it on PubMed
Shindo, K., et al. (2015) Psychometric properties of the simple test for evaluating hand function in patients with stroke. Brain Inj 29(6): p. 772-6. Sivan, M., et al. ( 2011) Systematic review of outcome measures used in the evaluation of robot-assisted upper limb exercise in stroke. J Rehabil Med 43(3): p. 181-9.
Spooren, A. I., Janssen-Potten, Y. J., et al. (2006). "Measuring change in arm hand skilled performance in persons with a cervical spinal cord injury: responsiveness of the Van Lieshout Test." Spinal Cord 44(12): 772-779. Find it on PubMed
Stineman, M. G., Shea, J. A., et al. (1996). "The Functional Independence Measure: tests of scaling assumptions, structure, and reliability across 20 diverse impairment categories." Arch Phys Med Rehabil 77(11): 1101-1108. Find it on PubMed
Tur, B. S., Gursel, Y. K., et al. (2003). "Rehabilitation outcome of Turkish stroke patients: in a team approach setting." Int J Rehabil Res 26(4): 271-277. Find it on PubMed
Turner-Stokes, L., et al. 2010 Deriving a Barthel Index from the Northwick Park Dependency Scale and the Functional Independence Measure: are they equivalent? Clin Rehabil 24(12): p. 1121-6. Ward, I., et al., (2011) Validity of the stroke rehabilitation assessment of movement scale in acute rehabilitation: a comparison with the functional independence measure and stroke impact scale-16. PM R,. 3(11): p. 1013-21.
Van Heugten, C.M., L. Walton, and U. Hentschel 2015 Can we forget the Mini-Mental State Examination? A systematic review of the validity of cognitive screening instruments within one month after stroke. Clin Rehabil 29(7): p. 694-704
Yang, S.Y. and K.H. Kong, (2013) Level and predictors of participation in patients with stroke undergoing inpatient rehabilitation. Singapore Med J . 54(10): p. 564-8.
For more information visit www.neuropt.org or email [email protected]
Yavuz, N., Tezyurek, M., et al. (1998). "A comparison of two functional tests in quadriplegia: the quadriplegia index of function and the functional independence measure." Spinal Cord 36(12): 832-837. Find it on PubMed
Year published 1983
Instrument in PDF Format
Yes
Approval Status Approved
For more information visit www.neuropt.org or email [email protected]
14. REHAB MEASURES: FUGL-MEYER ASSESSMENT OF MOTOR RECOVERY AFTER STROKE
Title of Assessment Fugl-Meyer Assessment of Motor and Sensory Recovery after Stroke
Acronym FMA
Instrument Reviewer(s) Updated by Carmen Capo-Lugo, PT, PhD and Dorian Rose PT, PhD of the Stroke Edge II Task Force in 2016.
Summary Date 11/12/16
Purpose • Evaluates and measures recovery in post-stroke hemiplegic patients
• Used in both clinical and research settings
• One of the most widely used quantitative measures of motor impairment (Gladstone et al, 2002)
Description • Items are scored on a 3-point ordinal scale
o 0 = cannot perform
o 1 = performs partially
o 2 = performs fully
• Maximum Score = 226 points
• The Five domains assessed include:
o Motor function (UE maximum score = 66; LE maximum score = 34)
o Sensory function (maximum score = 24)
o Balance (maximum score = 14)
o Joint range of motion (maximum score = 44)
o Joint pain (maximum score = 44)
• Subscales can be administered without the using the full test
• Modified (abbreviated) versions have been developed (Hsueh et al, 2008)
Area of Assessment Activities of Daily Living; Functional Mobility; Pain
Body Part Not Applicable
For more information visit www.neuropt.org or email [email protected]
ICF Domain Body Function
Domain Motor; Sensory
Assessment Type Observer
Length of Test 06 to 30 Minutes
Time to Administer 30 minutes (shortened versions > 10 minutes)
Number of Items 226 items across 5 domains
Equipment Required The FMA Motor Test requires:
• Tennis ball
• A small spherical shaped container
• A tool to administer reflex tests
• Enough space is needed for a patient to move around freely
• If possible, space should be a quiet, private room with few distractions
Training Required Review of manual
Type of training required Reading an Article/Manual
Cost Free
Actual Cost Nominal - cost of equipment only
Age Range Adolescent: 13-17 years; Adult: 18-64 years; Elderly adult: 65+
Administration Mode Paper/Pencil
Diagnosis Stroke
Populations Tested The FMA was designed for post-stroke hemiplegic patients of all ages
Standard Error of Measurement (SEM)
Stroke:
(Sanford et al, 1993; n = 12; mean age = 66 years; stroke onset < 6 months, Acute Stroke)
For more information visit www.neuropt.org or email [email protected]
• FMA total scores: 9.4
Minimal Detectable Change (MDC)
Stroke:
(Wagner et al, 2008, n = 14, mean age = 59.9 (14.6) years, assessed on average 14 (6.5) months post stroke, Chronic Stroke)
• FMA = 5.2 points for the Upper Extremity portion of the assessment
Minimally Clinically Important Difference (MCID)
Stroke:
(Shelton et al, 2001; n = 171; mean age 70 (11) years; assessed within 17 (12) days of stroke, Acute Stroke)
FMA Motor Scores from Admission to Discharge
• 10 point increase in FMA Upper Extremity = 1.5 change in discharge FIM
• 10 point increase in FMA Lower Extremity = 1.9 change in discharge FIM
Cut-Off Scores Stroke:
(Duncan et al, 2000; n = 459; mean age = 70 (11.4) years; stroke onset within 14 days, Acute Stroke)
Six month outcomes by modified Rankin classifications
Rankin 1 2 3 4 5 6
Fugl-Meyer
99.31 (1.49)
91.76 (9.51)
82.94 (17.18)
62.58 (24.04)
39.15 (25.42)
16.69 (23.89)
NIH 0.07 (0.27)
0.78 (1.12)
2.06 (1.63)
3.93 (2.55)
7.94 (4.80)
18.71(11.74)
Barthel 99.23 (1.88)
98.97 (2.83)
96.52 (5.08)
83.40 (13.50)
42.83 (18.25)
6.43 (8.86)
SF36-PFI 85.38 (9.46)
70.12 (21.06)
54.23 (22.98)
29.38 (21.04)
8.68 (11.87)
1.67 (4.08)
Normative Data Stroke:
(Duncan et al, 2000, Acute Stroke)
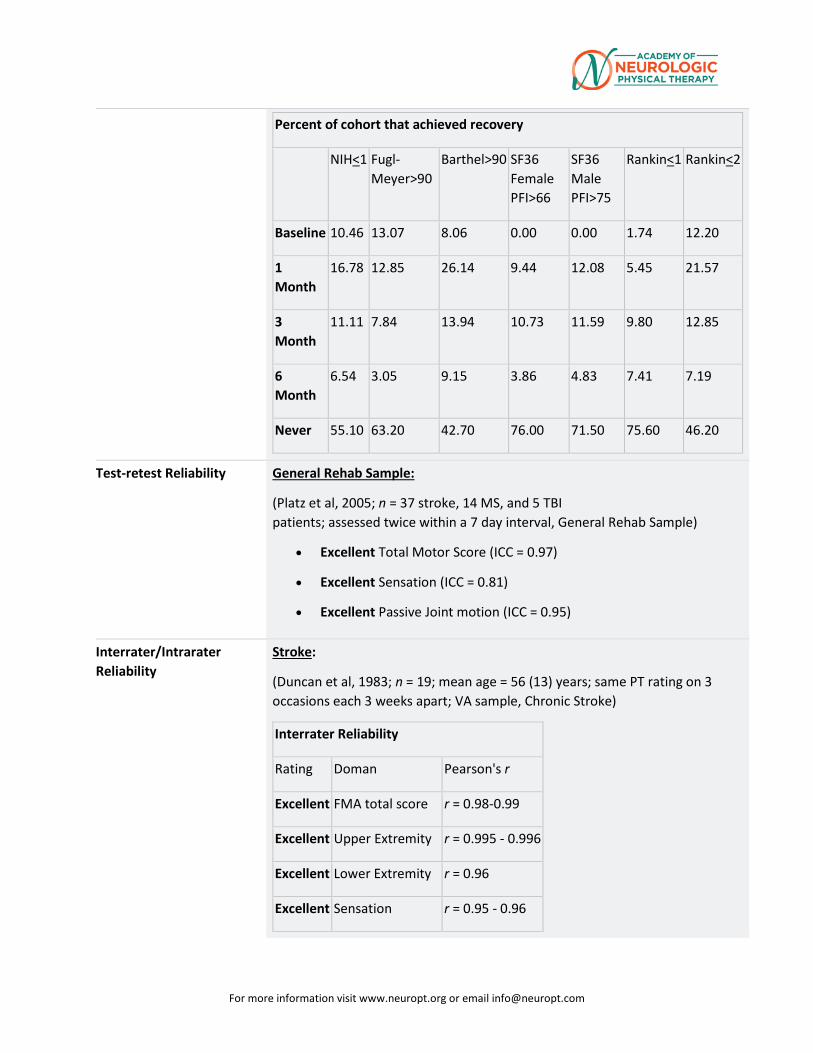
For more information visit www.neuropt.org or email [email protected]
Percent of cohort that achieved recovery
NIH<1 Fugl-Meyer>90
Barthel>90 SF36 Female PFI>66
SF36 Male PFI>75
Rankin<1 Rankin<2
Baseline 10.46 13.07 8.06 0.00 0.00 1.74 12.20
1 Month
16.78 12.85 26.14 9.44 12.08 5.45 21.57
3 Month
11.11 7.84 13.94 10.73 11.59 9.80 12.85
6 Month
6.54 3.05 9.15 3.86 4.83 7.41 7.19
Never 55.10 63.20 42.70 76.00 71.50 75.60 46.20
Test-retest Reliability General Rehab Sample:
(Platz et al, 2005; n = 37 stroke, 14 MS, and 5 TBI patients; assessed twice within a 7 day interval, General Rehab Sample)
• Excellent Total Motor Score (ICC = 0.97)
• Excellent Sensation (ICC = 0.81)
• Excellent Passive Joint motion (ICC = 0.95)
Interrater/Intrarater Reliability
Stroke:
(Duncan et al, 1983; n = 19; mean age = 56 (13) years; same PT rating on 3 occasions each 3 weeks apart; VA sample, Chronic Stroke)
Interrater Reliability
Rating Doman Pearson's r
Excellent FMA total score r = 0.98-0.99
Excellent Upper Extremity r = 0.995 - 0.996
Excellent Lower Extremity r = 0.96
Excellent Sensation r = 0.95 - 0.96
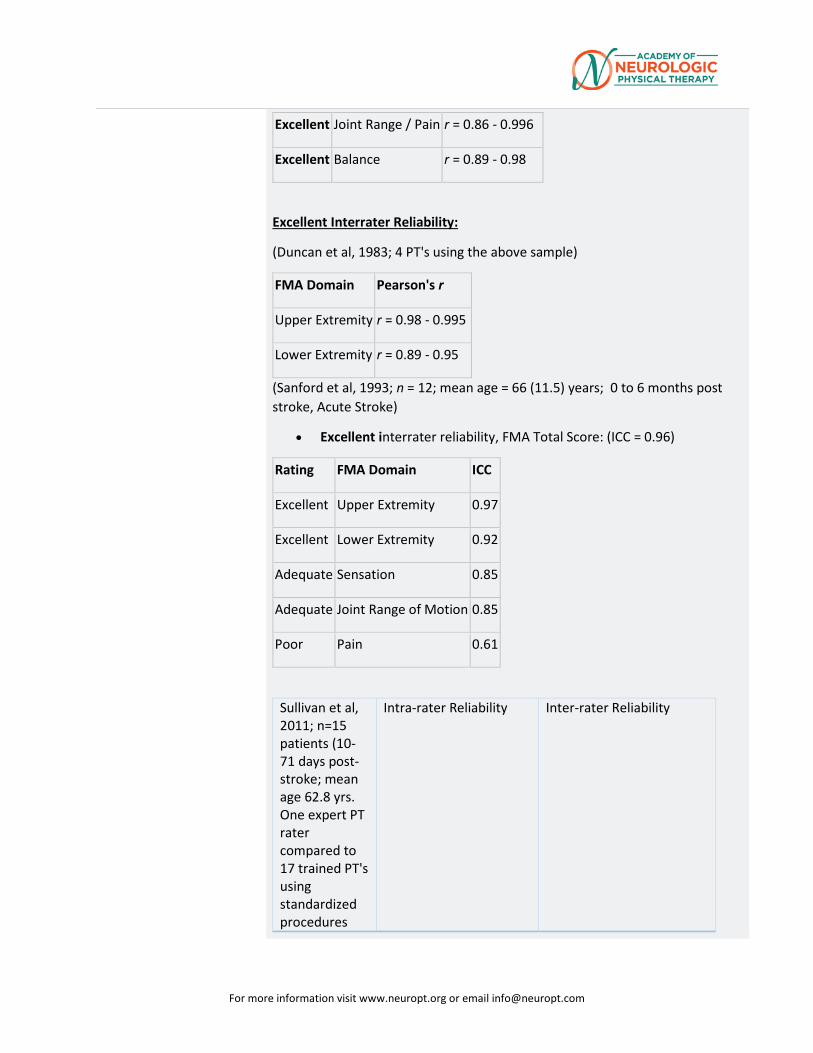
For more information visit www.neuropt.org or email [email protected]
Excellent Joint Range / Pain r = 0.86 - 0.996
Excellent Balance r = 0.89 - 0.98
Excellent Interrater Reliability:
(Duncan et al, 1983; 4 PT's using the above sample)
FMA Domain Pearson's r
Upper Extremity r = 0.98 - 0.995
Lower Extremity r = 0.89 - 0.95
(Sanford et al, 1993; n = 12; mean age = 66 (11.5) years; 0 to 6 months post stroke, Acute Stroke)
• Excellent interrater reliability, FMA Total Score: (ICC = 0.96)
Rating FMA Domain ICC
Excellent Upper Extremity 0.97
Excellent Lower Extremity 0.92
Adequate Sensation 0.85
Adequate Joint Range of Motion 0.85
Poor Pain 0.61
Sullivan et al, 2011; n=15 patients (10-71 days post-stroke; mean age 62.8 yrs. One expert PT rater compared to 17 trained PT's using standardized procedures
Intra-rater Reliability
Inter-rater Reliability
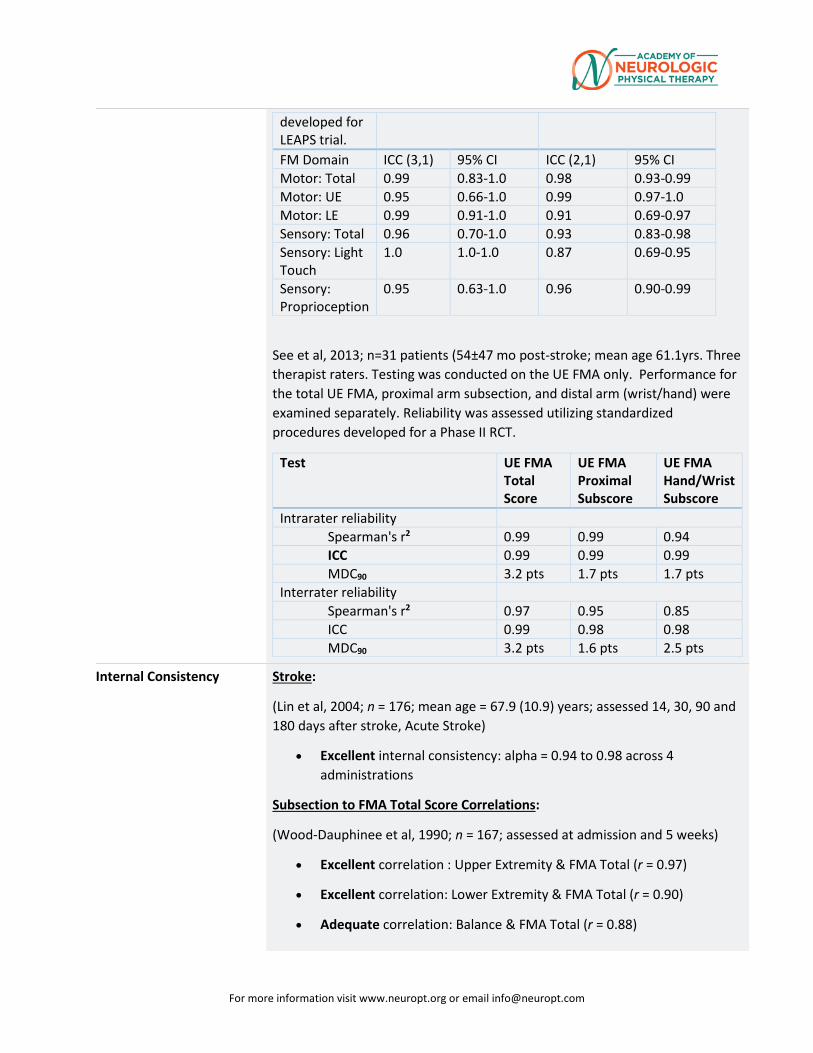
For more information visit www.neuropt.org or email [email protected]
developed for LEAPS trial. FM Domain ICC (3,1) 95% CI ICC (2,1) 95% CI Motor: Total 0.99 0.83-1.0 0.98 0.93-0.99 Motor: UE 0.95 0.66-1.0 0.99 0.97-1.0 Motor: LE 0.99 0.91-1.0 0.91 0.69-0.97 Sensory: Total 0.96 0.70-1.0 0.93 0.83-0.98 Sensory: Light Touch
1.0 1.0-1.0 0.87 0.69-0.95
Sensory: Proprioception
0.95 0.63-1.0 0.96 0.90-0.99
See et al, 2013; n=31 patients (54±47 mo post-stroke; mean age 61.1yrs. Three therapist raters. Testing was conducted on the UE FMA only. Performance for the total UE FMA, proximal arm subsection, and distal arm (wrist/hand) were examined separately. Reliability was assessed utilizing standardized procedures developed for a Phase II RCT.
Test UE FMA Total Score
UE FMA Proximal Subscore
UE FMA Hand/Wrist Subscore
Intrarater reliability Spearman's r2 0.99 0.99 0.94 ICC 0.99 0.99 0.99 MDC90 3.2 pts 1.7 pts 1.7 pts
Interrater reliability Spearman's r2 0.97 0.95 0.85 ICC 0.99 0.98 0.98 MDC90 3.2 pts 1.6 pts 2.5 pts
Internal Consistency Stroke:
(Lin et al, 2004; n = 176; mean age = 67.9 (10.9) years; assessed 14, 30, 90 and 180 days after stroke, Acute Stroke)
• Excellent internal consistency: alpha = 0.94 to 0.98 across 4 administrations
Subsection to FMA Total Score Correlations:
(Wood-Dauphinee et al, 1990; n = 167; assessed at admission and 5 weeks)
• Excellent correlation : Upper Extremity & FMA Total (r = 0.97)
• Excellent correlation: Lower Extremity & FMA Total (r = 0.90)
• Adequate correlation: Balance & FMA Total (r = 0.88)
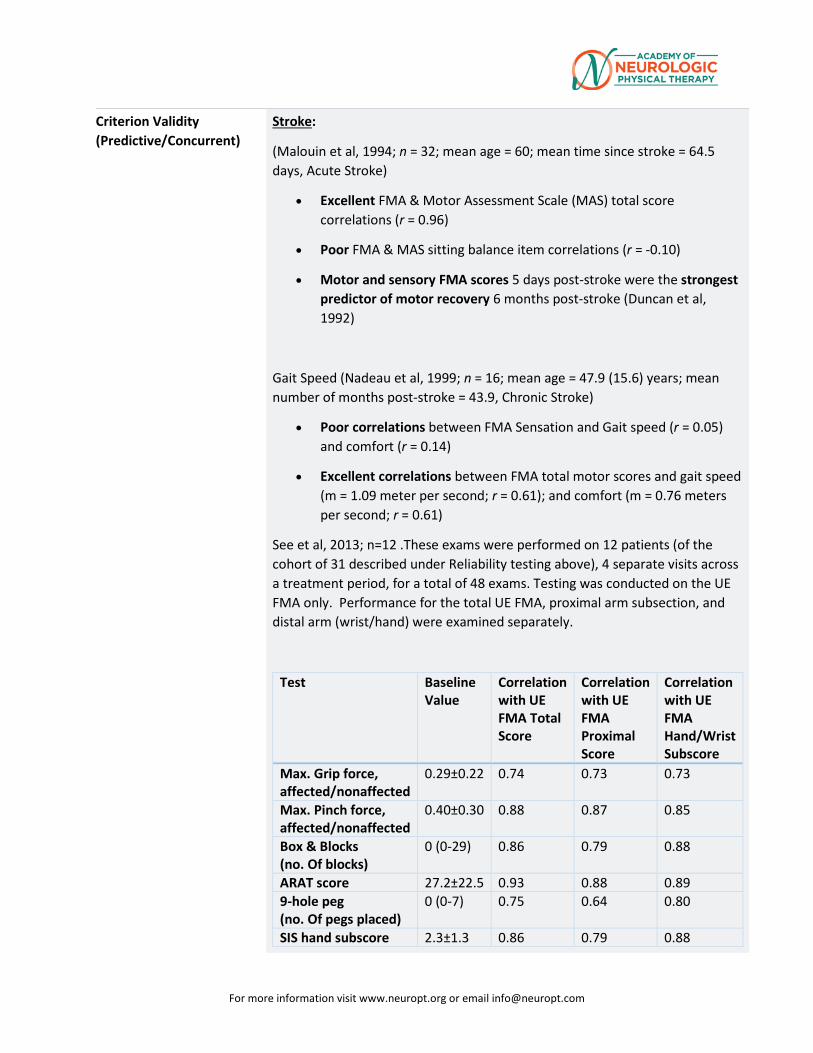
For more information visit www.neuropt.org or email [email protected]
Criterion Validity (Predictive/Concurrent)
Stroke:
(Malouin et al, 1994; n = 32; mean age = 60; mean time since stroke = 64.5 days, Acute Stroke)
• Excellent FMA & Motor Assessment Scale (MAS) total score correlations (r = 0.96)
• Poor FMA & MAS sitting balance item correlations (r = -0.10)
• Motor and sensory FMA scores 5 days post-stroke were the strongest predictor of motor recovery 6 months post-stroke (Duncan et al, 1992)
Gait Speed (Nadeau et al, 1999; n = 16; mean age = 47.9 (15.6) years; mean number of months post-stroke = 43.9, Chronic Stroke)
• Poor correlations between FMA Sensation and Gait speed (r = 0.05) and comfort (r = 0.14)
• Excellent correlations between FMA total motor scores and gait speed (m = 1.09 meter per second; r = 0.61); and comfort (m = 0.76 meters per second; r = 0.61)
See et al, 2013; n=12 .These exams were performed on 12 patients (of the cohort of 31 described under Reliability testing above), 4 separate visits across a treatment period, for a total of 48 exams. Testing was conducted on the UE FMA only. Performance for the total UE FMA, proximal arm subsection, and distal arm (wrist/hand) were examined separately.
Test Baseline Value
Correlation with UE FMA Total Score
Correlation with UE FMA Proximal Score
Correlation with UE FMA Hand/Wrist Subscore
Max. Grip force, affected/nonaffected
0.29±0.22 0.74 0.73 0.73
Max. Pinch force, affected/nonaffected
0.40±0.30 0.88 0.87 0.85
Box & Blocks (no. Of blocks)
0 (0-29) 0.86 0.79 0.88
ARAT score 27.2±22.5 0.93 0.88 0.89 9-hole peg (no. Of pegs placed)
0 (0-7) 0.75 0.64 0.80
SIS hand subscore 2.3±1.3 0.86 0.79 0.88
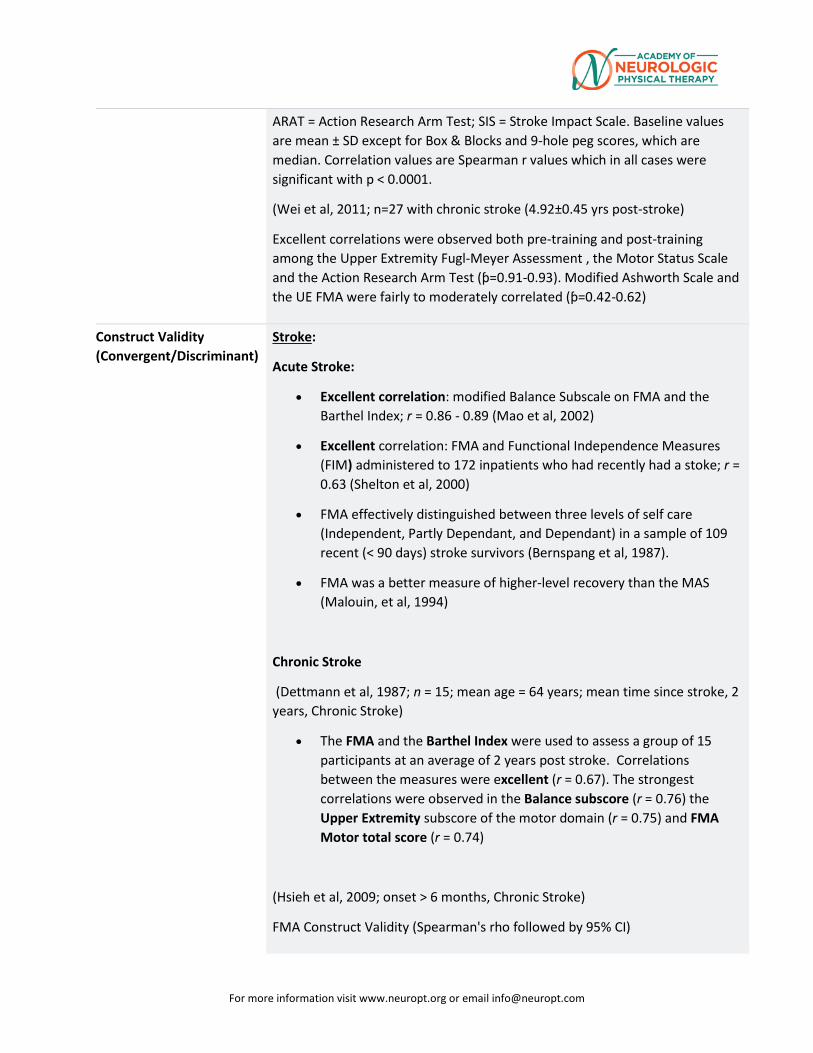
For more information visit www.neuropt.org or email [email protected]
ARAT = Action Research Arm Test; SIS = Stroke Impact Scale. Baseline values are mean ± SD except for Box & Blocks and 9-hole peg scores, which are median. Correlation values are Spearman r values which in all cases were significant with p < 0.0001.
(Wei et al, 2011; n=27 with chronic stroke (4.92±0.45 yrs post-stroke)
Excellent correlations were observed both pre-training and post-training among the Upper Extremity Fugl-Meyer Assessment , the Motor Status Scale and the Action Research Arm Test (ƥ=0.91-0.93). Modified Ashworth Scale and the UE FMA were fairly to moderately correlated (ƥ=0.42-0.62)
Construct Validity (Convergent/Discriminant)
Stroke:
Acute Stroke:
• Excellent correlation: modified Balance Subscale on FMA and the Barthel Index; r = 0.86 - 0.89 (Mao et al, 2002)
• Excellent correlation: FMA and Functional Independence Measures (FIM) administered to 172 inpatients who had recently had a stoke; r = 0.63 (Shelton et al, 2000)
• FMA effectively distinguished between three levels of self care (Independent, Partly Dependant, and Dependant) in a sample of 109 recent (< 90 days) stroke survivors (Bernspang et al, 1987).
• FMA was a better measure of higher-level recovery than the MAS (Malouin, et al, 1994)
Chronic Stroke
(Dettmann et al, 1987; n = 15; mean age = 64 years; mean time since stroke, 2 years, Chronic Stroke)
• The FMA and the Barthel Index were used to assess a group of 15 participants at an average of 2 years post stroke. Correlations between the measures were excellent (r = 0.67). The strongest correlations were observed in the Balance subscore (r = 0.76) the Upper Extremity subscore of the motor domain (r = 0.75) and FMA Motor total score (r = 0.74)
(Hsieh et al, 2009; onset > 6 months, Chronic Stroke)
FMA Construct Validity (Spearman's rho followed by 95% CI)
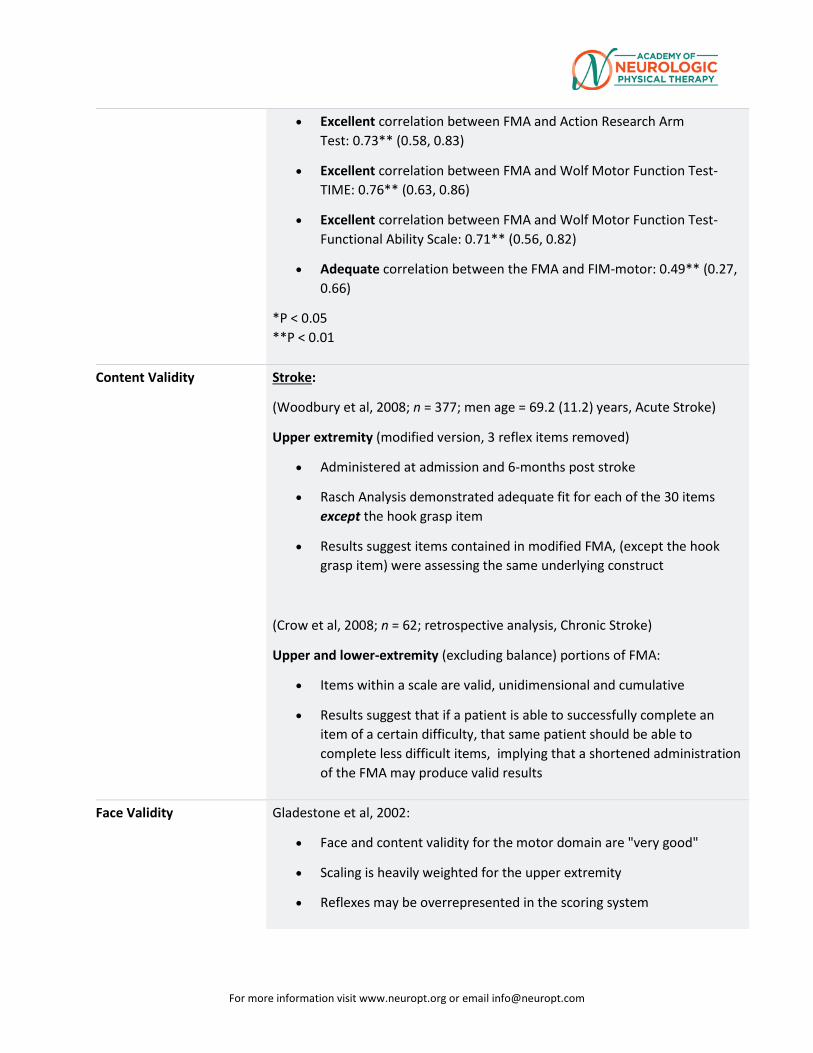
For more information visit www.neuropt.org or email [email protected]
• Excellent correlation between FMA and Action Research Arm Test: 0.73** (0.58, 0.83)
• Excellent correlation between FMA and Wolf Motor Function Test-TIME: 0.76** (0.63, 0.86)
• Excellent correlation between FMA and Wolf Motor Function Test-Functional Ability Scale: 0.71** (0.56, 0.82)
• Adequate correlation between the FMA and FIM-motor: 0.49** (0.27, 0.66)
*P < 0.05 **P < 0.01
Content Validity Stroke:
(Woodbury et al, 2008; n = 377; men age = 69.2 (11.2) years, Acute Stroke)
Upper extremity (modified version, 3 reflex items removed)
• Administered at admission and 6-months post stroke
• Rasch Analysis demonstrated adequate fit for each of the 30 items except the hook grasp item
• Results suggest items contained in modified FMA, (except the hook grasp item) were assessing the same underlying construct
(Crow et al, 2008; n = 62; retrospective analysis, Chronic Stroke)
Upper and lower-extremity (excluding balance) portions of FMA:
• Items within a scale are valid, unidimensional and cumulative
• Results suggest that if a patient is able to successfully complete an item of a certain difficulty, that same patient should be able to complete less difficult items, implying that a shortened administration of the FMA may produce valid results
Face Validity Gladestone et al, 2002:
• Face and content validity for the motor domain are "very good"
• Scaling is heavily weighted for the upper extremity
• Reflexes may be overrepresented in the scoring system
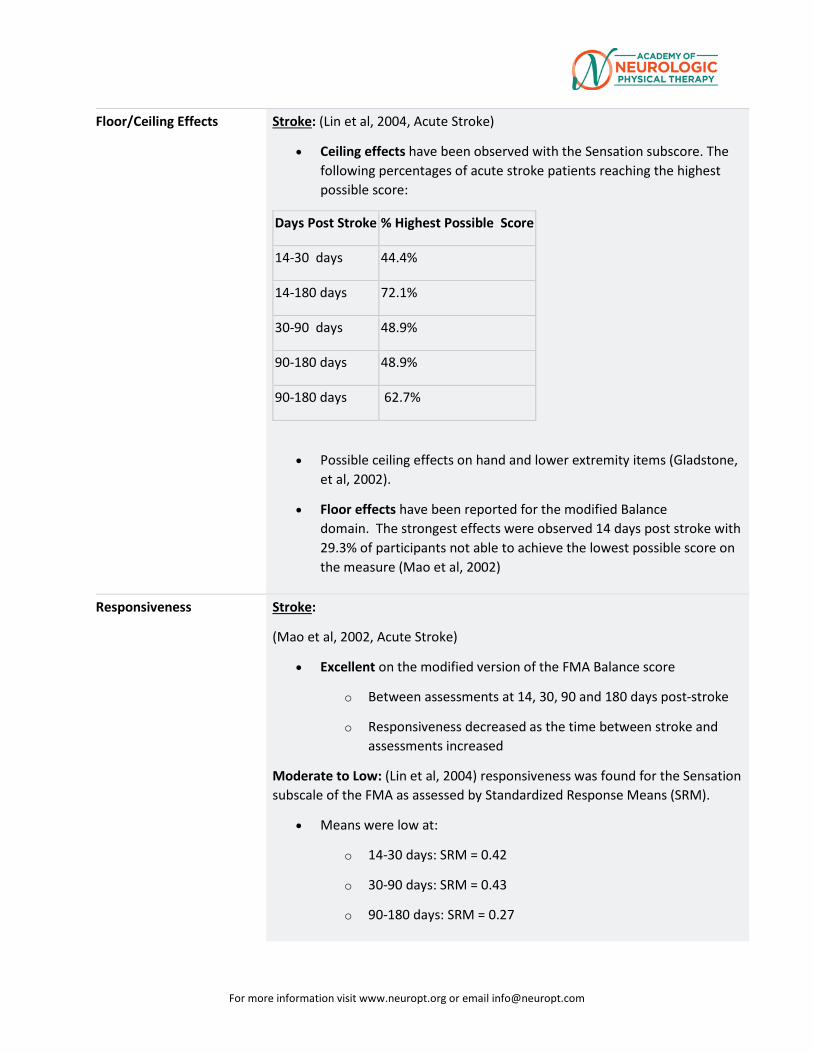
For more information visit www.neuropt.org or email [email protected]
Floor/Ceiling Effects Stroke: (Lin et al, 2004, Acute Stroke)
• Ceiling effects have been observed with the Sensation subscore. The following percentages of acute stroke patients reaching the highest possible score:
Days Post Stroke % Highest Possible Score
14-30 days 44.4%
14-180 days 72.1%
30-90 days 48.9%
90-180 days 48.9%
90-180 days 62.7%
• Possible ceiling effects on hand and lower extremity items (Gladstone, et al, 2002).
• Floor effects have been reported for the modified Balance domain. The strongest effects were observed 14 days post stroke with 29.3% of participants not able to achieve the lowest possible score on the measure (Mao et al, 2002)
Responsiveness Stroke:
(Mao et al, 2002, Acute Stroke)
• Excellent on the modified version of the FMA Balance score
o Between assessments at 14, 30, 90 and 180 days post-stroke
o Responsiveness decreased as the time between stroke and assessments increased
Moderate to Low: (Lin et al, 2004) responsiveness was found for the Sensation subscale of the FMA as assessed by Standardized Response Means (SRM).
• Means were low at:
o 14-30 days: SRM = 0.42
o 30-90 days: SRM = 0.43
o 90-180 days: SRM = 0.27
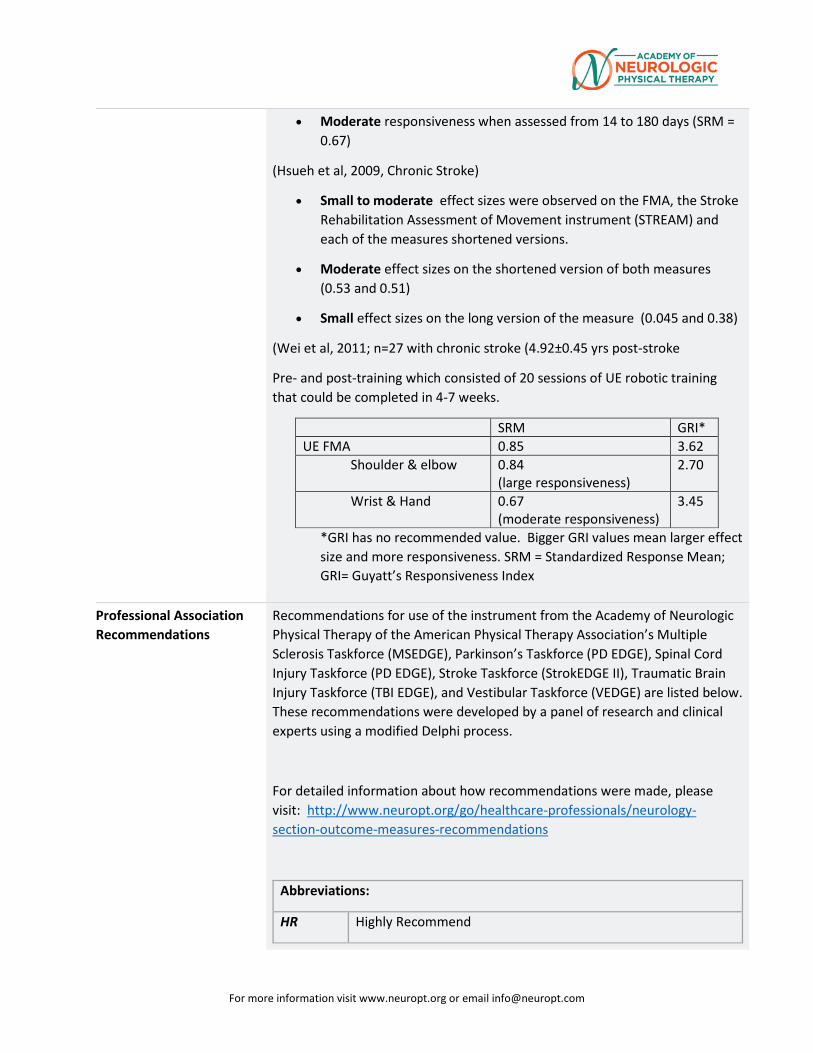
For more information visit www.neuropt.org or email [email protected]
• Moderate responsiveness when assessed from 14 to 180 days (SRM = 0.67)
(Hsueh et al, 2009, Chronic Stroke)
• Small to moderate effect sizes were observed on the FMA, the Stroke Rehabilitation Assessment of Movement instrument (STREAM) and each of the measures shortened versions.
• Moderate effect sizes on the shortened version of both measures (0.53 and 0.51)
• Small effect sizes on the long version of the measure (0.045 and 0.38)
(Wei et al, 2011; n=27 with chronic stroke (4.92±0.45 yrs post-stroke
Pre- and post-training which consisted of 20 sessions of UE robotic training that could be completed in 4-7 weeks.
SRM GRI* UE FMA 0.85 3.62
Shoulder & elbow 0.84 (large responsiveness)
2.70
Wrist & Hand 0.67 (moderate responsiveness)
3.45
*GRI has no recommended value. Bigger GRI values mean larger effect size and more responsiveness. SRM = Standardized Response Mean; GRI= Guyatt’s Responsiveness Index
Professional Association Recommendations
Recommendations for use of the instrument from the Academy of Neurologic Physical Therapy of the American Physical Therapy Association’s Multiple Sclerosis Taskforce (MSEDGE), Parkinson’s Taskforce (PD EDGE), Spinal Cord Injury Taskforce (PD EDGE), Stroke Taskforce (StrokEDGE II), Traumatic Brain Injury Taskforce (TBI EDGE), and Vestibular Taskforce (VEDGE) are listed below. These recommendations were developed by a panel of research and clinical experts using a modified Delphi process.
For detailed information about how recommendations were made, please visit: http://www.neuropt.org/go/healthcare-professionals/neurology-section-outcome-measures-recommendations
Abbreviations:
HR Highly Recommend
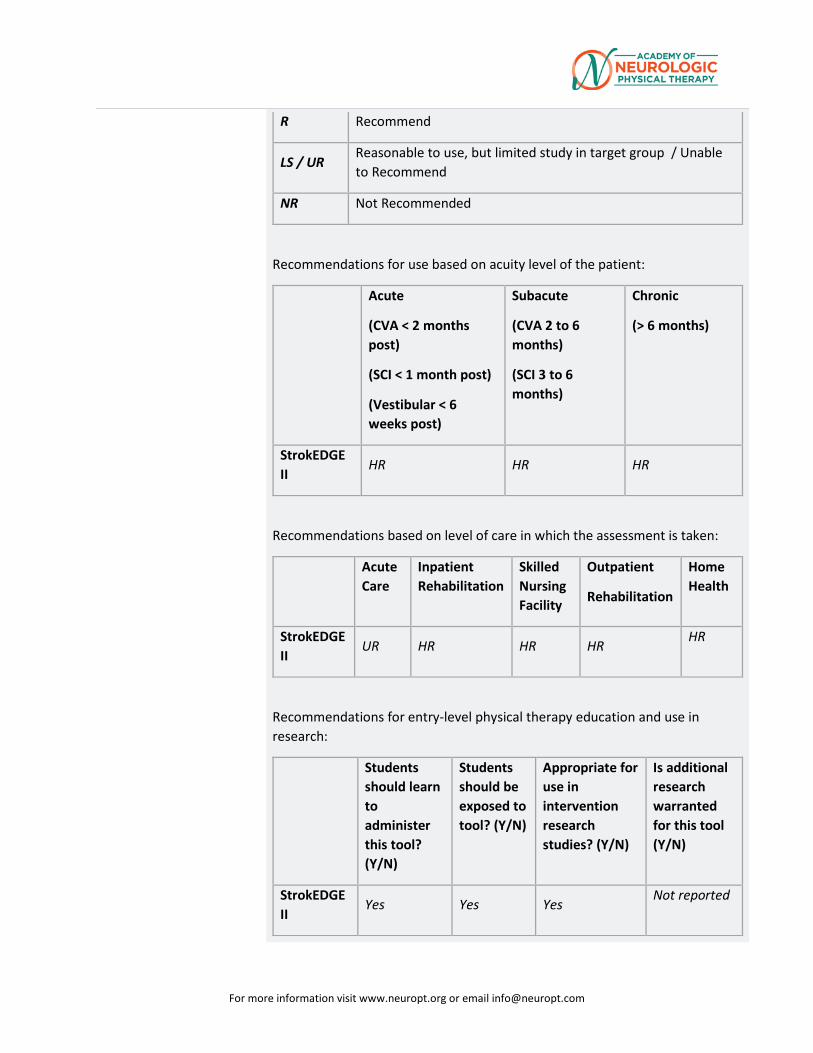
For more information visit www.neuropt.org or email [email protected]
R Recommend
LS / UR Reasonable to use, but limited study in target group / Unable to Recommend
NR Not Recommended
Recommendations for use based on acuity level of the patient:
Acute
(CVA < 2 months post)
(SCI < 1 month post)
(Vestibular < 6 weeks post)
Subacute
(CVA 2 to 6 months)
(SCI 3 to 6 months)
Chronic
(> 6 months)
StrokEDGE II
HR HR HR
Recommendations based on level of care in which the assessment is taken:
Acute Care
Inpatient Rehabilitation
Skilled Nursing Facility
Outpatient
Rehabilitation
Home Health
StrokEDGE II
UR HR HR HR HR
Recommendations for entry-level physical therapy education and use in research:
Students should learn to administer this tool? (Y/N)
Students should be exposed to tool? (Y/N)
Appropriate for use in intervention research studies? (Y/N)
Is additional research warranted for this tool (Y/N)
StrokEDGE II
Yes Yes Yes Not reported
For more information visit www.neuropt.org or email [email protected]
Considerations Limitations: (Gladstone et al, 2002)
• The Sensation, Balance, Joint Range of Motion and Joint Pain domains have been criticized as less well suited for this instrument given its intended purpose
• Joint Range of Motion may be a confounding variable, so the inclusion of the Joint Pain domain may be unnecessary
• Distal fine motor functions may be underrepresented
• Finger movement not assessed (but gross hand function is included)
• Arm scores are more heavily weighting the leg scores
• Better measure of balance are now available
• Inclusion of subjective items on the Sensation and Joint Pain domains may reduce the measures reliability
• The Sensory Scale’s psychometric properties suggest that is should NOT be used to assess stroke patients (Lin et al, 2004)
Do you see an error or have a suggestion for this instrument summary? Please e-mail us!
Bibliography Bernspang, B., Asplund, K., et al. (1987). "Motor and perceptual impairments in acute stroke patients: effects on self-care ability." Stroke 18: 1081-1086. Find it on PubMed
Crow, J. L. and Harmeling-van der Wel, B. C. (2008). "Hierarchical properties of the motor function sections of the Fugl-Meyer assessment scale for people after stroke: a retrospective study." Phys Ther 88: 1554-1567. Find it on PubMed
Dettmann, M. A., Linder, M. T., et al. (1987). "Relationships among walking performance, postural stability, and functional assessments of the hemiplegic patient." Am J Phys Med 66: 77-90. Find it on PubMed
Duncan, P. W., Goldstein, L. B., et al. (1992). "Measurement of motor recovery after stroke. Outcome assessment and sample size requirements." Stroke 23(8): 1084-1089. Find it on PubMed
Duncan, P. W., Lai, S. M., et al. (2000). "Defining post-stroke recovery: implications for design and interpretation of drug trials." Neuropharmacology 39(5): 835-841. Find it on PubMed
For more information visit www.neuropt.org or email [email protected]
Duncan, P. W., Propst, M., et al. (1983). "Reliability of the Fugl-Meyer assessment of sensorimotor recovery following cerebrovascular accident." Phys Ther 63: 1606-1610. Find it on PubMed
Gladstone, D. J., Danells, C. J., et al. (2002). "The fugl-meyer assessment of motor recovery after stroke: a critical review of its measurement properties." Neurorehabil Neural Repair 16: 232-240. Find it on PubMed
Hsieh, Y. W., Wu, C. Y., et al. (2009). "Responsiveness and validity of three outcome measures of motor function after stroke rehabilitation." Stroke 40(4): 1386-1391. Find it on PubMed
Hsueh, I. P., Hsu, M. J., et al. (2008). "Psychometric comparisons of 2 versions of the Fugl-Meyer Motor Scale and 2 versions of the Stroke Rehabilitation Assessment of Movement." Neurorehabil Neural Repair 22(6): 737-744. Find it on PubMed
Lin, J. H., Hsueh, I. P., et al. (2004). "Psychometric properties of the sensory scale of the Fugl-Meyer Assessment in stroke patients." Clin Rehabil 18(4): 391-397. Find it on PubMed
Malouin, F., Pichard, L., et al. (1994). "Evaluating motor recovery early after stroke: comparison of the Fugl-Meyer Assessment and the Motor Assessment Scale." Arch Phys Med Rehabil 75: 1206-1212. Find it on PubMed
Mao, H.-F., Hsueh, I. P., et al. (2002). "Analysis and comparison of the psychometric properties of three balance measures for stroke patients." Stroke 33: 1022-1027. Find it on PubMed
Nadeau, S., Arsenault, A. B., et al. (1999). "Analysis of the clinical factors determining natural and maximal gait speeds in adults with a stroke." Am J Phys Med Rehabil 78: 123-130. Find it on PubMed
Platz, T., Pinkowski, C., et al. (2005). "Reliability and validity of arm function assessment with standardized guidelines for the Fugl-Meyer Test, Action Research Arm Test and Box and Block Test: a multicentre study." Clin Rehabil 19: 404-411. Find it on PubMed
Sanford, J., Moreland, J., et al. (1993). "Reliability of the Fugl-Meyer assessment for testing motor performance in patients following stroke." Phys Ther 73: 447-454. Find it on PubMed
See J, Dodakian L, Chou C et al. (2013). "A Standardized Approach to the Fugl-Meyer Assessment and Its Implications for Clinical Trials." Neuro Rehab Neural Repair 27: 732-741. Find it on PubMed
For more information visit www.neuropt.org or email [email protected]
Shelton, F. D., Volpe, B. T., et al. (2001). "Motor impairment as a predictor of functional recovery and guide to rehabilitation treatment after stroke." Neurorehabil Neural Repair 15(3): 229-237. Find it on PubMed
Sullivan KJ, Tilson JK, Cen SY, Rose DK, Hershberg J, Correa A, Gallichio J, McLeod M, Moore C, Wu SS, Duncan PW. Fugl-Meyer Assessment of Post-Stroke Sensorimotor Function: Standardized Training Procedure for Clinical Practice and Clinical Trials. Stroke. 42: 427-32, 2011. Find it on PubMed
Wagner, J. M., Rhodes, J. A., et al. (2008). "Reproducibility and minimal detectable change of three-dimensional kinematic analysis of reaching tasks in people with hemiparesis after stroke." Phys Ther 88(5): 652-663. Find it on PubMed
Wood-Dauphinee, S. L., Williams, J. I., et al. (1990). "Examining outcome measures in a clinical study of stroke." Stroke 21: 731-739. Find it on PubMed
Woodbury, M. L., Velozo, C. A., et al. (2008). "Longitudinal stability of the Fugl-Meyer Assessment of the upper extremity." Arch Phys Med Rehabil 89: 1563-1569. Find it on PubMed
Year published 1975
Instrument in PDF Format Yes
Approval Status Approved
For more information visit www.neuropt.org or email [email protected]
15. REHAB MEASURES DATABASE—MODIFIED ASHWORTH SCALE
Link to instrument
Modified Ashworth Scale Instructions (other languages below)
Title of Assessment
Ashworth Scale / Modified Ashworth Scale
Acronym AS / MAS
Instrument Reviewer(s)
Initially reviewed by the Rehabilitation Measures Team; Updated by Phyllis Palma PT, DPT and Christopher Newman PT, MPT, NCS and the SCI EDGE task force of the Academy of Neurologic Physical Therapy - a component of APTA in 9/2012; Updated with references for the TBI population by Irene Ward, PT, DPT, NCS and the TBI EDGE task force of the Academy of Neurologic Physical Therapy - a component of APTA in 2012; Updated with references for Pediatrics and Cerebral Palsy by Anna Wetzel, SPT, Brian Baranyi, SPT, and Stephanie Johnson, SPT in 11/2012; Updated by Dorian, Rose, PhD, PT and Carmen Capo-Lugo, PhD, PT of the StrokEdge II Task Force, Academy of Neurologic Physical Therapy - a component of APTA.
Summary Date
5/26/2016
Purpose Originally developed to assess the effects of antispasticity drugs on spasticity in Multiple Sclerosis
Modified Ashworth: measures spasticity in patients with lesions of the Central Nervous System
Description Original Ashworth Scale:
Tests resistance to passive movement about a joint with varying degrees of velocity
Scores range from 0-4, with 5 choices
A score of 1 indicates no resistance and 5 indicates rigidity
Modified Ashworth Scale :
Similar to Ashworth, but adds a 1+ scoring category to indicate resistance through less than half of the movement. Thus scores range from 0-4, with 6 choices (Bohannon & Smith, 1987)
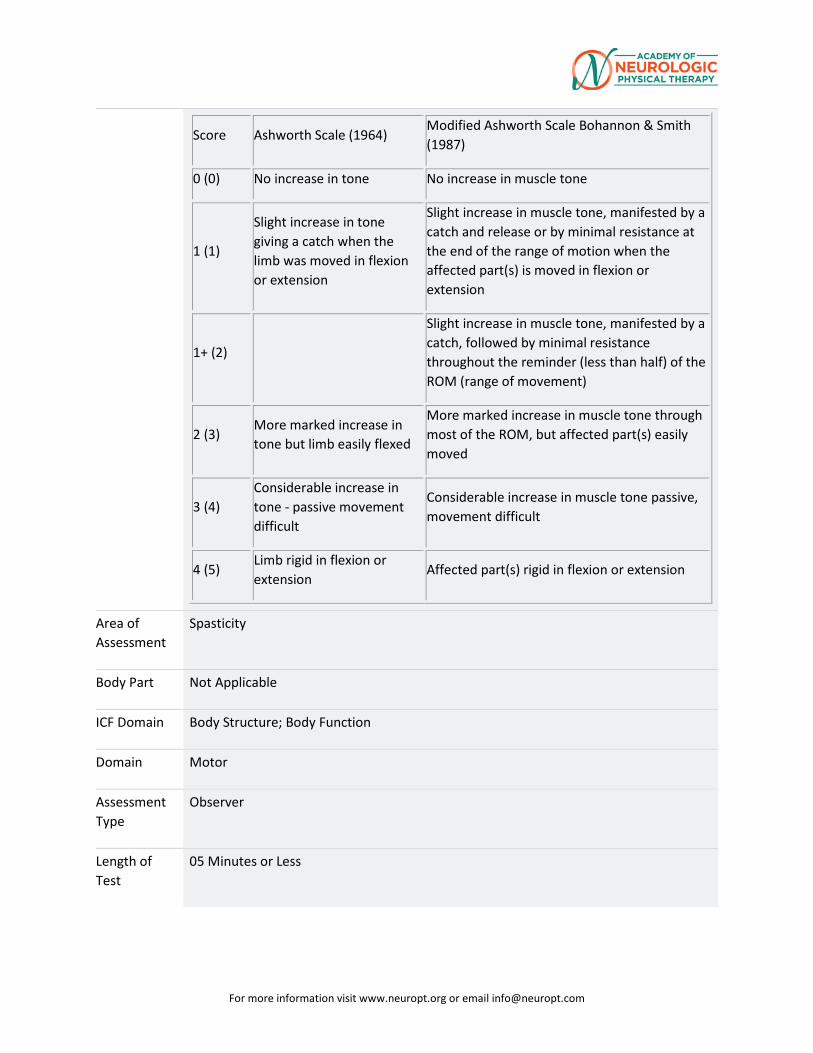
For more information visit www.neuropt.org or email [email protected]
Score Ashworth Scale (1964) Modified Ashworth Scale Bohannon & Smith (1987)
0 (0) No increase in tone No increase in muscle tone
1 (1)
Slight increase in tone giving a catch when the limb was moved in flexion or extension
Slight increase in muscle tone, manifested by a catch and release or by minimal resistance at the end of the range of motion when the affected part(s) is moved in flexion or extension
1+ (2)
Slight increase in muscle tone, manifested by a catch, followed by minimal resistance throughout the reminder (less than half) of the ROM (range of movement)
2 (3) More marked increase in tone but limb easily flexed
More marked increase in muscle tone through most of the ROM, but affected part(s) easily moved
3 (4) Considerable increase in tone - passive movement difficult
Considerable increase in muscle tone passive, movement difficult
4 (5) Limb rigid in flexion or extension
Affected part(s) rigid in flexion or extension
Area of Assessment
Spasticity
Body Part Not Applicable
ICF Domain Body Structure; Body Function
Domain Motor
Assessment Type
Observer
Length of Test
05 Minutes or Less
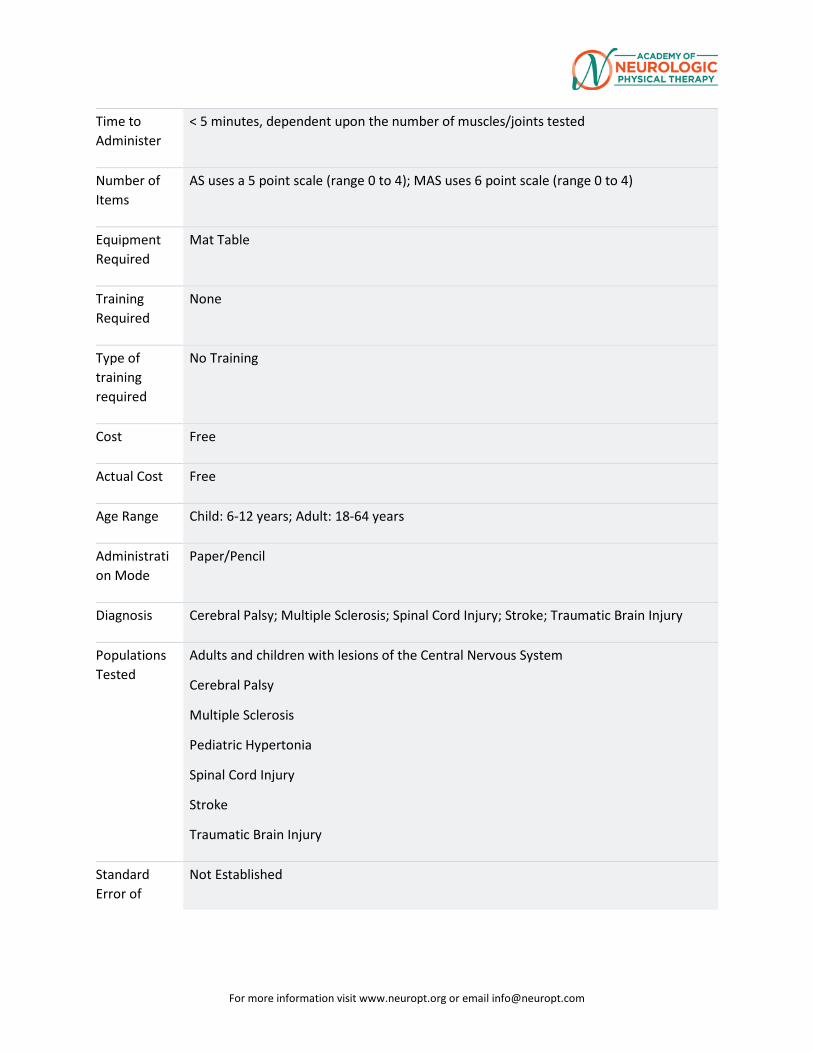
For more information visit www.neuropt.org or email [email protected]
Time to Administer
< 5 minutes, dependent upon the number of muscles/joints tested
Number of Items
AS uses a 5 point scale (range 0 to 4); MAS uses 6 point scale (range 0 to 4)
Equipment Required
Mat Table
Training Required
None
Type of training required
No Training
Cost Free
Actual Cost Free
Age Range Child: 6-12 years; Adult: 18-64 years
Administration Mode
Paper/Pencil
Diagnosis Cerebral Palsy; Multiple Sclerosis; Spinal Cord Injury; Stroke; Traumatic Brain Injury
Populations Tested
Adults and children with lesions of the Central Nervous System
Cerebral Palsy
Multiple Sclerosis
Pediatric Hypertonia
Spinal Cord Injury
Stroke
Traumatic Brain Injury
Standard Error of
Not Established
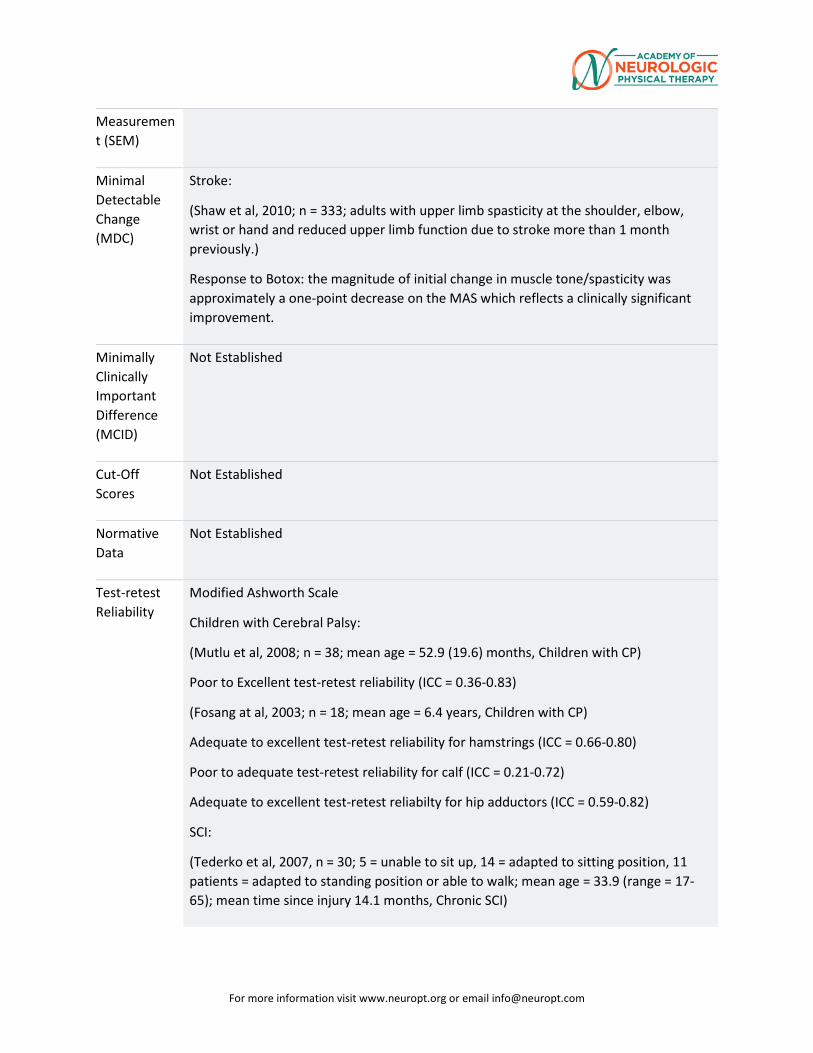
For more information visit www.neuropt.org or email [email protected]
Measurement (SEM)
Minimal Detectable Change (MDC)
Stroke:
(Shaw et al, 2010; n = 333; adults with upper limb spasticity at the shoulder, elbow, wrist or hand and reduced upper limb function due to stroke more than 1 month previously.)
Response to Botox: the magnitude of initial change in muscle tone/spasticity was approximately a one-point decrease on the MAS which reflects a clinically significant improvement.
Minimally Clinically Important Difference (MCID)
Not Established
Cut-Off Scores
Not Established
Normative Data
Not Established
Test-retest Reliability
Modified Ashworth Scale
Children with Cerebral Palsy:
(Mutlu et al, 2008; n = 38; mean age = 52.9 (19.6) months, Children with CP)
Poor to Excellent test-retest reliability (ICC = 0.36-0.83)
(Fosang at al, 2003; n = 18; mean age = 6.4 years, Children with CP)
Adequate to excellent test-retest reliability for hamstrings (ICC = 0.66-0.80)
Poor to adequate test-retest reliability for calf (ICC = 0.21-0.72)
Adequate to excellent test-retest reliabilty for hip adductors (ICC = 0.59-0.82)
SCI:
(Tederko et al, 2007, n = 30; 5 = unable to sit up, 14 = adapted to sitting position, 11 patients = adapted to standing position or able to walk; mean age = 33.9 (range = 17-65); mean time since injury 14.1 months, Chronic SCI)
For more information visit www.neuropt.org or email [email protected]
Adequate reliability for individual muscle groups (ICC = 0.56), however the MAS may be a more appropriate measure of global muscle tone.
The reliability of muscle tone assessments were weaker among younger patients
Joint contractures decreased the reliability of the MAS
Stroke:
(Gregson et al, 2000; n = 32; median age = 74 years; median Barthel score = 8; median time since onset = 40 (IQR = 19 - 78) days. Blackburn et al, 2002; n = 32; mean age = 76.1 (7.89) years; assessed 12 weeks post-stroke, Acute Stroke)
Excellent intra-rater reliability for elbow (kw = 0.84) (Gregson et al, 1999)
Adequate intra-rater reliability for elbow (kw = 0.77 – 0.84); ankle (kw = 0.59 – 0.64); wrist (kw = 0.80 – 0.88) and knee (kw = 0.77 – 0.94) (Gregson et al, 2000)
Adequate intra-rater reliability in the lower extremity of 73.3% (Kendall tau-b = 0.567) (Blackburn et al, 2002)
Traumatic Brain Injury:
Adequate test-retest reliability for the Shoulder, elbow, wrist, hip, knee and ankle (kappa = 0.47-0.62) (Mehrholz et al, 2005)
Excellent test-retest for the ankle (r = 0.82; k = 0.422) (Allison et al, 1996)
Interrater/Intrarater Reliability
Modified Ashworth Scale:
Patients with central nervous system lesions:
(Bohannon & Smith, 1987, n = 30, mean age = 59.3 (17.6) years, patients with centeral nervous system lesions)
Excellent interrater reliability between two experienced raters (Kendall's tau = 0.847, p < 0.001)
Patients with severe cerebral damage:
(Mehrholz et al, 2005, patients with severe cerebral damage)
Poor to adequate Inter-rater reliability (kappa = 0.16 to 0.42)
SCI:
(Haas et al, 1996, n = 30, mean age = 40.3 years, mean time since injury = 17.23 months; Frankel Grade A = 18, B = 3, C = 2, D = 6, E = 1, Chronic SCI)
Poor to adequate interrater reliability depending on the muscle group (Kappa = 0.21 to 0.61)
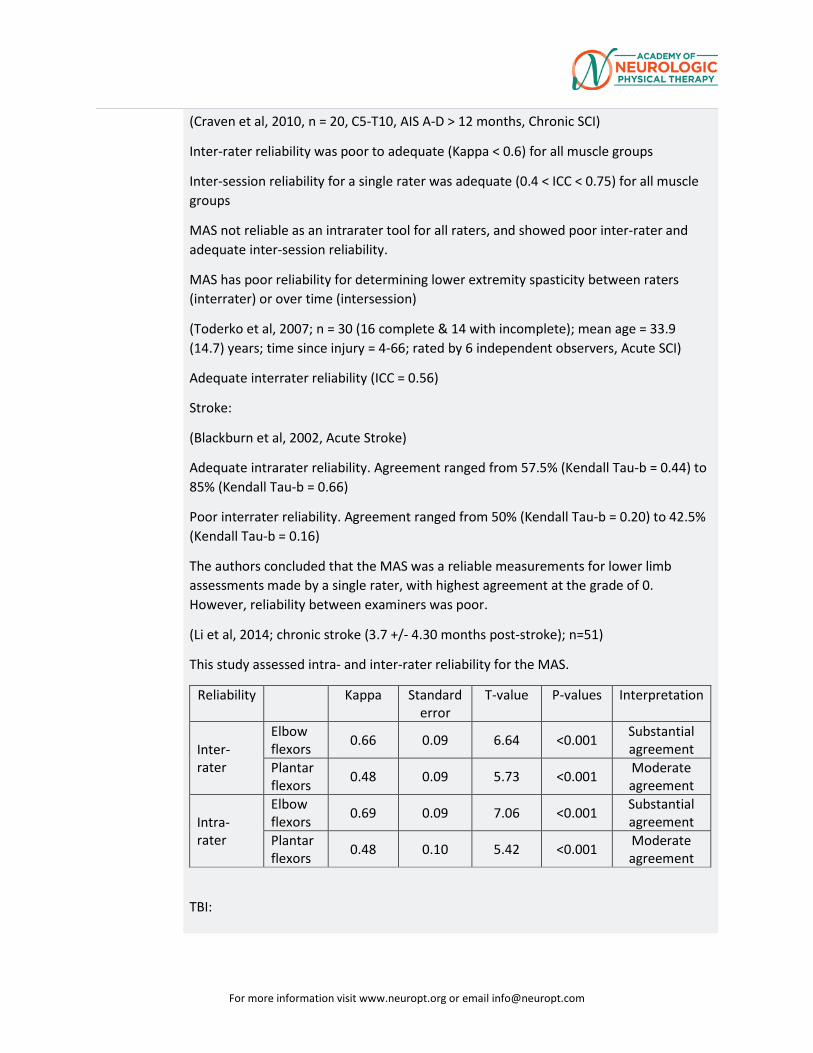
For more information visit www.neuropt.org or email [email protected]
(Craven et al, 2010, n = 20, C5-T10, AIS A-D > 12 months, Chronic SCI)
Inter-rater reliability was poor to adequate (Kappa < 0.6) for all muscle groups
Inter-session reliability for a single rater was adequate (0.4 < ICC < 0.75) for all muscle groups
MAS not reliable as an intrarater tool for all raters, and showed poor inter-rater and adequate inter-session reliability.
MAS has poor reliability for determining lower extremity spasticity between raters (interrater) or over time (intersession)
(Toderko et al, 2007; n = 30 (16 complete & 14 with incomplete); mean age = 33.9 (14.7) years; time since injury = 4-66; rated by 6 independent observers, Acute SCI)
Adequate interrater reliability (ICC = 0.56)
Stroke:
(Blackburn et al, 2002, Acute Stroke)
Adequate intrarater reliability. Agreement ranged from 57.5% (Kendall Tau-b = 0.44) to 85% (Kendall Tau-b = 0.66)
Poor interrater reliability. Agreement ranged from 50% (Kendall Tau-b = 0.20) to 42.5% (Kendall Tau-b = 0.16)
The authors concluded that the MAS was a reliable measurements for lower limb assessments made by a single rater, with highest agreement at the grade of 0. However, reliability between examiners was poor.
(Li et al, 2014; chronic stroke (3.7 +/- 4.30 months post-stroke); n=51)
This study assessed intra- and inter-rater reliability for the MAS.
Reliability Kappa Standard error
T-value P-values Interpretation
Inter-rater
Elbow flexors 0.66 0.09 6.64 <0.001 Substantial
agreement Plantar flexors 0.48 0.09 5.73 <0.001 Moderate
agreement
Intra-rater
Elbow flexors 0.69 0.09 7.06 <0.001 Substantial
agreement Plantar flexors 0.48 0.10 5.42 <0.001 Moderate
agreement
TBI:
For more information visit www.neuropt.org or email [email protected]
(Allison et al, 1996, n = 30, mean age = 28.3 (10.8) years; mean time since injury = 56 (48.4) months, Chronic TBI)
Adequate interrater reliability (r = 0.727) for plantar flexor spasticity
Original Ashworth Scale:
Children with Cerebral Palsy:
(Mutlu, 2008, Children with CP)
Excellent interrater reliability for measures hamstrings (ICC = 0.76, 0.73)
Excellent interrater reliability for measures of hip adductors (ICC = 0.83, 0.87)
Adequate to excellent interrater reliability for measure of hip internal rotators (ICC = 0.61, 0.84)
Adequate interrater reliability for measures of hip flexors (ICC = 0.71, 0.74)
Adequate interrater reliability for measures of gastrocnemius (ICC = 0.64, 0.68)
Poor to excellent intrarater reliability:
Lowest intrarater reliability found for hip internal rotators (ICC = 0.36)
Highest intrarater reliability found for hip flexors (ICC = 0.83)
Authors concluded that assessments of spasticity using the Modified Ashworth Scale are not very reliable for this population and should be used with caution
(Fosang, 2003, Children with CP)
Hamstrings
Poor to adequate interrater reliability (ICC = 0.37-0.48)
Adequate to Excellent intrarater reliability (ICC = 0.66-0.80)
Calf
Poor to Adequate interrater reliability (ICC: 0.27-0.45)
Poor to Adequate intrarater reliability (ICC: 0.21-0.70)
Adductors
Adequate interrater reliability (ICC = 0.54-0.56)
Adequate intrarater reliability (ICC = 0.59-0.72)
(Yam, 2005; n = 17, mean age=7.9 years, Children with CP)
Poor to adequate interrater reliability for hip adductors, knee flexed (ICC = 0.41)
For more information visit www.neuropt.org or email [email protected]
Adequate interrater reliability for hip adductors, knee extended (ICC = 0.73)
Adequate interrater reliability for ankle plantarflexors, knee extended (ICC = 0.56)
Adequate interrater reliability for ankle plantarflexors, knee flexed (ICC = 0.46)
The authors caution the use of this test in this population due to none of the measures possessing excellent interrater reliability (ICC > 0.75)
Pediatric Hypertonia:
(Clopton, 2005; n = 17, mean age = 7 years, Pediatric Hypertonia)
Excellent interrater relibility for elbow flexors and hamstrings (ICC > 0.75)
Poor to adequate interrater reliability for other muscles (ICC < 0.50)
Lower than clinically acceptable
Excellent intrarater reliability for hamstrings (ICC > 0.75)
Adequate intrarater reliability for other muscles (ICC 0.50-0.75)
Potentially lower than clinically acceptable
Stroke:
(Kaya et al, 2011, n = 64, mean age = 60.5 (11.9) years; mean time since stroke = 15.7 (10.2) weeks, Stroke)
Excellent for both MAS and modified MAS (Ansari et al, 2006), with weighted kappa values of 0.868 and 0.892
MAS and MMAS have very good inter-rater reliability for assessment of poststroke elbow flexor spasticity
Neither scale is superior to grade spasticity in patients with hemiplegia for this particular muscle group
(Brashear et al, 2002, n = 10, mean age = 59.9 (16.17) years, Chronic Stroke)
Adequate intrarater reliability (across 10 raters)
Elbow Wrist Fingers Thumb
Overall weighted K 0.668 0.740 0.740 0.680
p 0.998 0.972 1.000 0.985
Adequate to excellent interrater reliability (depending on joint)
Mean of evaluations 1 and 2 (Kendall W)
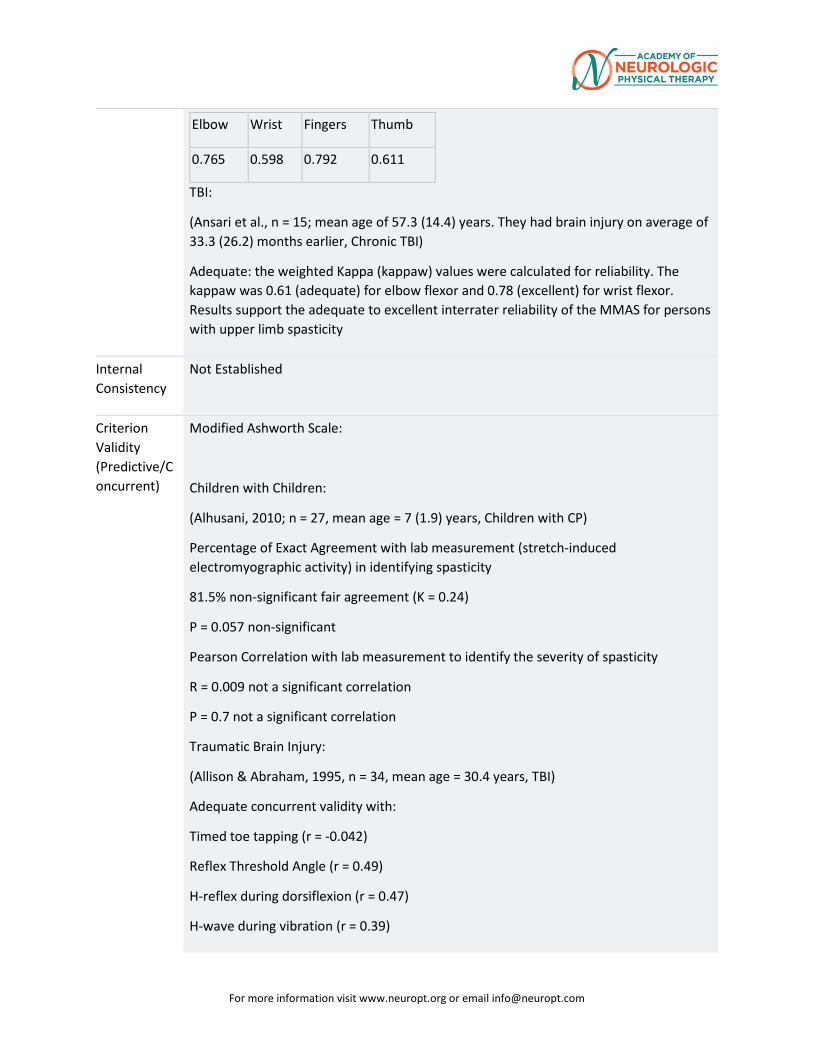
For more information visit www.neuropt.org or email [email protected]
Elbow Wrist Fingers Thumb
0.765 0.598 0.792 0.611
TBI:
(Ansari et al., n = 15; mean age of 57.3 (14.4) years. They had brain injury on average of 33.3 (26.2) months earlier, Chronic TBI)
Adequate: the weighted Kappa (kappaw) values were calculated for reliability. The kappaw was 0.61 (adequate) for elbow flexor and 0.78 (excellent) for wrist flexor. Results support the adequate to excellent interrater reliability of the MMAS for persons with upper limb spasticity
Internal Consistency
Not Established
Criterion Validity (Predictive/Concurrent)
Modified Ashworth Scale:
Children with Children:
(Alhusani, 2010; n = 27, mean age = 7 (1.9) years, Children with CP)
Percentage of Exact Agreement with lab measurement (stretch-induced electromyographic activity) in identifying spasticity
81.5% non-significant fair agreement (K = 0.24)
P = 0.057 non-significant
Pearson Correlation with lab measurement to identify the severity of spasticity
R = 0.009 not a significant correlation
P = 0.7 not a significant correlation
Traumatic Brain Injury:
(Allison & Abraham, 1995, n = 34, mean age = 30.4 years, TBI)
Adequate concurrent validity with:
Timed toe tapping (r = -0.042)
Reflex Threshold Angle (r = 0.49)
H-reflex during dorsiflexion (r = 0.47)
H-wave during vibration (r = 0.39)
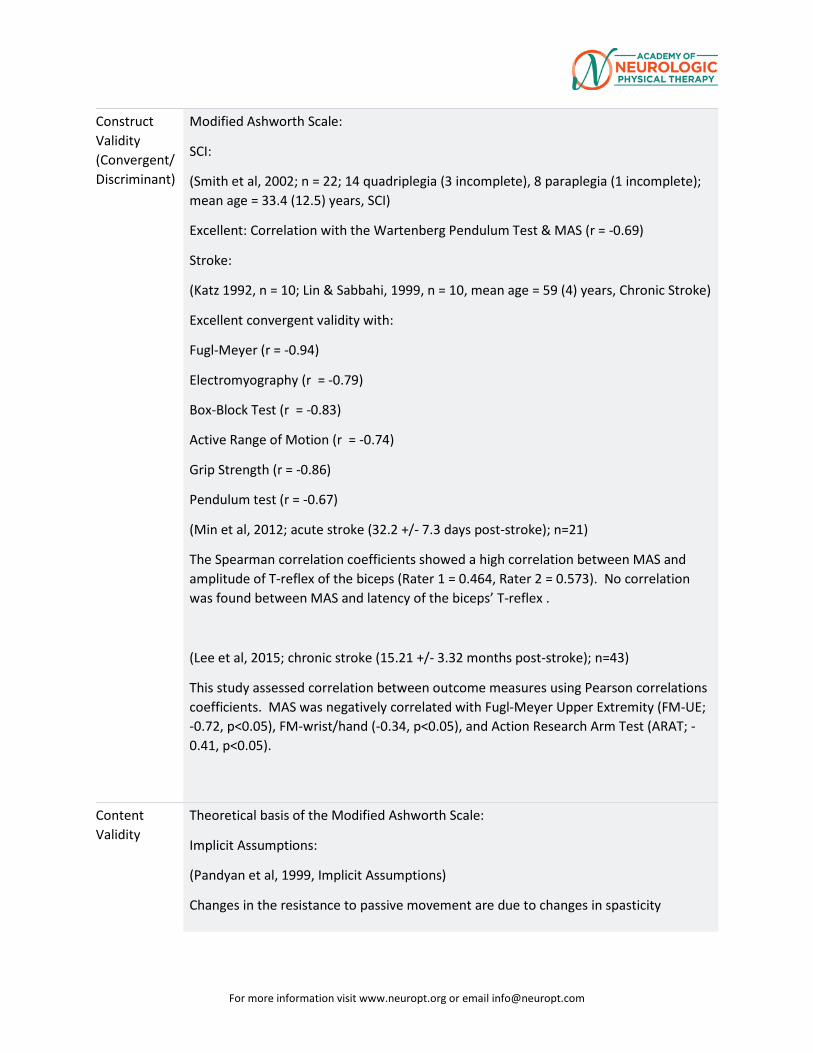
For more information visit www.neuropt.org or email [email protected]
Construct Validity (Convergent/Discriminant)
Modified Ashworth Scale:
SCI:
(Smith et al, 2002; n = 22; 14 quadriplegia (3 incomplete), 8 paraplegia (1 incomplete); mean age = 33.4 (12.5) years, SCI)
Excellent: Correlation with the Wartenberg Pendulum Test & MAS (r = -0.69)
Stroke:
(Katz 1992, n = 10; Lin & Sabbahi, 1999, n = 10, mean age = 59 (4) years, Chronic Stroke)
Excellent convergent validity with:
Fugl-Meyer (r = -0.94)
Electromyography (r = -0.79)
Box-Block Test (r = -0.83)
Active Range of Motion (r = -0.74)
Grip Strength (r = -0.86)
Pendulum test (r = -0.67)
(Min et al, 2012; acute stroke (32.2 +/- 7.3 days post-stroke); n=21)
The Spearman correlation coefficients showed a high correlation between MAS and amplitude of T-reflex of the biceps (Rater 1 = 0.464, Rater 2 = 0.573). No correlation was found between MAS and latency of the biceps’ T-reflex .
(Lee et al, 2015; chronic stroke (15.21 +/- 3.32 months post-stroke); n=43)
This study assessed correlation between outcome measures using Pearson correlations coefficients. MAS was negatively correlated with Fugl-Meyer Upper Extremity (FM-UE; -0.72, p<0.05), FM-wrist/hand (-0.34, p<0.05), and Action Research Arm Test (ARAT; -0.41, p<0.05).
Content Validity
Theoretical basis of the Modified Ashworth Scale:
Implicit Assumptions:
(Pandyan et al, 1999, Implicit Assumptions)
Changes in the resistance to passive movement are due to changes in spasticity
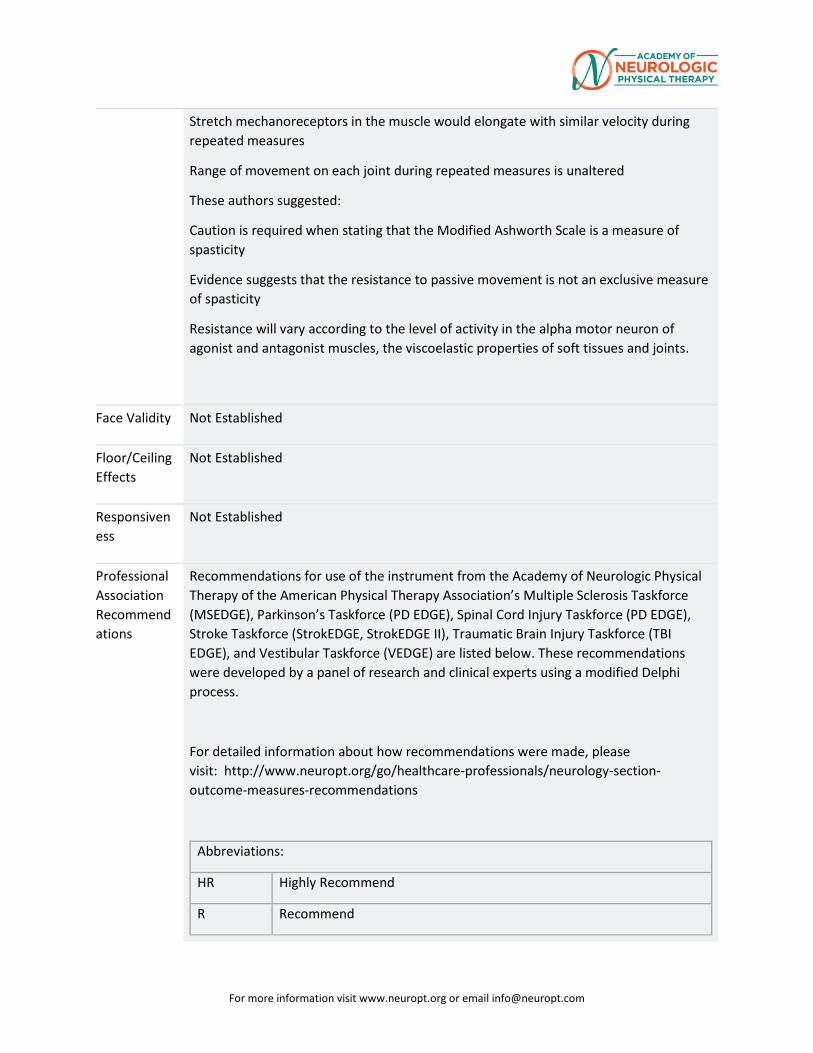
For more information visit www.neuropt.org or email [email protected]
Stretch mechanoreceptors in the muscle would elongate with similar velocity during repeated measures
Range of movement on each joint during repeated measures is unaltered
These authors suggested:
Caution is required when stating that the Modified Ashworth Scale is a measure of spasticity
Evidence suggests that the resistance to passive movement is not an exclusive measure of spasticity
Resistance will vary according to the level of activity in the alpha motor neuron of agonist and antagonist muscles, the viscoelastic properties of soft tissues and joints.
Face Validity Not Established
Floor/Ceiling Effects
Not Established
Responsiveness
Not Established
Professional Association Recommendations
Recommendations for use of the instrument from the Academy of Neurologic Physical Therapy of the American Physical Therapy Association’s Multiple Sclerosis Taskforce (MSEDGE), Parkinson’s Taskforce (PD EDGE), Spinal Cord Injury Taskforce (PD EDGE), Stroke Taskforce (StrokEDGE, StrokEDGE II), Traumatic Brain Injury Taskforce (TBI EDGE), and Vestibular Taskforce (VEDGE) are listed below. These recommendations were developed by a panel of research and clinical experts using a modified Delphi process.
For detailed information about how recommendations were made, please visit: http://www.neuropt.org/go/healthcare-professionals/neurology-section-outcome-measures-recommendations
Abbreviations:
HR Highly Recommend
R Recommend
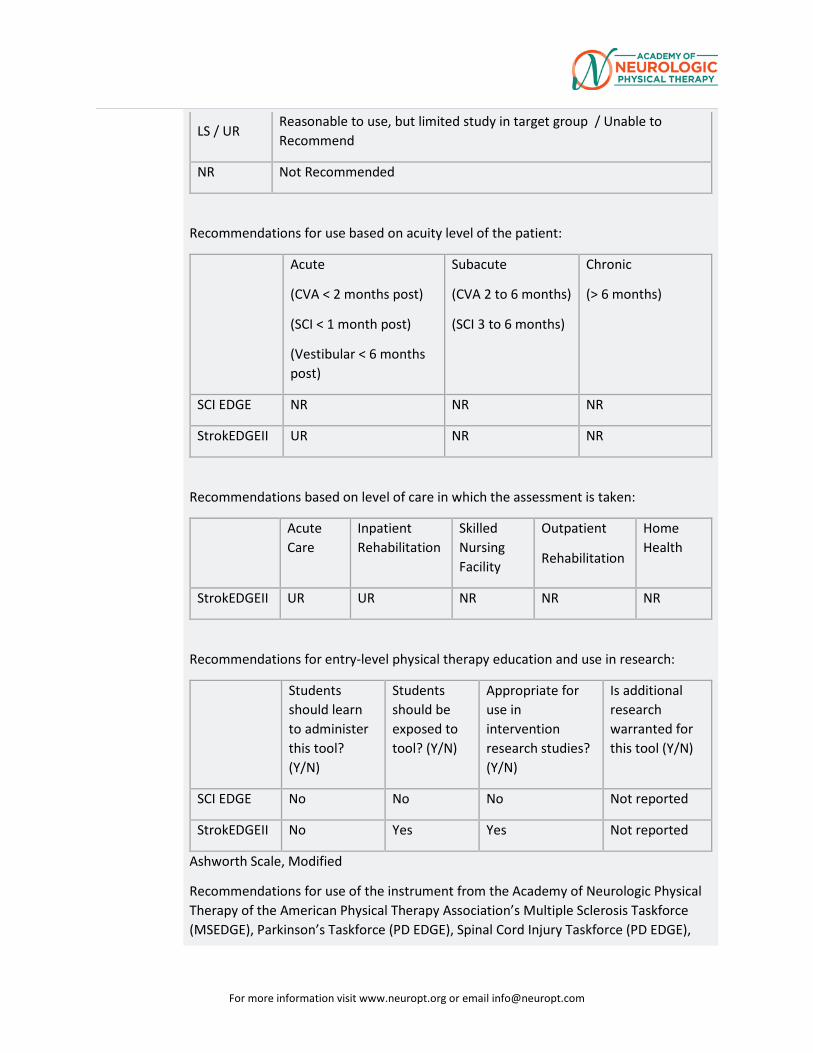
For more information visit www.neuropt.org or email [email protected]
LS / UR Reasonable to use, but limited study in target group / Unable to Recommend
NR Not Recommended
Recommendations for use based on acuity level of the patient:
Acute
(CVA < 2 months post)
(SCI < 1 month post)
(Vestibular < 6 months post)
Subacute
(CVA 2 to 6 months)
(SCI 3 to 6 months)
Chronic
(> 6 months)
SCI EDGE NR NR NR
StrokEDGEII UR NR NR
Recommendations based on level of care in which the assessment is taken:
Acute Care
Inpatient Rehabilitation
Skilled Nursing Facility
Outpatient
Rehabilitation
Home Health
StrokEDGEII UR UR NR NR NR
Recommendations for entry-level physical therapy education and use in research:
Students should learn to administer this tool? (Y/N)
Students should be exposed to tool? (Y/N)
Appropriate for use in intervention research studies? (Y/N)
Is additional research warranted for this tool (Y/N)
SCI EDGE No No No Not reported
StrokEDGEII No Yes Yes Not reported
Ashworth Scale, Modified
Recommendations for use of the instrument from the Academy of Neurologic Physical Therapy of the American Physical Therapy Association’s Multiple Sclerosis Taskforce (MSEDGE), Parkinson’s Taskforce (PD EDGE), Spinal Cord Injury Taskforce (PD EDGE),
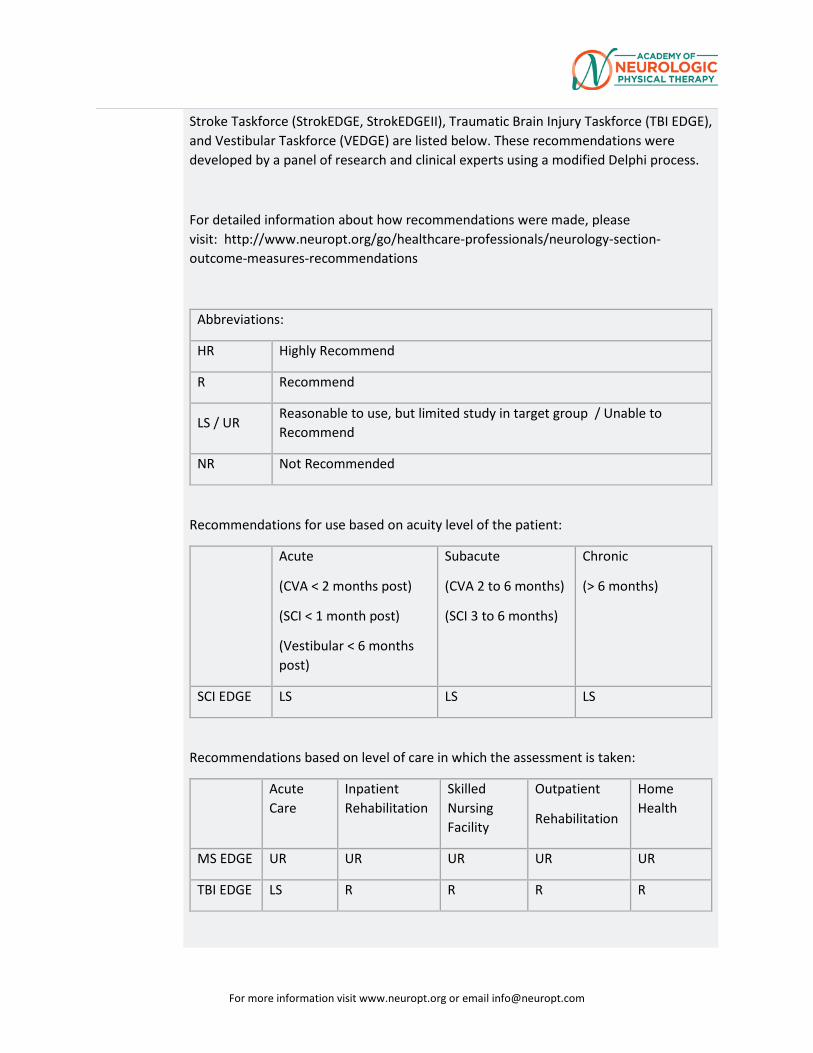
For more information visit www.neuropt.org or email [email protected]
Stroke Taskforce (StrokEDGE, StrokEDGEII), Traumatic Brain Injury Taskforce (TBI EDGE), and Vestibular Taskforce (VEDGE) are listed below. These recommendations were developed by a panel of research and clinical experts using a modified Delphi process.
For detailed information about how recommendations were made, please visit: http://www.neuropt.org/go/healthcare-professionals/neurology-section-outcome-measures-recommendations
Abbreviations:
HR Highly Recommend
R Recommend
LS / UR Reasonable to use, but limited study in target group / Unable to Recommend
NR Not Recommended
Recommendations for use based on acuity level of the patient:
Acute
(CVA < 2 months post)
(SCI < 1 month post)
(Vestibular < 6 months post)
Subacute
(CVA 2 to 6 months)
(SCI 3 to 6 months)
Chronic
(> 6 months)
SCI EDGE LS LS LS
Recommendations based on level of care in which the assessment is taken:
Acute Care
Inpatient Rehabilitation
Skilled Nursing Facility
Outpatient
Rehabilitation
Home Health
MS EDGE UR UR UR UR UR
TBI EDGE LS R R R R
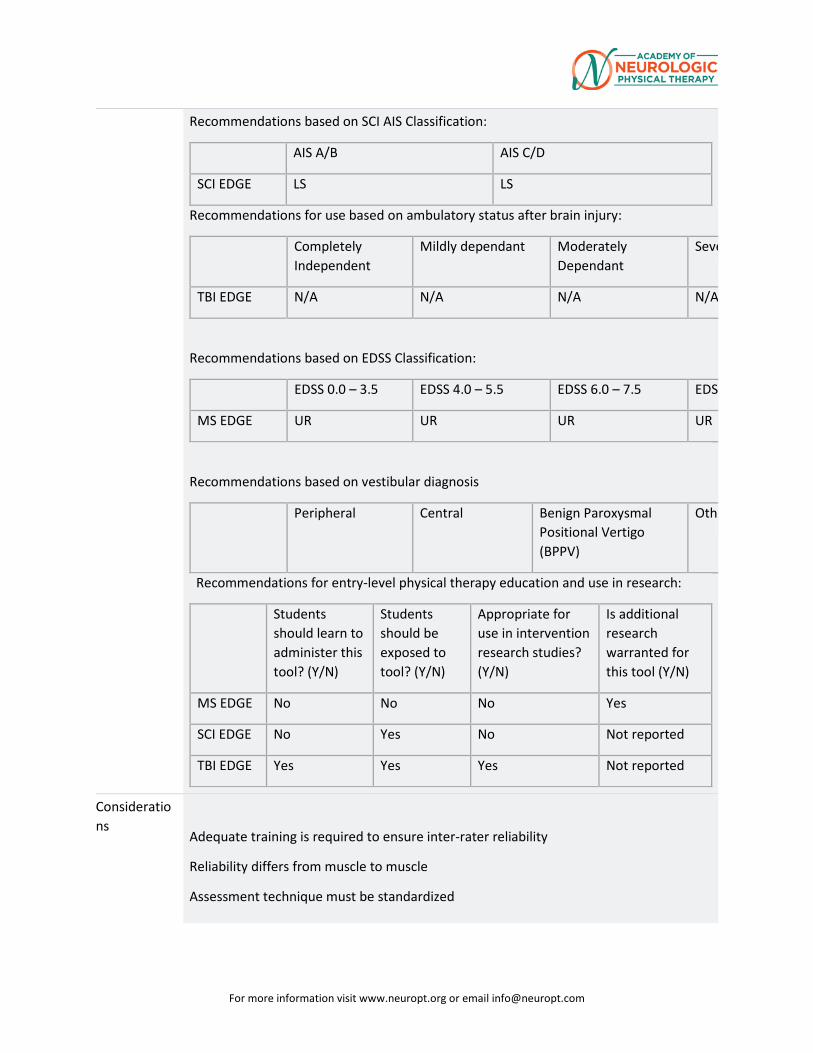
For more information visit www.neuropt.org or email [email protected]
Recommendations based on SCI AIS Classification:
AIS A/B AIS C/D
SCI EDGE LS LS
Recommendations for use based on ambulatory status after brain injury:
Completely Independent
Mildly dependant Moderately Dependant
Seve
TBI EDGE N/A N/A N/A N/A
Recommendations based on EDSS Classification:
EDSS 0.0 – 3.5 EDSS 4.0 – 5.5 EDSS 6.0 – 7.5 EDS
MS EDGE UR UR UR UR
Recommendations based on vestibular diagnosis
Peripheral Central Benign Paroxysmal Positional Vertigo (BPPV)
Othe
Recommendations for entry-level physical therapy education and use in research:
Students should learn to administer this tool? (Y/N)
Students should be exposed to tool? (Y/N)
Appropriate for use in intervention research studies? (Y/N)
Is additional research warranted for this tool (Y/N)
MS EDGE No No No Yes
SCI EDGE No Yes No Not reported
TBI EDGE Yes Yes Yes Not reported
Considerations
Adequate training is required to ensure inter-rater reliability
Reliability differs from muscle to muscle
Assessment technique must be standardized
For more information visit www.neuropt.org or email [email protected]
Some critics question the validity of the Ashworth scale and Modified Ashworth Scale in measuring spasticity. It may be a description of resistance to passive movement. Therefore, measuring only one aspect of spasticity, not a comprehensive assessment. (Salter et al, 2005)
It was concluded that the Ashworth scale is of limited use in the assessment of spasticity in the lower limb of patients with SCI
The Ashworth scale produces a global assessment of the resistance to passive movement of an extremity, not just stretch-reflex hyperexcitability. Specifically, the Ashworth score is likely to be influenced by non-contractile soft tissue properties, by persistent muscle activity (dystonia), by intrinsic joint stiffness, and by stretch reflex responses (Kamper et al., 2001)
Ambiguity of wording and lack of standardized procedures limit the scale’s usefulness for comparison across studies as well as reliability
The Modified Ashworth scale does not comply with the concept of spasticity (a velocity-dependent increase in muscle tone) (Scholtes, 2007)
The Modified Ashworth Scale measures muscle tone intensity at one, unspecified, velocity which can make comparisons difficult (Scholtes, 2007)
Translated Modified Ashworth Scale:
Chinese (simplified): http://www.haodf.com/zhuanjiaguandian/liubaoqiong_1077075591.htm
French: http://www.cofemer.fr/UserFiles/File/ECH.1.2.2.Asworth.pdf
German: http://www.patientensicherheit.ch/dms/de/themen/3126_sturz_testbeschreibung_chedoke_master_d/Testbeschreibung%20chedoke%20MC%20Master.pdf
Italian (p103): http://www.iss.it/binary/publ/cont/08-39%20web.1233562284.pdf
Japanese (p2): https://www.jstage.jst.go.jp/article/jkpt/12/0/12_1/_pdf
Korean: http://blog.naver.com/PostView.nhn?blogId=3c273&logNo=10000521558
Spanish (p40): http://www.tdx.cat/bitstream/handle/10803/3840/nml1de1.pdf;jsessionid=1CF6D8957E26C2A044019951FEBF24F2.tdx2?sequence=1
For more information visit www.neuropt.org or email [email protected]
These translations, and links to them, are subject to the Terms and Conditions of Use of the Rehab Measures Database. RIC is not responsible for and does not endorse the content, products or services of any third-party website, and does not make any representations regarding its quality, content or accuracy. If you would like to contribute a language translation to the RMD, please contact us at [email protected].
Do you see an error or have a suggestion for this instrument summary? Please e-mail us!
Bibliography Alhusaini, A. A., Dean, C. M., et al. (2010). "Evaluation of spasticity in children with cerebral palsy using Ashworth and Tardieu Scales compared with laboratory measures." J Child Neurol 25(10): 1242-1247. Find it on PubMed
Allison, S. and Abraham, L. (1995). "Correlation of quantitative measures with the modified Ashworth scale in the assessment of plantar flexor spasticity in patients with traumatic brain injury." Journal of neurology 242(10): 699-706. Find it on PubMed
Allison, S., Abraham, L., et al. (1996). "Reliability of the Modified Ashworth Scale in the assessment of plantarflexor muscle spasticity in patients with traumatic brain injury." International Journal of Rehabilitation Research 19(1): 67. Find it on PubMed
Ansari, N. N., Naghdi, S., et al. (2009). "Assessing the reliability of the Modified Modified Ashworth Scale between two physiotherapists in adult patients with hemiplegia." NeuroRehabilitation 25(4): 235-240.
Blackburn, M., van Vliet, P., et al. (2002). "Reliability of measurements obtained with the modified Ashworth scale in the lower extremities of people with stroke." Physical Therapy 82(1): 25. Find it on PubMed
Bohannon, R. and Smith, M. (1987). "Interrater reliability of a modified Ashworth scale of muscle spasticity." Physical Therapy 67(2): 206. Find it on PubMed
Brashear, A., Zafonte, R., et al. (2002). "Inter-and intrarater reliability of the Ashworth Scale and the Disability Assessment Scale in patients with upper-limb poststroke spasticity* 1." Archives of physical medicine and rehabilitation 83(10): 1349-1354. Find it on PubMed
Clopton, N., Dutton, J., et al. (2005). "Interrater and intrarater reliability of the Modified Ashworth Scale in children with hypertonia." Pediatr Phys Ther 17(4): 268-274. Find it on PubMed
Craven, B. C. and Morris, A. R. (2010). "Modified Ashworth scale reliability for measurement of lower extremity spasticity among patients with SCI." Spinal Cord 48(3): 207-213. Find it on PubMed
For more information visit www.neuropt.org or email [email protected]
Fosang, A. L., Galea, M. P., et al. (2003). "Measures of muscle and joint performance in the lower limb of children with cerebral palsy." Dev Med Child Neurol 45(10): 664-670. Find it on PubMed
Gregson, J., Leathley, M., et al. (1999). "Reliability of the Tone Assessment Scale and the modified Ashworth scale as clinical tools for assessing poststroke spasticity." Archives of physical medicine and rehabilitation 80(9): 1013-1016. Find it on PubMed
Gregson, J., Leathley, M., et al. (2000). "Reliability of measurement of muscle tone and muscle power in stroke patients." Age and Ageing 29(3): 223. Find it on PubMed
Haas, B., Bergström, E., et al. (1996). "The inter rater reliability of the original and of the modified Ashworth scale for the assessment of spasticity in patients with spinal cord injury." Spinal Cord 34(9): 560-564. Find it on PubMed
Hsieh, J. T., Wolfe, D. L., et al. (2008). "Spasticity outcome measures in spinal cord injury: psychometric properties and clinical utility." Spinal Cord 46(2): 86-95. Find it on PubMed
Kamper, D. G., Schmit, B. D., et al. (2001). "Effect of muscle biomechanics on the quantification of spasticity." Ann Biomed Eng 29(12): 1122-1134. Find it on PubMed
Katz, R., Rovai, G., et al. (1992). "Objective quantification of spastic hypertonia: correlation with clinical findings." Archives of physical medicine and rehabilitation 73(4): 339. Find it on PubMed
Kaya, T., Karatepe, A. G., et al. (2011). "Inter-rater reliability of the Modified Ashworth Scale and modified Modified Ashworth Scale in assessing poststroke elbow flexor spasticity." Int J Rehabil Res 34(1): 59-64. Find it on PubMed
Lee GC, An SH, Lee YB, Lee, DG, Park DS (2015). “Predictive factors of hypertonia in the upper extremity of chronic stroke survivors. J Phys Ther Sci 27:2545-2549. Find it on PubMed.
Li F, Wu, Y, Li X. (2014). “Test-retest reliability and inter-rater reliability of the Modified Tardieu Scale and the Modified Ashworth Scale in hemiplegic patients with stroke.” Eur J Phys Rehabil Med. 50:9-15. Find it on PubMed.
Lin, F. and Sabbahi, M. (1999). "Correlation of spasticity with hyperactive stretch reflexes and motor dysfunction in hemiplegia." Archives of physical medicine and rehabilitation 80(5): 526-530. Find it on PubMed
Mehrholz, J., Wagner, K., et al. (2005). "Reliability of the Modified Tardieu Scale and the Modified Ashworth Scale in adult patients with severe brain injury: a comparison study." Clinical rehabilitation 19(7): 751. Find it on PubMed
For more information visit www.neuropt.org or email [email protected]
Min, J. H., Shin, Y.-I., et al. (2012). "The Correlation between Modified Ashworth Scale and Biceps T-reflex and Inter-rater and Intra-rater Reliability of Biceps T-reflex." Annals of Rehabilitation Medicine 36(4): 538-543.
Mutlu, A., Livanelioglu, A., et al. (2008). "Reliability of Ashworth and Modified Ashworth scales in children with spastic cerebral palsy." BMC Musculoskelet Disord 9: 44. Find it on PubMed
Pandyan, A., Johnson, G., et al. (1999). "A review of the properties and limitations of the Ashworth and modified Ashworth Scales as measures of spasticity." Clinical rehabilitation 13(5): 373. Find it on PubMed
Remy-Neris, O., Tiffreau, V., et al. (2003). "Intrathecal baclofen in subjects with spastic hemiplegia: assessment of the antispastic effect during gait." Arch Phys Med Rehabil 84(5): 643-650. Find it on PubMed
Salter, K., Jutai, J., et al. (2005). "Issues for selection of outcome measures in stroke rehabilitation: ICF body functions." Disability & Rehabilitation 27(4): 191-207. Find it on PubMed
Salter, K., Jutai, J. W., et al. (2005). "Issues for selection of outcome measures in stroke rehabilitation: ICF Body Functions." Disabil Rehabil 27(4): 191-207. Find it on PubMed
Scholtes, V. A., Becher, J. G., et al. (2007). "Clinical assessment of spasticity in children with cerebral palsy: a critical review of available instruments." Developmental Medicine & Child Neurology 48(1): 64-73.
Shaw, L., Rodgers, H., et al. (2010). BoTULS: a multicentre randomised controlled trial to evaluate the clinical effectiveness and cost-effectiveness of treating upper limb spasticity due to stroke with botulinum toxin type A, Prepress Projects.
Tederko, P., Krasuski, M., et al. (2007). "Reliability of clinical spasticity measurements in patients with cervical spinal cord injury." Ortop Traumatol Rehabil 9: 467-483. Find it on PubMed
Yam, W. K. and Leung, M. S. (2006). "Interrater reliability of Modified Ashworth Scale and Modified Tardieu Scale in children with spastic cerebral palsy." J Child Neurol 21(12): 1031-1035. Find it on PubMed
Year published
1964
Instrument in PDF Format
Yes
For more information visit www.neuropt.org or email [email protected]
16. REHAB MEASURES DATABASE—MODIFIED FATIGUE IMPACT SCALE
Link to instrument Download the MSQLI: A User’s Manual (PDF)
Title of Assessment Modified Fatigue Impact Scale
Acronym MFIS
Instrument Reviewer(s) Initially reviewed by Tammie Johnson, PT, DPT, MS and the TBI EDGE task
force of the Academy of Neurologic Physical Therapy - a component of APTA in 9/2012. Updated by Genevieve Pinto-Zipp of the StrokEdge II task force, Neurology Section, APTA 2016.
Summary Date 1/20/2017
Purpose The MFIS is a modified form of the Fatigue Impact Scale (Fisk et al, 1994) based on items derived from interviews with MS patients concerning how fatigue impacts their lives. This instrument provides an assessment of the effects of fatigue in terms of physical, cognitive, and psychosocial functioning.
Description • The full-length MFIS has 21 items while the abbreviated version has 5 items. The full-length version has the advantage of generating subscales.
• The MFIS is a 21-item shortened version of the 40-item FIS and has been recommended for use by the Multiple Sclerosis Council for Clinical Practice Guidelines. It assesses the perceived impact of fatigue on the subscales physical, cognitive and psychosocial functioning during the past 4 weeks (Rietberg et al., 2010).
• The MFIS is one of the components of the MSQLI. • Description of scoring: Likert scale. Participants rate on a 5-point Likert
scale, with 0 = ‘Never’ to 4 = ‘Almost always’ their agreement with 21 statements.
• Total score (0‐84) and subscales for physical (0‐36), cognitive (0‐40) and psychosocial functioning (0‐8). The 5 item version is scored (0‐20). Higher numbers indicate greater fatigue.
• Rasch analysis revealed that the 21-item scale was found to contain a “physical” and a “cognitive” dimension (the original 2 social items were found to be part of the physical dimension).
• Scoring for Standard 21-item version: either represented as a total score by summing the totals from each subscale or by each individual subscale (see below).
• Physical subscale: range from 0-36
For more information visit www.neuropt.org or email [email protected]
o Add raw scores on items: 4+6+7+10+13+14+17+20+21
• Cognitive subscale: range from 0-40
o Add raw scores on items: 1+2+3+5+11+12+15+16+18+19
• Psychosocial subscale: range from 0-8
o Add raw scores on items: 8+9
• Scoring for 5-item version: o Total score is the sum of items 1+9+10+17+19 o Range from 0-20
Area of Assessment
Body Part
ICF Domain Body Structure; Body Function; Activity; Participation
Domain
Assessment Type
Length of Test 05 Minutes or Less; 06 to 30 Minutes
Time to Administer Administration time is approximately 5-10 minutes for the full-length version and 2-3 minutes for the abbreviated version.
Number of Items The standard version of the MFIS consists of 21items. The abbreviated version of
the MFIS consists of 5 items.
Equipment Required • Questionnaire
• Pen
Training Required Training can be done by downloading and reading the MSQLI document on the MS site.
Type of training required Reading an Article/Manual
Cost Free
Actual Cost Free
Age Range
Administration Mode
Diagnosis Traumatic Brain Injury
For more information visit www.neuropt.org or email [email protected]
Populations Tested • Multiple Sclerosis
Standard Error of Measurement (SEM)
Not Established
Minimal Detectable Change (MDC) Not Established
Minimally Clinically Important Difference (MCID)
Multiple Sclerosis: (Rietberg, 2010; n= 43; ambulatory patients with MS (mean age 48.7 years; SD 7 years; 30 women; median Expanded Disability Status Scale score 3.5)
• Smallest Detectable Change (SDC) = 16.2
• Minimal Detectable Change (MDC) % = 19.3%
Cut-Off Scores Not Established
Normative Data Multiple Sclerosis: (Tellez et al, 2005; 231 MS patients and 123 healthy controls, 164 patients with relapsing-remitting, 47 with secondary progressive, 12 with primary progressive)
• Median MFIS score= 33.0 (range 0-82)
Traumatic Brain Injury: (Sendroy-Terrill et al., 2010, n=243, 73% men, less than 5% of participants unconsciousness of < 1 day, 41 % showed LOC 1 day to 1 week, 31 % LOC from 1 week to 1 month, 24% had LOCs from 1 month to 1 year. Recived treatment in a comprehensive inpatient rehabilitation hospital. Cohorts based on years postinjury (1 to >30 years))
• Mean for total MFIS= 23.7±21.1
• Mean for MFIS - Physical= 10.2±9.6
• Mean for MFIS - Cognitive=11.4±10.4
• Mean for MFIS - Psychosocial= 2.0±2.0
Test-retest Reliability Multiple Sclerosis: (Rietberg, 2010; n= 43; ambulatory patients with MS (mean
age 48.7 years; SD 7 years; 30 women; median Expanded Disability Status Scale score 3.5)
• Excellent test-retest reliability (ICC =0.85)
For more information visit www.neuropt.org or email [email protected]
Interrater/Intrarater Reliability Multiple Sclerosis: (Amtmann et al, 2012; n=1271 individuals with MS living in
the community, 80% female, 36.2% reported being employed 20 or more hours a week; mean age 50.7, mean disease duration 13.2 years, MS severity as minimal (EDSS≤4.0) for 32.4% and intermediate (EDSS 4.5-6.5) for 47.9% and advanced (EDSS≥7.0) for 19.7%)
• Excellent reliability: Cronbach’s alpha = 0.94-0.96 for total MFIS
Internal Consistency Multiple Sclerosis: (Kos et al, 2005)
• MFIS has been found to show change after intervention. • After a 4‐week rehabilitation program, the MFIS did change, but the FSS
did not.
Criterion Validity (Predictive/Concurrent)
Concurrent validity:
Multiple Sclerosis: (Rietberg, 2010; n= 43; ambulatory patients with MS; mean age 48.7 years; SD 7 years; 30 women; median Expanded Disability Status Scale score 3.5)
• Excellent: MFIS vs. Fatigue Severity Scale (FSS): r = 0.66; MFIS vs. the Checklist Individual Strength (CIS20R): r = 0.54
Multiple Sclerosis: (Tellez et al, 2005; (231 MS patients and 123 healthy controls, 164 patients with relapsing-remitting, 47 with secondary progressive, 12 with primary progressive)
• Excellent: between MFIS and FSS (r=0.68, p<0.0001) • Adequate to Excellent: between MFIS subscale and FSS
o MFIS-physical: r=0.75, p<0.0001
o MFIS-cognitive: r=0.44, p<0.0001
o MFIS-psychosocial: r= 0.62, p<0.0001
Predictive Validity:
Traumatic Brain Injury: (Sendroy-Terrill et al., 2010, n=243, 73% men, less than 5% of participants unconsciousness of < 1 day, 41 % showed LOC 1 day to 1 week, 31 % LOC from 1 week to 1 month, 24% had LOCs from 1 month to 1
For more information visit www.neuropt.org or email [email protected]
year. Recived treatment in a comprehensive inpatient rehabilitation hospital. Cohorts based on years postinjury (1 to >30 years))
• MFIS-physical: with each additional decade of age at time of injury, there was a 2 point increase on the MFIS-physical score (P=.02)
• MFIS-psychosocial: with each additional decade of age at time of injury, there was a 0.5 point increase (P=.01)
Construct Validity (Convergent/Discriminant)
Multiple Sclerosis: (Mills et al, 2010; n=415)
• Given the Rasch analysis, Mills et al. suggested that the physical and cognitive subscales should be used separately eliminating questions 4, 14, 17 from the physical and questions 1‐3, 5, and 11. In addition, the authors suggest the total score not be used.
Content Validity Multiple Sclerosis: (Amtmann et al., 2012; n=1271 individuals with MS living in the community, 80% female, 36.2% reported being employed 20 or more hours a week. Mean age 507, mean disease duration 13.2 years, MS severity as minimal (EDSS≤4.0) for 32.4% and intermediate (EDSS 4.5-6.5) for 47.9% and advanced (EDSS≥7.0) for 19.7%)
• Validity: Spearman Rank Correlation Fatigue Severity Scale to MFIS: o Excellent for MFIS total and subscales of physical and
psychosocial (0.69-0.77) o Adequate for MFIS cognitive subscale
• IRT analyses indicate that the FSS is less precise in measuring both low and high levels of fatigue, compared with the MFIS.
• For those interested in measuring both physical and cognitive aspects of fatigue, and whose sample is expected to have higher levels of fatigue, the MFIS is a better choice even though it is longer.
Face Validity Not Established
Floor/Ceiling Effects Multiple Sclerosis: (Amtmann et al., 2012; n=1271 individuals with MS living in
the community, 80% female, 36.2% reported being employed 20 or more hours a week; mean age 50.7, mean disease duration 13.2 years, MS severity as minimal (EDSS≤4.0) for 32.4% and intermediate (EDSS 4.5-6.5) for 47.9% and advanced (EDSS≥7.0) for 19.7%)
• Floor effects: (number of respondents with the lowest possible score)
For more information visit www.neuropt.org or email [email protected]
o MFIS total= 1.1% o MFIS-phy=1.6%
o MFIS-cog=2.7%
o MFIS-psychosocial=7.4% • Ceiling effect: (number of respondents with the highest possible score)
o MFIS total= 0.7%
o MFIS-phy=1.6%
o MFIS-cog=0.9%
o MFIS-psychosocial=9.0%
Responsiveness Not Established
Professional Association Recommendations
Recommendations for use of the instrument from the Academy of Neurologic Physical Therapy of the American Physical Therapy Association’s Multiple Sclerosis Taskforce (MSEDGE), Parkinson’s Taskforce (PD EDGE), Spinal Cord Injury Taskforce (PD EDGE), Stroke Taskforce (StrokEDGE II), Traumatic Brain Injury Taskforce (TBI EDGE), and Vestibular Taskforce (VEDGE) are listed below. These recommendations were developed by a panel of research and clinical experts using a modified Delphi process. For detailed information about how recommendations were made, please visit: http://www.neuropt.org/go/healthcare-professionals/neurology-section-outcome-measures-recommendations
Abbreviations: HR Highly Recommend R Recommend LS / UR Reasonable to use, but limited study in target group / Unable to
Recommend NR Not Recommended
Recommendations for use based on acuity level of the patient:
Acute (CVA < 2 months
post) (SCI < 1 month post)
(Vestibular < 6 weeks post)
Subacute (CVA 2 to 6
months) (SCI 3 to 6 months)
Chronic (> 6 months)
StrokEDGE II NR UR UR
Recommendations based on level of care in which the assessment is taken:
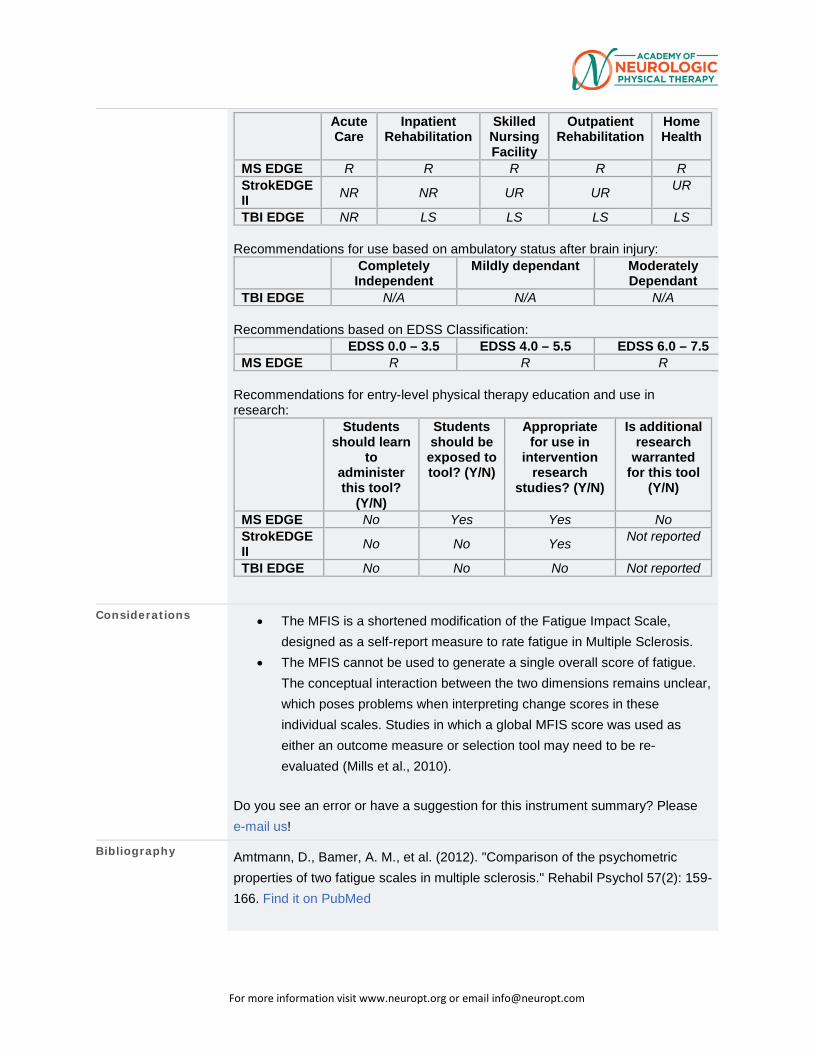
For more information visit www.neuropt.org or email [email protected]
Acute Care
Inpatient Rehabilitation
Skilled Nursing Facility
Outpatient Rehabilitation
Home Health
MS EDGE R R R R R StrokEDGE II NR NR UR UR UR
TBI EDGE NR LS LS LS LS Recommendations for use based on ambulatory status after brain injury:
Completely Independent
Mildly dependant Moderately Dependant
TBI EDGE N/A N/A N/A Recommendations based on EDSS Classification:
EDSS 0.0 – 3.5 EDSS 4.0 – 5.5 EDSS 6.0 – 7.5 MS EDGE R R R
Recommendations for entry-level physical therapy education and use in research:
Students should learn
to administer this tool?
(Y/N)
Students should be exposed to tool? (Y/N)
Appropriate for use in
intervention research
studies? (Y/N)
Is additional research
warranted for this tool
(Y/N)
MS EDGE No Yes Yes No StrokEDGE II No No Yes Not reported
TBI EDGE No No No Not reported
Considerations • The MFIS is a shortened modification of the Fatigue Impact Scale, designed as a self-report measure to rate fatigue in Multiple Sclerosis.
• The MFIS cannot be used to generate a single overall score of fatigue. The conceptual interaction between the two dimensions remains unclear, which poses problems when interpreting change scores in these individual scales. Studies in which a global MFIS score was used as either an outcome measure or selection tool may need to be re-evaluated (Mills et al., 2010).
Do you see an error or have a suggestion for this instrument summary? Please e-mail us!
Bibliography Amtmann, D., Bamer, A. M., et al. (2012). "Comparison of the psychometric properties of two fatigue scales in multiple sclerosis." Rehabil Psychol 57(2): 159-166. Find it on PubMed

For more information visit www.neuropt.org or email [email protected]
Belmont, A., Agar, N., et al. (2006). "Fatigue and traumatic brain injury." Ann Readapt Med Phys 49(6): 283-288, 370-284. Find it on PubMed
Fisk, J. D., Ritvo, P. G., et al. (1994). "Measuring the functional impact of fatigue: initial validation of the fatigue impact scale." Clin Infect Dis 18 Suppl 1: S79-83. Find it on PubMed
Kos, D., Kerckhofs, E., et al. (2005). "Evaluation of the Modified Fatigue Impact Scale in four different European countries." Mult Scler 11(1): 76-80. Find it on PubMed
Mills, R. J., Young, C. A., et al. (2010). "Rasch analysis of the Modified Fatigue Impact Scale (MFIS) in multiple sclerosis." J Neurol Neurosurg Psychiatry 81(9): 1049-1051. Find it on PubMed
Ponsford, J. L., Ziino, C., et al. (2012). "Fatigue and sleep disturbance following traumatic brain injury--their nature, causes, and potential treatments." J Head Trauma Rehabil 27(3): 224-233. Find it on PubMed
Rietberg, M. B., Van Wegen, E. E., et al. (2010). "Measuring fatigue in patients with multiple sclerosis: reproducibility, responsiveness and concurrent validity of three Dutch self-report questionnaires." Disabil Rehabil 32(22): 1870-1876. Find it on PubMed
Sendroy-Terrill, M., Whiteneck, G. G., et al. (2010). "Aging with traumatic brain injury: cross-sectional follow-up of people receiving inpatient rehabilitation over more than 3 decades." Arch Phys Med Rehabil 91(3): 489-497. Find it on PubMed
Tellez, N., Rio, J., et al. (2005). "Does the Modified Fatigue Impact Scale offer a more comprehensive assessment of fatigue in MS?" Mult Scler 11(2): 198-202. Find it on PubMed
Year published
Instrument in PDF Format Yes
Approval Status Approved
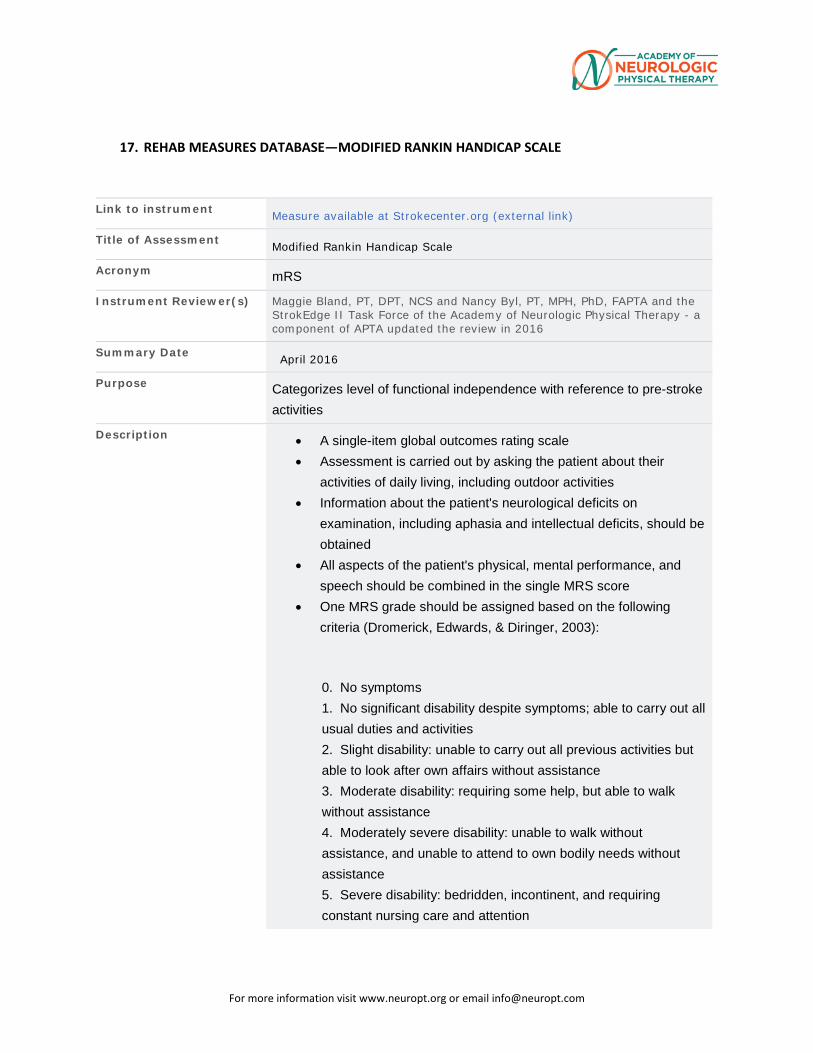
For more information visit www.neuropt.org or email [email protected]
17. REHAB MEASURES DATABASE—MODIFIED RANKIN HANDICAP SCALE
Link to instrument Measure available at Strokecenter.org (external link)
Title of Assessment Modified Rankin Handicap Scale
Acronym mRS
Instrument Reviewer(s) Maggie Bland, PT, DPT, NCS and Nancy Byl, PT, MPH, PhD, FAPTA and the StrokEdge II Task Force of the Academy of Neurologic Physical Therapy - a component of APTA updated the review in 2016
Summary Date April 2016
Purpose Categorizes level of functional independence with reference to pre-stroke activities
Description • A single-item global outcomes rating scale
• Assessment is carried out by asking the patient about their activities of daily living, including outdoor activities
• Information about the patient's neurological deficits on examination, including aphasia and intellectual deficits, should be obtained
• All aspects of the patient's physical, mental performance, and speech should be combined in the single MRS score
• One MRS grade should be assigned based on the following criteria (Dromerick, Edwards, & Diringer, 2003):
0. No symptoms 1. No significant disability despite symptoms; able to carry out all usual duties and activities 2. Slight disability: unable to carry out all previous activities but able to look after own affairs without assistance 3. Moderate disability: requiring some help, but able to walk without assistance 4. Moderately severe disability: unable to walk without assistance, and unable to attend to own bodily needs without assistance 5. Severe disability: bedridden, incontinent, and requiring constant nursing care and attention
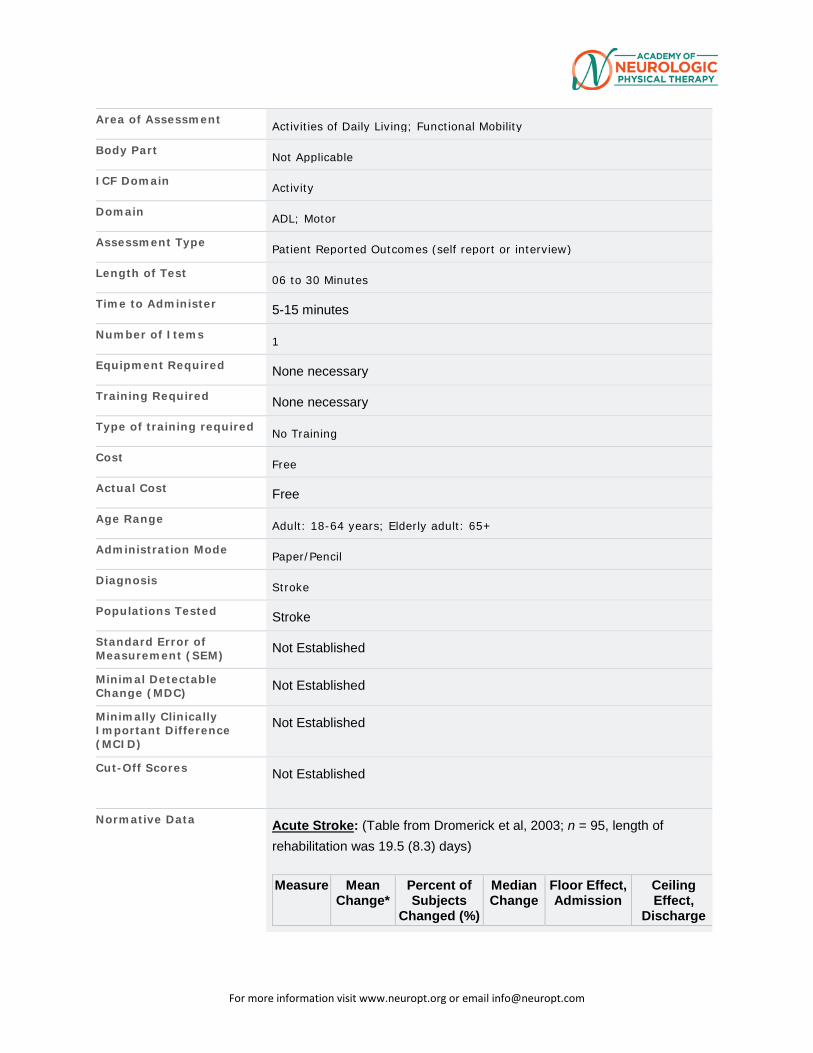
For more information visit www.neuropt.org or email [email protected]
Area of Assessment Activities of Daily Living; Functional Mobility
Body Part Not Applicable
ICF Domain Activity
Domain ADL; Motor
Assessment Type Patient Reported Outcomes (self report or interview)
Length of Test 06 to 30 Minutes
Time to Administer 5-15 minutes
Number of Items 1
Equipment Required None necessary
Training Required None necessary
Type of training required No Training
Cost Free
Actual Cost Free
Age Range Adult: 18-64 years; Elderly adult: 65+
Administration Mode Paper/Pencil
Diagnosis Stroke
Populations Tested Stroke
Standard Error of Measurement (SEM) Not Established
Minimal Detectable Change (MDC) Not Established
Minimally Clinically Important Difference (MCID)
Not Established
Cut-Off Scores Not Established
Normative Data Acute Stroke: (Table from Dromerick et al, 2003; n = 95, length of rehabilitation was 19.5 (8.3) days) Measure Mean
Change* Percent of Subjects
Changed (%)
Median Change
Floor Effect, Admission
Ceiling Effect,
Discharge
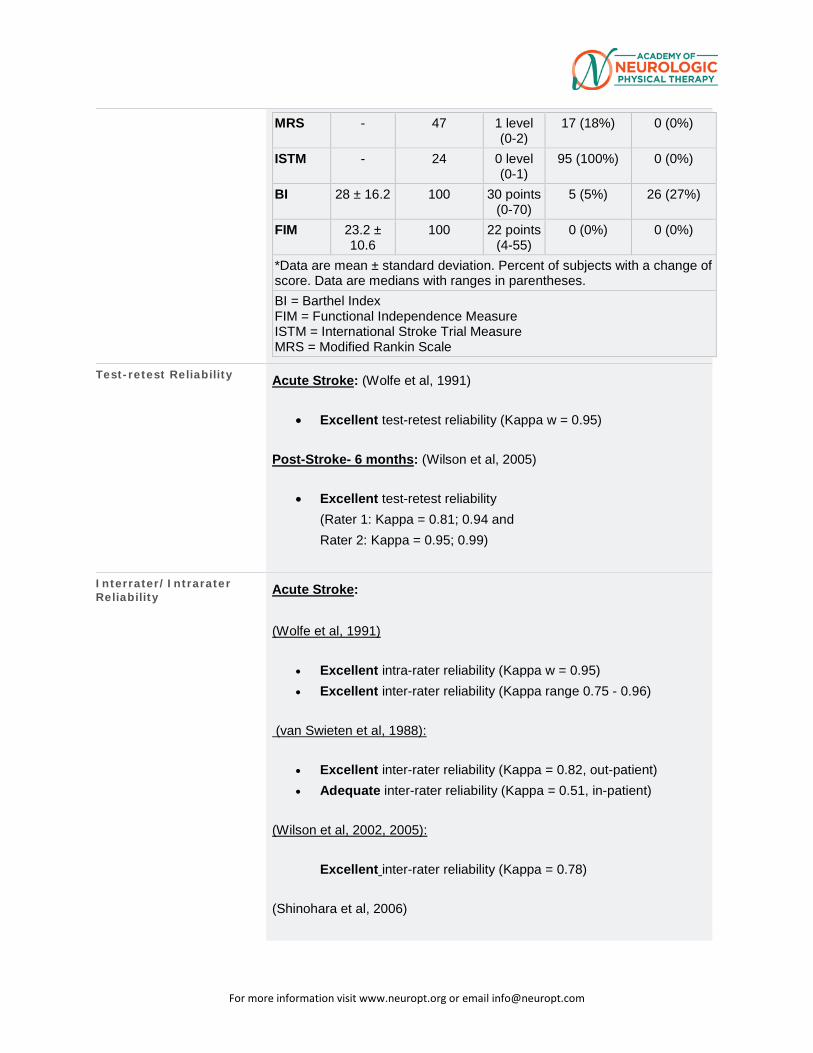
For more information visit www.neuropt.org or email [email protected]
MRS - 47 1 level (0-2)
17 (18%) 0 (0%)
ISTM - 24 0 level (0-1)
95 (100%) 0 (0%)
BI 28 ± 16.2 100 30 points (0-70)
5 (5%) 26 (27%)
FIM 23.2 ± 10.6
100 22 points (4-55)
0 (0%) 0 (0%)
*Data are mean ± standard deviation. Percent of subjects with a change of score. Data are medians with ranges in parentheses. BI = Barthel Index FIM = Functional Independence Measure ISTM = International Stroke Trial Measure MRS = Modified Rankin Scale
Test-retest Reliability Acute Stroke: (Wolfe et al, 1991)
• Excellent test-retest reliability (Kappa w = 0.95)
Post-Stroke- 6 months: (Wilson et al, 2005)
• Excellent test-retest reliability (Rater 1: Kappa = 0.81; 0.94 and Rater 2: Kappa = 0.95; 0.99)
Interrater/Intrarater Reliability Acute Stroke:
(Wolfe et al, 1991)
• Excellent intra-rater reliability (Kappa w = 0.95) • Excellent inter-rater reliability (Kappa range 0.75 - 0.96)
(van Swieten et al, 1988):
• Excellent inter-rater reliability (Kappa = 0.82, out-patient) • Adequate inter-rater reliability (Kappa = 0.51, in-patient)
(Wilson et al, 2002, 2005):
Excellent inter-rater reliability (Kappa = 0.78)
(Shinohara et al, 2006)
For more information visit www.neuropt.org or email [email protected]
• Excellent inter-rater reliability (ICC = 0.95 neurologists; 0.96 nurses)
(Quinn et al, 2008))
• Adequate inter-rater reliability (Kappa = 0.67, overall)
(Quinn et al, 2010)
• The longer the interview, the more variability in rater consistency
• With focused assessment, patients struggle to answer categorically leaving room for rater interpretation
• Further study of reliability is needed on the modified, simplified modified Rankin score and the standard mRS
(Bruno et al 2010; 50 patients post stroke having treatment in an outpatient setting were rated with the simplified mRS (smRS) (yes/no questions) by 9 mRS web-certified raters with repeat testing within 20 minutes of the first rating )
• Excellent test re-test reliability of the simplified mRS questionnaire with a non-structured interview (smRS) had a k statistic of 0.72 (CI95 0.58-0.85) with 78% agreement between raters (compared to previous research on the mRS with a structured interview with adequate reliability r=0.62 with 73% agreement)( Quinn et al, 2009;Cincura et a, 2009, Shinohara et al, 2006)
• Administration time was1.67 minutes( less time than the structured interview format for the mRS (@15 minutes)
(Ghandehari, K., et al. 2012) Five raters administered the Asian Stroke Disability Scale (ASDS) and compared it to the interrater reliability of the modified Rankin Scale (mRS) for 25 subjects post stroke (65.5 years of age, 56% males).
• The difference in scores between the raters on the ASDS and the mRS were not significant ( F = 1.061, p=0.379)The Interrater variability for the mRS did not differ significantly(X2 = 1.758, p = 0.780).. The paired interrater variability of the mRS did also not vary significantly (X2 = 0.553, p = 1.000)
For more information visit www.neuropt.org or email [email protected]
(Fearon, et al 2012;Bruno et al 2012)
• In a study of 74 stroke survivors (median age = 72 years [IQR = 62-79]; median time since stroke = 5 days [IQR = 3-0]), prestroke measures of the mRS and the standard mRS with interview had only adequate inter rater reliability (pw= 0.55; with 55% agreement and pw=0.70 with 70% agreement respectively) (Fearon et al, 2012)
• The mRS cannot be used as a prestroke measure. It must only be used as a post stroke measure because some of the items cannot be scored as 0, 1 or 2 because the patient needs to compare post stroke function with pre stroke function; thus before the first stroke, there are no stroke symptoms. (Bruno et al letter, 2012)
(Bruno et al 2011) With 50 consecutive outpatients 4.83 (+3.00) months
post stroke, 9 paired raters administered the msRSq by a standard
interview twice (one 20 minutes after the first) and then repeated test
administration over the telephone 1-3 days later .
• The average estimated time to administer the smRSq in person
was 1.29 minutes (range, 0.50 to 2.25 minutes).
• The In-person raters agreed 78% of the time (k= 0.71; CI, 0.57 to
0.86 with weighted Kw_0.86; CI, 0.79 to 0.94).
• The first in-person and telephone raters agreed 82% (k= 0.76; CI,
0.63 to 0.90 and Kw= 0.87; CI, 0.79 to 0.95).
• The second in-person and telephone raters agreed 82% (k=0.77;
CI, 0.63 to 0.90 and Kw= 0.89; CI, 0.82 to 0.96).
(Zhao, et al, 2010) 56 participants, mean age = 71 years old (± 13.6), less
than 4 days post-stroke were administered the mRS by three trained rater
groups (experienced (Exp), inexperienced (Inexp), and inexperienced
with a decision tool (Inexp+DT).
• Adequate reliability was found across all groups (ICC = 0.675,
95% CI = 0.559-0.791)
For more information visit www.neuropt.org or email [email protected]
• Adequate reliability was found between each of the groups
o Exp vs. Inexp (Kw = 0.686, 95% CI = 0.541-0.819, p =
0.032)
o Exp vs. Inexp+DT (Kw = 0.568, 95% CI = 0.359-0.724, p
= 0.553)
o Inexp vs. Inexp+DT (Kw = 0.736, 95% CI = 0.557-0.859,
p = 0.121)
Sub-Acute Stroke: (Saver, 2010) n = 50 patients, average 71.5 years old (range 43-93).
Participants received the Rankin Focused Assessment to derive the mRS
(administered by two coordinators) at their 90 day assessment as part of
the Phase III National Institutes of Health Field Administration of Stroke
Therapy-Magnesium Trial.
• Among all participants the percent agreement was 94% (Kw =
0.99, 95% CI = 0.99-1.00; K = 0.93, 95% CI = 0.85-1.00). Among
the 43 participants living at the 90 day assessments the percent
agreement was 93% (Kw = 0.99, 95% CI = 0.98-1.0, Kw = 0.91,
95% CI 0.82-1.00)
Telephone Administration: (Janssen, 2010; Dennis, 2011)
Acute
(Dennis, 2012) compared two postal versions of the mRS: one with a tick box for the five descriptions, the other was the simplified modified Rankin questionnaire (smRSq) that has yes/no responses and derives the mRS score. Both were followed-up with a telephone interview using the Rankin Focused Assessment
• Adequate reliability (Kappa = 0.44, Kappa w = 0.68) between the two postal versions of the mRS
• Adequate reliability (Kappa = 0.47, Kappa w = 0.66) between the tick box version of the mRS and the telephone interview
• Adequate reliability (Kappa = 0.55, Kappa w = 0.73) between the
smRSq and the telephone interview
(Savio et al 2013) 131 patients post stroke were interviewed by 2 certified
For more information visit www.neuropt.org or email [email protected]
nurses. Half of the patients were randomized to be interviewed by
telephone followed by face to face assessment and half the reverse
order.
• Telephone assessment of stroke disability with the modified
Rankin Scale is similar in reliability in comparison to direct face
to-face assessment.
• The median value of the modified Rankin Scale score was 4 (IQR
3-5) by telephone as well as by face-to-face assessment (p =
0.8).
• Excellent reliability between the two methods was Kw = 0.82 (CI
95:0.77-0.88).
• Sensitivity of the telephone assessment was lower for scores 2
and 3 (17% and 46%, respectively) than for scores 4-5 (range
67-90%).
Subacute
(Janssen, 2010) compared mRS scores for 83 participants a median of 5 months post-stroke comparing administration face to face to over the telephone.
• Adequate reliability (Kappa = 0.41, 95% CI 0.26-0.55; Kappa weighted = 0.71, 95% CI 0.59-0.82).
•
Internal Consistency Not established
Criterion Validity (Predictive/Concurrent) Predictive Validity
(Bruno et al, 2013) Forty subjects, documented in severity with the National Institutes of Health Stroke Scale (NIHSS) post treatment with intravenous tissue plasminogen activator in the ER Department were followed up to assess functional outcomes using the simplified Modified Rankin Scale (smRSq) . The participants averaged 69 years of age (±14), represented 45% males, had an average initial NIHSS score of 10 and were, on average, 3-7 months post stroke.
• Median follow up score on the smRSq was 3 (IQR = 1-6).
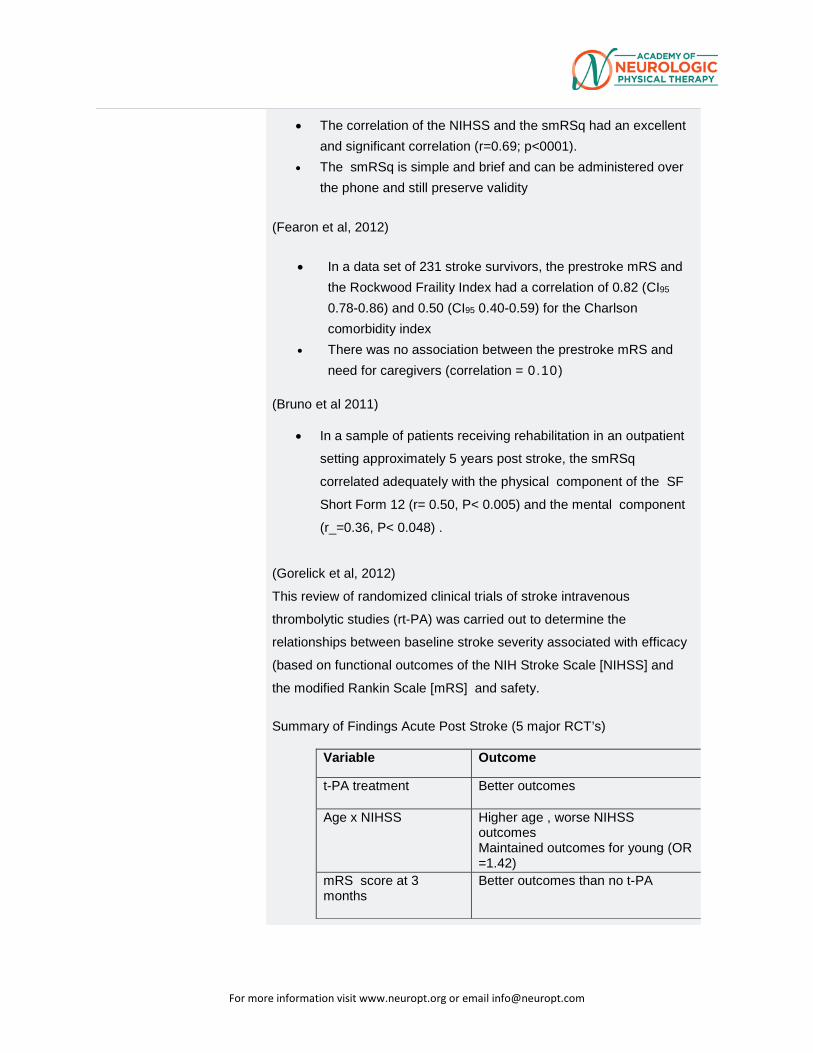
For more information visit www.neuropt.org or email [email protected]
• The correlation of the NIHSS and the smRSq had an excellent and significant correlation (r=0.69; p<0001).
• The smRSq is simple and brief and can be administered over the phone and still preserve validity
(Fearon et al, 2012)
• In a data set of 231 stroke survivors, the prestroke mRS and the Rockwood Fraility Index had a correlation of 0.82 (CI95 0.78-0.86) and 0.50 (CI95 0.40-0.59) for the Charlson comorbidity index
• There was no association between the prestroke mRS and need for caregivers (correlation = 0.10)
(Bruno et al 2011)
• In a sample of patients receiving rehabilitation in an outpatient
setting approximately 5 years post stroke, the smRSq
correlated adequately with the physical component of the SF
Short Form 12 (r= 0.50, P< 0.005) and the mental component
(r_=0.36, P< 0.048) .
(Gorelick et al, 2012)
This review of randomized clinical trials of stroke intravenous
thrombolytic studies (rt-PA) was carried out to determine the
relationships between baseline stroke severity associated with efficacy
(based on functional outcomes of the NIH Stroke Scale [NIHSS] and
the modified Rankin Scale [mRS] and safety.
Summary of Findings Acute Post Stroke (5 major RCT’s)
Variable Outcome
t-PA treatment
Better outcomes
Age x NIHSS Higher age , worse NIHSS outcomes Maintained outcomes for young (OR =1.42)
mRS score at 3 months
Better outcomes than no t-PA
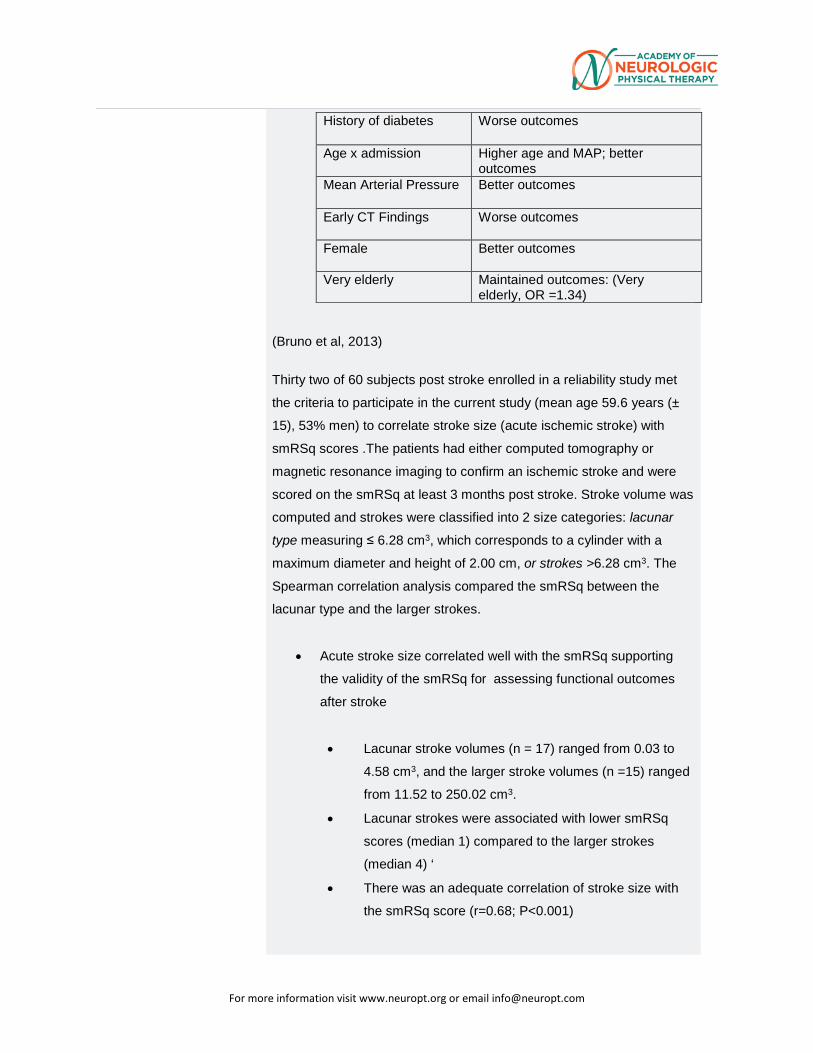
For more information visit www.neuropt.org or email [email protected]
History of diabetes
Worse outcomes
Age x admission Higher age and MAP; better outcomes
Mean Arterial Pressure
Better outcomes
Early CT Findings
Worse outcomes
Female
Better outcomes
Very elderly Maintained outcomes: (Very elderly, OR =1.34)
(Bruno et al, 2013)
Thirty two of 60 subjects post stroke enrolled in a reliability study met
the criteria to participate in the current study (mean age 59.6 years (±
15), 53% men) to correlate stroke size (acute ischemic stroke) with
smRSq scores .The patients had either computed tomography or
magnetic resonance imaging to confirm an ischemic stroke and were
scored on the smRSq at least 3 months post stroke. Stroke volume was
computed and strokes were classified into 2 size categories: lacunar
type measuring ≤ 6.28 cm3, which corresponds to a cylinder with a
maximum diameter and height of 2.00 cm, or strokes >6.28 cm3. The
Spearman correlation analysis compared the smRSq between the
lacunar type and the larger strokes.
• Acute stroke size correlated well with the smRSq supporting
the validity of the smRSq for assessing functional outcomes
after stroke
• Lacunar stroke volumes (n = 17) ranged from 0.03 to
4.58 cm3, and the larger stroke volumes (n =15) ranged
from 11.52 to 250.02 cm3.
• Lacunar strokes were associated with lower smRSq
scores (median 1) compared to the larger strokes
(median 4) ‘
• There was an adequate correlation of stroke size with
the smRSq score (r=0.68; P<0.001)
For more information visit www.neuropt.org or email [email protected]
• (Tilson et al, 2010; n =283; mean age 63. 5 (± 12.5) years;
assessed patients approximately 20 and 60 days post-
stroke); data is from the Locomotor Experience Applied
Post Stroke study, and the mRS was used as the anchor
for determining the minimally clinically important difference.
A poor, but substantial relationship was found between the
mRS and comfortable gait speed
• The area under the curve was calculated as 0.69 (95% CI
= 0.63-0.75).
Concurrent Validity Acute Stroke:.
(Cup et al 2003; n = 26; mean age 68 (15) years):
• Excellent concurrent validity with: Barthel Index (r = - 0.81) Frenchay Activities Index (r = - 0.80) EQ-56 (r = 0.68)
• Adequate concurrent validity with: SA-SIP-30 (r = 0.47)
(Kwon et al, 2004, n = 459; mean age = 70 (11.4) years):
Excellent concurrent validity with: Barthel Index (r = - 0.89) FIM-motor dimension (r = - 0.89) (Weimer et al 2004, n = 4246; mean age = 67.1 (69) years):
• Excellent concurrent validity with: • SF-36 Physical Function (r = 0.84) • Barthel Index (r = 0.82)
(Liotta et al, 2013, to determine readmission of patients with ICF as measured by the Rankin Scale ( mRS) at 14 days, 28 days and 3 months post stroke)
For more information visit www.neuropt.org or email [email protected]
Retrospective evaluation of 246 patients readmitted 30 days following treatment of acute intracranial hemorrhage on the ICU. Of 246 patients with a mean age of 65 years:
• 78% survived discharge. Of these, 22 (11%) were re-admitted 4-15 days post ICU discharge.
• The most common reason for readmission was infection (n = 10) and vascular event (n = 6)
• Readmitted patients had similar mRS scores to those not readmitted at 14 days (median 4 [IQR = 4-5], median 5 [IQR = 4-5], respectively), but those who were readmitted had higher mRS scores at three months post stroke (median 5 [IQR = 3-6] for those readmitted and 3 [IQR = 1-4] for those not readmitted.
(Kerr et al, 2012)
Within the Virtual International Stroke Trials Archive, the rt-PA-treated patients were compared to the non rt-PA treated patients (10,000 samples).The end points of the mRS at 30 and 90 days and NIHSS at 7 and 90 days post stroke were studied.
• The smallest sample sizes to generate statistical power greater than 80 % were 620 and 480 respectively for the mRS and 370 and 420 respectively for the NIHSS
• The 7 day NIHSS was the most sensitive outcome measurement to detect differences in the rt-PA treated patients.
(Ali, 2013; n = 3787 with complete data available, n = 3872 Stroke Impact Scale data available at 3 months; mean age for those self-reporting 68 (58-76) years and those requiring proxy 75 (66-80). Authors examined outcomes data from the Virtual International Stroke Trials Archive.
• Excellent concurrent validity of the mRS at three months post-stroke with the European Quality of Life Scale-5D (EQ-5D) Weighted Scores (-0.75, p<0.0001), the EQ-5D Visual Analog Scale (-0.64, p<0.0001), Stroke Impact Scale Recovery (-0.73, p<0.0001), and Stroke Impact Scale-16 (-.083, p<0.0001).
• The mRS was used to examine the proportion of patients classified as having a good primary outcome (mRS ≤ 1), but a poorer quality of life and was found to be superior.
Subacute Stroke
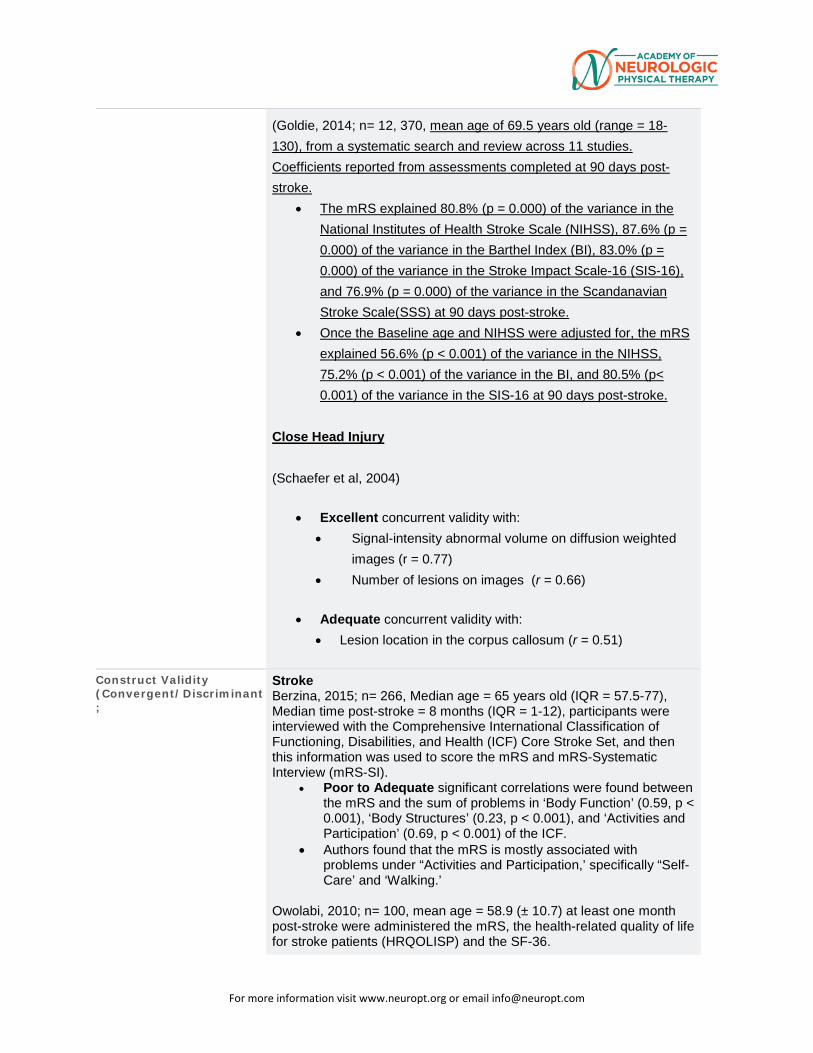
For more information visit www.neuropt.org or email [email protected]
(Goldie, 2014; n= 12, 370, mean age of 69.5 years old (range = 18-130), from a systematic search and review across 11 studies. Coefficients reported from assessments completed at 90 days post-stroke.
• The mRS explained 80.8% (p = 0.000) of the variance in the National Institutes of Health Stroke Scale (NIHSS), 87.6% (p = 0.000) of the variance in the Barthel Index (BI), 83.0% (p = 0.000) of the variance in the Stroke Impact Scale-16 (SIS-16), and 76.9% (p = 0.000) of the variance in the Scandanavian Stroke Scale(SSS) at 90 days post-stroke.
• Once the Baseline age and NIHSS were adjusted for, the mRS explained 56.6% (p < 0.001) of the variance in the NIHSS, 75.2% (p < 0.001) of the variance in the BI, and 80.5% (p< 0.001) of the variance in the SIS-16 at 90 days post-stroke.
Close Head Injury (Schaefer et al, 2004)
• Excellent concurrent validity with: • Signal-intensity abnormal volume on diffusion weighted
images (r = 0.77) • Number of lesions on images (r = 0.66)
• Adequate concurrent validity with: • Lesion location in the corpus callosum (r = 0.51)
Construct Validity (Convergent/Discriminant;
Stroke Berzina, 2015; n= 266, Median age = 65 years old (IQR = 57.5-77), Median time post-stroke = 8 months (IQR = 1-12), participants were interviewed with the Comprehensive International Classification of Functioning, Disabilities, and Health (ICF) Core Stroke Set, and then this information was used to score the mRS and mRS-Systematic Interview (mRS-SI).
• Poor to Adequate significant correlations were found between the mRS and the sum of problems in ‘Body Function’ (0.59, p < 0.001), ‘Body Structures’ (0.23, p < 0.001), and ‘Activities and Participation’ (0.69, p < 0.001) of the ICF.
• Authors found that the mRS is mostly associated with problems under “Activities and Participation,’ specifically “Self-Care’ and ‘Walking.’
Owolabi, 2010; n= 100, mean age = 58.9 (± 10.7) at least one month post-stroke were administered the mRS, the health-related quality of life for stroke patients (HRQOLISP) and the SF-36.
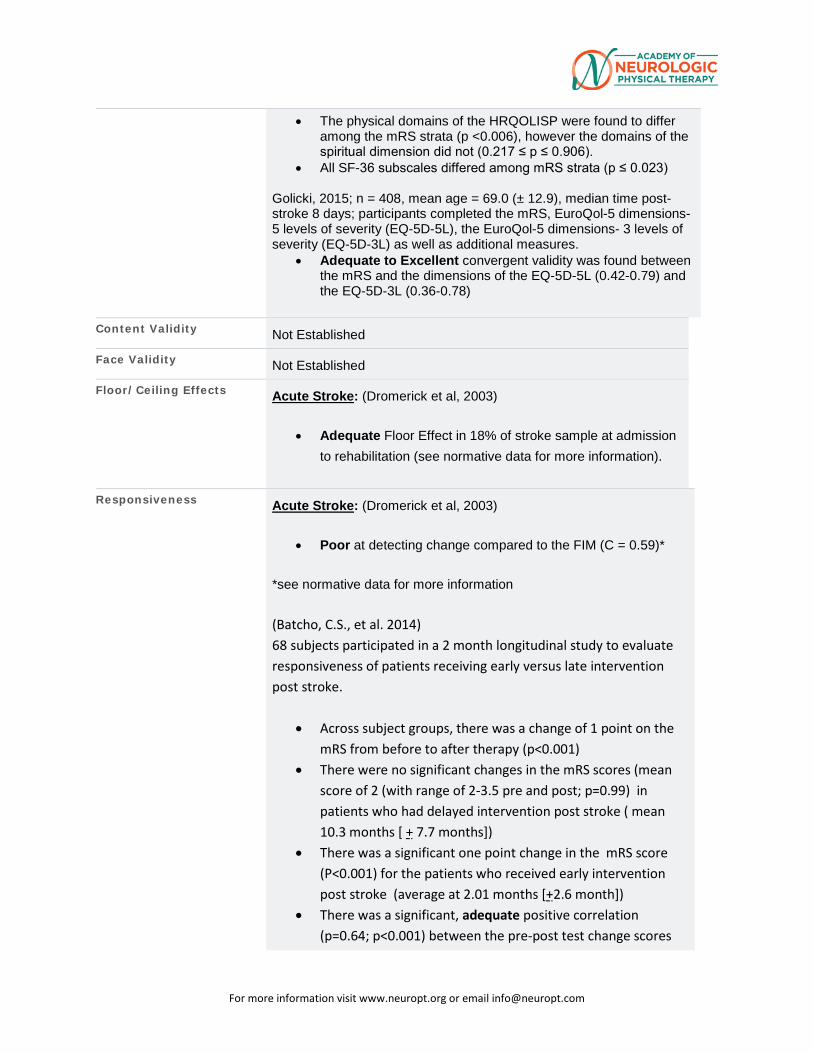
For more information visit www.neuropt.org or email [email protected]
• The physical domains of the HRQOLISP were found to differ among the mRS strata (p <0.006), however the domains of the spiritual dimension did not (0.217 ≤ p ≤ 0.906).
• All SF-36 subscales differed among mRS strata (p ≤ 0.023) Golicki, 2015; n = 408, mean age = 69.0 (± 12.9), median time post-stroke 8 days; participants completed the mRS, EuroQol-5 dimensions-5 levels of severity (EQ-5D-5L), the EuroQol-5 dimensions- 3 levels of severity (EQ-5D-3L) as well as additional measures.
• Adequate to Excellent convergent validity was found between the mRS and the dimensions of the EQ-5D-5L (0.42-0.79) and the EQ-5D-3L (0.36-0.78)
Content Validity Not Established
Face Validity Not Established
Floor/Ceiling Effects Acute Stroke: (Dromerick et al, 2003)
• Adequate Floor Effect in 18% of stroke sample at admission to rehabilitation (see normative data for more information).
Responsiveness Acute Stroke: (Dromerick et al, 2003)
• Poor at detecting change compared to the FIM (C = 0.59)*
*see normative data for more information (Batcho, C.S., et al. 2014) 68 subjects participated in a 2 month longitudinal study to evaluate responsiveness of patients receiving early versus late intervention post stroke.
• Across subject groups, there was a change of 1 point on the mRS from before to after therapy (p<0.001)
• There were no significant changes in the mRS scores (mean score of 2 (with range of 2-3.5 pre and post; p=0.99) in patients who had delayed intervention post stroke ( mean 10.3 months [ + 7.7 months])
• There was a significant one point change in the mRS score (P<0.001) for the patients who received early intervention post stroke (average at 2.01 months [+2.6 month])
• There was a significant, adequate positive correlation (p=0.64; p<0.001) between the pre-post test change scores
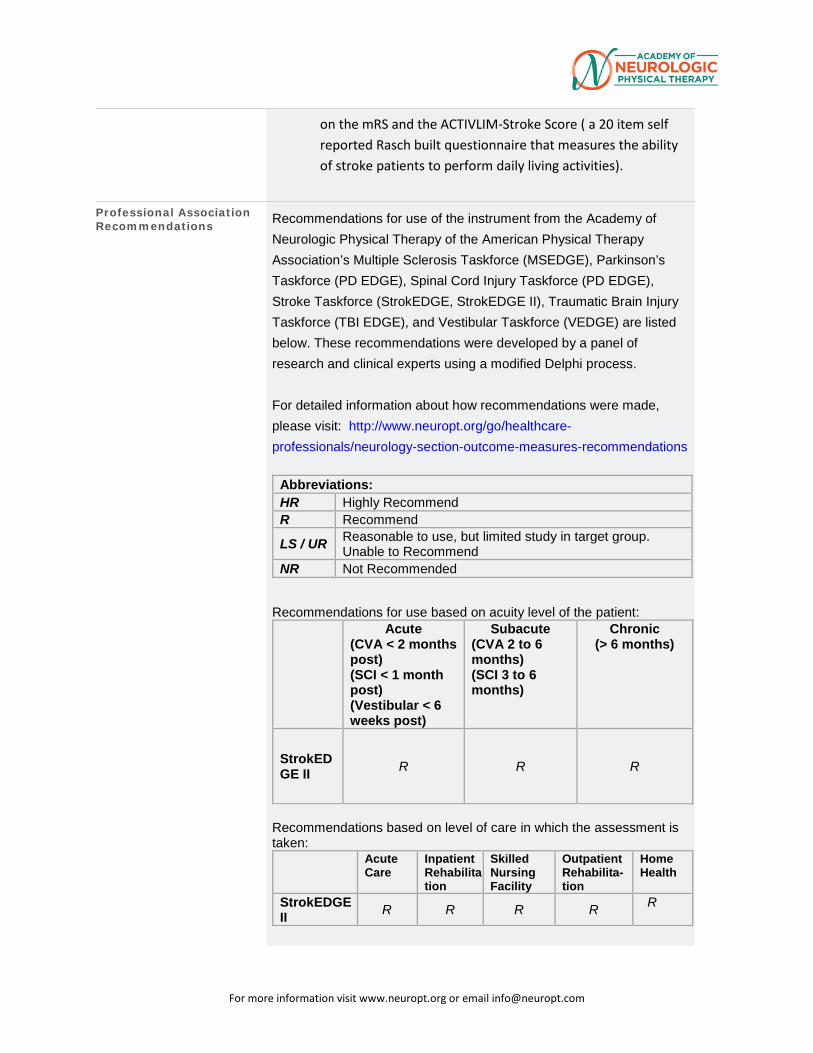
For more information visit www.neuropt.org or email [email protected]
on the mRS and the ACTIVLIM-Stroke Score ( a 20 item self reported Rasch built questionnaire that measures the ability of stroke patients to perform daily living activities).
Professional Association Recommendations Recommendations for use of the instrument from the Academy of
Neurologic Physical Therapy of the American Physical Therapy Association’s Multiple Sclerosis Taskforce (MSEDGE), Parkinson’s Taskforce (PD EDGE), Spinal Cord Injury Taskforce (PD EDGE), Stroke Taskforce (StrokEDGE, StrokEDGE II), Traumatic Brain Injury Taskforce (TBI EDGE), and Vestibular Taskforce (VEDGE) are listed below. These recommendations were developed by a panel of research and clinical experts using a modified Delphi process. For detailed information about how recommendations were made, please visit: http://www.neuropt.org/go/healthcare-professionals/neurology-section-outcome-measures-recommendations
Abbreviations: HR Highly Recommend R Recommend LS / UR Reasonable to use, but limited study in target group.
Unable to Recommend NR Not Recommended
Recommendations for use based on acuity level of the patient:
Acute (CVA < 2 months post) (SCI < 1 month post) (Vestibular < 6 weeks post)
Subacute (CVA 2 to 6 months) (SCI 3 to 6 months)
Chronic (> 6 months)
StrokEDGE II R R R
Recommendations based on level of care in which the assessment is taken:
Acute Care
Inpatient Rehabilita-tion
Skilled Nursing Facility
Outpatient Rehabilita-tion
Home Health
StrokEDGE II R R R R R
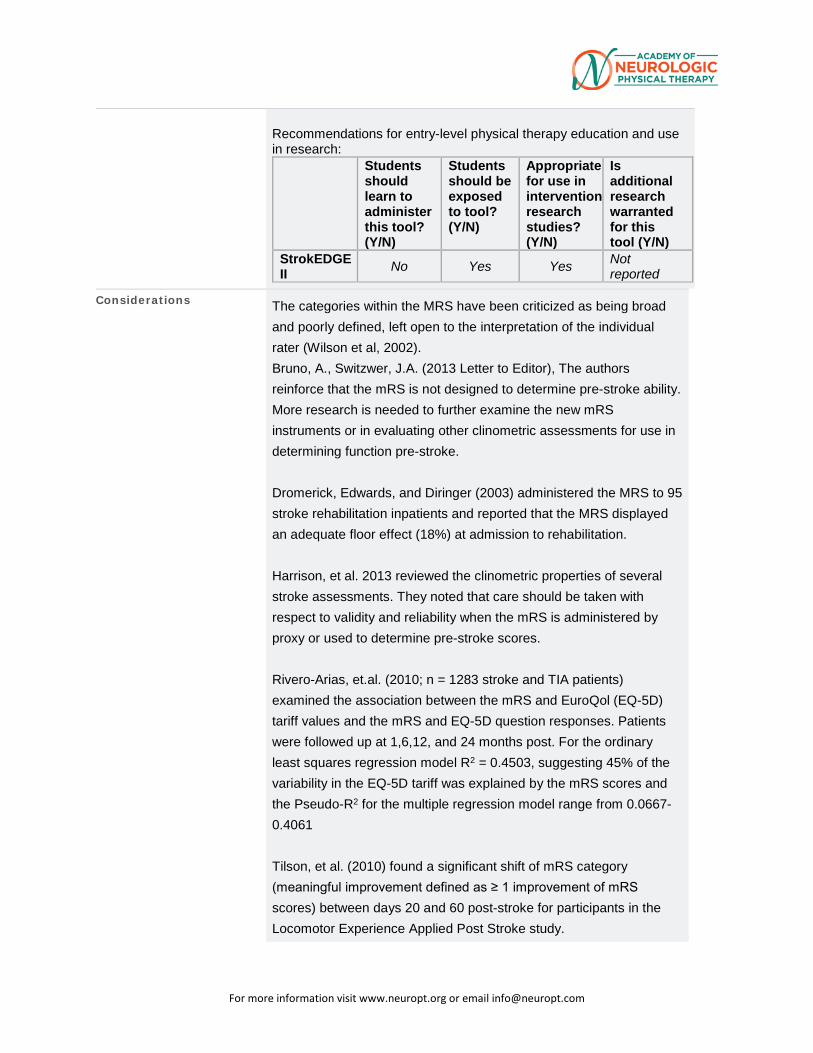
For more information visit www.neuropt.org or email [email protected]
Recommendations for entry-level physical therapy education and use in research:
Students should learn to administer this tool? (Y/N)
Students should be exposed to tool? (Y/N)
Appropriate for use in intervention research studies? (Y/N)
Is additional research warranted for this tool (Y/N)
StrokEDGE II No Yes Yes Not
reported
Considerations The categories within the MRS have been criticized as being broad and poorly defined, left open to the interpretation of the individual rater (Wilson et al, 2002). Bruno, A., Switzwer, J.A. (2013 Letter to Editor), The authors reinforce that the mRS is not designed to determine pre-stroke ability. More research is needed to further examine the new mRS instruments or in evaluating other clinometric assessments for use in determining function pre-stroke. Dromerick, Edwards, and Diringer (2003) administered the MRS to 95 stroke rehabilitation inpatients and reported that the MRS displayed an adequate floor effect (18%) at admission to rehabilitation. Harrison, et al. 2013 reviewed the clinometric properties of several stroke assessments. They noted that care should be taken with respect to validity and reliability when the mRS is administered by proxy or used to determine pre-stroke scores. Rivero-Arias, et.al. (2010; n = 1283 stroke and TIA patients) examined the association between the mRS and EuroQol (EQ-5D) tariff values and the mRS and EQ-5D question responses. Patients were followed up at 1,6,12, and 24 months post. For the ordinary least squares regression model R2 = 0.4503, suggesting 45% of the variability in the EQ-5D tariff was explained by the mRS scores and the Pseudo-R2 for the multiple regression model range from 0.0667-0.4061 Tilson, et al. (2010) found a significant shift of mRS category (meaningful improvement defined as ≥ 1 improvement of mRS scores) between days 20 and 60 post-stroke for participants in the Locomotor Experience Applied Post Stroke study.
For more information visit www.neuropt.org or email [email protected]
Do you see an error or have a suggestion for this instrument summary? Please e-mail us!
Bibliography Ali, M., et al. (2013).” How well do standard stroke outcome measures reflect quality of life? A retrospective analysis of clinical trial data.” Stroke 44:3161-3165.
Batcho, C.S., et al. (2014) “Measuring functional recovery in stroke patients: the responsiveness of ACTIVLIM-stroke.” J Neurol Neurosurg Psychiatry 85(12): p. 1337-42.
Berzina, G. et al (2015) “Analysing the modified rankin scale using concepts of the international classification of functioning, disability, and health.” Eur J Phys Rehabil Med.
Bruno, A., et al., (2010) “Improving modified Rankin Scale assessment with a simplified questionnaire.” Stroke, 41(5): p. 1048-50.
Bruno, A., et al. (2011) “Simplified modified rankin scale questionnaire: reproducibility over the telephone and validation with quality of life.” Stroke 42(8): p. 2276-9.
Bruno, A., et al., (2013) “Stroke size correlates with functional outcome on the simplified modified Rankin Scale questionnaire.” J Stroke Cerebrovasc Dis 22(6): p. 781-3.
Bruno, A., et al. (2013) “Simplified modified Rankin Scale questionnaire correlates with stroke severity.” Clin Rehabil 27(8): p. 724-7
Bruno, A. and J.A. Switzer (2013) Letter by Bruno and Switzer regarding article, "Prestroke modified Rankin Stroke Scale has moderate interobserver reliability and validity in an acute stroke setting". Stroke. 44(5): p. e43.
Cincura C, Pontes-Neto OM, Neville IS, Mendes HF, Menezes DF, Mariano DC, Pereira IF, Teixeira LA Jesus PA, de Wueiroz DC, Pereira DF, Pinto E, Leite JP, Lopes AA, Oliveira=Filho J. (2009)” Validation of the national institutes of health stroke scale, modified Rankin scale
For more information visit www.neuropt.org or email [email protected]
and Barthel Index in Brazil: The role of cultural adaptation and structured interviewing.” Cerebrovasc Dis 27:119-122
Cup, E. H., Scholte op Reimer, W. J., et al. (2003). "Reliability and validity of the Canadian Occupational Performance Measure in stroke patients." Clin Rehabil 17(4): 402-409. Find it on PubMed
De Haan, R., Horn, J., et al. (1993). "A comparison of five stroke scales with measures of disability, handicap, and quality of life." Stroke 24: 1178-1181. Find it on PubMed
de Haan, R., Limburg, M., et al. (1995). "The clinical meaning of Rankin 'handicap' grades after stroke." Stroke 26: 2027-2030. Find it on PubMed
Dennis, M. et al. (2012). “Determining the Modified Rankin Score after stroke by postal and telephone questionnaires.” Stroke 43:851-853.
Dromerick, A. W., Edwards, D. F., et al. (2003). "Sensitivity to changes in disability after stroke: a comparison of four scales useful in clinical trials." J Rehabil Res Dev 40: 1-8. Find it on PubMed
Fearon, P., et al.{2012) “Prestroke modified rankin stroke scale has moderate interobserver reliability and validity in an acute stroke setting.” Stroke 43(12): p. 3184-8.
Ghandehari, K., et al. (2012) “Comparative interrater reliability of Asian Stroke Disability Scale, modified Rankin Scale and Barthel Index in patients with brain infarction.” ARYA Atheroscler 8(3): p. 153-7. Goldie, F.C., et al. (2014). “Interdependence of stroke outcome scales: reliable estimates from the Virtual International Stroke Trials Archive (VISTA).” Int J Stroke 9(3): 328-332. Golicki, D., et al (2015). “Validity of EQ-5D-5L in stroke.” Qual Life Res 24(4): 845-50. Gorelick, P.B., (2012). “How baseline severity affects efficacy and safety outcomes in acute ischemic stroke intervention trials.” Ann N Y Acad Sci, 1268: p. 85-94.
For more information visit www.neuropt.org or email [email protected]
Harrison, J.K. et al., (2013) “Assessment scales in stroke: clinimetric and clinical considerations.” Clin Interv Aging 8:8-12, Janssen, P.M., et al., (2010) “Comparison of telephone and face-to-face assessment of the modified rankin scale.” Cerebrovasc Dis 29:137-139. Kerr, D.M., et al., (2012) “Seven-day NIHSS is a sensitive outcome measure for exploratory clinical trials in acute stroke: evidence from the Virtual International Stroke Trials Archive.” Stroke 43(5): p. 1401-3.
Kwon, S., Hartzema, A. G., et al. (2004). "Disability measures in stroke: relationship among the Barthel Index, the Functional Independence Measure, and the Modified Rankin Scale." Stroke 35: 918-923. Find it on PubMed
Liotta, E.M., et al (2013) “Predictors of 30-day readmission after intracerebral hemorrhage: a single-center approach for identifying potentially modifiable associations with readmission.” Crit Care Med 41(12): p. 2762-9.
Owolabi, M.O. (2010). “Which is more valid for stroke patients: generic or stroke-specific quality of life measures?” Neuroepidemiology 34(1): 8-12.
Quinn, T. J., Ray, G., et al. (2008). "Deriving modified Rankin scores from medical case-records." Stroke 39: 3421-3423. Find it on PubMed
Quinn, T.J., et al.(2010) “Reliability of structured modified Rankin Scale assessment.” Stroke 41(12): p. e602; author reply e603.
Rivero-Arias, O. et al. (2010) “Mapping the modified Rankin Scale (mRS) measurement into the generic EuroQol (EZ-5D) Health Outcome.” Med Decis Making 30:341-354. Saver, J.L, et al (2010) “Improving the reliability of stroke disability
grading in clinical trails and clinical practice: the Rankin Focused Assessment (RFA).” Stroke 41(5):992-5.
Savio, K., et al. (2013)” Reliability of the modified Rankin Scale
applied by telephone.” Neurol Int 5(1): p. e2.
For more information visit www.neuropt.org or email [email protected]
Schaefer, P. W., Huisman, T. A., et al. (2004). "Diffusion-weighted MR imaging in closed head injury: high correlation with initial glasgow coma scale score and score on modified Rankin scale at discharge." Radiology 233(1): 58-66. Find it on PubMed
Shinohara, Y., Minematsu, K., et al. (2006). "Modified Rankin scale with expanded guidance scheme and interview questionnaire: interrater agreement and reproducibility of assessment." Cerebrovasc Dis 21: 271-278. Find it on PubMed
Tilley, B. C., Marler, J., et al. (1996). "Use of a global test for multiple outcomes in stroke trials with application to the National Institute of Neurological Disorders and Stroke t-PA Stroke Trial." Stroke 27: 2136-2142. Find it on PubMed
van Swieten, J. C., Koudstaal, P. J., et al. (1988). "Interobserver agreement for the assessment of handicap in stroke patients." Stroke 19: 604-607. Find it on PubMed
Weimar, C., Kurth, T., et al. (2002). "Assessment of functioning and disability after ischemic stroke." Stroke 33(8): 2053-2059. Find it on PubMed
Wilson, J. T., Hareendran, A., et al. (2002). "Improving the assessment of outcomes in stroke: use of a structured interview to assign grades on the modified Rankin Scale." Stroke 33(9): 2243-2246. Find it on PubMed
Wolfe, C. D., Taub, N. A., et al. (1991). "Assessment of scales of disability and handicap for stroke patients." Stroke 22: 1242-1244. Find it on PubMed
Zhao, H., et al., “The modified Rankin Scale in acute stroke has good inter-rater-reliability but questionable validity.” Cerebrovasc Dis, 2010. 29(2): p. 188-93.
Year published 1957
Instrument in PDF Format Yes
Approval Status Approved

For more information visit www.neuropt.org or email [email protected]
For more information visit www.neuropt.org or email [email protected]
18. REHAB MEASURES: MOTOR ACTIVITY LOG
Link to instrument
Title of Assessment Motor Activity Log
Acronym MAL
Instrument Reviewer(s) Initially reviewed by Jane Sullivan, PT in 2013. Updated by Maggie Bland PT,DPT,NCS and Nancy Byl PT,MPH,PhD, FAPTA and the StrokEDGE II task force of the Academy of Neurologic Physical Therapy - a component of APTA in 2016.
Summary Date 7/24/2014; 3/2016
Purpose Semi-structured interview to assess arm function.
For more information visit www.neuropt.org or email [email protected]
Description Individuals are asked to rate Quality of Movement (QOM) and Amount of Movement (AOM) during 30 daily functional tasks (original MAL), 28 functional tasks (MAL 28) or 14 tasks (MAL 14). Target tasks include object manipulation (e.g. pen, fork, comb, and cup) as well as the use of the arm during gross motor activities (e.g. transferring to a car, steadying oneself during standing, pulling a chair into a table while sitting).
Items scored on a 6-point ordinal scale.
Scoring on Amount of Use Scale:
0. The weaker arm was not used at all for that activity (never)
1. Occasionally used weaker arm, but only very rarely (very rarely)
2. Sometimes used weaker arm but did the activity most of the time with stronger arm (rarely)
3. Used weaker arm about half as much as before the stroke (half pre-stroke)
4. Used weaker arm almost as much as before the stroke (3/4 pre-stroke)
5. The ability to use the weaker arm for that activity was as good as before the stroke (normal)
Scoring on Quality of Movement Scale:
0. The weaker arm was not used at all for that activity (never)
1. The weaker arm was moved during that activity but was not helpful (very poor)
2. The weaker arm was of some use during the activity but needed help from the stronger arm or moved very slowly or with difficulty (poor)
3. The weaker arm was used for the purpose indicated but movements were slow or were made with only some effort (fair)
4. The movements made by the weaker arm were almost normal, but were not quite as fast or accurate as normal (almost normal) 5. The ability to use the weaker arm for that activity was as good as before the stroke (normal)
Area of Assessment
For more information visit www.neuropt.org or email [email protected]
Body Part Upper extremity
ICF Domain Participation
Domain Activity
Assessment Type Patient Reported Outcomes
Length of Test 06 to 30 Minutes
Time to Administer Approximately 20 minutes
Number of Items 30, 28 or 14
Equipment Required Survey Instrument
Training Required Students should be aware of this as an example of self-report arm function measure. This measure is often used in outcome studies of arm intervention most commonly for patients post stroke.
Type of training required Reading an Article/Manual
Cost Free
Actual Cost Free
Age Range Adult: 18-64 years; Elderly adult: 65+
Administration Mode Paper/Pencil
Diagnosis Stroke; Head injury with hemiparesis
Populations Tested Stroke
Standard Error of Measurement (SEM) Not Established
Minimal Detectable Change (MDC)
(Simpson, 2015; systematic review of articles for patients post stroke)4
• MDC90 = 0.56- 1.06 • MDC95 = 0.67- 1.27
For more information visit www.neuropt.org or email [email protected]
Minimally Clinically Important Difference (MCID; Responsiveness Ratio)
Stroke: (Simpson, 2015)4
• MCID = 1.0-1.1
Cut-Off Scores Not Established
Normative Data Not Established
Test-retest Reliability Stroke:
(Van der Lee JH et al, 2004 3; n = 56 chronic stroke patients
• Excellent test retest reliability for MAL AOU (r = 0.70 to 0.85)
• Excellent test retest reliability for MAL QOM (r = 0.61 to 0.71)
(Uswatte G et al, 2006 1; n = 41 chronic stroke patients complete MALs before and after CI therapy or a placebo control; n = 27 in second study for chronic stroke patients who complete MALs and wore accelerometers that monitored their arm movements for 3 days outside the laboratory before and after an automated form of CI therapy)
• Excellent test retest reliability for MAL 14 QOM (r > 0.91)
• Participant AOU and caregiver QOM and AOU scales were not reliable
Interrater/ Intrarater Reliability Not Established
Internal Consistency Stroke:
(Van der Lee JH et al, 2004)3
• Excellent internal consistency for AOU (alpha = 0.88)
• Excellent internal consistency for AOU (alpha = 0.91)
• Limits of agreement for AOU and QOM (r = -0.70 to 0.85 and 0.61 to 0.71)
(Uswatte G et al, 2006)1
• Excellent internal consistency of the MAL 14 (alpha > 0.81)
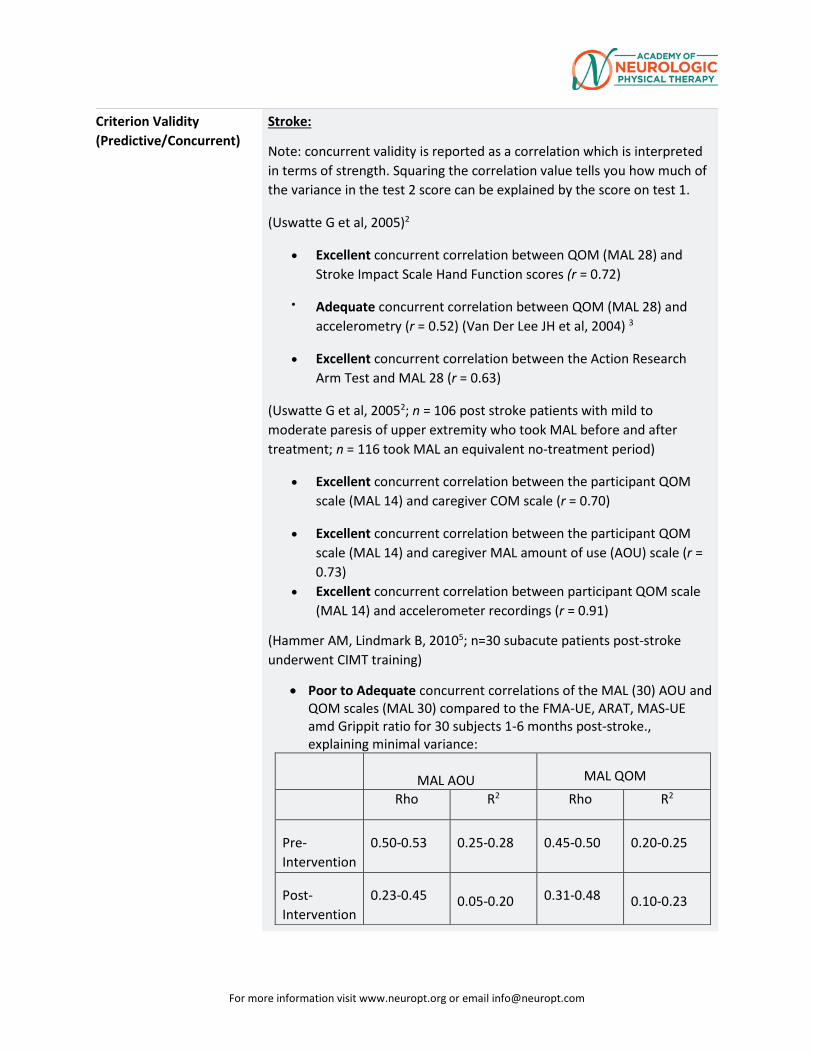
For more information visit www.neuropt.org or email [email protected]
Criterion Validity (Predictive/Concurrent)
Stroke:
Note: concurrent validity is reported as a correlation which is interpreted in terms of strength. Squaring the correlation value tells you how much of the variance in the test 2 score can be explained by the score on test 1.
(Uswatte G et al, 2005)2
• Excellent concurrent correlation between QOM (MAL 28) and Stroke Impact Scale Hand Function scores (r = 0.72)
• Adequate concurrent correlation between QOM (MAL 28) and accelerometry (r = 0.52) (Van Der Lee JH et al, 2004) 3
• Excellent concurrent correlation between the Action Research Arm Test and MAL 28 (r = 0.63)
(Uswatte G et al, 20052; n = 106 post stroke patients with mild to moderate paresis of upper extremity who took MAL before and after treatment; n = 116 took MAL an equivalent no-treatment period)
• Excellent concurrent correlation between the participant QOM scale (MAL 14) and caregiver COM scale (r = 0.70)
• Excellent concurrent correlation between the participant QOM scale (MAL 14) and caregiver MAL amount of use (AOU) scale (r = 0.73)
• Excellent concurrent correlation between participant QOM scale (MAL 14) and accelerometer recordings (r = 0.91)
(Hammer AM, Lindmark B, 20105; n=30 subacute patients post-stroke underwent CIMT training)
• Poor to Adequate concurrent correlations of the MAL (30) AOU and QOM scales (MAL 30) compared to the FMA-UE, ARAT, MAS-UE amd Grippit ratio for 30 subjects 1-6 months post-stroke., explaining minimal variance:
MAL AOU MAL QOM
Rho R2 Rho R2
Pre-Intervention
0.50-0.53 0.25-0.28 0.45-0.50 0.20-0.25
Post- Intervention
0.23-0.45 0.05-0.20 0.31-0.48
0.10-0.23
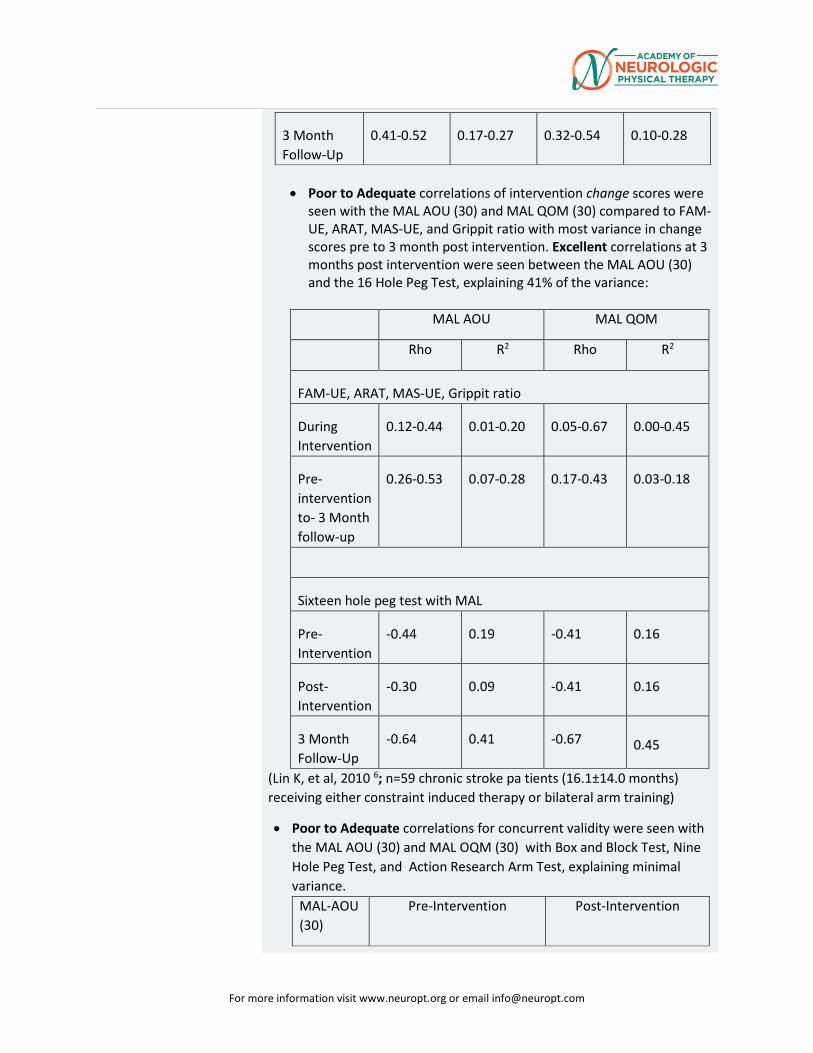
For more information visit www.neuropt.org or email [email protected]
3 Month Follow-Up
0.41-0.52 0.17-0.27 0.32-0.54 0.10-0.28
• Poor to Adequate correlations of intervention change scores were
seen with the MAL AOU (30) and MAL QOM (30) compared to FAM-UE, ARAT, MAS-UE, and Grippit ratio with most variance in change scores pre to 3 month post intervention. Excellent correlations at 3 months post intervention were seen between the MAL AOU (30) and the 16 Hole Peg Test, explaining 41% of the variance:
MAL AOU MAL QOM
Rho R2 Rho R2
FAM-UE, ARAT, MAS-UE, Grippit ratio
During Intervention
0.12-0.44 0.01-0.20 0.05-0.67 0.00-0.45
Pre-intervention to- 3 Month follow-up
0.26-0.53 0.07-0.28 0.17-0.43 0.03-0.18
Sixteen hole peg test with MAL
Pre- Intervention
-0.44 0.19 -0.41 0.16
Post- Intervention
-0.30 0.09 -0.41 0.16
3 Month Follow-Up
-0.64 0.41 -0.67 0.45
(Lin K, et al, 2010 6; n=59 chronic stroke pa tients (16.1±14.0 months) receiving either constraint induced therapy or bilateral arm training)
• Poor to Adequate correlations for concurrent validity were seen with the MAL AOU (30) and MAL OQM (30) with Box and Block Test, Nine Hole Peg Test, and Action Research Arm Test, explaining minimal variance.
MAL-AOU (30)
Pre-Intervention Post-Intervention
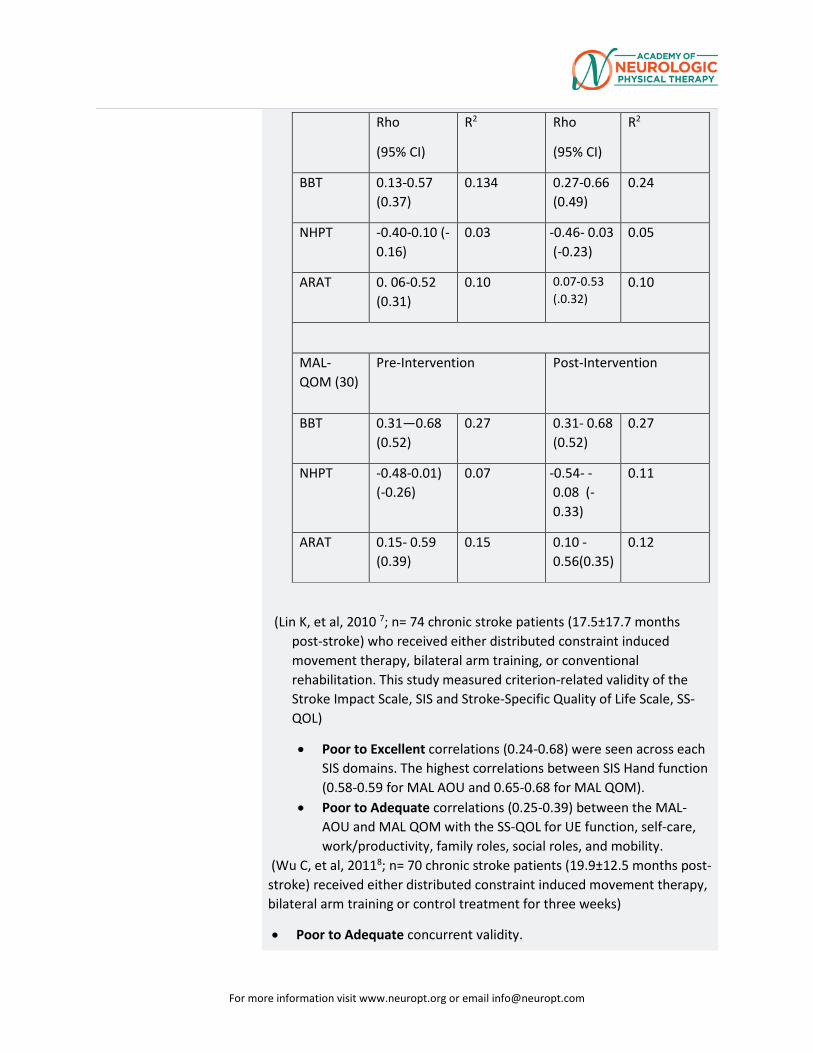
For more information visit www.neuropt.org or email [email protected]
Rho
(95% CI)
R2 Rho
(95% CI)
R2
BBT 0.13-0.57 (0.37)
0.134 0.27-0.66 (0.49)
0.24
NHPT -0.40-0.10 (-0.16)
0.03 -0.46- 0.03 (-0.23)
0.05
ARAT 0. 06-0.52 (0.31)
0.10 0.07-0.53 (.0.32)
0.10
MAL-QOM (30)
Pre-Intervention
Post-Intervention
BBT 0.31—0.68 (0.52)
0.27 0.31- 0.68 (0.52)
0.27
NHPT -0.48-0.01) (-0.26)
0.07 -0.54- -0.08 (-0.33)
0.11
ARAT 0.15- 0.59 (0.39)
0.15 0.10 -0.56(0.35)
0.12
(Lin K, et al, 2010 7; n= 74 chronic stroke patients (17.5±17.7 months post-stroke) who received either distributed constraint induced movement therapy, bilateral arm training, or conventional rehabilitation. This study measured criterion-related validity of the Stroke Impact Scale, SIS and Stroke-Specific Quality of Life Scale, SS-QOL)
• Poor to Excellent correlations (0.24-0.68) were seen across each SIS domains. The highest correlations between SIS Hand function (0.58-0.59 for MAL AOU and 0.65-0.68 for MAL QOM).
• Poor to Adequate correlations (0.25-0.39) between the MAL-AOU and MAL QOM with the SS-QOL for UE function, self-care, work/productivity, family roles, social roles, and mobility.
(Wu C, et al, 20118; n= 70 chronic stroke patients (19.9±12.5 months post-stroke) received either distributed constraint induced movement therapy, bilateral arm training or control treatment for three weeks)
• Poor to Adequate concurrent validity.
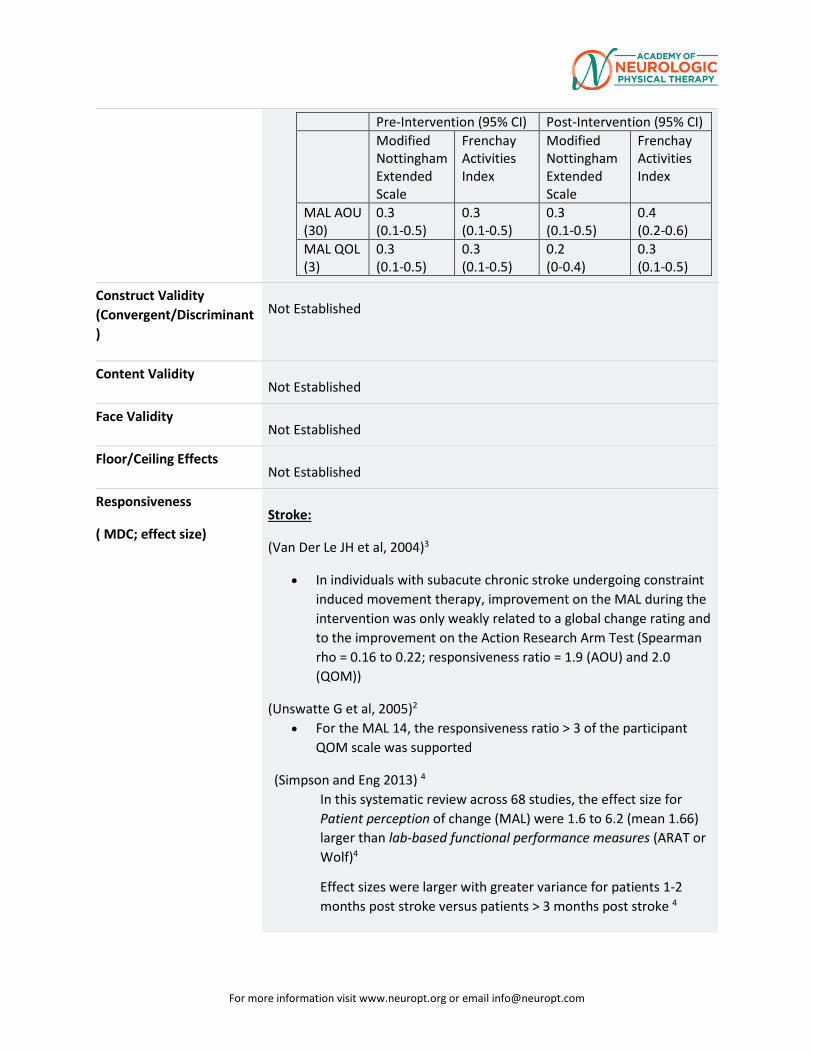
For more information visit www.neuropt.org or email [email protected]
Pre-Intervention (95% CI) Post-Intervention (95% CI) Modified
Nottingham Extended Scale
Frenchay Activities Index
Modified Nottingham Extended Scale
Frenchay Activities Index
MAL AOU (30)
0.3 (0.1-0.5)
0.3 (0.1-0.5)
0.3 (0.1-0.5)
0.4 (0.2-0.6)
MAL QOL (3)
0.3 (0.1-0.5)
0.3 (0.1-0.5)
0.2 (0-0.4)
0.3 (0.1-0.5)
Construct Validity (Convergent/Discriminant)
Not Established
Content Validity Not Established
Face Validity Not Established
Floor/Ceiling Effects Not Established
Responsiveness
( MDC; effect size) Stroke:
(Van Der Le JH et al, 2004)3
• In individuals with subacute chronic stroke undergoing constraint induced movement therapy, improvement on the MAL during the intervention was only weakly related to a global change rating and to the improvement on the Action Research Arm Test (Spearman rho = 0.16 to 0.22; responsiveness ratio = 1.9 (AOU) and 2.0 (QOM))
(Unswatte G et al, 2005)2 • For the MAL 14, the responsiveness ratio > 3 of the participant
QOM scale was supported
(Simpson and Eng 2013) 4 In this systematic review across 68 studies, the effect size for Patient perception of change (MAL) were 1.6 to 6.2 (mean 1.66) larger than lab-based functional performance measures (ARAT or Wolf)4
Effect sizes were larger with greater variance for patients 1-2 months post stroke versus patients > 3 months post stroke 4
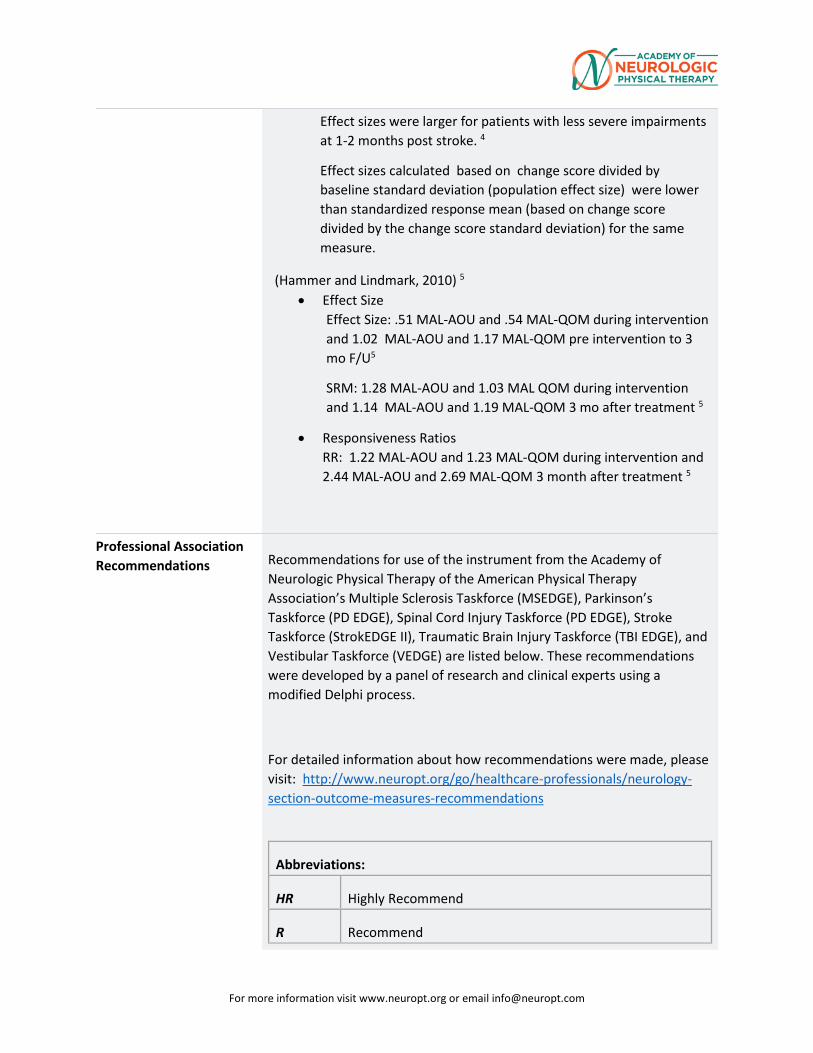
For more information visit www.neuropt.org or email [email protected]
Effect sizes were larger for patients with less severe impairments at 1-2 months post stroke. 4
Effect sizes calculated based on change score divided by baseline standard deviation (population effect size) were lower than standardized response mean (based on change score divided by the change score standard deviation) for the same measure.
(Hammer and Lindmark, 2010) 5 • Effect Size
Effect Size: .51 MAL-AOU and .54 MAL-QOM during intervention and 1.02 MAL-AOU and 1.17 MAL-QOM pre intervention to 3 mo F/U5
SRM: 1.28 MAL-AOU and 1.03 MAL QOM during intervention and 1.14 MAL-AOU and 1.19 MAL-QOM 3 mo after treatment 5
• Responsiveness Ratios RR: 1.22 MAL-AOU and 1.23 MAL-QOM during intervention and 2.44 MAL-AOU and 2.69 MAL-QOM 3 month after treatment 5
Professional Association Recommendations Recommendations for use of the instrument from the Academy of
Neurologic Physical Therapy of the American Physical Therapy Association’s Multiple Sclerosis Taskforce (MSEDGE), Parkinson’s Taskforce (PD EDGE), Spinal Cord Injury Taskforce (PD EDGE), Stroke Taskforce (StrokEDGE II), Traumatic Brain Injury Taskforce (TBI EDGE), and Vestibular Taskforce (VEDGE) are listed below. These recommendations were developed by a panel of research and clinical experts using a modified Delphi process.
For detailed information about how recommendations were made, please visit: http://www.neuropt.org/go/healthcare-professionals/neurology-section-outcome-measures-recommendations
Abbreviations:
HR Highly Recommend
R Recommend
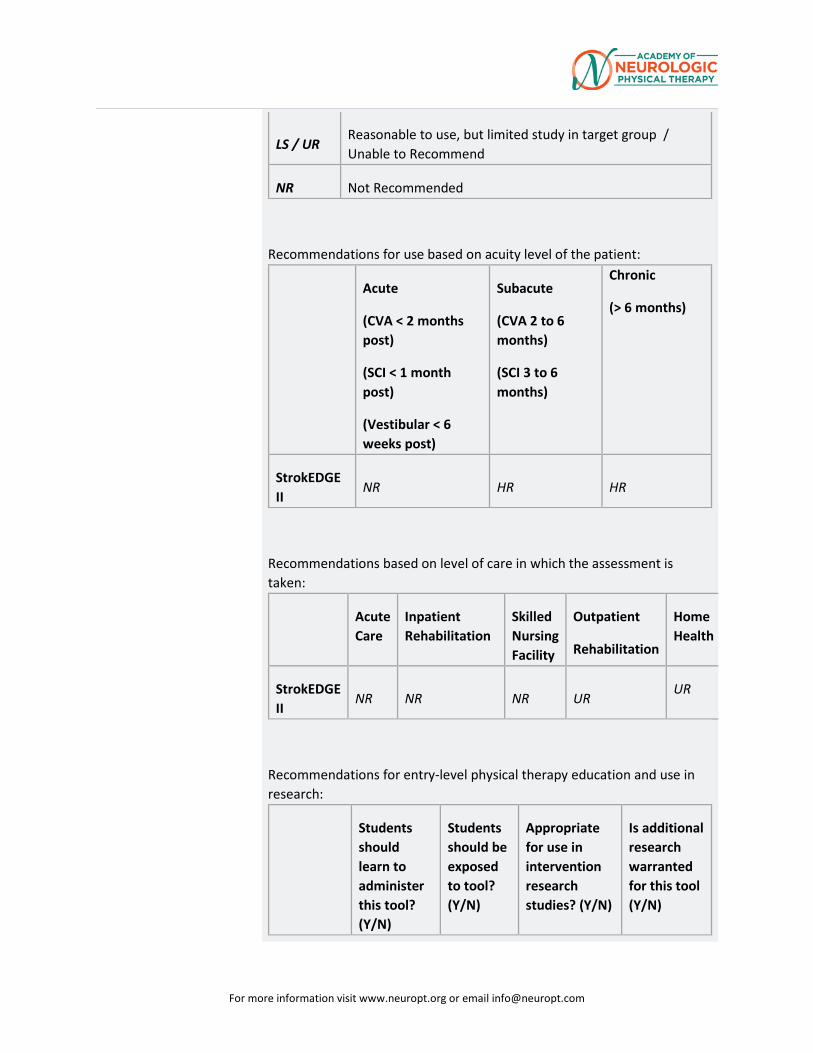
For more information visit www.neuropt.org or email [email protected]
LS / UR Reasonable to use, but limited study in target group / Unable to Recommend
NR Not Recommended
Recommendations for use based on acuity level of the patient:
Acute
(CVA < 2 months post)
(SCI < 1 month post)
(Vestibular < 6 weeks post)
Subacute
(CVA 2 to 6 months)
(SCI 3 to 6 months)
Chronic
(> 6 months)
StrokEDGE II
NR HR HR
Recommendations based on level of care in which the assessment is taken:
Acute Care
Inpatient Rehabilitation
Skilled Nursing Facility
Outpatient
Rehabilitation
Home Health
StrokEDGE II
NR NR NR UR UR
Recommendations for entry-level physical therapy education and use in research:
Students should learn to administer this tool? (Y/N)
Students should be exposed to tool? (Y/N)
Appropriate for use in intervention research studies? (Y/N)
Is additional research warranted for this tool (Y/N)
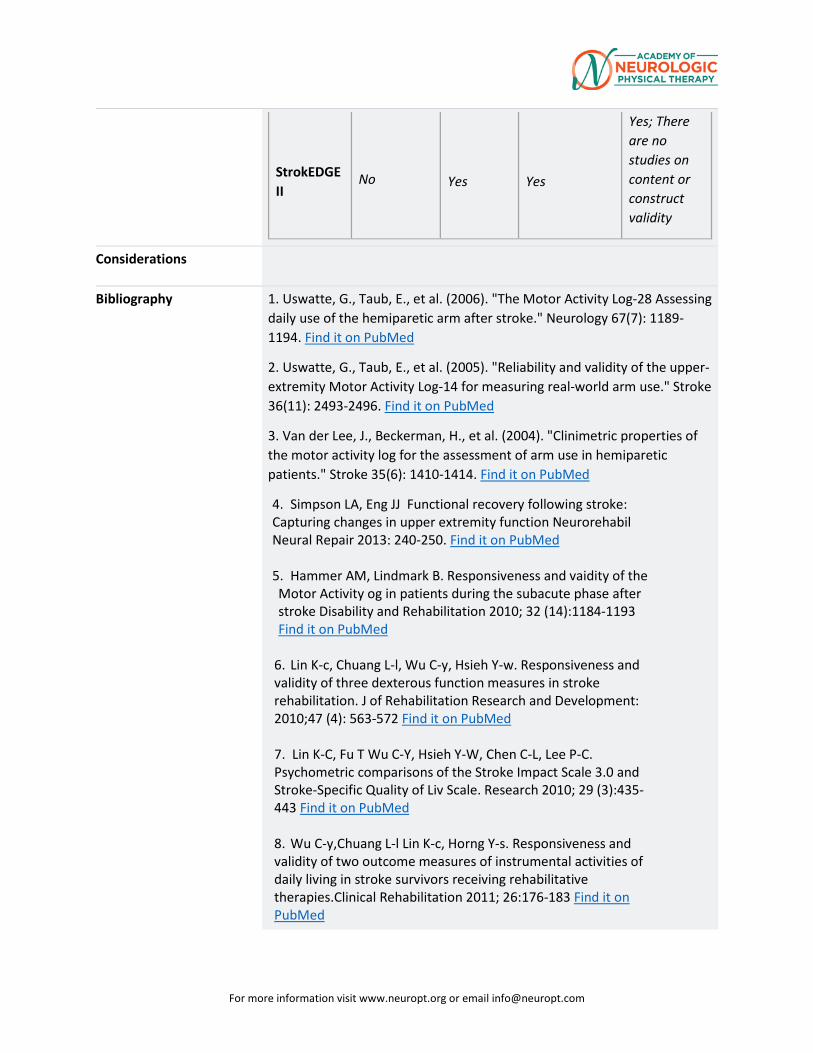
For more information visit www.neuropt.org or email [email protected]
StrokEDGE II
No Yes Yes
Yes; There are no studies on content or construct validity
Considerations
Bibliography 1. Uswatte, G., Taub, E., et al. (2006). "The Motor Activity Log-28 Assessing daily use of the hemiparetic arm after stroke." Neurology 67(7): 1189-1194. Find it on PubMed
2. Uswatte, G., Taub, E., et al. (2005). "Reliability and validity of the upper-extremity Motor Activity Log-14 for measuring real-world arm use." Stroke 36(11): 2493-2496. Find it on PubMed
3. Van der Lee, J., Beckerman, H., et al. (2004). "Clinimetric properties of the motor activity log for the assessment of arm use in hemiparetic patients." Stroke 35(6): 1410-1414. Find it on PubMed
4. Simpson LA, Eng JJ Functional recovery following stroke: Capturing changes in upper extremity function Neurorehabil Neural Repair 2013: 240-250. Find it on PubMed 5. Hammer AM, Lindmark B. Responsiveness and vaidity of the Motor Activity og in patients during the subacute phase after stroke Disability and Rehabilitation 2010; 32 (14):1184-1193 Find it on PubMed
6. Lin K-c, Chuang L-l, Wu C-y, Hsieh Y-w. Responsiveness and validity of three dexterous function measures in stroke rehabilitation. J of Rehabilitation Research and Development: 2010;47 (4): 563-572 Find it on PubMed 7. Lin K-C, Fu T Wu C-Y, Hsieh Y-W, Chen C-L, Lee P-C. Psychometric comparisons of the Stroke Impact Scale 3.0 and Stroke-Specific Quality of Liv Scale. Research 2010; 29 (3):435-443 Find it on PubMed 8. Wu C-y,Chuang L-l Lin K-c, Horng Y-s. Responsiveness and validity of two outcome measures of instrumental activities of daily living in stroke survivors receiving rehabilitative therapies.Clinical Rehabilitation 2011; 26:176-183 Find it on PubMed

For more information visit www.neuropt.org or email [email protected]
Year published 2013
Instrument in PDF Format Yes
Approval Status Approved
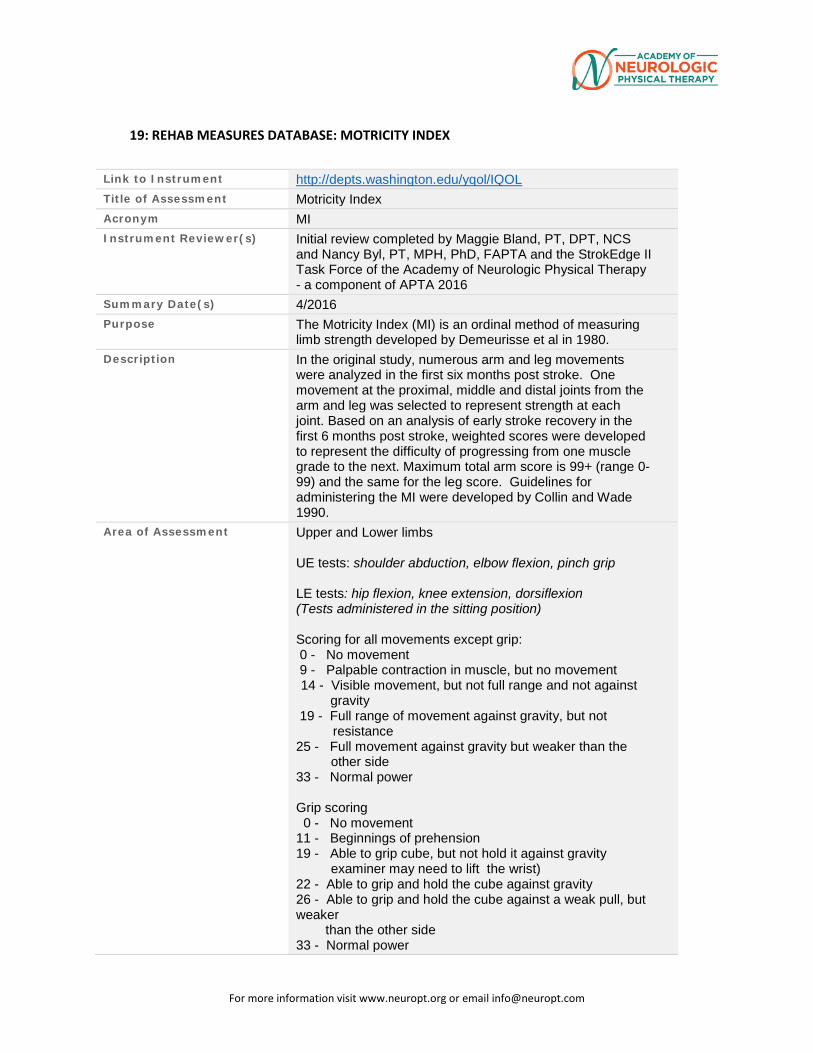
For more information visit www.neuropt.org or email [email protected]
Link to Instrument http://depts.washington.edu/yqol/IQOL Title of Assessment Motricity Index Acronym MI Instrument Reviewer(s) Initial review completed by Maggie Bland, PT, DPT, NCS
and Nancy Byl, PT, MPH, PhD, FAPTA and the StrokEdge II Task Force of the Academy of Neurologic Physical Therapy - a component of APTA 2016
Summary Date(s) 4/2016 Purpose The Motricity Index (MI) is an ordinal method of measuring
limb strength developed by Demeurisse et al in 1980. Description In the original study, numerous arm and leg movements
were analyzed in the first six months post stroke. One movement at the proximal, middle and distal joints from the arm and leg was selected to represent strength at each joint. Based on an analysis of early stroke recovery in the first 6 months post stroke, weighted scores were developed to represent the difficulty of progressing from one muscle grade to the next. Maximum total arm score is 99+ (range 0-99) and the same for the leg score. Guidelines for administering the MI were developed by Collin and Wade 1990.
Area of Assessment Upper and Lower limbs UE tests: shoulder abduction, elbow flexion, pinch grip LE tests: hip flexion, knee extension, dorsiflexion (Tests administered in the sitting position) Scoring for all movements except grip: 0 - No movement 9 - Palpable contraction in muscle, but no movement 14 - Visible movement, but not full range and not against gravity
19 - Full range of movement against gravity, but not resistance 25 - Full movement against gravity but weaker than the
other side 33 - Normal power Grip scoring 0 - No movement 11 - Beginnings of prehension 19 - Able to grip cube, but not hold it against gravity
examiner may need to lift the wrist) 22 - Able to grip and hold the cube against gravity 26 - Able to grip and hold the cube against a weak pull, but weaker than the other side 33 - Normal power
19: REHAB MEASURES DATABASE: MOTRICITY INDEX
For more information visit www.neuropt.org or email [email protected]
Body Part Shoulder, elbow and wrist in the arm and hip, knee and ankle of the leg.
ICF Domain Body function and structure
Domain Strength as measured on a weighted, ordinal scale.
Assessment Type Examiner assessment (including observation and palpation following instructions to move the limb in the desired directions)
Length of Test 20 minutes or less
Time to Administer 5 minutes for experienced examiners working with patients who are cognitively intact
Number of Items 6 items on each side (3 for the arm; 3 for the leg)
Equipment Required 2.5 cm x 2.5 cm cube
Training Required No
Type of Training Required
None; fast and easy to learn
Cost None
Actual Cost None
Age Range 20-80 years
Administration Mode Patient asked to voluntarily perform a movement task
Diagnosis Acute, subacute and chronic stroke (Moderate and Severe)
Populations Tested Adults post stroke (inpatients and outpatients)
Standard Error of Measurements (SEM)
n/a
Minimal Detectable Change (MCD)
n/a
Minimally Clinically Important Difference MCID)
n/a
Cut-Off Scores n/a Normative Data Test-Retest Reliability n/a unknown Interrater/Intrarater Reliability
(Collin and Wade; 1990) 40 subjects sub acute post stroke measured at 6, 12 and 18 weeks with two raters.
• Eexcellent inter-rater reliability (r=0.88)
For more information visit www.neuropt.org or email [email protected]
MI arm 0.88 MI leg 0.87 MI Total 0.88
(Fayazi, et al, 2012) Twenty participants, average of 55.58 (± 13.45) years old and an average of 19.41 (± 17.37) months post-stroke were administered the MI for the lower extremity on two occasions, one week apart.
• Iintra-rater reliability was excellent (ICC = 0.93, 95% CI = 0.84-0.97, p = 0.000)
Internal Consistency (Cameron and Bohannon, 2000) Fifteen patients with stroke • Eexcellent ; Cronbach alpha=0.77
Criterion Validity (Predictive/Concurrent)
Criterion Validity Collin and Wade, 1990
• Eexcellent predictive correlation of MI score at 6 weeks and walking ability at 18 weeks
• Eexcellent criterion validity with correlation between dynamometer measurements and the arm and the leg MI scores (r=0.78 and 0.91 respectively
Congruent Validity (Arwert HJ et al, 2016) The purpose of the study was to establish the validity of the Michigan Hand Outcomes Questionnaire in 51 patients up to 5 years post stroke (average 8 months post stroke) who had participated in stroke rehabilitation.
• A significant, excellent correlation was documented between the MHQ and the Arm MI for all patients (0.78)
• A significant moderate correlation was documented between the MHQ and the Arm MI for patients with less than 100 on the Arm MI ( 0.65)
• Tthe Arm MI had moderate to excellent correlations with the functional sub scales of the MHQ
Subscales of the MHQ MI correlation Overall Hand Function 0.797 ADL 0.669 Pain 0.431 Work Performance 0.590 Aesthetics 0.674 Satisfaction 0.715 MHQ total 0.780
Concurrent Validity (Sunderland et al l989) Patients acute post stroke. When comparing the 9 Hole Peg Test, Motor Club Impairment, Frenchay Arm Test and Mtricity Index Arm Score:
For more information visit www.neuropt.org or email [email protected]
• Tthe Motricity Index Arm test was the most sensitive measure in detecting early change
(Bohannon et al, 1999)
• Tthere was an excellent correlation between dynamometry measurements of the upper extremity and the Motricity Index Arm Score (r=0.89;p<0.00l)
(Cameron and Bohannon , 2000)
• Tthere was an excellent correlation between dynamometry measurements and the Leg Motricity Index (r=-.77; p<0.001)
(Collin and Wade, l980)
• Tthere was a good correlation between the Rivermead Motor Assessment and the Motricity Index
Time RMA/MI-arm
RMA/MI-leg
6 wks 0.76* 0.81* 12 wks 0.73* 0.81* 18 wks 0.74** 0.75**
* p<0.001; ** p<0.010 (Lu et al, 2015) Establish concurrent validity of the Wisconsin Gait Scale (WGS) and Gait Abnormality Rating Scale (GARS) for Chinese subjects with hemiplegia post first stroke (n=22; mean age 54.8 [8.5 years]) who could walk independently.
• Mmean lower extremity MI score was 70.4 (21.5) • Aadequate correlation of the WGS with the MI ( -
0.687;p<0.01) • Eexcellent correlation of the GARS with the MI ( -
0.742;p<0.01) (Meyer et al , 2015) 122 subjects (77 males), within 6 months post stroke (mean of 82 days) averaging 67 years of age, with 82% in acute rehabilitation centers were evaluated for the presence of sensory and motor deficits .
• Uupper limb somatosensory impairments were common, with prevalence rates 21%- 54%
• Ppoor to adequate correlations were found between somatosensory and motor deficits (r=0.22-0.61)
• Vvisual spatial neglect was present in 27 patients (22%)
• Tthere were consistently stronger correlations between motor and somatosensory deficits in patients with visuospatial neglect ( r=0.44-0.78) compared to patients without neglect (r=0.08-0.59)
• Tthe MI median (interquartile range) was 67.5 for patients overall and 23 (0-83) for those with Neglect and 76 for patients without neglect (p<0.016)
For more information visit www.neuropt.org or email [email protected]
• Tthe correlations of somatosensory deficits and MI scores for the UE were adequate (ranging from -0.564 to 0.348) Somatosensation Association with
MI Exteroceptive Em-NSA light touch Em-NSA pressure Em NSA pinprick PTT light touch Proprioceptive Em-NSA movement sense TFT position sense Higher Cortical Em-NSA sharp/dull NSA stereognosis Two point discrimination
0.318 0.337 0.348 -0.564 0.394 -0.354 0.220 0.535 -0.316
Em-NSA (Erasmus MC modification of the revised Nottingham Sensory Assessment, TFT (Thumb finding test) * Statistically significant adequate correlations
(Bertrand et al, 2015; n = 34) Participants were recruited from an acute neurology ward after their first stroke, and were administered the MI Arm, Chedoke Arm and Hand Activity Inventory (CAHAI), and the ABILHAND questionnaire.
• Eexcellent correlations were found between the MI Arm and the CAHAI at weeks 2, 4, 8, and 12 (0.87-0.94) and between the MI Arm at weeks 1, 2, 4, 8, and 12 and the ABILHAND at week 12 (0.69-0.82)
Predictive Validity (Sunderland et al, 1989) Patients acute post stroke were measured at admission, 1,3,and 6 months post stroke with multiple measures of hand structure and function ( grip strength, the 9-Hole Peg Test, MI arm ,Motor Club Impairment and Frenchay Arm Test)
• Tthe Motricity Index for the arm was able to best predict outcomes
(Collin and Wade, 1980)
• Aat 6 weeks post stroke, lower scores on the MI-Leg combined with the Trunk Control Test predicted failure to walk by 18 weeks.
(Kong K-H et al, 2011) Motor outcomes measures ( Motor Assessment Scale (MAS), Upper Extremity Motricity Index (UEMI), Lower Extremity Motricity Index (LEMI) and the Modified Barthel Index (MBI) were administered to 140
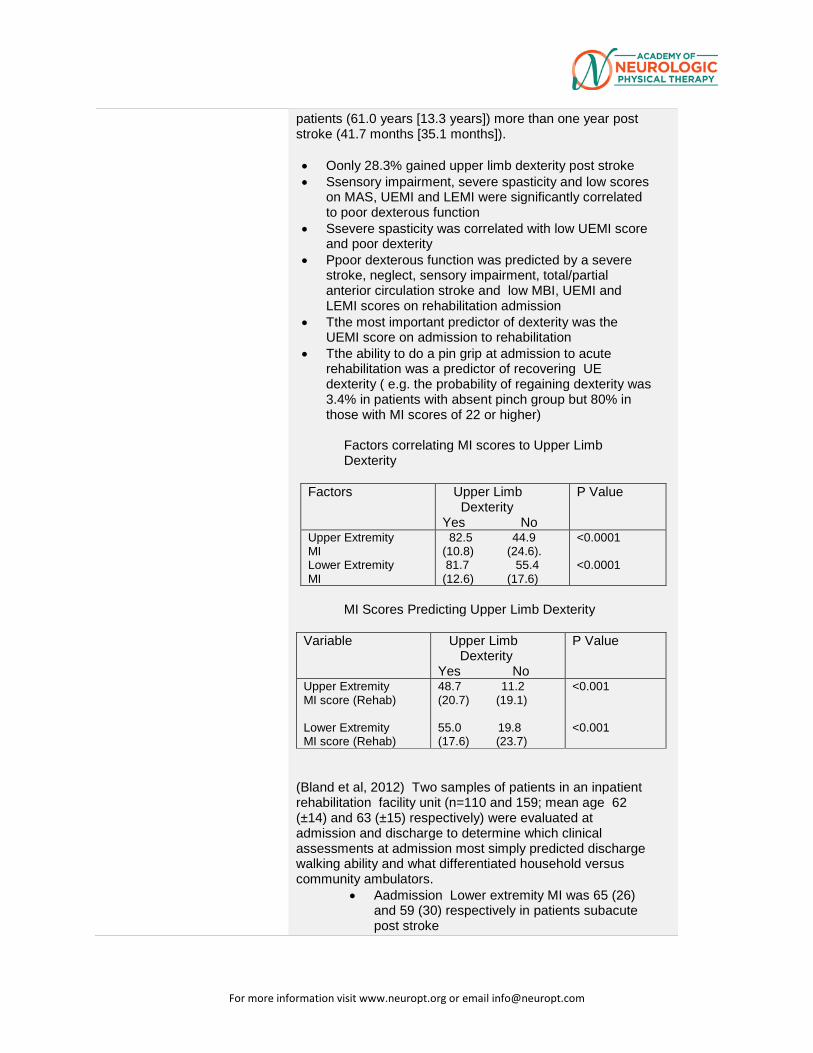
For more information visit www.neuropt.org or email [email protected]
patients (61.0 years [13.3 years]) more than one year post stroke (41.7 months [35.1 months]). • Oonly 28.3% gained upper limb dexterity post stroke • Ssensory impairment, severe spasticity and low scores
on MAS, UEMI and LEMI were significantly correlated to poor dexterous function
• Ssevere spasticity was correlated with low UEMI score and poor dexterity
• Ppoor dexterous function was predicted by a severe stroke, neglect, sensory impairment, total/partial anterior circulation stroke and low MBI, UEMI and LEMI scores on rehabilitation admission
• Tthe most important predictor of dexterity was the UEMI score on admission to rehabilitation
• Tthe ability to do a pin grip at admission to acute rehabilitation was a predictor of recovering UE dexterity ( e.g. the probability of regaining dexterity was 3.4% in patients with absent pinch group but 80% in those with MI scores of 22 or higher)
Factors correlating MI scores to Upper Limb Dexterity
Factors Upper Limb Dexterity Yes No
P Value
Upper Extremity MI Lower Extremity MI
82.5 44.9 (10.8) (24.6). 81.7 55.4 (12.6) (17.6)
<0.0001 <0.0001
MI Scores Predicting Upper Limb Dexterity
Variable Upper Limb Dexterity Yes No
P Value
Upper Extremity MI score (Rehab) Lower Extremity MI score (Rehab)
48.7 11.2 (20.7) (19.1) 55.0 19.8 (17.6) (23.7)
<0.001 <0.001
(Bland et al, 2012) Two samples of patients in an inpatient rehabilitation facility unit (n=110 and 159; mean age 62 (±14) and 63 (±15) respectively) were evaluated at admission and discharge to determine which clinical assessments at admission most simply predicted discharge walking ability and what differentiated household versus community ambulators.
• Aadmission Lower extremity MI was 65 (26) and 59 (30) respectively in patients subacute post stroke
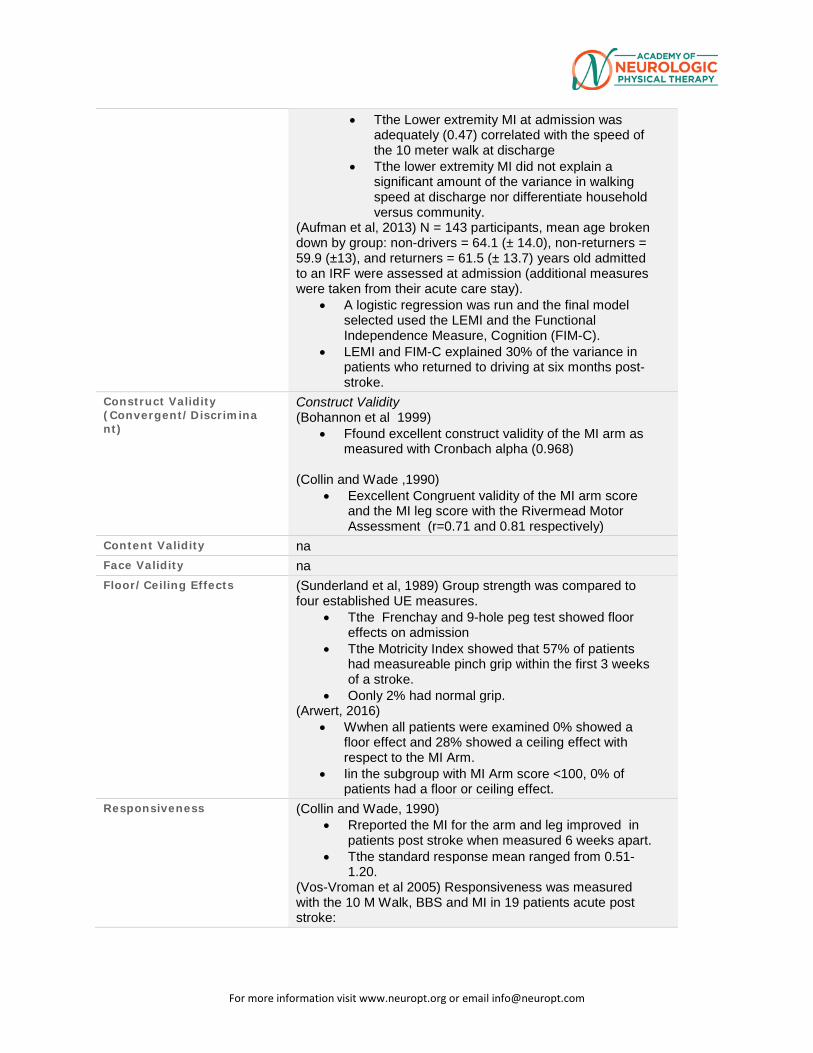
For more information visit www.neuropt.org or email [email protected]
• Tthe Lower extremity MI at admission was adequately (0.47) correlated with the speed of the 10 meter walk at discharge
• Tthe lower extremity MI did not explain a significant amount of the variance in walking speed at discharge nor differentiate household versus community.
(Aufman et al, 2013) N = 143 participants, mean age broken down by group: non-drivers = 64.1 (± 14.0), non-returners = 59.9 (±13), and returners = 61.5 (± 13.7) years old admitted to an IRF were assessed at admission (additional measures were taken from their acute care stay).
• A logistic regression was run and the final model selected used the LEMI and the Functional Independence Measure, Cognition (FIM-C).
• LEMI and FIM-C explained 30% of the variance in patients who returned to driving at six months post-stroke.
Construct Validity (Convergent/Discriminant)
Construct Validity (Bohannon et al 1999)
• Ffound excellent construct validity of the MI arm as measured with Cronbach alpha (0.968)
(Collin and Wade ,1990)
• Eexcellent Congruent validity of the MI arm score and the MI leg score with the Rivermead Motor Assessment (r=0.71 and 0.81 respectively)
Content Validity na Face Validity na Floor/Ceiling Effects (Sunderland et al, 1989) Group strength was compared to
four established UE measures. • Tthe Frenchay and 9-hole peg test showed floor
effects on admission • Tthe Motricity Index showed that 57% of patients
had measureable pinch grip within the first 3 weeks of a stroke.
• Oonly 2% had normal grip. (Arwert, 2016)
• Wwhen all patients were examined 0% showed a floor effect and 28% showed a ceiling effect with respect to the MI Arm.
• Iin the subgroup with MI Arm score <100, 0% of patients had a floor or ceiling effect.
Responsiveness (Collin and Wade, 1990) • Rreported the MI for the arm and leg improved in
patients post stroke when measured 6 weeks apart. • Tthe standard response mean ranged from 0.51-
1.20. (Vos-Vroman et al 2005) Responsiveness was measured with the 10 M Walk, BBS and MI in 19 patients acute post stroke:
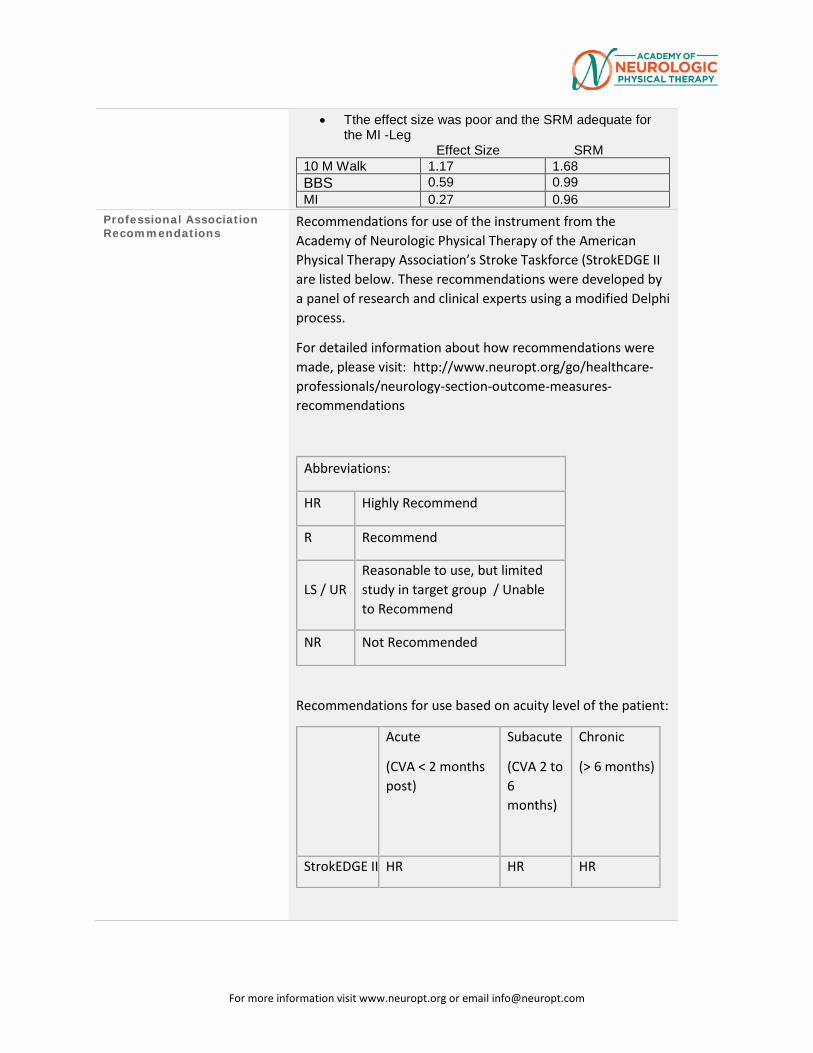
For more information visit www.neuropt.org or email [email protected]
• Tthe effect size was poor and the SRM adequate for the MI -Leg
Effect Size SRM 10 M Walk 1.17 1.68 BBS 0.59 0.99 MI 0.27 0.96
Professional Association Recommendations
Recommendations for use of the instrument from the Academy of Neurologic Physical Therapy of the American Physical Therapy Association’s Stroke Taskforce (StrokEDGE II are listed below. These recommendations were developed by a panel of research and clinical experts using a modified Delphi process.
For detailed information about how recommendations were made, please visit: http://www.neuropt.org/go/healthcare-professionals/neurology-section-outcome-measures-recommendations
Abbreviations:
HR Highly Recommend
R Recommend
LS / UR Reasonable to use, but limited study in target group / Unable to Recommend
NR Not Recommended
Recommendations for use based on acuity level of the patient:
Acute
(CVA < 2 months post)
Subacute
(CVA 2 to 6 months)
Chronic
(> 6 months)
StrokEDGE II HR HR HR
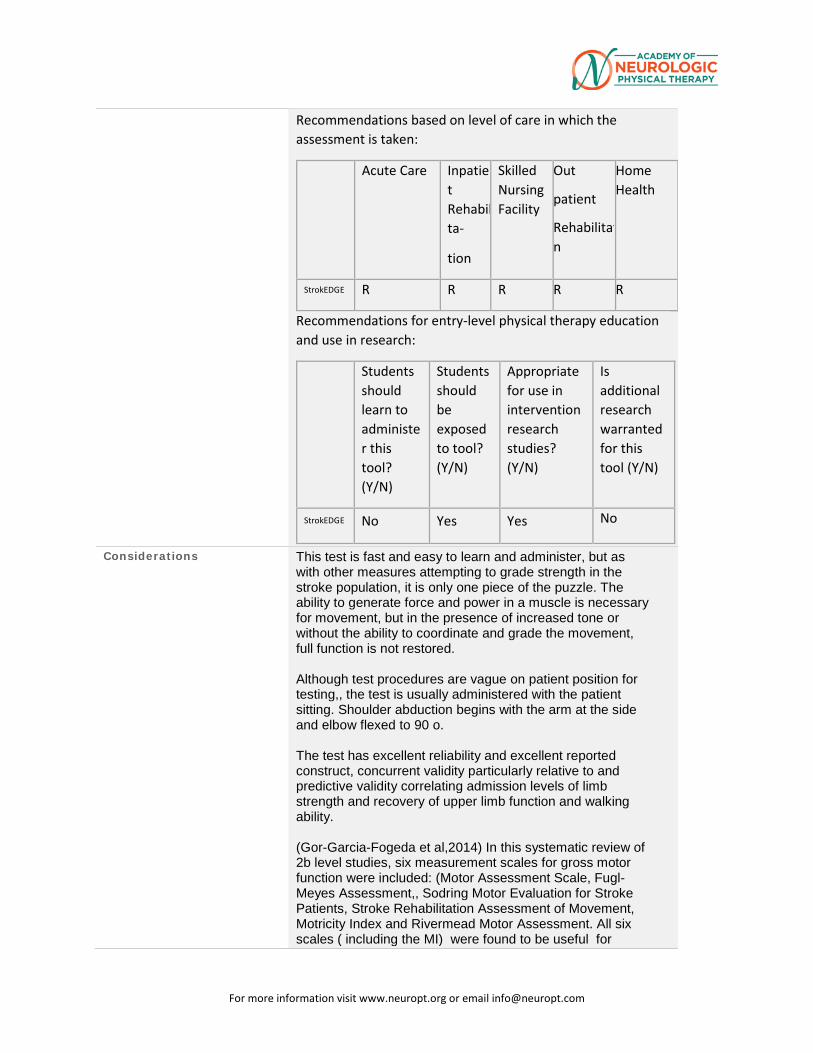
For more information visit www.neuropt.org or email [email protected]
Recommendations based on level of care in which the assessment is taken:
Acute Care Inpatient Rehabilta-
tion
Skilled Nursing Facility
Out
patient
Rehabilitatn
Home Health
StrokEDGE R R R R R
Recommendations for entry-level physical therapy education and use in research:
Students should learn to administer this tool? (Y/N)
Students should be exposed to tool? (Y/N)
Appropriate for use in intervention research studies? (Y/N)
Is additional research warranted for this tool (Y/N)
StrokEDGE No Yes Yes No
Considerations This test is fast and easy to learn and administer, but as with other measures attempting to grade strength in the stroke population, it is only one piece of the puzzle. The ability to generate force and power in a muscle is necessary for movement, but in the presence of increased tone or without the ability to coordinate and grade the movement, full function is not restored. Although test procedures are vague on patient position for testing,, the test is usually administered with the patient sitting. Shoulder abduction begins with the arm at the side and elbow flexed to 90 o. The test has excellent reliability and excellent reported construct, concurrent validity particularly relative to and predictive validity correlating admission levels of limb strength and recovery of upper limb function and walking ability. (Gor-Garcia-Fogeda et al,2014) In this systematic review of 2b level studies, six measurement scales for gross motor function were included: (Motor Assessment Scale, Fugl-Meyes Assessment,, Sodring Motor Evaluation for Stroke Patients, Stroke Rehabilitation Assessment of Movement, Motricity Index and Rivermead Motor Assessment. All six scales ( including the MI) were found to be useful for
For more information visit www.neuropt.org or email [email protected]
clinical research and clinical practice, but the scales for which the most psychometric properties have been established in clinical trials were the Fugl Meyer Assessment (FMA) and the Stroke Rehabilitation Assessment of Movement (STREAM) (Geroin et al, 2013) performed a systematic review of outcome measures used following motor training using electromechanical and robotic devices in patients post stroke. A total of 45 scales were identified from 27 studies involving 966 subjects. The most commonly used outcome measures were: Functional Ambulation Category (18 studies) , 10- Meter Walking Test (13 studies), Motricity Index (12 studies), 6- Minute Walking Test (11 studies), Rivermead Mobility Index (8 studies) and the Berg Balance Scale (8 studies). All of the outcome measures belonged to the activity domain of the ICF except the MI which was classified as a measurement of body function and structure. No scales belonged to the participation category. For the MI, Inter-rater reliability and Construct validity were excellent.
Bibliography Arwert HJ, Keizer S, Kromme CH, Vliet Vlieland TP, Meesters JJ. (2016) Validity of the Michigan Hand Outcomes Questionnaire in Patients With Stroke. Archives of physical medicine and rehabilitation. 97(2):238-44. Aufman, EL, Bland, MD, Barco, PP, Carr, DB, Lang CE. (2013) Predictors of return to driving after stroke. Am J Phys Med Rehabil 92(3): 1-8. Bertrand AM, Fournier K, Wick Brasey MG, Kaiser ML, Frischknecht R, Diserens K. (2015) Reliability of maximal grip strength measurements and grip strength recovery following a stroke. JHT 28(4):356-62 Bland MD, Sturmoski A, Whitson M, Connor LT, Fucetola R, Huskey T, et al. (2012) Prediction of discharge walking ability from initial assessment in a stroke inpatient rehabilitation facility population. Archives of physical medicine and rehabilitation. 93(8):1441-7. Bohannon R (1999) Motricity index scores are valid indicators of paretic upper extremity strength following stroke. J Phys Ther Sci. 11:59-61 Cameron D, Bohannon R. (2000) Criterion validity of lower extremity Motricity Index scores. Clin Rehabil. 14:208
For more information visit www.neuropt.org or email [email protected]
Collin C, Wade D. (1990) Assessing motor impairment after stroke: a pilot reliability study. J Neurol Neurosurg, Paych 53:576-579 Demeurisse G, Dermol O, Robaye E (1980) Motor evaluation in vascular hemiplegia. European Neurology. 19(6): 381-389 Fayazi M, Dehkordi SN, Dadgoo M, Salehi M. Test-retest reliability of Motricity Index strength assessments for lower extremity in post stroke hemiparesis. (2012) Medical journal of the Islamic Republic of Iran. 26(1):27-30. Geroin C, Mazzoleni S, Smania N, Gandolfi M, Bonaiuti D, Gasperini G, et al. (2013) Systematic review of outcome measures of walking training using electromechanical and robotic devices in patients with stroke. Journal of rehabilitation medicine. 45(10):987-96. Gor-Garcia-Fogeda MD, Molina-Rueda F, Cuesta-Gomez A, Carratala-Tejada M, Alguacil-Diego IM, Miangolarra-Page JC. (2014) Scales to assess gross motor function in stroke patients: a systematic review.Arch of Phys Med & Rehab. 95(6):1174-83. Kong KH, Chua KS, Lee J. (2011) Recovery of upper limb dexterity in patients more than 1 year after stroke: Frequency, clinical correlates and predictors. NeuroRehabilitation. 28(2):105-11. Lu X, Hu N, Deng S, Li J, Qi S, Bi S. (2015) The reliability, validity and correlation of two observational gait scales assessed by video tape for Chinese subjects with hemiplegia. Journal of physical therapy science. 27(12):3717-21. Meyer S, De Bruyn N, Lafosse C, Van Dijk M, Michielsen M, Thijs L, et al. (2015) Somatosensory Impairments in the Upper Limb Poststroke: Distribution and Association With Motor Function and Visuospatial Neglect. Neurorehabilitation and neural repair. 1-12 Sunderland A, Trinson D, Bradley L, Hewer R (1989) Arm function after stroke: an evaluation of grip strength as a measure of recovery and a prognostic indicator. J of Neurol, Neurosurg &Psych. 52: 1267-1272 Vos-Vromans et al (2005) Responsiveness of the ten meter walking test and other measures in patients with hemiparesis in the acute phase. Phys Ther Prac. 21:173 (abstract only)
For more information visit www.neuropt.org or email [email protected]
Year Published 1980 Instrument in PDF Format
No
Approval Status
For more information visit www.neuropt.org or email [email protected]
20. REHAB MEASURES DATABASE: NIH STROKE SCALE
Link to instrument Measure available at Strokecenter.org (external link)
Title of Assessment National Institutes of Health Stroke Scale
Acronym NIHSS
Instrument Reviewer(s) Updated by Carmen Capo-Lugo, PT, PhD and Dorian Rose PT, PhD and the Stroke Edge II task force in 2016.
Summary Date 3/9/16
Purpose • Measures the severity of symptoms associated with cerebral infarcts; used as a quantitative measure of neurological deficit post stroke.
• A retrospective scoring algorithm has been found to be reliable for research purposes (Williams et al, 2000).
Description • A composite scale derived from the Toronto Stroke Scale, the Oxbury Initial Severity Scale, the Cincinnati Stroke Scale and the Edinburgh-2 Coma Scale
• 15 items assessing severity of impairment in LOC, ability to respond to questions and obey simple commands, papillary response, deviation of gaze, extent of hemianopsia, facial palsy, resistance to gravity in the weaker limb, plantar reflexes, limb ataxia, sensory loss, visual neglect, dysarthria and aphasia severity
• Items are graded on a 3 or 4 point ordinal scale; 0 equates no impairment
• Scores range from 0 – 42. Higher scores indicate greater severity.
• Stroke severity may be stratified on the basis of NIHSS scores as follows (Brott et al, 1989):
o Very Severe: >25
o Severe: 15 – 24
For more information visit www.neuropt.org or email [email protected]
o Mild to Moderately Severe: 5 – 14
o Mild: 1 – 5
Area of Assessment Aphasia; Behavior; Cognition; Dysarthria; Vision & Perception
Body Part Not Applicable
ICF Domain Body Function
Domain Cognition; Motor
Assessment Type Observer
Length of Test 05 Minutes or Less
Time to Administer 6 minutes
Number of Items 15
Equipment Required None
Training Required Yes: Training and Certification DVD available through the American Academy of Neurology, the American Heart Association and the National Stroke Association.
Type of training required Training Course
Cost Free
Actual Cost None
Age Range Adult: 18-64 years
Administration Mode Paper/Pencil
Diagnosis Stroke
Populations Tested Stroke
For more information visit www.neuropt.org or email [email protected]
Standard Error of Measurement (SEM)
Not Established
Minimal Detectable Change (MDC) Not Established
Minimally Clinically Important Difference (MCID)
Not Established
Cut-Off Scores Stroke severity may be stratified on the basis of NIHSS scores as follows (Brott et al, 1989):
o Very Severe: >25
o Severe: 15 – 24
o Mild to Moderately Severe: 5 – 14
o Mild: 1 – 5
Acute Stroke: (Schlegel et al, 2003; Rundek et al, 2000)
Outcomes related to NIHSS scores at admission:
• Scores of <5; 80% of stroke survivors will be discharged to home
• Score between 6 and 13 typically require acute inpatient rehabilitation
• Scores of >14 frequently require long-term skilled care
Normative Data Acute Stroke: (Williams et al, 1999; n = 34, first stroke, patients assessed 1 and 3 months (+/- 1 week) after stroke)
Health-Related Quality of Life (NIHSS mean scores)
1 Month 3 Months
A Lot Worse
A Little Worse
Same A Lot Worse
A Little Worse
Same
NIHSS 3.4 3.2 1.5 2.4 1.1 1.1
For more information visit www.neuropt.org or email [email protected]
Test-retest Reliability Acute Stroke: (Goldstein & Samsa, 1997; 4 patients assessed by 30 physicians and 29 study coordinators; 3 months between assessments)
• Excellent test-retest reliability; ICC = 0.93
Interrater/Intrarater Reliability Acute Stroke: (Goldstein & Samsa, 1997)
• Excellent interrater reliability; ICC = 0.95
Acute Stroke: Interrater Agreement (Goldstein et al, 1989; n = 20 with 2 independent observers)
• Adequate to Excellent agreement was found for 9 of the 13 items on the NIHSS (Kappa = 0.32 to 0.79); lowest levels of agreement were found for the Facial palsy (Kappa = 0.22) and limb ataxia (Kappa = -0.16) items.
Internal Consistency Not established
Criterion Validity (Predictive/Concurrent)
Acute Stroke: Predictive validity (Adams et al, 1999; n = 1268)
• NIHSS scores at baseline predicted outcome at 7 and 90 days
• An excellent outcome was achieved by nearly two-thirds of the survivors who scored 3 or less at day 7
• Only a few patients who scored more than 15 at baseline achieved excellent outcomes after 90 days
Acute Stroke: Predictive validity (Baird et al, 2001; n = 66; <48 hours post-stroke)
• NIHSS combined with Magnetic Resonance Diffusion-Weighted imaging (MR DWI) and volume of ischaemic brain tissue on MR DWI significantly predicted stroke recovery
Acute Stroke: (Bohannon et al, 2002; n = 92, mean age = 70.0 (12.4) years; NIHSS was administered while patients were still in the emergency department, prior to admission)
• Poor* (but significant) correlation with length of stay (r = 0.276)
For more information visit www.neuropt.org or email [email protected]
• Adequate* correlation with hospital charges (r = 0.320)
• Adequate* correlation with discharge destination (home or elsewhere) (r= - 0.355)
*Significant at p < 0.05
Acute Stroke: Concurrent Validity (Fink et al, 2002)
• Adequate to Excellent correlations with diffusion weighted MRI lesion volumes (r = 0.48 right, r = 0.58 left); and perfusion-weight hypoperfusion volumes (r = 0.62 right, r = 0.60 left)
Chronic Stroke: Concurrent Validity (Peters, et al., 2015)
Examined the concurrent validity of the NHISS with the Stroke Impact Scale. No association between NIHSS and SIS-physical dimension (Spearman's rho = -.036; p=.666). SIS-overall perception of recovery (Spearman's rho = -.039; p=.640) nor SIS ADL/IADL score (Spearman's rho = -.054; p=.520).
Construct Validity (Convergent/Discriminant)
Acute Stroke: (Schlegel et al, 2003; Rundek et al, 2000)
Outcomes related to NIHSS scores at admission:
• Scores of <5; 80% of stroke survivors will be discharged to home
• Score between 6 and 13 typically require acute inpatient rehabilitation
• Scores of >14 frequently require long-term skilled care
Content Validity Items are based on components of a standard neurological examination (Kasner, 2006)
Face Validity Not statistically established
Floor/Ceiling Effects Acute Stroke:
• Floor effects are less commonly reported in the literature to date
For more information visit www.neuropt.org or email [email protected]
• Ceiling effects (Pickard et al, 2005) A ceiling effect was observed at 6 months with the NIHSS effecting 20% of patients who completed the measure
Responsiveness Acute Stroke: (Brott et al, 1989)
NIHSS scores were compared to infarction size (measured by computed tomography) on 65 patients at 1 week post stroke. 10 items demonstrated an average of 25% change over 7 days. However, changes in limb ataxia and best gaze may have been overstated.
Professional Association Recommendations
Recommendations for use of the instrument from the Academy of Neurologic Physical Therapy of the American Physical Therapy Association’s Multiple Sclerosis Taskforce (MSEDGE), Parkinson’s Taskforce (PD EDGE), Spinal Cord Injury Taskforce (PD EDGE), Stroke Taskforce (StrokEDGE II), Traumatic Brain Injury Taskforce (TBI EDGE), and Vestibular Taskforce (VEDGE) are listed below. These recommendations were developed by a panel of research and clinical experts using a modified Delphi process.
For detailed information about how recommendations were made, please visit: http://www.neuropt.org/go/healthcare-professionals/neurology-section-outcome-measures-recommendations
Abbreviations:
HR Highly Recommend
R Recommend
LS / UR Reasonable to use, but limited study in target group / Unable to Recommend
NR Not Recommended
Recommendations for use based on acuity level of the patient:
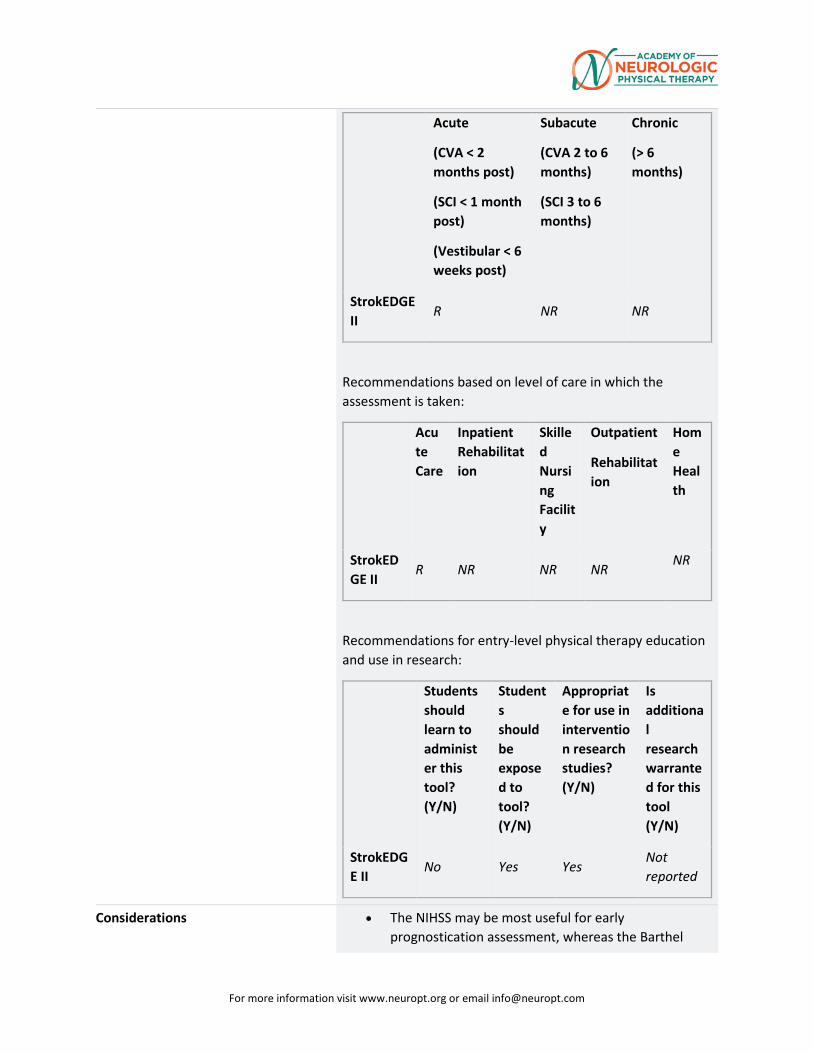
For more information visit www.neuropt.org or email [email protected]
Acute
(CVA < 2 months post)
(SCI < 1 month post)
(Vestibular < 6 weeks post)
Subacute
(CVA 2 to 6 months)
(SCI 3 to 6 months)
Chronic
(> 6 months)
StrokEDGE II
R NR NR
Recommendations based on level of care in which the assessment is taken:
Acute Care
Inpatient Rehabilitation
Skilled Nursing Facility
Outpatient
Rehabilitation
Home Health
StrokEDGE II
R NR NR NR NR
Recommendations for entry-level physical therapy education and use in research:
Students should learn to administer this tool? (Y/N)
Students should be exposed to tool? (Y/N)
Appropriate for use in intervention research studies? (Y/N)
Is additional research warranted for this tool (Y/N)
StrokEDGE II
No Yes Yes Not reported
Considerations • The NIHSS may be most useful for early prognostication assessment, whereas the Barthel
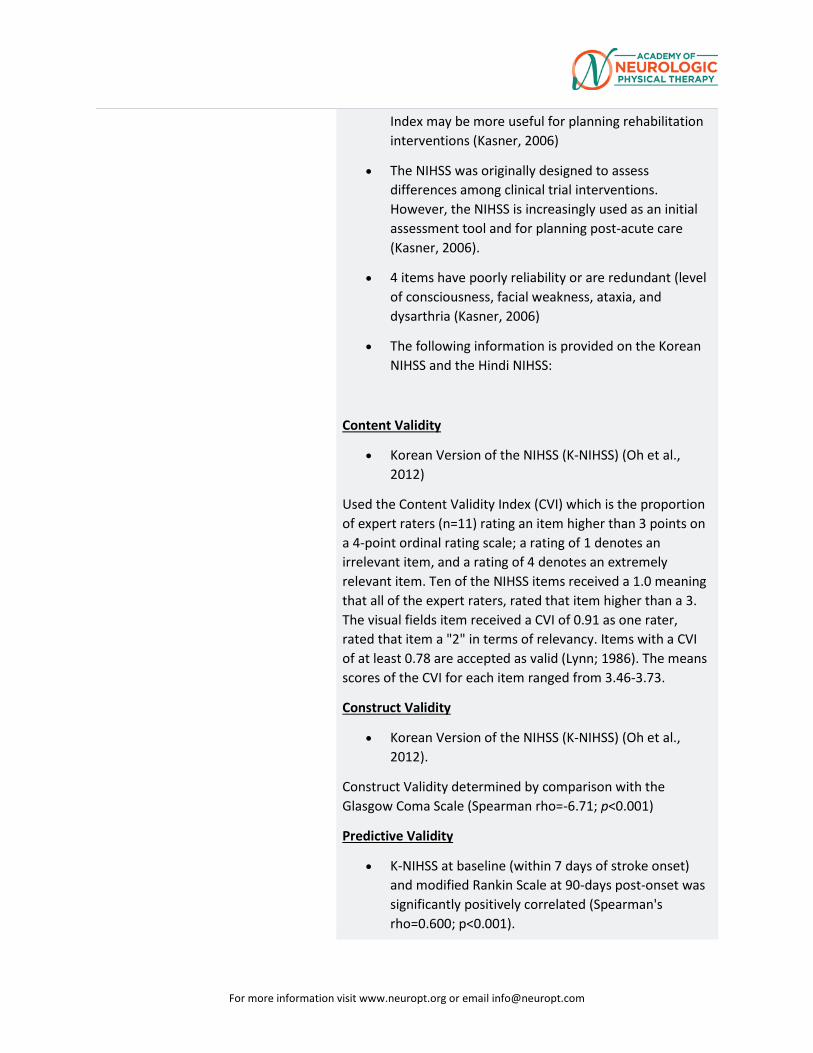
For more information visit www.neuropt.org or email [email protected]
Index may be more useful for planning rehabilitation interventions (Kasner, 2006)
• The NIHSS was originally designed to assess differences among clinical trial interventions. However, the NIHSS is increasingly used as an initial assessment tool and for planning post-acute care (Kasner, 2006).
• 4 items have poorly reliability or are redundant (level of consciousness, facial weakness, ataxia, and dysarthria (Kasner, 2006)
• The following information is provided on the Korean NIHSS and the Hindi NIHSS:
Content Validity
• Korean Version of the NIHSS (K-NIHSS) (Oh et al., 2012)
Used the Content Validity Index (CVI) which is the proportion of expert raters (n=11) rating an item higher than 3 points on a 4-point ordinal rating scale; a rating of 1 denotes an irrelevant item, and a rating of 4 denotes an extremely relevant item. Ten of the NIHSS items received a 1.0 meaning that all of the expert raters, rated that item higher than a 3. The visual fields item received a CVI of 0.91 as one rater, rated that item a "2" in terms of relevancy. Items with a CVI of at least 0.78 are accepted as valid (Lynn; 1986). The means scores of the CVI for each item ranged from 3.46-3.73.
Construct Validity
• Korean Version of the NIHSS (K-NIHSS) (Oh et al., 2012).
Construct Validity determined by comparison with the Glasgow Coma Scale (Spearman rho=-6.71; p<0.001)
Predictive Validity
• K-NIHSS at baseline (within 7 days of stroke onset) and modified Rankin Scale at 90-days post-onset was significantly positively correlated (Spearman's rho=0.600; p<0.001).
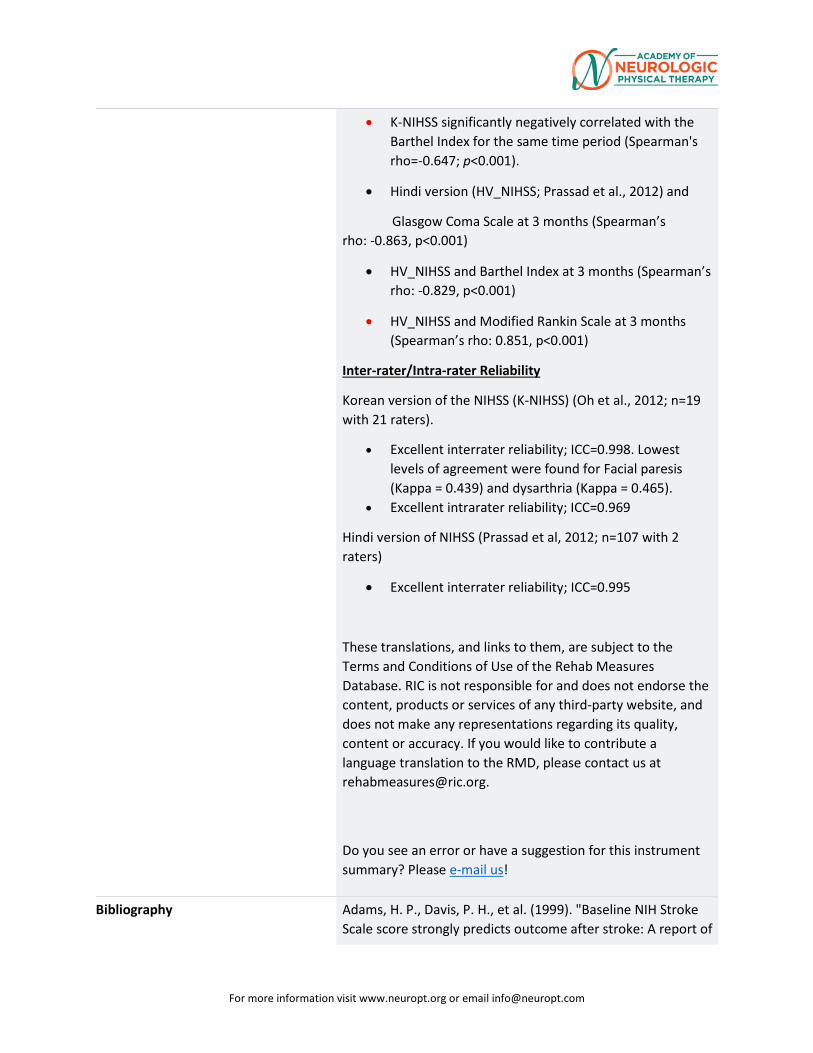
For more information visit www.neuropt.org or email [email protected]
• K-NIHSS significantly negatively correlated with the Barthel Index for the same time period (Spearman's rho=-0.647; p<0.001).
• Hindi version (HV_NIHSS; Prassad et al., 2012) and
Glasgow Coma Scale at 3 months (Spearman’s rho: -0.863, p<0.001)
• HV_NIHSS and Barthel Index at 3 months (Spearman’s rho: -0.829, p<0.001)
• HV_NIHSS and Modified Rankin Scale at 3 months (Spearman’s rho: 0.851, p<0.001)
Inter-rater/Intra-rater Reliability
Korean version of the NIHSS (K-NIHSS) (Oh et al., 2012; n=19 with 21 raters).
• Excellent interrater reliability; ICC=0.998. Lowest levels of agreement were found for Facial paresis (Kappa = 0.439) and dysarthria (Kappa = 0.465).
• Excellent intrarater reliability; ICC=0.969
Hindi version of NIHSS (Prassad et al, 2012; n=107 with 2 raters)
• Excellent interrater reliability; ICC=0.995
These translations, and links to them, are subject to the Terms and Conditions of Use of the Rehab Measures Database. RIC is not responsible for and does not endorse the content, products or services of any third-party website, and does not make any representations regarding its quality, content or accuracy. If you would like to contribute a language translation to the RMD, please contact us at [email protected].
Do you see an error or have a suggestion for this instrument summary? Please e-mail us!
Bibliography Adams, H. P., Davis, P. H., et al. (1999). "Baseline NIH Stroke Scale score strongly predicts outcome after stroke: A report of
For more information visit www.neuropt.org or email [email protected]
the Trial of Org 10172 in Acute Stroke Treatment (TOAST)." Neurology 53: 126-131. Find it on PubMed
Baird, A. E., Dambrosia, J., et al. (2001). "A three-item scale for the early prediction of stroke recovery." Lancet 357: 2095-2099. Find it on PubMed
Bohannon, R. W., Lee, N., et al. (2002). "Postadmission function best predicts acute hospital outcomes after stroke." Am J Phys Med Rehabil 81: 726-730.Find it on PubMed
Brott, T., Adams, H. P., Jr., et al. (1989). "Measurements of acute cerebral infarction: a clinical examination scale." Stroke 20(7): 864-870. Find it on PubMed
Fink, J. N., Selim, M. H., et al. (2002). "Is the association of National Institutes of Health Stroke Scale scores and acute magnetic resonance imaging stroke volume equal for patients with right- and left-hemisphere ischemic stroke?" Stroke 33: 954-958. Find it on PubMed
Goldstein, L. B., Bertels, C., et al. (1989). "Interrater reliability of the NIH stroke scale." Arch Neurol 46(6): 660-662. Find it on PubMed
Goldstein, L. B. and Samsa, G. P. (1997). "Reliability of the National Institutes of Health Stroke Scale. Extension to non-neurologists in the context of a clinical trial." Stroke 28(2): 307-310. Find it on PubMed
Kasner, S. E. (2006). "Clinical interpretation and use of stroke scales." Lancet Neurol 5(7): 603-612. Find it on PubMed
Peters, H. T., et al. (2015). "The National Institutes of Health Stroke Scale Lacks Validity in ChronicHemiparetic Stroke." J Stroke Cerebrovasc Dis 24(10): 2207-2212.
Oh, M. S., et al. (2012). "Validity and reliability of a korean version of the national institutes of healthstroke scale." J Clin Neurol 8(3): 177-183.
Pickard, A. S., Johnson, J. A., et al. (2005). "Responsiveness of generic health-related quality of life measures in stroke." Qual Life Res 14: 207-219.Find it on PubMed
For more information visit www.neuropt.org or email [email protected]
Prasad, K., et al. (2012). "Validation of the Hindi version of National Institute of Health Stroke Scale."Neurol India 60(1): 40-44.
Rundek, T., Mast, H., et al. (2000). "Predictors of resource use after acute hospitalization: the Northern Manhattan Stroke Study." Neurology 55: 1180-1187. Find it on PubMed
Schlegel, D., Kolb, S. J., et al. (2003). "Utility of the NIH Stroke Scale as a predictor of hospital disposition." Stroke 34: 134-137. Find it on PubMed
Williams, L. S., Yilmaz, E. Y., et al. (2000). "Retrospective assessment of initial stroke severity with the NIH Stroke Scale." Stroke 31: 858-862. Find it on PubMed
Year published 1989
Instrument in PDF Format Yes
Approval Status Approved
21.

For more information visit www.neuropt.org or email [email protected]
22. REHAB MEASURES DATABASE: NOTTINGHAM ASSESSMENT OF SOMATOSENSATION
For more information visit www.neuropt.org or email [email protected]
Link to instrument
Title of Assessment Nottingham Assessment of Somato-Sensation
Acronym NSA
Instrument Reviewer(s) Initially reviewed by Jane Sullivan, MPT, DHS and the Stroke EDGE task force in 2011. Updated by Dorian Rose, PhD, PT and the StrokEdge II task force in 2017.
Summary Date 1/21/2017
Purpose This tool has been used in clinical trials following stroke to test interventions such as electrical stimulation and task specific training.
Description Multi-modal sensory examination includes tests of: 1) Tactile sensation (light, touch, touch localization, temperature discrimination, pinprick sensation, bilateral simultaneous stimulation) 2) Kinesthesia 3) Stereognosis.
Scoring of instrument:
Tactile sensation:
0 – Absent – fails to identify the test sensations on 3 trials
1 – Impaired – identifies the test sensation, but not on all 3 trials in each region of the body of feels duller
2 – Normal – correctly identifies the test sensation on 3 trials
For Stereognosis:
2 – Normal – item is correctly named or matched
1 – Impaired – some features of object identified or attempts descriptions of objects
0 – Absent – unable to identify the object in any manner
For Kinesthesia:
For more information visit www.neuropt.org or email [email protected]
0 – Absent – no appreciation of movement taking place
1 – Appreciation of movement taking place – indicates on each movement that a movement takes place but the movement direction is incorrect
2 – Direction of movement sense – able to appreciate and mirror the direction of the test movement, but is inaccurate in its new position
3 – Joint Position Sense – accurately mirrors the test movement to within 10 degrees of the new test position
Area of Assessment Sensation
Body Part Upper Extremity and Lower Extremity
ICF Domain Body Structure; Body Function
Domain Sensory
Assessment Type Performance Measure
Length of Test 60 Minutes or More
Time to Administer Entire test can take up to 60 minutes, depending on client's sensory impairment. Kenesthesia and Sterognosis tests tkae approximately 15 minutes each
Number of Items 3
Equipment Required For tactile sensation: blindfold, cotton ball, Neurotip, 2 test tubes for hot and cold water, talcum powder.
For sterognosis assessment: blindfold, 2 different coins, pen, pencil, comb, scissors, sponge, piece of flannel cloth, cup, glass.
Training Required Methods of sensory examination taught in most entry-level curricula are not as rigorous as this one. The NSA might be included in an examination courses as an example of a standardized sensory examination.
Type of training required training course; Reading an Article/Manual
Cost Not Free
For more information visit www.neuropt.org or email [email protected]
Actual Cost < £100
Age Range Adult: 18-64 years; Elderly adult: 65+
Administration Mode Paper/Pencil
Diagnosis Stroke
Populations Tested • Stroke
Standard Error of Measurement (SEM) Not Established
Minimal Detectable Change (MDC) Not Established
Minimally Clinically Important Difference (MCID) Not Established
Cut-Off Scores Not Established
Normative Data Not Established
Test-retest Reliability (Lincoln NB et al, 1991; n = 20 chronic stroke patients)
• One physical therapist tested patients on two occasions between 2-52 days apart. Kappa coefficients = -0.13-0.92; k >0.7 for 17/54 items
Interrater/Intrarater Reliability Stroke:
(Lincoln NB et al, 1991; n = 20 acute stroke patients)
• Assessed by two physical therapists within 2-52 days of each other. Kappa coefficients = 0.01-0.89; only 1 item k >0.7
(Lincoln NB et al, 1998; n = 27 stroke patients)
• Kappa coefficients showed acceptable agreement on 12 out of the 86 items for inter rater reliability. Light touch and pressure scales were most reliable and pin-prick and temperature scales were least reliable
• For inter rater reliability of the stereognosis subtest reported kappa coefficients 0.38 to 1.0. Coefficients were higher on the unaffected side and for certain items (scissors, sponge, cup) Intracranial Disorders:
For more information visit www.neuropt.org or email [email protected]
(Stolk-Hornsveld F et al, 2006; n = 18 inpatients; mean age = 57.7 years; diagnosed with intracranial disorder)
• Intra rater and inter rater reliability of the Erasmus MC modifications to the Nottingham Sensory Assessment (EmNSA), kappa coefficients 0.58 to 1.00. Two-point discrimination was less reliable 0.11 to 0.63. Inter rater reliability of EmNSA, kappa coefficients of 0.46 to 1.00. Two-point discrimination was less reliable of 0.10 to 0.66
Stroke: Stereognosis Assessment
(Gaubert CS and Mockett SP; 2000, n = 20 stroke patients ( 3.85±2.78 weeks post-stroke)
• The stereognostic ability of the subjects was assessed using the NSA procedures by 2 of 3 examiners within a 24-hour period.
• Kappa values ranged from 0.42 (moderate) to 0.85 (almost perfect) between Examiners 1 and 2
• Kappa values ranged from 0.38 (fair) to 0.84 (almost perfect) between Examiners 1 and 3
• Kappa values ranged from 0.40 (fair) to 0.80 (substantial) between Examiners 1 with Examiners 2 and 3.
• For all 3 levels of comparison, the lowest Kappa value was for the pencil item.
Internal Consistency Not Established
Criterion Validity (Predictive/Concurrent) Stroke:
(Connell LA et al, 2008; n = 70 stroke patients)
• Upper limb tactile sensation at rehab admission (within 6 wks of stroke onset) predictive of upper limb tactile sensation at 6-months post-stroke (R2 =0.56; p < 0.001)
• Lower limb tactile sensation at rehab admission (within 6 wks of stroke onset) predictive of lower limb
For more information visit www.neuropt.org or email [email protected]
tactile sensation at 6-months post-stroke (R2 =0.46; p < 0.001)
• Stereognosis and proprioception at rehab admission (within 6 wks of stroke onset) predictive of stereognosis at 6-months post-stroke (R2 =0.71; p < 0.001)
• Proprioception and upper limb tactile sensation at rehab admission (within 6 wks of stroke onset) predictive of proprioception at 6-months post-stroke (R2 =0.51; p < 0.001)
(Meyer et al, 2016; n = 32 acute stroke patients)
• Proprioception (movement sense) as measured by the Erasmsus MC (revised) NSA at one week post-stroke, moderately predicted motor ability at 6-months post-stroke as measured by the UE Fugl-Meyer (Spearman ƿ = 0.27), the Motricity Index (Spearman ƿ = 0.27) and the Action Research Arm Test (Spearman ƿ = 0.26).
• Stereognosis measured by the NSA at one week post-stroke moderately predicted motor ability at 6-months post-stroke as measured by the UE Fugl-Meyer (Spearman ƿ = 0.41), the Motricity Index (Spearman ƿ = 0.37) and the Action Research Arm Test (Spearman ƿ = 0.56).
•
Construct Validity (Convergent/Discriminant) Stroke:
(Scalha et al, 2011; n = 20 stroke patients (> 2 yrs post-stroke)
• Total Fugl-Meyer (FM) UE Sensation (proprioception and light touch) correlated with UE Nottingham Stroke Assessment (NSA) score; Spearman’s r=0.69; p<0.001)
• UE FM arm light touch correlated with NSA tactile sensation subscale (p< 0.005)
• UE FM palm light touch correlated with NSA tactile sensation subscale (p<0.005)
For more information visit www.neuropt.org or email [email protected]
• UE FM shoulder/elbow proprioception correlated with NSA proprioception subscale (r=0.59; p=0.007)
• UE FM wrist/hand proprioception correlated with NSA proprioception subscale (r=0.75;p < 0.001).
Content Validity Not Established
Face Validity Not Established
Floor/Ceiling Effects Not Established
Responsiveness Not Established
Professional Association Recommendations Recommendations for use of the instrument from the
Academy of Neurologic Physical Therapy of the American Physical Therapy Association’s Multiple Sclerosis Taskforce (MSEDGE), Parkinson’s Taskforce (PD EDGE), Spinal Cord Injury Taskforce (PD EDGE), Stroke Taskforce (StrokEDGE II), Traumatic Brain Injury Taskforce (TBI EDGE), and Vestibular Taskforce (VEDGE) are listed below. These recommendations were developed by a panel of research and clinical experts using a modified Delphi process. For detailed information about how recommendations were made, please visit: http://www.neuropt.org/go/healthcare-professionals/neurology-section-outcome-measures-recommendations
Abbreviations: HR Highly Recommend R Recommend LS / UR Reasonable to use, but limited study in target
group / Unable to Recommend NR Not Recommended
Recommendations for use based on acuity level of the patient:
Acute (CVA < 2
months post) (SCI < 1
month post) (Vestibular < 6 weeks post)
Subacute (CVA 2 to 6
months) (SCI 3 to 6 months)
Chronic (> 6
months)

For more information visit www.neuropt.org or email [email protected]
StrokEDGE II UR UR UR
Recommendations based on level of care in which the assessment is taken:
Acute
Care
Inpatient Rehabilita
tion
Skilled
Nursing
Facility
Outpatient
Rehabilitation
Home
Health
MS EDGE NR NR NR NR NR
StrokEDGE II NR UR UR UR UR
Recommendations based on EDSS Classification:
EDSS 0.0 – 3.5
EDSS 4.0 – 5.5
EDSS 6.0 – 7.5
EDSS 8.0 – 9.5
MS EDGE NR NR NR NR
Recommendations for entry-level physical therapy education and use in research:
Students should learn to administ
er this tool? (Y/N)
Students
should be
exposed to
tool? (Y/N)
Appropriate for use
in interventi
on research studies?
(Y/N)
Is addition
al research warrante
d for this tool
(Y/N) MS EDGE No No No Yes StrokEDGE II No Yes Yes Yes
Considerations It is unlikely that the entire test will be performed in any of these practice settings, however components of the test may be appropriate if the systems review/screening exam indicates sensory loss and/or if sensory loss is hypothesized to underlie the patient’s movement dysfunction.
Clinical utility is poor due to the time to complete the entire test and the need for specific equipment that may not be available in the clinic (e.g. neurotip). The stereognosis and kinesthesia subscales have better clinical utility (equipment and time). Those two tests may be more appropriate for use in the clinic
For more information visit www.neuropt.org or email [email protected]
that they use standardized equipment procedures and have some acceptable psychometric data available.
The inclusion of sensory outcome measure in clinical trials could advance knowledge by identifying those intervention that are associated with sensory improvement as well as helping to determine those client characteristics (beyond motor and functional status) that are associated with improvement following selected interventions. This information would assist clinicians to target appropriate interventions based on client baseline characteristics.
Bibliography Meyer S, De Bruyn N et al. (2016). Associations Between Sensorimotor Impairments in the Upper Limb at 1 Week and 6 Months Post-Stroke. JNPT 40:186-195. “Find it on PubMed”
Scalha TB, Miyasaki E et al. (2011). Correlations between motor and sensory functions in upper limb chronic hemiparetics after stroke. Arq Neuropsiquiatr 69(4): 624-629. “Find it on PubMed”
Connell LA, Lincoln NB, Radford KA (2008). Somatosensory impairment after stroke: frequency of different deficits and their recovery. Clin Rehab 22: 758-767, “Find it on PubMed”
Stolk-Hornsveld, F., Crow, J. L., et al. (2006). "The Erasmus MC modifications to the (revised) Nottingham Sensory Assessment: a reliable somatosensory assessment measure for patients with intracranial disorders." Clin Rehabil 20(2): 160-172. Find it on PubMed
Gaubert CS and Mockett SP (2000). Inter-rater reliability of the Nottingham method of stereognosis assessment. 14: 153-159. “Find it on PubMed”
For more information visit www.neuropt.org or email [email protected]
Lincoln, N., Jackson, J., et al. (1998). "Reliability and revision of the Nottingham Sensory Assessment for stroke patients." Physiotherapy 84(8): 358-365. Find it on PubMed
Lincoln, N. B., Crow, J., et al. (1991). "The unreliability of sensory assessments." Clinical rehabilitation 5(4): 273-282. Find it on PubMed
Year published 2011
Instrument in PDF Format Yes
Approval Status Approved
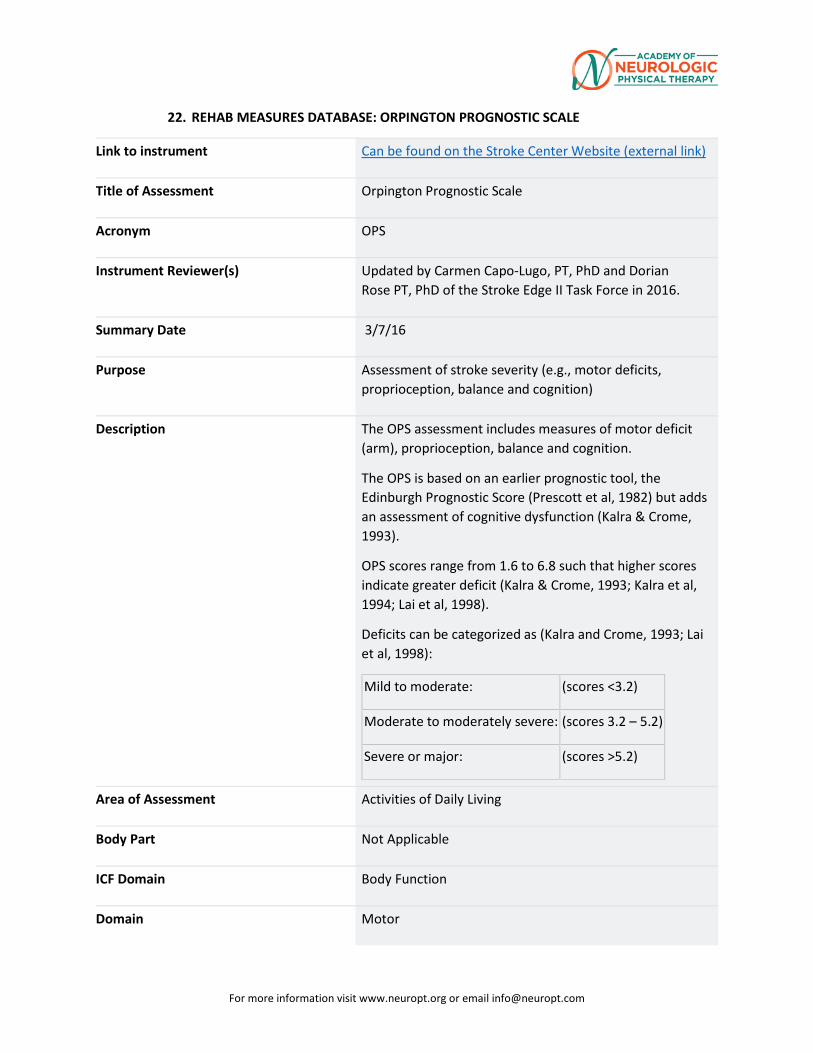
For more information visit www.neuropt.org or email [email protected]
22. REHAB MEASURES DATABASE: ORPINGTON PROGNOSTIC SCALE
Link to instrument Can be found on the Stroke Center Website (external link)
Title of Assessment Orpington Prognostic Scale
Acronym OPS
Instrument Reviewer(s) Updated by Carmen Capo-Lugo, PT, PhD and Dorian Rose PT, PhD of the Stroke Edge II Task Force in 2016.
Summary Date 3/7/16
Purpose Assessment of stroke severity (e.g., motor deficits, proprioception, balance and cognition)
Description The OPS assessment includes measures of motor deficit (arm), proprioception, balance and cognition.
The OPS is based on an earlier prognostic tool, the Edinburgh Prognostic Score (Prescott et al, 1982) but adds an assessment of cognitive dysfunction (Kalra & Crome, 1993).
OPS scores range from 1.6 to 6.8 such that higher scores indicate greater deficit (Kalra & Crome, 1993; Kalra et al, 1994; Lai et al, 1998).
Deficits can be categorized as (Kalra and Crome, 1993; Lai et al, 1998):
Mild to moderate: (scores <3.2)
Moderate to moderately severe: (scores 3.2 – 5.2)
Severe or major: (scores >5.2)
Area of Assessment Activities of Daily Living
Body Part Not Applicable
ICF Domain Body Function
Domain Motor
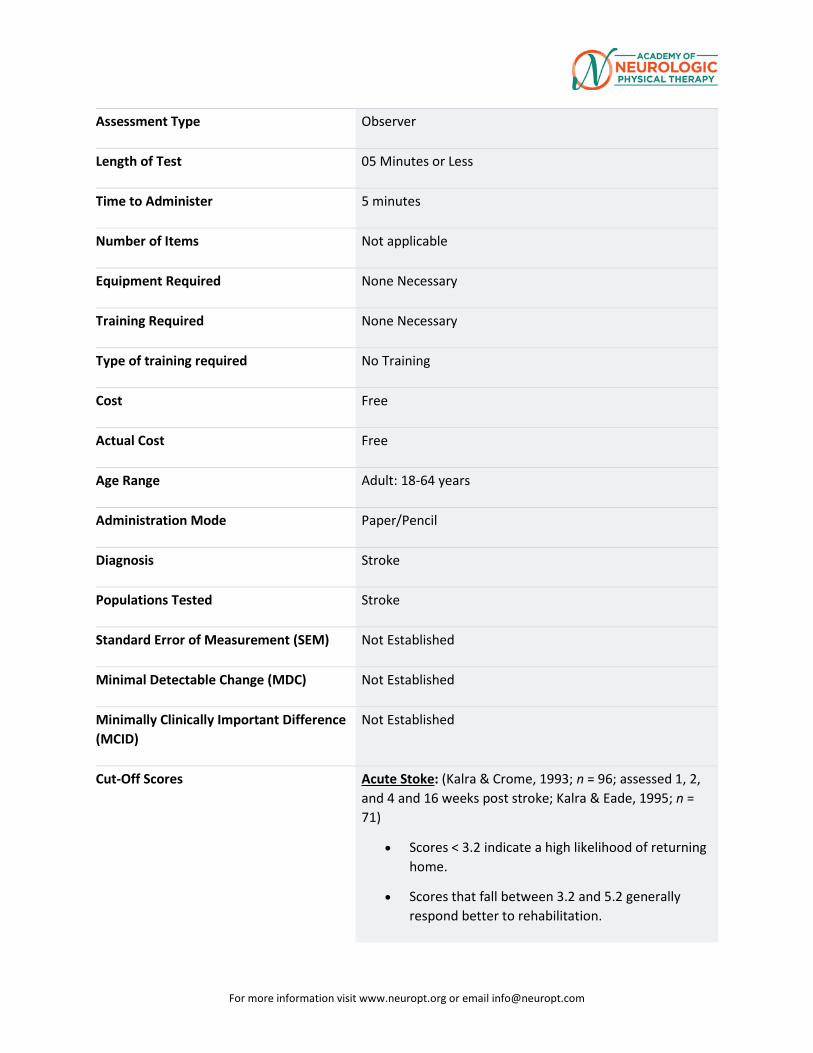
For more information visit www.neuropt.org or email [email protected]
Assessment Type Observer
Length of Test 05 Minutes or Less
Time to Administer 5 minutes
Number of Items Not applicable
Equipment Required None Necessary
Training Required None Necessary
Type of training required No Training
Cost Free
Actual Cost Free
Age Range Adult: 18-64 years
Administration Mode Paper/Pencil
Diagnosis Stroke
Populations Tested Stroke
Standard Error of Measurement (SEM) Not Established
Minimal Detectable Change (MDC) Not Established
Minimally Clinically Important Difference (MCID)
Not Established
Cut-Off Scores Acute Stoke: (Kalra & Crome, 1993; n = 96; assessed 1, 2, and 4 and 16 weeks post stroke; Kalra & Eade, 1995; n = 71)
• Scores < 3.2 indicate a high likelihood of returning home.
• Scores that fall between 3.2 and 5.2 generally respond better to rehabilitation.
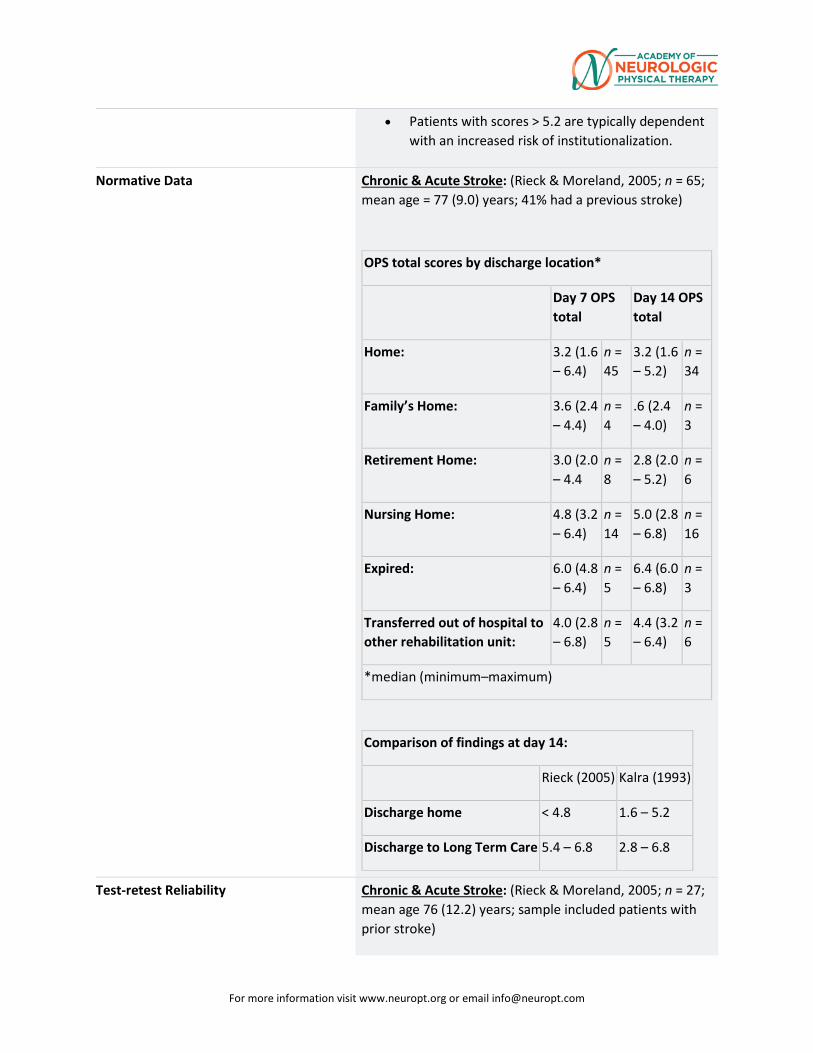
For more information visit www.neuropt.org or email [email protected]
• Patients with scores > 5.2 are typically dependent with an increased risk of institutionalization.
Normative Data Chronic & Acute Stroke: (Rieck & Moreland, 2005; n = 65; mean age = 77 (9.0) years; 41% had a previous stroke)
OPS total scores by discharge location*
Day 7 OPS total
Day 14 OPS total
Home: 3.2 (1.6 – 6.4)
n = 45
3.2 (1.6 – 5.2)
n = 34
Family’s Home: 3.6 (2.4 – 4.4)
n = 4
.6 (2.4 – 4.0)
n = 3
Retirement Home: 3.0 (2.0 – 4.4
n = 8
2.8 (2.0 – 5.2)
n = 6
Nursing Home: 4.8 (3.2 – 6.4)
n = 14
5.0 (2.8 – 6.8)
n = 16
Expired: 6.0 (4.8 – 6.4)
n = 5
6.4 (6.0 – 6.8)
n = 3
Transferred out of hospital to other rehabilitation unit:
4.0 (2.8 – 6.8)
n = 5
4.4 (3.2 – 6.4)
n = 6
*median (minimum–maximum)
Comparison of findings at day 14:
Rieck (2005) Kalra (1993)
Discharge home < 4.8 1.6 – 5.2
Discharge to Long Term Care 5.4 – 6.8 2.8 – 6.8
Test-retest Reliability Chronic & Acute Stroke: (Rieck & Moreland, 2005; n = 27; mean age 76 (12.2) years; sample included patients with prior stroke)
For more information visit www.neuropt.org or email [email protected]
• Excellent test-retested reliability (ICC = 0.95)
Interrater/Intrarater Reliability Chronic & Acute Stroke: (Rieck & Moreland, 2005; n = 65; mean age 77 (9) years; assessed 7 and 14 days post stroke by two physiotherapists; sample included patients with prior stroke)
• Excellent inter-rater reliability (ICC = 0.99)
• Excellent inter-rater reliability (weighted kappa = 0.84 - balance)
Acute Stroke: (Weir et al, 2003; prospectively n = 2 clinicians and 92 patients / retrospectively n = 2 auditors & 200 patients)
• Adequate inter-rater reliability (weighted kappa = 0.53-proprioception; 0.64-cognition; 0.72 motor deficit
Internal Consistency Not Established
Criterion Validity (Predictive/Concurrent) Acute Stroke: (Brott et al, 1989; Wright, Swinton & Green, 2004; Celik, Aksel & Karaoglan, 2006)
• Excellent concurrent validity with NIHSS (see below for specific values by study):
Study 1: NIHSS (rho = 0.83) Study 2: NIHSS (rho = 0.60) Study 3: NIHSS (rho = 0.76)
Acute Stroke: (Kalra & Crome, 1993; Studenski et al, 2001; n = 413; 3 to 14 days post stroke)
• Excellent predictive validity:
Predicts Barthel Index ADL scores at discharge.
A better predictor of Barthel Index scores (R-sqr = 0.89) when compared to Edinburgh Prognostic Score (R-sqr = 0.57)
Predicts Barthel Index ADL and Sf-36 Physical Function scores at 1, 3, and 6 months post-stroke
• Adequate predictive validity with:
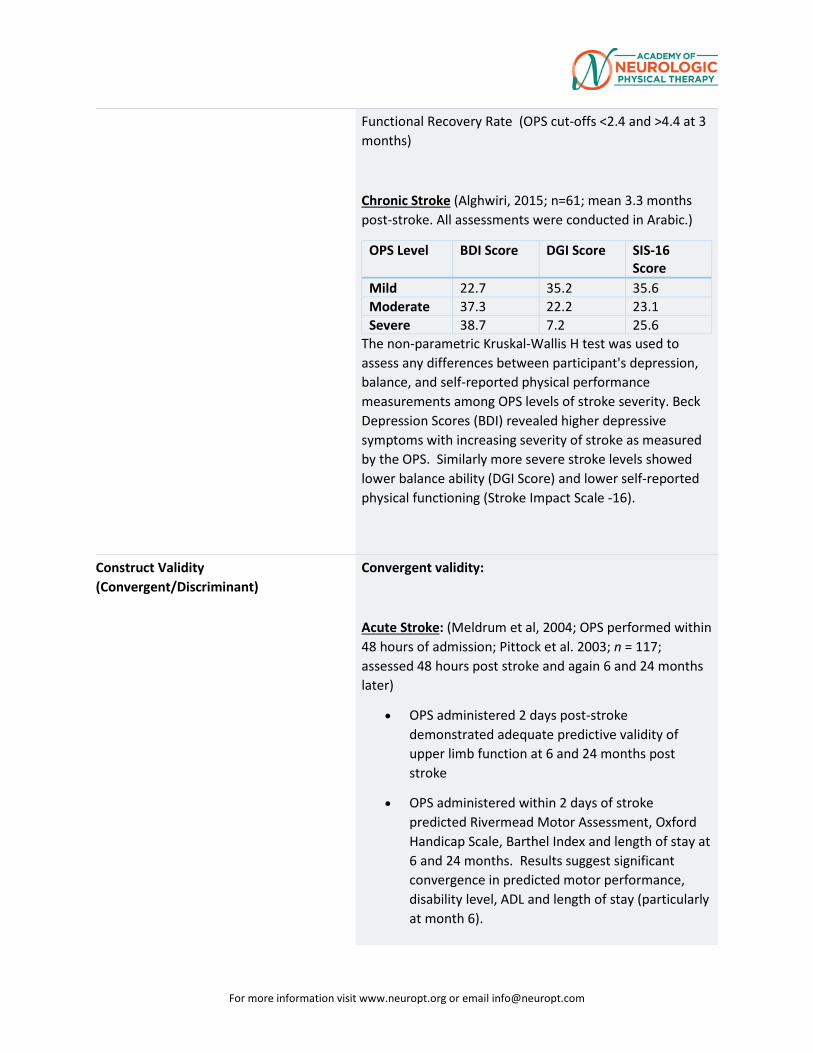
For more information visit www.neuropt.org or email [email protected]
Functional Recovery Rate (OPS cut-offs <2.4 and >4.4 at 3 months)
Chronic Stroke (Alghwiri, 2015; n=61; mean 3.3 months post-stroke. All assessments were conducted in Arabic.)
OPS Level BDI Score DGI Score SIS-16 Score
Mild 22.7 35.2 35.6 Moderate 37.3 22.2 23.1 Severe 38.7 7.2 25.6
The non-parametric Kruskal-Wallis H test was used to assess any differences between participant's depression, balance, and self-reported physical performance measurements among OPS levels of stroke severity. Beck Depression Scores (BDI) revealed higher depressive symptoms with increasing severity of stroke as measured by the OPS. Similarly more severe stroke levels showed lower balance ability (DGI Score) and lower self-reported physical functioning (Stroke Impact Scale -16).
Construct Validity (Convergent/Discriminant)
Convergent validity:
Acute Stroke: (Meldrum et al, 2004; OPS performed within 48 hours of admission; Pittock et al. 2003; n = 117; assessed 48 hours post stroke and again 6 and 24 months later)
• OPS administered 2 days post-stroke demonstrated adequate predictive validity of upper limb function at 6 and 24 months post stroke
• OPS administered within 2 days of stroke predicted Rivermead Motor Assessment, Oxford Handicap Scale, Barthel Index and length of stay at 6 and 24 months. Results suggest significant convergence in predicted motor performance, disability level, ADL and length of stay (particularly at month 6).
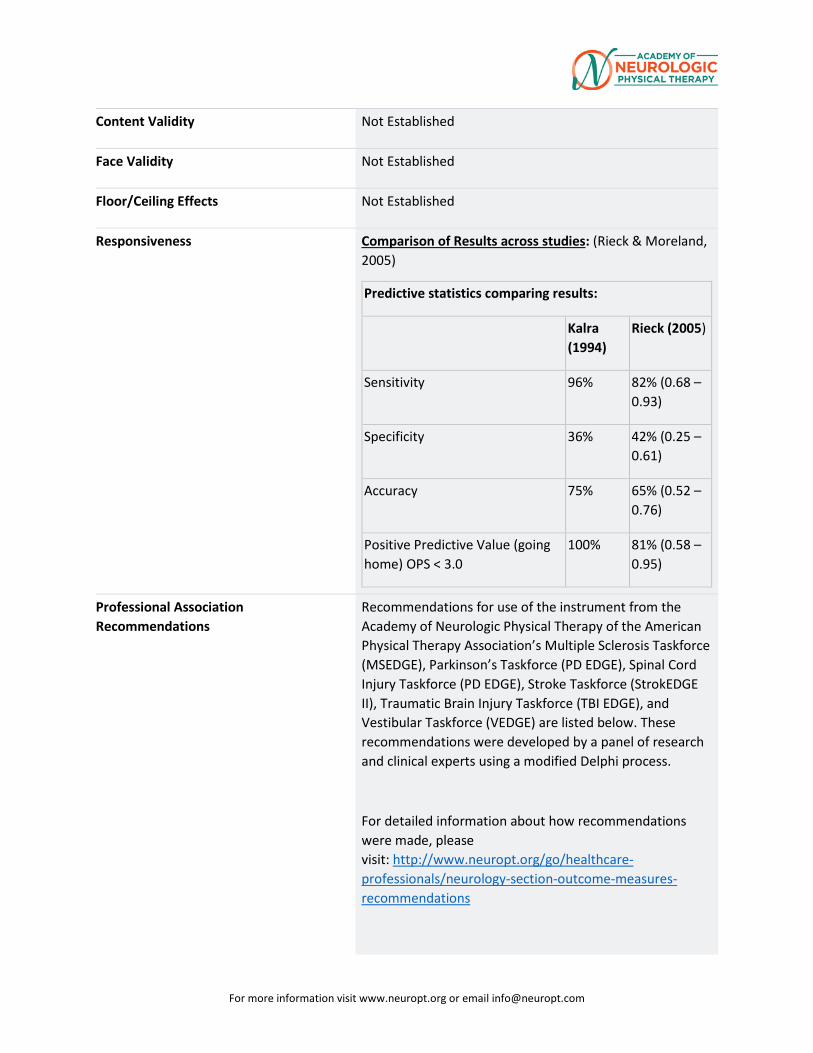
For more information visit www.neuropt.org or email [email protected]
Content Validity Not Established
Face Validity Not Established
Floor/Ceiling Effects Not Established
Responsiveness Comparison of Results across studies: (Rieck & Moreland, 2005)
Predictive statistics comparing results:
Kalra (1994)
Rieck (2005)
Sensitivity 96% 82% (0.68 – 0.93)
Specificity 36% 42% (0.25 – 0.61)
Accuracy 75% 65% (0.52 – 0.76)
Positive Predictive Value (going home) OPS < 3.0
100% 81% (0.58 – 0.95)
Professional Association Recommendations
Recommendations for use of the instrument from the Academy of Neurologic Physical Therapy of the American Physical Therapy Association’s Multiple Sclerosis Taskforce (MSEDGE), Parkinson’s Taskforce (PD EDGE), Spinal Cord Injury Taskforce (PD EDGE), Stroke Taskforce (StrokEDGE II), Traumatic Brain Injury Taskforce (TBI EDGE), and Vestibular Taskforce (VEDGE) are listed below. These recommendations were developed by a panel of research and clinical experts using a modified Delphi process.
For detailed information about how recommendations were made, please visit: http://www.neuropt.org/go/healthcare-professionals/neurology-section-outcome-measures-recommendations
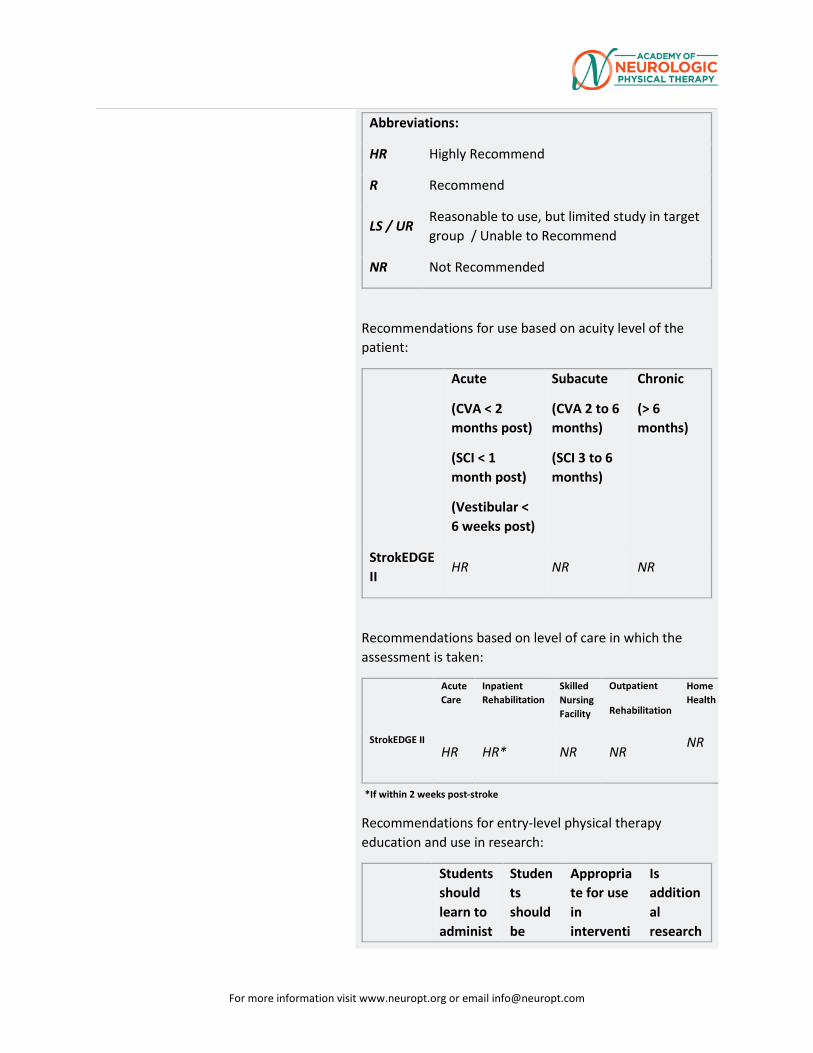
For more information visit www.neuropt.org or email [email protected]
Abbreviations:
HR Highly Recommend
R Recommend
LS / UR Reasonable to use, but limited study in target group / Unable to Recommend
NR Not Recommended
Recommendations for use based on acuity level of the patient:
Acute
(CVA < 2 months post)
(SCI < 1 month post)
(Vestibular < 6 weeks post)
Subacute
(CVA 2 to 6 months)
(SCI 3 to 6 months)
Chronic
(> 6 months)
StrokEDGE II
HR NR NR
Recommendations based on level of care in which the assessment is taken:
Acute Care
Inpatient Rehabilitation
Skilled Nursing Facility
Outpatient
Rehabilitation
Home Health
StrokEDGE II
HR HR* NR NR
NR
*If within 2 weeks post-stroke
Recommendations for entry-level physical therapy education and use in research:
Students should learn to administ
Students should be
Appropriate for use in interventi
Is additional research
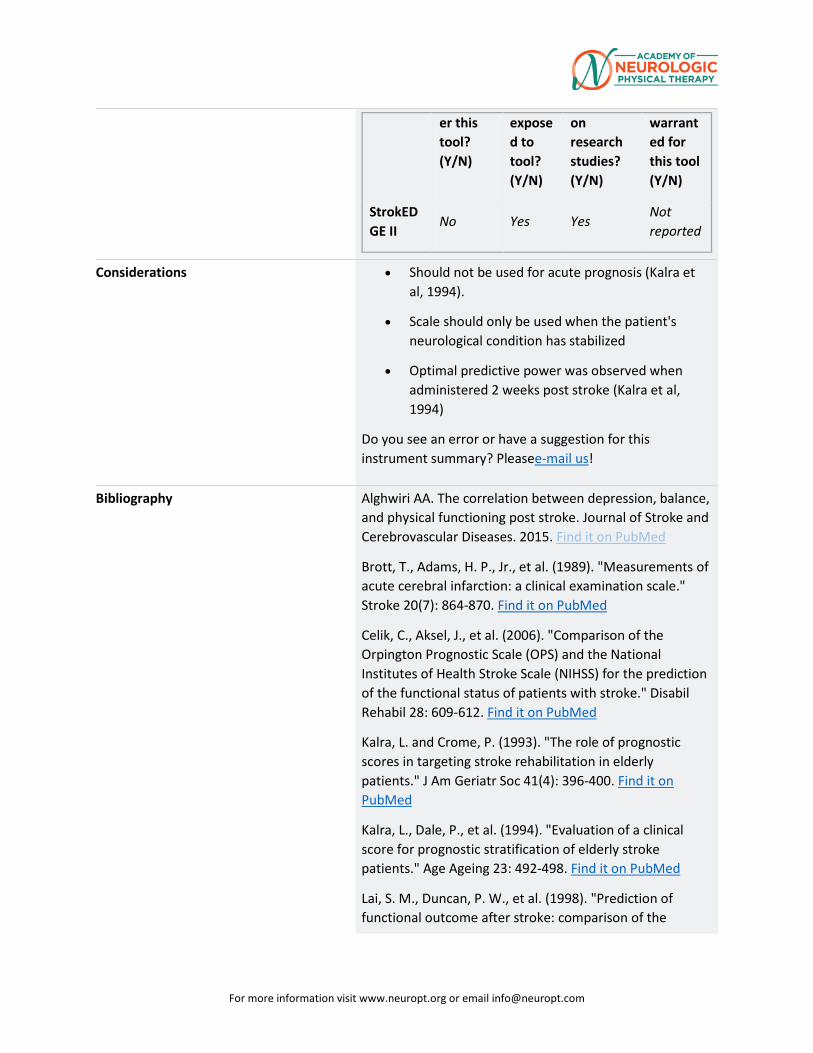
For more information visit www.neuropt.org or email [email protected]
er this tool? (Y/N)
exposed to tool? (Y/N)
on research studies? (Y/N)
warranted for this tool (Y/N)
StrokEDGE II
No Yes Yes Not reported
Considerations • Should not be used for acute prognosis (Kalra et al, 1994).
• Scale should only be used when the patient's neurological condition has stabilized
• Optimal predictive power was observed when administered 2 weeks post stroke (Kalra et al, 1994)
Do you see an error or have a suggestion for this instrument summary? Pleasee-mail us!
Bibliography Alghwiri AA. The correlation between depression, balance, and physical functioning post stroke. Journal of Stroke and Cerebrovascular Diseases. 2015. Find it on PubMed
Brott, T., Adams, H. P., Jr., et al. (1989). "Measurements of acute cerebral infarction: a clinical examination scale." Stroke 20(7): 864-870. Find it on PubMed
Celik, C., Aksel, J., et al. (2006). "Comparison of the Orpington Prognostic Scale (OPS) and the National Institutes of Health Stroke Scale (NIHSS) for the prediction of the functional status of patients with stroke." Disabil Rehabil 28: 609-612. Find it on PubMed
Kalra, L. and Crome, P. (1993). "The role of prognostic scores in targeting stroke rehabilitation in elderly patients." J Am Geriatr Soc 41(4): 396-400. Find it on PubMed
Kalra, L., Dale, P., et al. (1994). "Evaluation of a clinical score for prognostic stratification of elderly stroke patients." Age Ageing 23: 492-498. Find it on PubMed
Lai, S. M., Duncan, P. W., et al. (1998). "Prediction of functional outcome after stroke: comparison of the
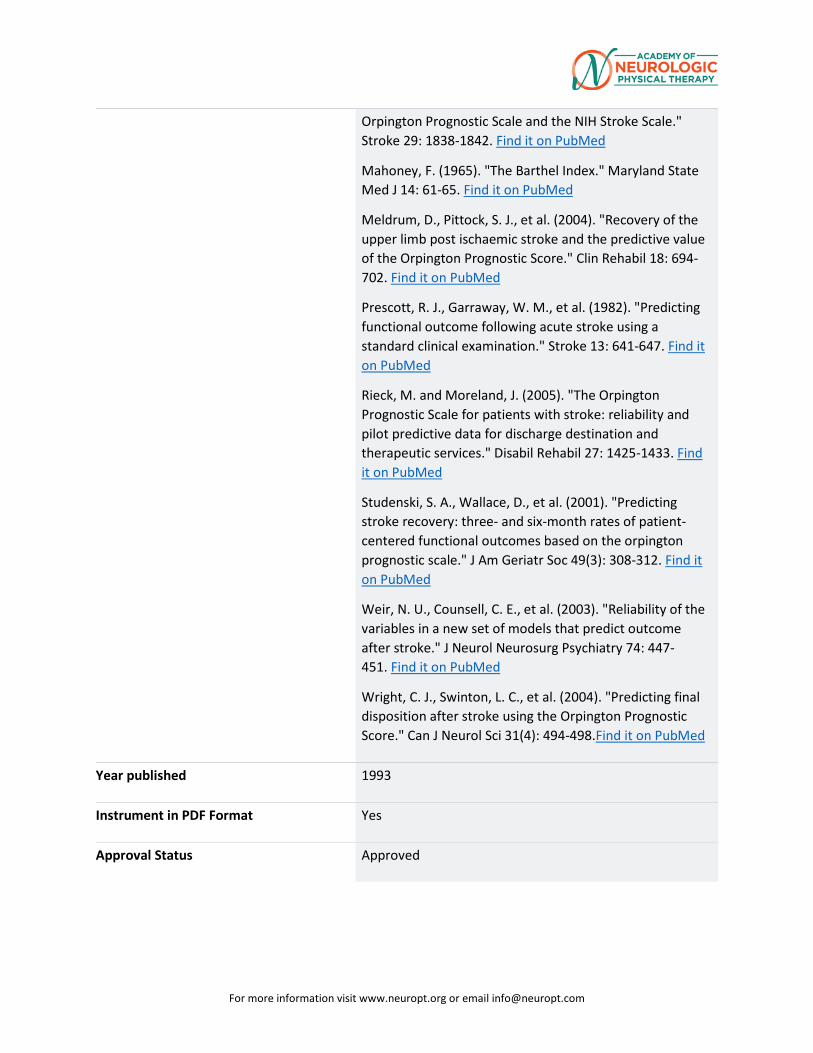
For more information visit www.neuropt.org or email [email protected]
Orpington Prognostic Scale and the NIH Stroke Scale." Stroke 29: 1838-1842. Find it on PubMed
Mahoney, F. (1965). "The Barthel Index." Maryland State Med J 14: 61-65. Find it on PubMed
Meldrum, D., Pittock, S. J., et al. (2004). "Recovery of the upper limb post ischaemic stroke and the predictive value of the Orpington Prognostic Score." Clin Rehabil 18: 694-702. Find it on PubMed
Prescott, R. J., Garraway, W. M., et al. (1982). "Predicting functional outcome following acute stroke using a standard clinical examination." Stroke 13: 641-647. Find it on PubMed
Rieck, M. and Moreland, J. (2005). "The Orpington Prognostic Scale for patients with stroke: reliability and pilot predictive data for discharge destination and therapeutic services." Disabil Rehabil 27: 1425-1433. Find it on PubMed
Studenski, S. A., Wallace, D., et al. (2001). "Predicting stroke recovery: three- and six-month rates of patient-centered functional outcomes based on the orpington prognostic scale." J Am Geriatr Soc 49(3): 308-312. Find it on PubMed
Weir, N. U., Counsell, C. E., et al. (2003). "Reliability of the variables in a new set of models that predict outcome after stroke." J Neurol Neurosurg Psychiatry 74: 447-451. Find it on PubMed
Wright, C. J., Swinton, L. C., et al. (2004). "Predicting final disposition after stroke using the Orpington Prognostic Score." Can J Neurol Sci 31(4): 494-498.Find it on PubMed
Year published 1993
Instrument in PDF Format Yes
Approval Status Approved
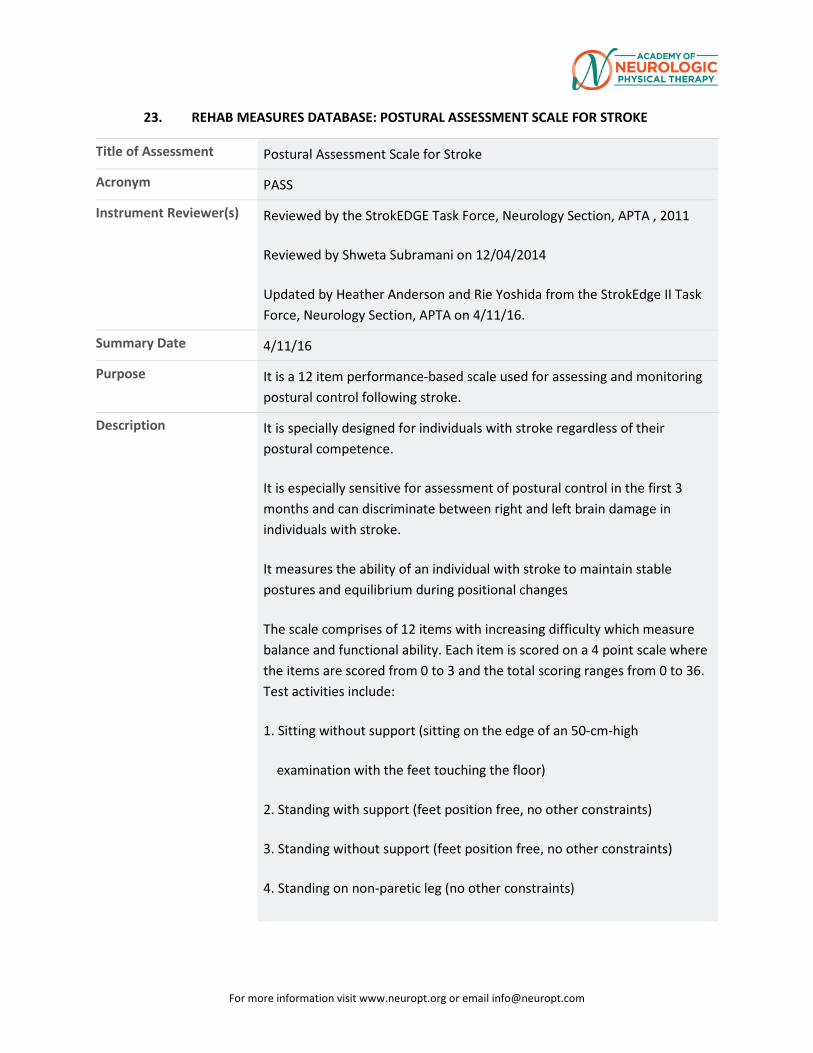
For more information visit www.neuropt.org or email [email protected]
23. REHAB MEASURES DATABASE: POSTURAL ASSESSMENT SCALE FOR STROKE
Title of Assessment Postural Assessment Scale for Stroke
Acronym PASS
Instrument Reviewer(s) Reviewed by the StrokEDGE Task Force, Neurology Section, APTA , 2011
Reviewed by Shweta Subramani on 12/04/2014
Updated by Heather Anderson and Rie Yoshida from the StrokEdge II Task Force, Neurology Section, APTA on 4/11/16.
Summary Date 4/11/16
Purpose It is a 12 item performance-based scale used for assessing and monitoring postural control following stroke.
Description It is specially designed for individuals with stroke regardless of their postural competence.
It is especially sensitive for assessment of postural control in the first 3 months and can discriminate between right and left brain damage in individuals with stroke.
It measures the ability of an individual with stroke to maintain stable postures and equilibrium during positional changes
The scale comprises of 12 items with increasing difficulty which measure balance and functional ability. Each item is scored on a 4 point scale where the items are scored from 0 to 3 and the total scoring ranges from 0 to 36. Test activities include:
1. Sitting without support (sitting on the edge of an 50-cm-high
examination with the feet touching the floor)
2. Standing with support (feet position free, no other constraints)
3. Standing without support (feet position free, no other constraints)
4. Standing on non-paretic leg (no other constraints)
For more information visit www.neuropt.org or email [email protected]
5. Standing on paretic leg (no other constraints)
6. Supine to affected side lateral
7. Supine to non-affected side lateral
8. Supine to sitting up on the edge of the table
9. Sitting on the edge of the table to supine
10. Sitting to standing up
11. Standing up to sitting down
12. Standing, picking up a pencil from the floor
Modified versions of the PASS include the PASS trunk control items (PASS-TC) and the Short-Form PASS (SFPASS). Both have 5 items instead of the original 12 included with the PASS.
Area of Assessment Functional balance in supine, sitting and standing
Body Part Trunk and Lower extremity
ICF Domain Activity
Domain Motor
Assessment Type Performance measure
Length of Test 06 to 30 Minutes
Time to Administer 10 minutes
Number of Items 12 items
Equipment Required 50cm-high examination table (e.g. Bobath plane)
Stop watch
Pen
Training Required No specific manual or training required, but it is essential that the clinician using the scale must be aware of balance impairments and safety issues following stroke
Type of training required No Training
For more information visit www.neuropt.org or email [email protected]
Cost Free
Actual Cost Cost of equipment
Age Range Adults
Administration Mode Paper/pencil
Diagnosis Stroke
Populations Tested Stroke patients
Standard Error of Measurement (SEM)
Chronic Stroke: (Liaw et al, 2008; n=52; mean age= 60.4(13.4);time since stroke onset = 6 to 292 months; Liaw et al, 2012; n = 52; mean age = 60.4 (13.4) years; time since stroke onset = 13.3-53.5 months)
• 1.14 points for PASS (Liaw et al, 2008) • 0.78 point for SFPASS (Liaw et al, 2012)
Acute Stroke: (Chien et al, 2007b; n=287; mean age= 65.5(11.3); 14 days post stroke)
• 2.4 points (+ 4.7 points, 95% CI)
Minimal Detectable Change (MDC)
Sub-acute Stroke: (Chien et al, 2007a; n=40; mean age=58.6+/-12.0)
• MDC at an individual score level: 2.22 points (95% CI) • MDC at a group score level: 0.50 points (95% CI)
Chronic Stroke:
• MDC of PASS: 3.2 points (Liaw et al, 2008) • MDC of SFPASS: 2.2 points (Liaw et al, 2012)
Acute Stroke: (Hsuen et al, 2013; n = 251; mean age 67.3 + 10.9; 14 and 30 days post stroke)
• MDC mean individual ratio of PASS 1.8; SD= 1.7 (95% CI)
Minimally Clinically Important Difference (MCID)
Not Established
Cut-Off Scores Acute Stroke: (Huang et al, 2016; n = 341; mean age = 63 (13.28) for ambulatory group and 69 (13.83) for non-ambulatory group; mean time since stroke = 26.22 (30.30) day s for ambulatory group and 31.05 (39.42) days for non-ambulatory group; Taiwanese study)
• 3.5 points for static PASS (sensitivity 77.9%, specificity 82.1%)
For more information visit www.neuropt.org or email [email protected]
• 8.5 points for dynamic PASS (sensitivity 77.9%, specificity 82.5%) • 12.5 points for total PASS (sensitivity 78.9%, specificity 83.7%)
Normative Data Healthy older adults: (Benaim et al, 1999; n=30; mean age= 63.3+/- 1.5 years)
• Mean PASS score =35.7 points, range= 32 to 36 points
Test-retest Reliability Chronic Stroke:
• Excellent test-retest reliability (Intra Class Coefficient (ICC)=0.84) (Chien et al, 2007a)
• Excellent relative test-retest reliability (ICC=0.97) over 7 days (Liaw et al, 2008)
• Excellent test-retest reliability in SFPASS (ICC = 0.93) (Liaw et al, 2012)
Interrater/Intrarater Reliability
Interrater reliability:
Acute/Subacute Stroke: (Benaim et al, 1999; n=12; 30 and 90 days post stroke)
• Adequate to excellent inter-rater reliability for individual items (average alpha=0.88, range 0.64-1)
• Excellent inter-rater reliability for total score (r=0.99, p<0.001) Acute Stroke: (Mao et al, 2002; n=112;mean age=69.3+/-11.2; 14 days post stroke)
• Adequate to excellent inter-rater reliability for individual items(median alpha=0.88, range 0.61-0.96)
• Excellent inter-rater reliability (ICC=0.97, 95% confidence interval (CI 0.95-0.98)) for total score.
Acute Stroke: (Hsieh et al, 2002; n=169; mean age= 66.8(11.3))
• Excellent inter-rater reliability of the trunk control items (PASS-TC: items 1,6,7,8,9 ICC =0.97)
Intrarater reliability:
Acute/Subacute Stroke: (Benaim et al, 1999)
• Good intrarater reliability for individual items (average k=0.72, range 0.45-1)
For more information visit www.neuropt.org or email [email protected]
• Excellent intrarater reliability for total score (r=0.98, p<0.001)
Internal Consistency Stroke:
• Excellent internal consistency o Cronbach’s alpha= 0.95 (Benaim et al, 1999-
acute/subacute) o Cronbach’s alpha= 0.94-0.96 at 14, 30, 90 and 180 days
post stroke (Mao et al, 2002) o Cronbach’s alpha= 0.93-0.94 (Hseih et al, 2002-acute) o Cronbach’s alpha= 0.96 (Chien et al, 2007b-acute)
Criterion Validity (Predictive/Concurrent)
Concurrent validity:
Acute Stroke: (Mao et al, 2002)
• Excellent relationship with Fugl-Meyer Assessment modified balance scale (FMA-B) (p=0.95-0.97) and Berg Balance Scale (BBS) (p=0.92-0.95)
Acute/Subacute Stroke: (Wang et al,2004; n=77; mean age= 59.8(11.9);14, 30 and 90 days post stroke)
• Excellent relationship between all measures (PASS, PASS-3P, BBS and BBS-3P) (rho>/=0.91, P<0.0001)
• Excellent relationship with BBS (p=0.94,P<0.0001) and with PASS-3P (p=0.94,P<0.0001; ICC=0.97, 95%CI 0.96-0.98)
Acute Stroke: (Chien et al, 2007b)
• Excellent relationship with the SFPASS (ICC=0.98;96% variance) in 287 individuals at 14 days post stroke
• Excellent relationship with the SFPASS (ICC=0.98) in 179 individuals with stroke
Acute Stroke: (Di Monaco et al, 2010; n=60; mean age= 68.0(12.2); mean time post stroke= 21.4 (13.3)days)
• Excellent relationship with the Trunk Impairment Scale (TIS) (p=0.849, P<0.001)
Predictive validity:
Acute/Subacute Stroke: (Benaim et al, 1999)
For more information visit www.neuropt.org or email [email protected]
• Good predictive validity of PASS total score (r=0.75,p<0.001), transfer items (r=0.74,p<0.006) and locomotion items (r=0.71,p<0.001) at 30 days post stroke when compared with Functional Independence measure (FIM) scores at 90 days post stroke
Acute Stroke: (Mao et al, 2002)
• Excellent predictive validity of PASS (p=0.86-0.90) at 14, 30 and 90 days post stroke when compared with the walking subscale of the Motor Assessment Scale at 180 days post stroke
Acute Stroke: (Hsieh et al, 2002)
• Excellent predictive validity of the trunk control items of PASS (PASS-TC: items 1,6,7,8,9) (r=0.68,p<0.001) at 14 days post stroke when compared with Barthel Index (BI) and Frenchay Activities Index (FAI) at 6 months post stroke
Stroke: (Wang et al, 2004;n=226 and n=202;14 and 30 days post stroke)
• Excellent predictive validity of PASS and modified PASS that used 3-level scale (12-item PASS-3P) at 14 days (p=0.78) and 30 days (p=0.82) post-stroke when compared with BI scores at 90 days post-stroke
Acute Stroke: (Chien et al, 2007b)
• Adequate predictive validity of PASS (r=0.49) and SFPASS (r=0.48) at 14 days post-stroke when compared with BI scores at 90 days post-stroke
• Excellent predictive validity of PASS (r=0.83) and SFPASS (0.82) on replication of the process in 179 individuals following stroke on admission to rehabilitation with BI scores on discharge from hospital
Acute Stroke: (Di Monaco et al, 2010)
• Excellent predictive validity of PASS (p=0.687,p<0.001)on admission to inpatient rehabilitation when compared with FIM discharge scores
Acute Stroke: (Yu et al, 2012; n=85; mean age = 65 (11.6) years, mean time since stroke onset = 19 (5-79) days)
• Sufficient predictive validity of PASS, when compared with BI (r2=0.39,p<0.001) and Stroke Rehabilitation Assessment of
For more information visit www.neuropt.org or email [email protected]
Movement mobility subscale (MO-STREAM) (r2=0.63,p<0.001 ) discharge scores
Acute Stroke (Yu et al., 2013); n=66; mean age: 63.1 yrs (12.2); 18 days (6-64) post stroke
• Predictive validity of PASS at rehab admission compared to Barthel Index at Discharge (mean = 31 days (6-76); r=0.69 (p<0.001)
• Predictive validity of PASS at rehab admission compared to MO-STREAM at Discharge (mean = 31 days (6-76); r=0.80 (p<0.001)
Construct Validity (Convergent/Discriminant)
Acute/Subacute Stroke: (Benaim et al, 1999)
• Excellent correlations between PASS and FIM total score (r=0.73), transfer tasks (r=0.82) and locomotor tasks (r=0.73); and motricity scores of lower limb (r=0.78) and upper limb (r=0.63)
• Adequate negative correlations with the star cancellation test of spatial inattention (r=0.53) and lower limb pressure sensitivity (r=0.45) as well as upper limb pressure sensitivity (r=0.42)
• Adequate negative correlations with measurement of postural stabilization (r=0.48) and postural orientation with respect to gravity (r=0.36) (Benaim et al, 1999; n=31; 90 days post stroke)
Acute Stroke: (Mao et al, 2002)
• Excellent convergent validity between PASS and BI (p= 0.88-0.92) Acute Stroke: (Hsieh et al, 2002)
• Excellent convergent validity of PASS-TC with BI (r=0.89) and with the Fugl-Meyer balance test (FM-B) (r=0.73)
Stroke: (Wang et al, 2004)
• Excellent convergent validity of the PASS and PASS 3P with BI (p=0.84, p= 0.82 respectively)
Acute Stroke: (Chien et al,2007b)
• Excellent correlations between the PASS, SF PASS and BI, (PASS R=0.87; SFPASS r=0.86) and between the PASS, SFPASS and FIM (PASS r=0.75; SFPASS r=0.75)
For more information visit www.neuropt.org or email [email protected]
Acute stroke: (Chinsongkram et al, 2014; n =70, mean age = 57 (12.24) years; mean time since stroke = 1.11 (2.00) month; Thai study)
• Excellent convergent validity with BESTest (r = 0.96) Chronic stroke: (Lin et al, 2010; n = 45, mean age = 60 ± 12.6 years; mean time since stroke = 9 (3-22) months; tested after 1 week, 2 months and 5 months of outpatient therapy; Taiwanese study)
• Moderate to high convergent validity (ρ) with DGI, DGI-4, and FGA Time point of assesement
PASS vs DGI PASS vs DGI-4 PASS vs FGA
1st wk of therapy
0.85 0.75 0.83
2 mos after therapy
0.76 0.74 0.75
5 mos after therapy
0.83 0.78 0.83
Subacute Stroke: Huang et al., 2016; n=341; mean days post stroke = 34.40; retrospective study completed in Taiwan
PASS cut-off scores predictive of patient ambulation at discharge:
Scale Cut-off points
Non-Ambu-latory n, %
Ambu -latory n, %
Sensitivity/Specificity
ROC curve AUC
PPV
Static PASS
< 3.5 > 3.5
202; 59.2% 44; 12.9%
21; 6.2% 74; 21.7%
77.9%/ 82.1%
0.860 0.627
Dynamic PASS
< 8.5 > 8.5
203; 59.5% 43; 12.6%
21; 6.2% 74; 21.7%
77.9%/ 82.5%
0.876 0.632
Total PASS
< 12.5 > 12.5
206; 60.4% 40; 11.7%
20; 5.9% 75; 22%
78.9%/ 83.7%
0.884 0.652
p-value for all < 0.001 AUC = Area Under Curve PPV = positive predictive value
Content Validity Not established
For more information visit www.neuropt.org or email [email protected]
Face Validity Not established
Floor/Ceiling Effects Acute/Subacute Stroke: (Benaim et al, 1999; n=58; 30 and 90 days post stroke )
• Large ceiling effects at 90 days post stroke (38%) Acute Stroke: (Mao et al, 2002;14, 30, 90 and 180 days post stroke)
• Adequate floor and ceiling effects at all time points (floor effect range 2.2-3.8%; ceiling effect range 3.3-17.5%)
Acute stroke: (Chinsongkram et al, 2014)
• Significant ceiling effect (37.1% of patients received a score within the top 10% of the PASS)
Acute Stroke: (Hsueh et al, 2013; n = 251; mean age = 68.4 (10.4) years; assessed at 14 and 30 days after stroke onset on PASS and SFPASS; Taiwanese study)
• No floor/ceiling effects for PASS (0-7.2%) • Notable floor effect (21.9%) for SFPASS at 14 days after stroke
onset (but not at 30 days after stroke onset-12.7%) • No ceiling effect (0-14.3%) for SFPASS
Acute Stroke (Yu et al., 2013); n=66; mean age: 63.1 yrs (12.2); 18 days (6-64) post stroke
• Negligible to small ceiling effect at rehabilitation admission (1.5%) and at rehabilitation discharge (6.1%)
• No floor effect at rehabilitation admission (0%) or discharge (0%) Acute Stroke: (Yu et al, 2012)
• No notable floor or ceiling effect at admission (< 15%)
Responsiveness Acute Stroke: (Mao et al, 2002)
• Large responsiveness of PASS from 14-30 days (Effect Size (ES)=0.89)
• Moderate responsiveness from 30-90 days (ES=0.64) • Low responsiveness from 90-180 days (ES=0.31)
For more information visit www.neuropt.org or email [email protected]
• Large overall responsiveness from 14-180 days (ES=1.12) • Large responsiveness from 14-180 days (ES=1.54) in severe stroke
Acute Stroke (Yu et al., 2013); n=66; mean age: 63.1 yrs (12.2); 18 days (6-64) post stroke
• Large responsiveness between rehab admission and discharge (mean = 31 days (6-76); ES=0.86; SRM=1.23
Stroke: (Wang et al, 2004; n=202 and n=167; 14,30and 90 days post stroke)
• Large responsiveness of the PASS and PASS-3P from 14-30 days post stroke (Standard Response Mean (SRM) =0.84 and 0.86 respectively) and from 14-90 days post stroke (SRM=1.02 and 1.04 respectively)
• Moderate responsiveness from 30-90 days post stroke (SRM=0.65 and 0.67 respectively)
• Moderate responsiveness of PASS and PASS-3P (PASS SRM range 0.43-0.78; PASS-3P SRM range 0.46-0.78) in individuals with mild stroke (Fugl Meyer motor assessment (FM) score of 80 or greater)
• Moderate to large responsiveness (PASS SRM range 0.52-1.12; PASS -3P SRM range 0.56-1.19) in individuals with moderate stroke (FM score 36 to 79)
• Large responsiveness (PASS SRM range 0.92-1.35; PASS-3P SRM range 0.92-1.34) in individuals with severe stroke (FM score 0 to 35)
• Large responsiveness of both measures in the period of 14-30 days and 14-90 days post stroke as compared to 30-90 days post stroke.
Sub-acute Stroke: (Chien et al, 2007a)
• Small responsiveness of the PASS (d=0.41) over an interval of 2 weeks
Acute Stroke: (Chien et al, 2007b)
• Small responsiveness of the PASS (ES=0.42) • Small responsiveness of the PASS (ES=0.43) (Chien et al, 2007b;
n=179 ; admission to rehabilitation to discharge from hospital) Acute Stroke: (Yu et al, 2012)
• Adequate internal responsiveness of PASS(d=0.87)
For more information visit www.neuropt.org or email [email protected]
• Sufficient external responsiveness (ic=0.44, r2=0.20, p<0.001), (ic=0.77, r2=0.59, p<0.001) to changes in function (BI changes scores) and changes in mobility (MO-STREAM change scores)
Acute Stroke: (Hsueh et al, 2013)
• Group level responsiveness: moderate to large responsiveness (0.46-0.91) for both PASS and SFPASS
• Individual patient-level responsiveness: PASS more responsive than SFPASS in that PASS detected significantly greater proportion of participants showing significant improvement than SFPASS (53% versus 43% respectively)
Professional Association Recommendations
American Physical Therapy Association (APTA) Neurology section’s Stroke Taskforce (StrokEDGE II) recommendations on a 4 point scale-
4= highly recommended; the outcome has excellent psychometric properties and clinical utility
3= recommended; the outcome measure has good psychometric properties and good clinical utility
2= unable to recommend at this time; there is insufficient information to support a recommendation of this outcome measure
1= not recommended; the outcome measure has poor psychometric properties and/or poor clinical utility
Practice setting
Acute IP Rehab Home SNF OP StrokEDGE II 4 4 4 4 4
Patient Acuity
Acute Sub-acute Chronic StrokEDGE II 4 1-3 (most
appropriate within 90 days)
1
Education
For more information visit www.neuropt.org or email [email protected]
Students should learn to administer tool
Students should be exposed to tool
Do not recommend
StrokEDGE II
x Research Use
Appropriate for research purposes
Not appropriate for research purposes
StrokEDGE II X (acute stroke only)
Considerations This scale is easy to administer with no special requirement.
Any clinician can easily, rapidly and confidently administer the scale.
However, the clinician must have the understanding of balance impairments and safety issues that are seen following stroke.
It is more sensitive for assessment of stroke in the first 3 months.
Bibliography Benaim C, Pérennou DA, Villy J, Rousseaux M, Pelissier JY. Validation of a standardized assessment of postural control in stroke patients: the Postural Assessment Scale for Stroke Patients (PASS). Stroke. 1999;30(9):1862-8.
Chien CW, Hu MH, Tang PF, Sheu CF, Hsieh CL. A comparison of psychometric properties of the smart balance master system and the postural assessment scale for stroke in people who have had mild stroke. Arch Phys Med Rehabil. 2007a;88(3):374-80.
Chien CW, Lin JH, Wang CH, Hsueh IP, Sheu CF, Hsieh CL. Developing a Short Form of the Postural Assessment Scale for people with Stroke. Neurorehabil Neural Repair. 2007b;21(1):81-90.
Chinsongkram B, Chaikeeree N, Saengsirisuwan V, Viriyatharakij N, Horak FB, Boonsinsukh R. Reliability and validity of the Balance Evaluation Systems Test (BESTest) in people with subacute stroke. Physical therapy. 2014;94(11):1632-43.
Di monaco M, Trucco M, Di monaco R, Tappero R, Cavanna A. The relationship between initial trunk control or postural balance and inpatient
For more information visit www.neuropt.org or email [email protected]
rehabilitation outcome after stroke: a prospective comparative study. Clin Rehabil. 2010;24(6):543-54.
Hsieh CL, Sheu CF, Hsueh IP, Wang CH. Trunk control as an early predictor of comprehensive activities of daily living function in stroke patients. Stroke. 2002;33(11):2626-30.
Hsueh IP, Chen KL, Chou YT, Wang YH, Hsieh CL. Individual-level responsiveness of the original and short-form postural assessment scale for stroke patients. Physical therapy. 2013;93(10):1377-82.
Huang YC, Wang WT, Liou TH, Liao CD, Lin LF, Huang SW. Postural Assessment Scale for Stroke Patients Scores as a predictor of stroke patient ambulation at discharge from the rehabilitation ward. Journal of rehabilitation medicine. 2016;48(3):259-64.
Liaw LJ, Hsieh CL, Hsu MJ, Chen HM, Lin JH, Lo SK. Test-retest reproducibility of two short-form balance measures used in individuals with stroke. Int J Rehabil Res. 2012;35(3):256-62.
Liaw LJ, Hsieh CL, Lo SK, Chen HM, Lee S, Lin JH. The relative and absolute reliability of two balance performance measures in chronic stroke patients.Disabil Rehabil. 2008;30(9):656-61.
Lin JH, Hsu MJ, Hsu HW, Wu HC, Hsieh CL. Psychometric comparisons of 3 functional ambulation measures for patients with stroke. Stroke; a journal of cerebral circulation. 2010;41(9):2021-5.
Mao HF, Hsueh IP, Tang PF, Sheu CF, Hsieh CL. Analysis and comparison of the psychometric properties of three balance measures for stroke patients. Stroke. 2002;33(4):1022-7.
Persson CU, Hansson PO, Danielsson A, Sunnerhagen KS. A validation study using a modified version of Postural Assessment Scale for Stroke Patients: Postural Stroke Study in Gothenburg (POSTGOT). J Neuroeng Rehabil. 2011;8:57.
Wang CH, Hsueh IP, Sheu CF, Yao G, Hsieh CL. Psychometric properties of 2 simplified 3-level balance scales used for patients with stroke. Phys Ther. 2004;84(5):430-8.
For more information visit www.neuropt.org or email [email protected]
Yu WH, Hsueh IP, Hou WH, Wang YH, Hsieh CL. A comparison of responsiveness and predictive validity of two balance measures in patients with stroke. J Rehabil Med. 2012;44(2):176-80.
Yu WH, Chen KL, Chou YT, Hsueh IP, Hsieh CL. Responsiveness and predictive validity of thehierarchical balance short forms in people with stroke. Physical therapy. 2013;93(6):798-808.
Available at: http://www.brightonrehab.com/wp-content/uploads/2012/02/Postural-Assessment-Scale-for-Stroke-Patients-PASS. Accessed September 25, 2014.
Available at: http://www.neuropt.org/docs/edge-documents/finalstroke-edge-recommendations-spread-sheet?sfvrsn=6. Accessed September 17, 2014.
Available at: http://www.neuropt.org/professional-resources/neurology-section-outcome-measures-recommendations/stroke. Accessed September 25, 2014.
Available at: http://www.physio-pedia.com/Postural_Assessment_Scale_for_Stroke. Accessed September 20, 2014.
Available at: http://strokengine.ca/assess/module_pass_indepth-en.html. Accessed September 27, 2014.
Available at: http://strokengine.ca/assess/module_pass_psycho-en.html. Accessed September 27, 2014.
For more information visit www.neuropt.org or email [email protected]
Link to instrument
Title of Assessment Borg Rating Scale of Perceived Exertion
Acronym RPE
Instrument Reviewer(s) Developed by: Gayatri Mathur, PT; Updated by: Jill Smiley, MPH
Reviewed by Patricia Kluding, PhD, PT of the StrokEdge task force, Neurology Section, APTA in 2010; Updated by Dorian Rose, PhD, PT of the StrokEdge II task force, Neurology Section, APTA in 2017
Summary Date 7/13/2012; 1/28/17
Purpose Used as a means to determine intensity of exercise
Description • A 15-point category scale with verbal descriptors to standardize perceived exertion across tasks and individuals.
• Instructions for use: scale used to rate how hard person is working, explain 6=rest, 20=absolute maximum, grade effort using numbers and/or words.
• Used as a measure for training intensity and outcomes for exercise - parallels physiological variables.
• Many authors suggest carrying afferent input to RPE but as yet there is no consensus in the literature as to what they are/what their effects may be (Hampson et al '01)
• For any individual capable of exercising
Area of Assessment Aerobic Capacity; Gait
Body Part Not Applicable
ICF Domain Body Function
Domain
Assessment Type Physiological
Length of Test 06 to 30 Minutes
For more information visit www.neuropt.org or email [email protected]
Time to Administer Time for initial explanation, instant feedback from patient
Number of Items 15-point category scale
Equipment Required Printed copy of 6-20 scale with numbers and words for descriptors
Training Required Read American College or Sports Medicine guidelines, textbook or article.
Type of training required Read American College or Sports Medicine guidelines, textbook or article.
Cost Free
Actual Cost Free
Age Range Preschool Child: 2-5 years; Child: 6-12 years; Adolescent: 13-17 years; Adult: 18-64 years; Elderly adult: 65+
Administration Mode Verbal Response by looking at available numerical range with corresponding definition of “how hard are you working” scorecard
Diagnosis Cardiac Conditions; Geriatrics; Multiple Sclerosis; Spinal Cord Injury; Stroke
Populations Tested • Healthy
• Blind
• Active and sedentary
• Adolescents
• Cardiac
• Neurological
• Elderly
Standard Error of Measurement (SEM)
Well-trained Males: (Doherty, 2001; n=15; 30s of the subpraximal run for each test)
• 30 seconds: SEM = 0.79 (0.49-1.16)
• 60 seconds: SEM = 0.78 (0.50-1.12)
• 90 seconds: SEM = 0.80 (0.51-0.99)
• 120 seconds: SEM = 0.76 (0.47-0.93)
For more information visit www.neuropt.org or email [email protected]
Minimal Detectable Change (MDC)
Not reported
Minimally Clinically Important Difference (MCID)
Not reported
Cut-Off Scores Not reported
Normative Data Not reported
Test-retest Reliability Frail older adults:
• (Mendelssohn et al, 2008)
o HR & METs ICC=0.85-0.91
Healthy adults:
• (Lamb et al., 1999) Test-retest reliability is variable in studies of healthy subjects, with ICC values of 0.75-0.82
Stroke:
Not reported in stroke, however, one study (Eng et al, 2002; n=25; 4.4±3.0 yrs) assessed RPE in people with stroke at minute 6 during a 6-minute walk test and a 12-minute walk test in the same subjects, with almost identical mean values (11.6 and 11.7) for the 2 assessments, as would be expected if test-retest reliability was high
Interrater/Intrarater Reliability
Interrater Reliability:
In Braille:
• (Buckley et al, 2000)
o interrater reliability: good
Adolescent females:
• (Pfeiffer, 2002)
o ICC=0.78
Intrarater Reliability:
For more information visit www.neuropt.org or email [email protected]
Healthy subjects:
• (Eston et al, 2006)
o Predicted VO2 max from RPE ICC 0.66-0.95
o No gender differences
• (Lamb et al, 1999)
o ICC = 0.75-0.82
• (Eston and Williams, 1988)
o Between trials ICC=0.83 or higher
Internal Consistency
Criterion Validity (Predictive/Concurrent)
Concurrent Validity:
(Eng et al., 2002; n=25; 4.4±3.0 yrs)
• RPE poorly correlated with 6 MWT and 12 MWT distance in people with stroke.
(Tseng et al., 2010; n=21; 4.1±3.5 yrs)
• Strong correlation between RPE and ratings of exertion fatigue on a visual analog scale following exercise (r=0.8, p=0.00) in people with stroke.
RPE accross the Lifespan:
(Groslambert and Mahon, 2006)
• Children 3-7 years; poor
• 8-12 years; variable
• 13+ years similar to adults - good to excellent
• 50-65, >65 no significant age effect on validity
Criterion Validity:
For more information visit www.neuropt.org or email [email protected]
• Chen, et al 2002)
A meta-analysis of criterion-related validity between RPE and physiological measures in healthy individuals (mean age of subjects in studies was 32.7; range 9 to 75 years).
Range of mean validity coefficients with RPE:
Heart rate
Blood lactate
VO2max or VO2
Ventilation
Resp rate
0.47-0.61
0.42-0.69
0.31-0.76
0.53 0.67
Strongest relationships were noted in highly fit male participants at high (maximal) exertion.
Predictive Validity
The RPE scale (with rating of 6 to 20) was developed so heart rate could be predicted by multiplying the RPE by 10 (Borg, 1982).
(Eng et al., 2002; n=25; 4.4±3.0 yrs)
In stroke, predicted HR based on RPE was significantly higher than the actual HR during 6 minute and 12 minute walk tests, and predicted and actual HR were not correlated
Construct Validity (Convergent/Discriminant)
Not reported
Content Validity Sage et al., 2013. 37 patients post-stroke (14.5±10.2 days post-stroke). Respiratory gas exchange was monitored for analysis of VO2 while completing a graded maximal exercise test, while HR and RPE (Borg CR10 Scale) were measured at the end of each minute. 76.2%, 69.0%, and 38.9% of participants fell into the expected RPE range at each intensity. RPE appears to be a reasonable indicator of exercise intensity after stroke at moderate (60%-70% VO2peak) but not high intensity exercise (80% V02peak).
Face Validity Not reported
For more information visit www.neuropt.org or email [email protected]
Floor/Ceiling Effects Not reported
Responsiveness Not reported
Professional Association Recommendations
Recommendations for use of the instrument from the Academy of Neurologic Physical Therapy of the American Physical Therapy Association’s Stroke Taskforce (StrokEDGE II), are listed below. These recommendations were developed by a panel of research and clinical experts using a modified Delphi process.
For detailed information about how recommendations were made, please visit: http://www.neuropt.org/go/healthcare-professionals/neurology-section-outcome-measures-recommendations
Abbreviations:
HR Highly Recommend
R Recommend
LS / UR
Reasonable to use, but limited study in target group / Unable to Rec
NR Not Recommended
Recommendations for use based on acuity level of the patient:
Acute
(CVA < 2 months post)
Subacute
(CVA 2 to 6 months)
Chronic
(> 6 months)
StrokEDGE II
NR R R
See considerations below.
Recommendations based on level of care in which the assessment is taken:
Acute Care
Inpatient Rehabilitation
Skilled Nursing Facility
Outpatient
Rehabilitation
Home Health
For more information visit www.neuropt.org or email [email protected]
StrokEDGE II
R R R R R
See considerations below.
Recommendations for entry-level physical therapy education and use in research:
Students should learn to administer this tool? (Y/N)
Students should be exposed to tool? (Y/N)
Appropriate for use in intervention research studies? (Y/N)
Is additional research warranted for this tool (Y/N)
StrokEDGE II
No Yes No Yes
See considerations below.
Considerations This test of perceived exertion may give useful information about fatigue during an activity, but lack of established research on test-retest reliability and low validity to physiologic measures are significant concerns. The research indicates that this scale may not be appropriate as an outcome measure, may not be useful as a substitute for other measures of endurance, and may not be appropriate to guide exercise prescription in people with stroke.
Not recommended except as a measure of perceived fatigue during an activity
Do you see an error or have a suggestion for this instrument summary? Please e-mail us!
Bibliography
Eng JJ, Chu KS, Dawson AS, Kim CM, Hepburn KE. Functional walk tests in individuals with stroke: Relation to perceived exertion and myocardial exertion. Stroke. 2002;33:756-761. Find it on PubMed
Lamb K, Eston R, Corns D. Reliability of ratings of perceived exertion during progressive treadmill exercise. Br J Sports Med. 1999;33(5):336-339. Find it on PubMed
Tseng BY, Gajewski BJ, Kluding P. Reliability, responsiveness, and validity of the Visual Analog Fatigue Scale to measure exertion fatigue in
For more information visit www.neuropt.org or email [email protected]
people with chronic stroke: A preliminary study. Stroke Res Treat. 2010;2010:7 pages. Find it on PubMed
Chen M, Fan X, Moe S. Criterion-related validity of the Borg rateings of perceived exertion scale in healthy individuals: a meta-analysis. J Sports Sci. 2002;20:873-899. Find it on PubMed
Borg G. Pyschophysical bases of perceived exertion. Med Sci Sports Exerc. 1982;14(5):377-381. Find it on PubMed
Sage et al., 2013. Validity of Rating of Perceived Exertion Ranges in Individuals in the Subacute Stage of Stroke Recovery. Top Stroke Rehabil 20(6): 519-527. Find it on PubMed
Year published 1982
Instrument in PDF Format
Yes
Approval Status Pending
For more information visit www.neuropt.org or email [email protected]
Link to Instrument
Title of Assessment
Rivermead Assessment of Somatosensory Performance
Acronym RASP Instrument Reviewer(s)
Initial review completed by Jane Sullivan, Co-Chair of the Neurology Section’s StrokEdge Task Force; Updated by Dorian Rose, Co-Chair of the Neurology Section’s StrokEdge II Task Force
Summary Date(s)
9/29/2015; 1/21/17
Purpose The RASP is a multi-modal sensory tool that tests 6 sensations (sharp/dull discrimination, surface pressure, tactile localization, temperature discrimination, joint movement and joint movement direction discrimination), and 2 secondary sensations (sensory extinction and two-point discrimination).
Description
1. Sharp/dull discrimination: each Neurometer (one with sharp; one with dull Neurotip end showing) is applied to the test area in a pseudo-randomized order. A total of 60 trials are administered to 10 test regions. Twenty sham trials are given, two for each area. (The sham consists of the examiner moving the Neurometer to within 6 in of the patients’ skin surface and making the same audible sound with the instrument by applying it to his/her own hand.
2. Surface pressure touch: One Neurometer is set to Level 1 (15.5 g pressure) and is applied to designated testing areas for a total of 60 trials. Twenty sham trials are also included.
3. Surface localization: Using one Neurometer (Level 1; 15.5 g), the subject is requested to identify designated areas on their body where they have been touched.
4. Temperature discrimination: The Neurotemps are prepared prior to testing to ensure that the temperature settings are at the warmest of coolest end of the designated temperature window for each instrument. The patient indicates “warm” or “cold” when touched.
5. Joint movement: Examiner moves the following joints up and down in a random sequence: elbow thumb or finger, ankle, toe. Each joint I is moved six times. The examiner first evaluates subject’s appreciation of limb position movement by asking the patient to indicate if a passive movement to
6. Joint movement discrimination: Then the patient is asked to indicate “up” or “down.” 7. Bilateral touch discrimination (sensory extinction): Two Neurometers (Setting 2; 67.5 g) are
applied simultaneously and then separately to homologous testing areas on the hand or face. The patient is told they may feel either both areas touched together or a touch on the left or a touch on the right. They are requested to indicate what they feel.
8. Two-point discrimination: The Neurodisc is applied to the apds of the fingertips, perpendicular to the skin surface and depressed by approximately 1 mm briefly, before being released. The Neurodisc has three fixed distances of 3, 4,5 mm and a single point.
Area of Assessment
Sensation
Body Part Sensation is tested on the face, hand and foot (10 test regions, 5 of left; 5 on right side of body). ICF Domain
Body Structure/Function
Domain Sensation Assessment Type
Performance Measure
25. REHAB MEASURES: RIVERMEAD Somatosensory Performance Assessment
For more information visit www.neuropt.org or email [email protected]
Length of Test
20-45 minutes depending on the client’s level on sensory deficit
Time to Administer
20-45 minutes depending on the client’s level on sensory deficit
Number of Items
Eight items
Equipment Required
In an effort to improve reliability of sensory testing, custom equipment were developed for the test:
1. “Neurometer” – a pen shaped device that allows consistent amount of pressure to be applied to an area,
2. “Neurotemp” which has temperature displays standardization of temperature stimuli, and the
3. “Two-point neurodiscriminator” - a 4-pointed fixed distance discriminator used to test 2-point discrimination on the finger pads
Training Required
No training
Type of Training Required
No training
Cost £199.75 (Thames Valley Test Company) Actual Cost
£199.75
Age Range Adult Administration Mode
Paper & Pencil
Diagnosis Stroke Populations Tested
Stroke
Standard Error of Measurements (SEM)
Not reported
Minimal Detectable Change (MCD)
Not reported
Minimally Clinically Important Difference MCID)
Not reported
Cut-Off Scores
Winward et al 2002: Suggested impairment cut-off determined from testing 50 control participants. • Sharp/dull discrimination: less than 22 • Surface touch: less than 29 • Surface localization: less than 28 • Two-point discrimination: N/A • Temperature discrimination: less than 25 • Proprioceptive Movement discrimination: less than 28 • Proprioceptive direction discrimination: less than 28
Normative Data
Winward et al 2002: Data from 50 control participants
For more information visit www.neuropt.org or email [email protected]
Mean±SD (Range) provided • Sharp/dull discrimination: Left Side (26.6±2.6;18-30) Right Side (26.5±2.5; 21-30) • Surface touch: Left Side (29.9±0.3;28-30) Right Side (29.9±0.7; 25-30) • Surface localization: Left Side (29.9±0.4;18-30) Right Side (29.8±1.1; 22-30) • Two-point discrimination:
Right Hand – 3mm: n=16, 4mm: n=18, 5mm: n=14; Left Hand – 3mm: n=18, 4mm: n=15, 5mm: n=16
• Temperature discrimination: Left Side (28.4±1.7;24-30) Right Side (28.6±1.8; 23-30) • Proprioceptive Movement discrimination: Left Side (29.9±0.8;24-30) Right Side (30±0.1; 29-
30) • Proprioceptive direction discrimination: Left Side (29.8±0.9;24-30) Right Side (29.8±0.9; 24-
30)
Test-Retest Reliability
Sub-Acute Stroke: (Winward et al 2002; n=100; 4-6 weeks post-stroke) • Total RASP score: Pearson correlation, r=0.92 • Sharp/dull subtest: Pearson correlation, r=0.84 • Surface pressure touch subtest: Pearson correlation, r=0.90 • Surface localization subtest: Pearson correlation, r=0.96 • Temperature subtest: Pearson correlation, r=0.84 • Proprioceptive movement subtest: Pearson correlation, r=0.83 • Proprioceptive direction subtest: Pearson correlation, r=0.50
Interrater/Intrarater Reliability
Sub-Acute Stroke: (Winward et al 2002; n=100; 4-6 weeks post-stroke) • Total RASP score: Pearson correlation, r=0.92
Internal Consistency
Not reported
Criterion Validity (Predictive/Concurrent)
Sub-Acute Stroke: (Winward et al 2002; n=100; 4-6 weeks post-stroke) Motricity Index and proprioception movement: Spearman r=0.31; (p<0.01) Motricity Index and proprioception direction detection: Spearman r=0.36; (p<0.01) Barthel Index and proprioception movement: Spearman r=0.35; (p<0.01) Barthel Index and proprioception direction detection: Spearman r=0.41; (p<0.01)
Construct Validity (Convergent/Discriminant)
Sub-Acute Stroke: Winward et al 2002 Discriminated significantly between people with (n=100; 4-6 weeks post-stroke) and without (n=50) brain damage (p < 0.001).
Content Validity
Not statistically established; all sub-tests are drawn from traditional clinical tests.
Face Validity
Not statistically established; all sub-tests are drawn from traditional clinical tests.
Floor/Ceiling Effects
Not reported
Responsiveness
Not reported
Professional Association
Recommendations for use of the instrument from the Academy of Neurologic Physical Therapy of the American Physical Therapy Association’s Stroke Taskforce (StrokEDGE, StrokEDGE II), These
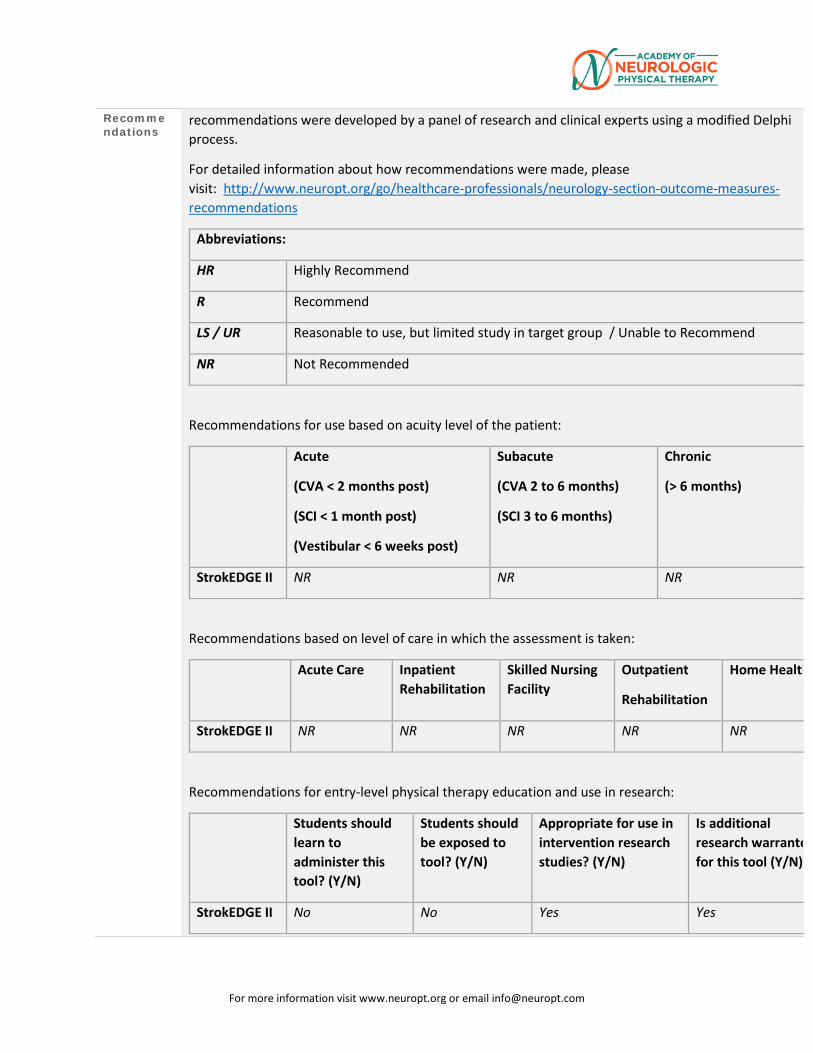
For more information visit www.neuropt.org or email [email protected]
Recommendations
recommendations were developed by a panel of research and clinical experts using a modified Delphi process.
For detailed information about how recommendations were made, please visit: http://www.neuropt.org/go/healthcare-professionals/neurology-section-outcome-measures-recommendations
Abbreviations:
HR Highly Recommend
R Recommend
LS / UR Reasonable to use, but limited study in target group / Unable to Recommend
NR Not Recommended
Recommendations for use based on acuity level of the patient:
Acute
(CVA < 2 months post)
(SCI < 1 month post)
(Vestibular < 6 weeks post)
Subacute
(CVA 2 to 6 months)
(SCI 3 to 6 months)
Chronic
(> 6 months)
StrokEDGE II NR NR NR
Recommendations based on level of care in which the assessment is taken:
Acute Care Inpatient Rehabilitation
Skilled Nursing Facility
Outpatient
Rehabilitation
Home Health
StrokEDGE II NR NR NR NR NR
Recommendations for entry-level physical therapy education and use in research:
Students should learn to administer this tool? (Y/N)
Students should be exposed to tool? (Y/N)
Appropriate for use in intervention research studies? (Y/N)
Is additional research warrante for this tool (Y/N)
StrokEDGE II No No Yes Yes
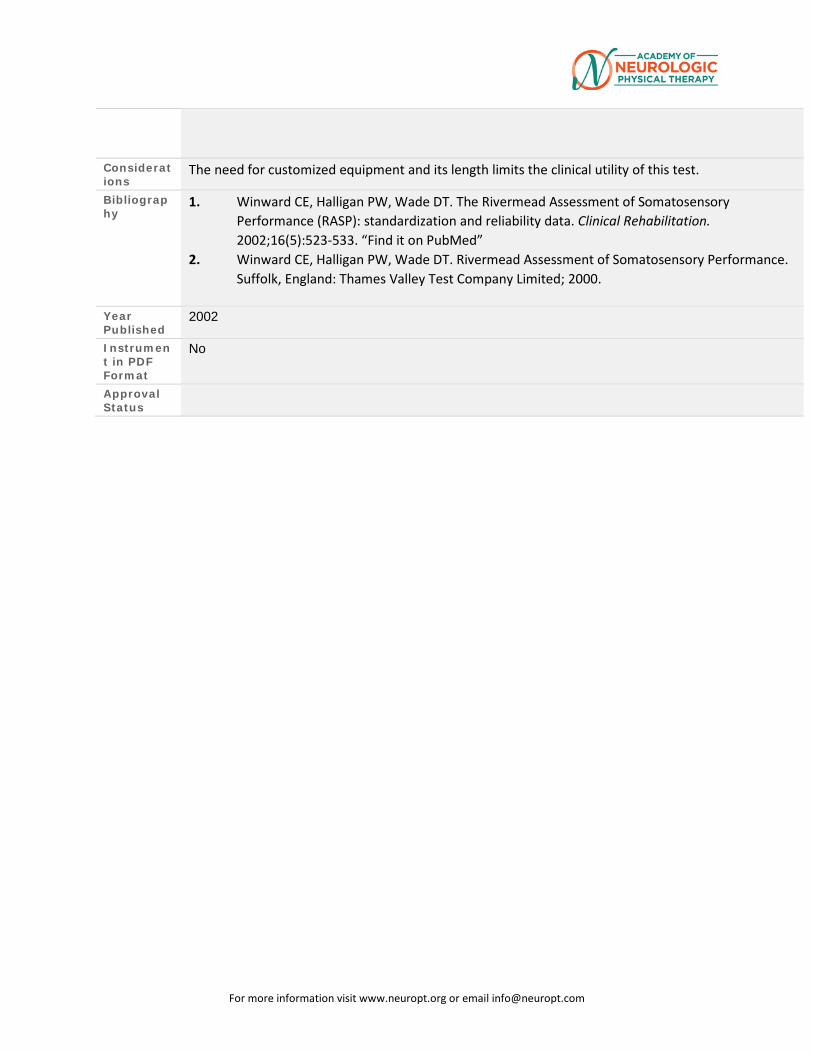
For more information visit www.neuropt.org or email [email protected]
Considerations
The need for customized equipment and its length limits the clinical utility of this test.
Bibliography
1. Winward CE, Halligan PW, Wade DT. The Rivermead Assessment of Somatosensory Performance (RASP): standardization and reliability data. Clinical Rehabilitation. 2002;16(5):523-533. “Find it on PubMed”
2. Winward CE, Halligan PW, Wade DT. Rivermead Assessment of Somatosensory Performance. Suffolk, England: Thames Valley Test Company Limited; 2000.
Year Published
2002
Instrument in PDF Format
No
Approval Status
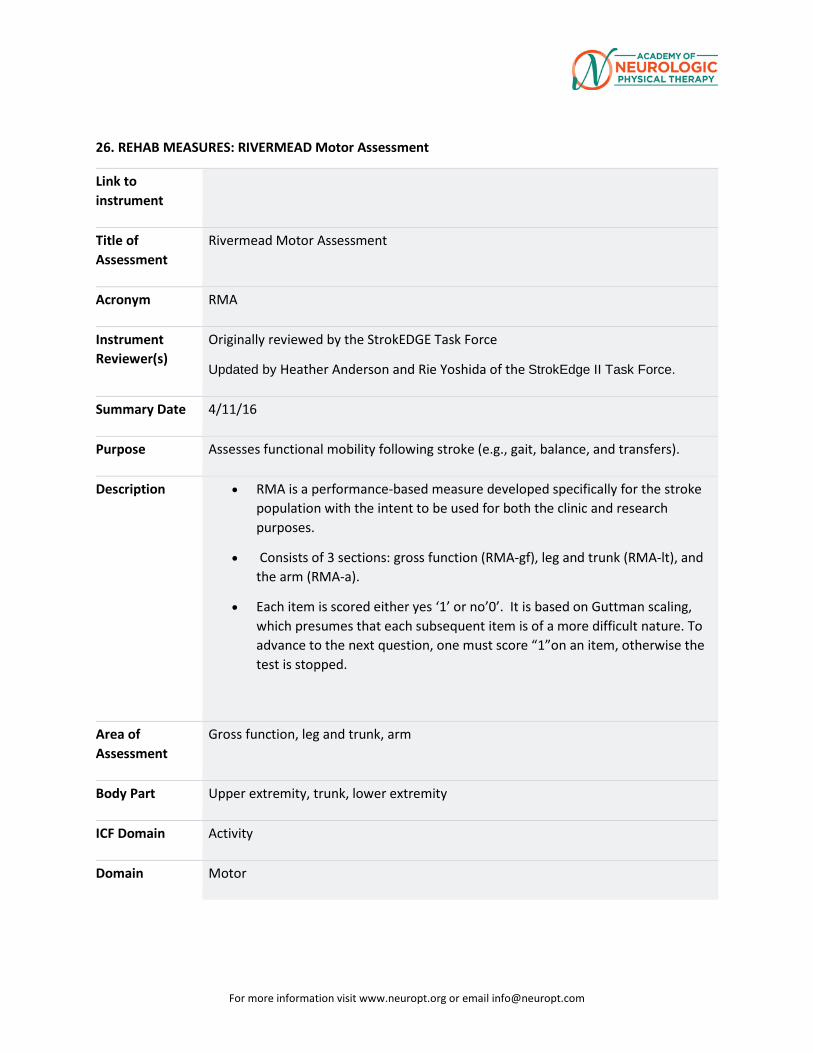
For more information visit www.neuropt.org or email [email protected]
26. REHAB MEASURES: RIVERMEAD Motor Assessment
Link to instrument
Title of Assessment
Rivermead Motor Assessment
Acronym RMA
Instrument Reviewer(s)
Originally reviewed by the StrokEDGE Task Force
Updated by Heather Anderson and Rie Yoshida of the StrokEdge II Task Force.
Summary Date 4/11/16
Purpose Assesses functional mobility following stroke (e.g., gait, balance, and transfers).
Description • RMA is a performance-based measure developed specifically for the stroke population with the intent to be used for both the clinic and research purposes.
• Consists of 3 sections: gross function (RMA-gf), leg and trunk (RMA-lt), and the arm (RMA-a).
• Each item is scored either yes ‘1’ or no’0’. It is based on Guttman scaling, which presumes that each subsequent item is of a more difficult nature. To advance to the next question, one must score “1”on an item, otherwise the test is stopped.
Area of Assessment
Gross function, leg and trunk, arm
Body Part Upper extremity, trunk, lower extremity
ICF Domain Activity
Domain Motor
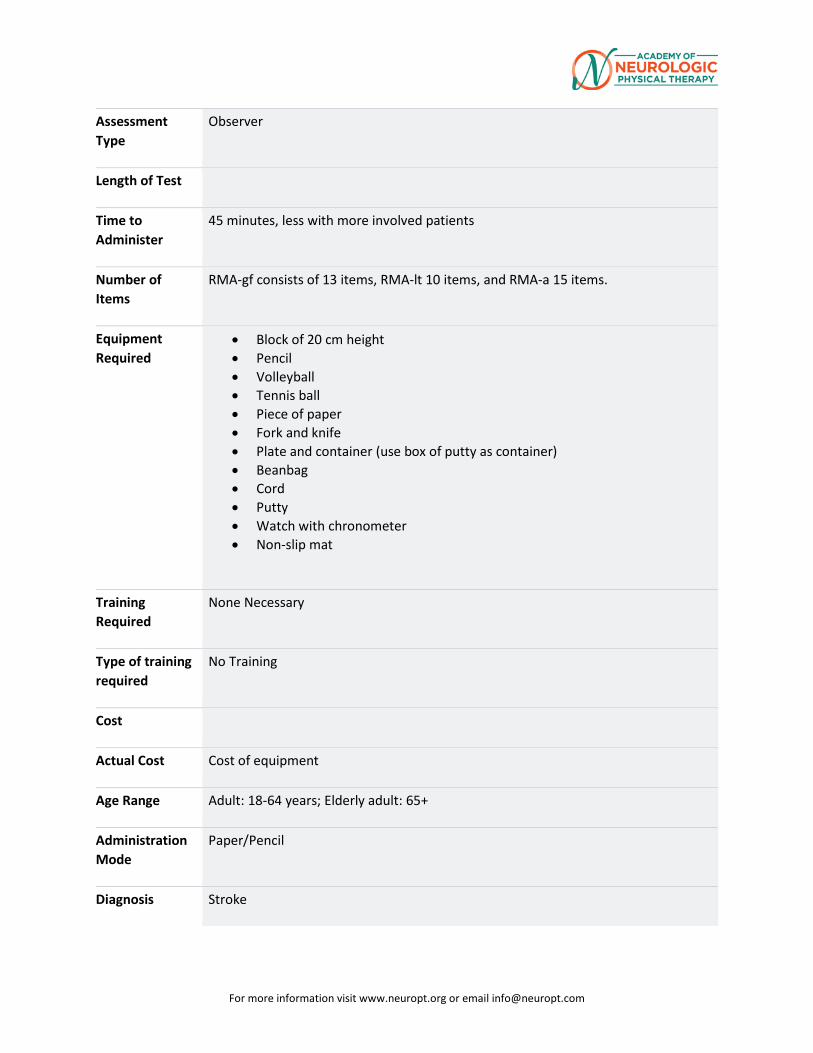
For more information visit www.neuropt.org or email [email protected]
Assessment Type
Observer
Length of Test
Time to Administer
45 minutes, less with more involved patients
Number of Items
RMA-gf consists of 13 items, RMA-lt 10 items, and RMA-a 15 items.
Equipment Required
• Block of 20 cm height • Pencil • Volleyball • Tennis ball • Piece of paper • Fork and knife • Plate and container (use box of putty as container) • Beanbag • Cord • Putty • Watch with chronometer • Non-slip mat
Training Required
None Necessary
Type of training required
No Training
Cost
Actual Cost Cost of equipment
Age Range Adult: 18-64 years; Elderly adult: 65+
Administration Mode
Paper/Pencil
Diagnosis Stroke
For more information visit www.neuropt.org or email [email protected]
Populations Tested
Stroke
Standard Error of Measurement (SEM)
Not Established
Minimal Detectable Change (MDC)
Not Established
Minimally Clinically Important Difference (MCID)
Collen et al. (1990) found that a 3 point change in the total RMA score represented a clinically meaningful change.
Cut-Off Scores Not Established
Normative Data Not Established
Test-retest Reliability
Stroke: (Lincoln and Leadbitter 1979)
Adequate test-retest reliability
• RMA-gf r=0.66 • RMA-lt r=0.93 • RMA-a r=o.88
Interrater/Intrarater Reliability
Not Established
Internal Consistency
Subacute Stroke: (Kurtais et al. 2009; n = 107; mean age = 62.4 (12.8) years; mean time since onset = 5.6 (SD = 11.2, range = 0.5-78) months; patients in inpatient rehabilitation unit)
Good internal consistency
• RMA-gf - Cronbach’s a= 0.93, ICC=0.88 • RMA-lt - Cronbach’s a= 0.88, ICC=0.84 • RMA-a - Cronbach a= 0.95, ICC=0.93
For more information visit www.neuropt.org or email [email protected]
Criterion Validity (Predictive/ Concurrent)
Concurrent Validity
Brain Injury: (Endres, et al. 1990)
• RMA has excellent correlation with BI across each assessment period initial (r=0.84), one month (0.78), and one year (0.63).
Chronic Stroke: (Rousseaux et al, 2012; n = 46; 14.1 + 25.9 mo after stroke)
Excellent validity with Upper Limb Assessment in Daily Living (ULADL): correlation of Global Questionnaire (Q) and Test scores (T) with Rivermead Gross Motor Assessment (RMA score) (r = 0.80 and 0.88, respectively; p < 10-4)
Predictive Validity
Collin and Wade (1990): low RMA scores at 6 weeks post stroke predicted poor prognosis to ambulate.
Construct Validity (Convergent/ Discriminant)
Acute to Subacute Stroke: (Soyuer and Soyuer 2005)
High convergent validity between total RMA and FIM
• 7-10 days post stroke: r = 0.87 for total FIM, r = 0.90 for motor FIM • 3 months post stroke: r = 0.88 for total FIM, r = 0.89 for motor FIM
Subacute Stroke: (Kurtais et al. 2009; n = 107; mean age = 62.4 (12.8) years; mean time since onset = 5.6 (SD = 11.2, range = 0.5-78) months; patients in inpatient rehabilitation unit)
Moderate to high external construct validity when compared to FIM score
Admission Discharge FIM Motor
FIM Self-Care
FIM Mobility
FIM Motor
FIM Self-Care
FIM Mobility
RMA-gf 0.865 0.815 0.844 0.820 0.757 0.817 RMA-lt 0.784 0.726 0.782 0.747 0.702 0.764 RMA-a 0.386 0.390 0.386 0.467 0.480 0.483
Spearman r, p<0.001
Chronic Stroke: (Van de Winckel et al. 2007; mean time since stroke onset ; 8 months; RMA-a only)
Investigated the construct validity and unidimentionality of the RMA-a. Four items were removed from the scale and 2 subsets were identified through statistical analysis to create a scale that fit the Rasch model. The revised RMA-arm section met criteria for validity and unidimensionality.
Acute-Subacute Stroke: (Houwink et al. 2011; n = 21; mean age = 61.7 ± 7.9 years; time since stroke onset = within 4 months; only used RMA-a)
For more information visit www.neuropt.org or email [email protected]
• Strong cross-sectional correlation of RMA-a with SULCS (Stroke Upper Limb Capacity Scale) with ρ = 0.85
• Moderate longitudinal correlation of RMA-a with SULCS (ρ = 0.48)
Content Validity Not Established
Face Validity Not Established
Floor/Ceiling Effects
TBI: Williams et al. 2006
A large ceiling effect was noted on the Gross Motor Function Subscale of the RMA when compared to HIMAT
Responsiveness Subacute Stroke: (Kurtais et al. 2009; n = 107; mean age = 62.4 (12.8) years; mean time since onset = 5.6 (SD = 11.2, range = 0.5-78) months; patients in inpatient rehabilitation unit)
Good sensitivity
• RMA-gf ES = 0.51, SRM = 0.83 • RMA-lt ES = 0.45, SRM = 0.86 • RMA-a ES = 0.61, SRM = 1.20
Professional Association Recommendations
Recommendations for use of the instrument from the Academy of Neurologic Physical Therapy of the American Physical Therapy Association’s Stroke Taskforce (StrokEDGE II) are listed below. These recommendations were developed by a panel of research and clinical experts using a modified Delphi process.
For detailed information about how recommendations were made, please visit: http://www.neuropt.org/go/healthcare-professionals/neurology-section-outcome-measures-recommendations
Abbreviations:
HR Highly Recommend
R Recommend
LS / UR Reasonable to use, but limited study in target group / Unable to Recommend
NR Not Recommended
For more information visit www.neuropt.org or email [email protected]
Recommendations for use based on acuity level of the patient:
Acute
(CVA < 2 months post)
Subacute
(CVA 2 to 6 months)
Chronic
(> 6 months)
StrokEDGE II
R R R
Recommendations based on level of care in which the assessment is taken:
Acute Care
Inpatient Rehabilitation
Skilled Nursing Facility
Outpatient
Rehabilitation
Home Health
StrokEDGE II
NR R R R NR
Recommendations for entry-level physical therapy education and use in research:
Students should learn to administer this tool? (Y/N)
Students should be exposed to tool? (Y/N)
Appropriate for use in intervention research studies? (Y/N)
Is additional research warranted for this tool (Y/N)
Strok EDGE II
No Yes Yes Yes
Considerations • Used extensively in research and clinic, primarily in Europe.
For more information visit www.neuropt.org or email [email protected]
• Designed for the stroke population and used primarily with that population. Gross motor section has been used with TBI and the elderly to a lesser extent.
• Several studies have noted that their results show the actual hierarchy of the test items to be different from the original test. Therefore, when administering the test, it is recommended that all items be tested rather than stopping the arm or gross functions test when 3 consecutive items are scored a “0”, as originally instructed.
Do you see an error or have a suggestion for this instrument summary? Please e-mail us!
Bibliography Collen FM, Wade DT, Bradshaw CM. Mobility after stroke: reliability of measures of impairment and disability. Int Disabil Stud. 1990; 12:6-9.
Collin, C., Wade, D. (1990). Assessing motor impairment after stroke: A pilot reliability study. Journal of Neurology, Neurosurgery, and Psychiatry, 53, 576-579.
Endres, M., Nyary, I., Banhidi, M., Deak, G. (1990). Stroke rehabilitation: A method and evaluation. International Journal of Rehabilitation Research, 13, 225-236.
Houwink A, Roorda LD, Smits W, Molenaar IW, Geurts AC. Measuring upper limb capacity in patients after stroke: reliability and validity of the stroke upper limb capacity scale. Archives of physical medicine and rehabilitation. 2011 Sep;92(9):1418-22.
Kurtais Y, Kucukdeveci A, elhan A, et al. Psychometric properties of the Rivermead Motor Assessment: its utility in stroke. J Rehabil Med 2009; 41: 1055-61.
Lincoln N, Leadbitter D. Assessment of moto function in stroke patients. Physiotherapy 1979; 65: 48-51.
Rousseaux M, Bonnin-Koang HY, Darne B, et al. Construction and pilot assessment of the Upper Limb Assessment in Daily Living Scale. Journal of neurology, neurosurgery, and psychiatry. 2012 Jun;83(6):594-600.
Soyuer F,Souyuer A. Ischemic stroke: Motor impairment and disability with relation to age and lesion location (Turkish). Journal of Neurological Sciences, 22(1), 43-49. (source: StrokEngine)
Van de Winckel Ann; Feys Hilde; Lincoln Nadina; De Weerdt Willy. Assessment of arm function in stroke patients: Rivermead Motor Assessment arm section revised with Rasch analysis. Clin Rehabil 2007; 21: 471-9.
Williams, G., Robertson, V., Greenwood, K., Goldie, P., Morris, M. E. The concurrent validity and responsiveness of the high-level mobility assessment tool for measuring
For more information visit www.neuropt.org or email [email protected]
the mobility limitations of people with traumatic brain injury. Archives of Physical Medicine and Rehabilitation 2006; 87(3), 437-442.
Year published 1991
Instrument in PDF Format
Yes
Approval Status Approved
For more information visit www.neuropt.org or email [email protected]
27. REHAB MEASURES DATABASE—SATISFACTION WITH LIFE SCALE
Link to instrument SWLS is available on Dr. Ed Diener's webiste
Title of Assessment Satisfaction With Life Scale
Acronym SWLS
Instrument Reviewer(s) Initially reviewed by Susan Deems-Dluhy, PT, NCS in 7/2011; Updated by Anna
de Joya, PT, MS, NCS and the TBI EDGE task force of the Academy of Neurologic Physical Therapy - a component of APTA in 5/2012; reviewed by Rie Yoshida and Heather D Anderson 4/11/16 and the Stroke Edge II Task Force
Summary Date 4/11/16
Purpose A subjective quality of life measure designed to measure global life satisfaction, a subjective cognitive assessment, in contrast to an objective quality of life survey (e.g. Sickness Impact Profile, Short Form-36).
Description • The SWLS contains five statements about life satisfaction: three set in the present, one in the past, and one in the future
• Can be self-administered or completed by interview
• 7-point Likert scale from “strongly disagree” to “strongly agree”, 5 items: o In most ways my life is close to my ideal o The conditions of my life are excellent o I am satisfied with my life o So far I am getting the important things I want in life o If I could live my life over, I would change almost nothing
• Translated in a number of languages. • Scoring:
o Global score is computed o Higher scores indicate better health o Scores range from 5 to 35 o A score of 20 represents a neutral point at which the respondent
is equally satisfied and dissatisfied
Area of Assessment Life Participation; Quality of Life
Body Part Not Applicable
ICF Domain Participation
For more information visit www.neuropt.org or email [email protected]
Domain
Assessment Type Performance Measure
Length of Test 05 Minutes or Less
Time to Administer Less than 5 minutes
Number of Items 5
Equipment Required Survey form
Training Required No training
Type of training required no training
Cost Free
Actual Cost Free
Age Range Adult: 18-64 years; Elderly adult: 65+
Administration Mode Paper/Pencil
Diagnosis Geriatrics; Spinal Cord Injury; Traumatic Brain Injury
Populations Tested • General and student populations
• Patients with: spinal cord injury, traumatic brain injury
Standard Error of Measurement (SEM)
Not Established
Minimal Detectable Change (MDC) Not Established
Minimally Clinically Important Difference (MCID)
Not Established
Cut-Off Scores Not Established
Normative Data Traumatic Brain Injury: (Corrigan et al, 1998; n = 95 adults with traumatic brain injuries, 6 months to 5 years after inpatient rehabilitation; mean age = 32.4 years)
• Mean score of 19.0 (7.6) • Time post-injury was significantly associated with higher SWLS total
score
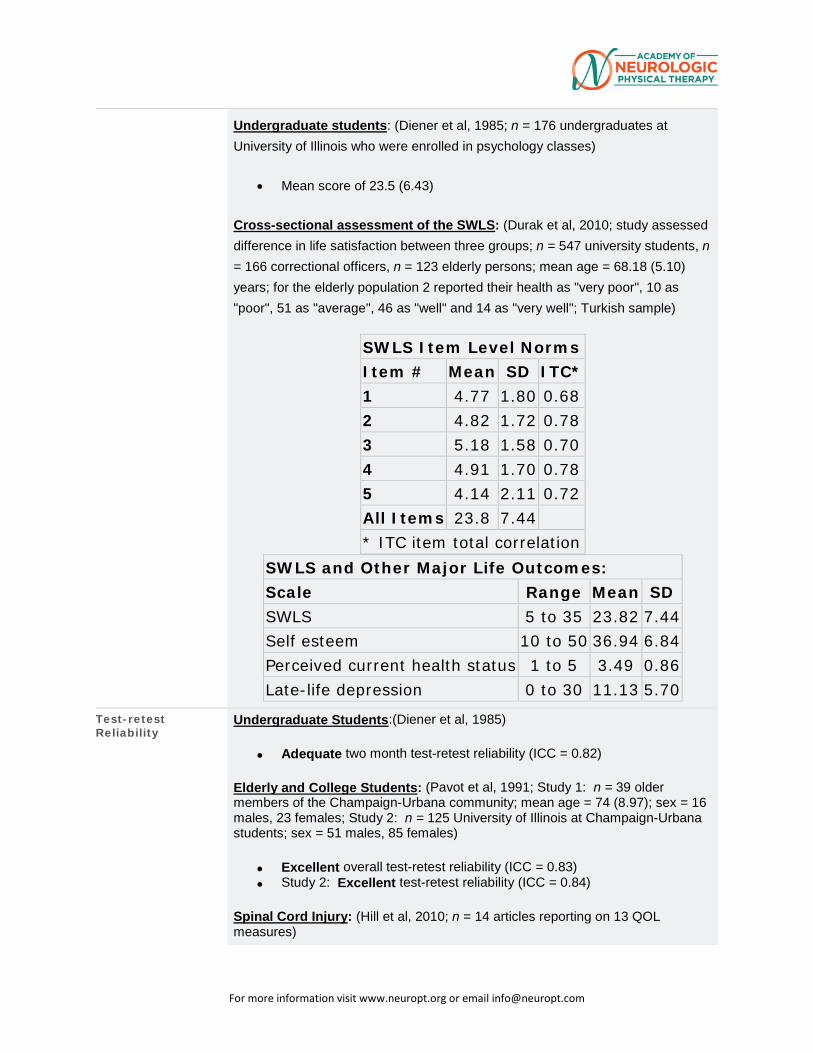
For more information visit www.neuropt.org or email [email protected]
Undergraduate students: (Diener et al, 1985; n = 176 undergraduates at University of Illinois who were enrolled in psychology classes)
• Mean score of 23.5 (6.43)
Cross-sectional assessment of the SWLS: (Durak et al, 2010; study assessed difference in life satisfaction between three groups; n = 547 university students, n = 166 correctional officers, n = 123 elderly persons; mean age = 68.18 (5.10) years; for the elderly population 2 reported their health as "very poor", 10 as "poor", 51 as "average", 46 as "well" and 14 as "very well"; Turkish sample)
SWLS Item Level Norms Item # Mean SD ITC* 1 4.77 1.80 0.68 2 4.82 1.72 0.78 3 5.18 1.58 0.70 4 4.91 1.70 0.78 5 4.14 2.11 0.72 All Items 23.8 7.44
* ITC item total correlation SWLS and Other Major Life Outcomes: Scale Range Mean SD SWLS 5 to 35 23.82 7.44 Self esteem 10 to 50 36.94 6.84 Perceived current health status 1 to 5 3.49 0.86 Late-life depression 0 to 30 11.13 5.70
Test-retest Reliability
Undergraduate Students:(Diener et al, 1985)
• Adequate two month test-retest reliability (ICC = 0.82)
Elderly and College Students: (Pavot et al, 1991; Study 1: n = 39 older members of the Champaign-Urbana community; mean age = 74 (8.97); sex = 16 males, 23 females; Study 2: n = 125 University of Illinois at Champaign-Urbana students; sex = 51 males, 85 females)
• Excellent overall test-retest reliability (ICC = 0.83) • Study 2: Excellent test-retest reliability (ICC = 0.84)
Spinal Cord Injury: (Hill et al, 2010; n = 14 articles reporting on 13 QOL measures)
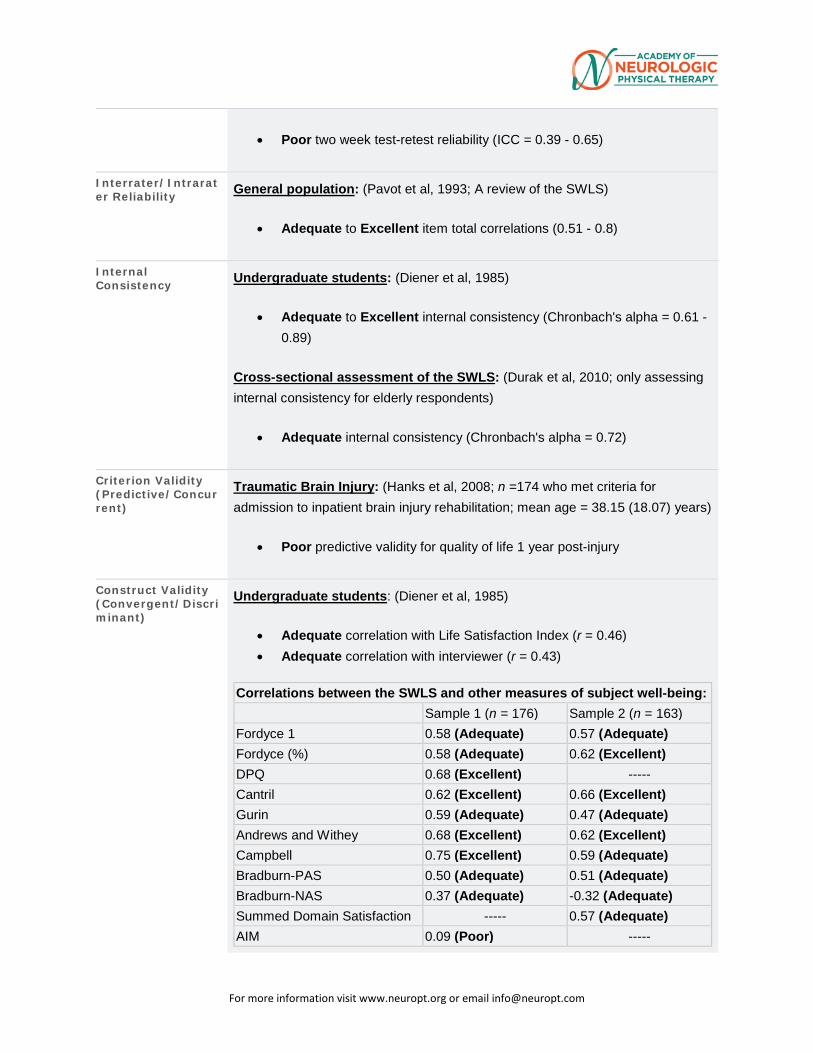
For more information visit www.neuropt.org or email [email protected]
• Poor two week test-retest reliability (ICC = 0.39 - 0.65)
Interrater/Intrarater Reliability General population: (Pavot et al, 1993; A review of the SWLS)
• Adequate to Excellent item total correlations (0.51 - 0.8)
Internal Consistency Undergraduate students: (Diener et al, 1985)
• Adequate to Excellent internal consistency (Chronbach's alpha = 0.61 - 0.89)
Cross-sectional assessment of the SWLS: (Durak et al, 2010; only assessing internal consistency for elderly respondents)
• Adequate internal consistency (Chronbach's alpha = 0.72)
Criterion Validity (Predictive/Concurrent)
Traumatic Brain Injury: (Hanks et al, 2008; n =174 who met criteria for admission to inpatient brain injury rehabilitation; mean age = 38.15 (18.07) years)
• Poor predictive validity for quality of life 1 year post-injury
Construct Validity (Convergent/Discriminant)
Undergraduate students: (Diener et al, 1985)
• Adequate correlation with Life Satisfaction Index (r = 0.46) • Adequate correlation with interviewer (r = 0.43)
Correlations between the SWLS and other measures of subject well-being: Sample 1 (n = 176) Sample 2 (n = 163)
Fordyce 1 0.58 (Adequate) 0.57 (Adequate) Fordyce (%) 0.58 (Adequate) 0.62 (Excellent) DPQ 0.68 (Excellent) ----- Cantril 0.62 (Excellent) 0.66 (Excellent) Gurin 0.59 (Adequate) 0.47 (Adequate) Andrews and Withey 0.68 (Excellent) 0.62 (Excellent) Campbell 0.75 (Excellent) 0.59 (Adequate) Bradburn-PAS 0.50 (Adequate) 0.51 (Adequate) Bradburn-NAS 0.37 (Adequate) -0.32 (Adequate) Summed Domain Satisfaction ----- 0.57 (Adequate) AIM 0.09 (Poor) -----
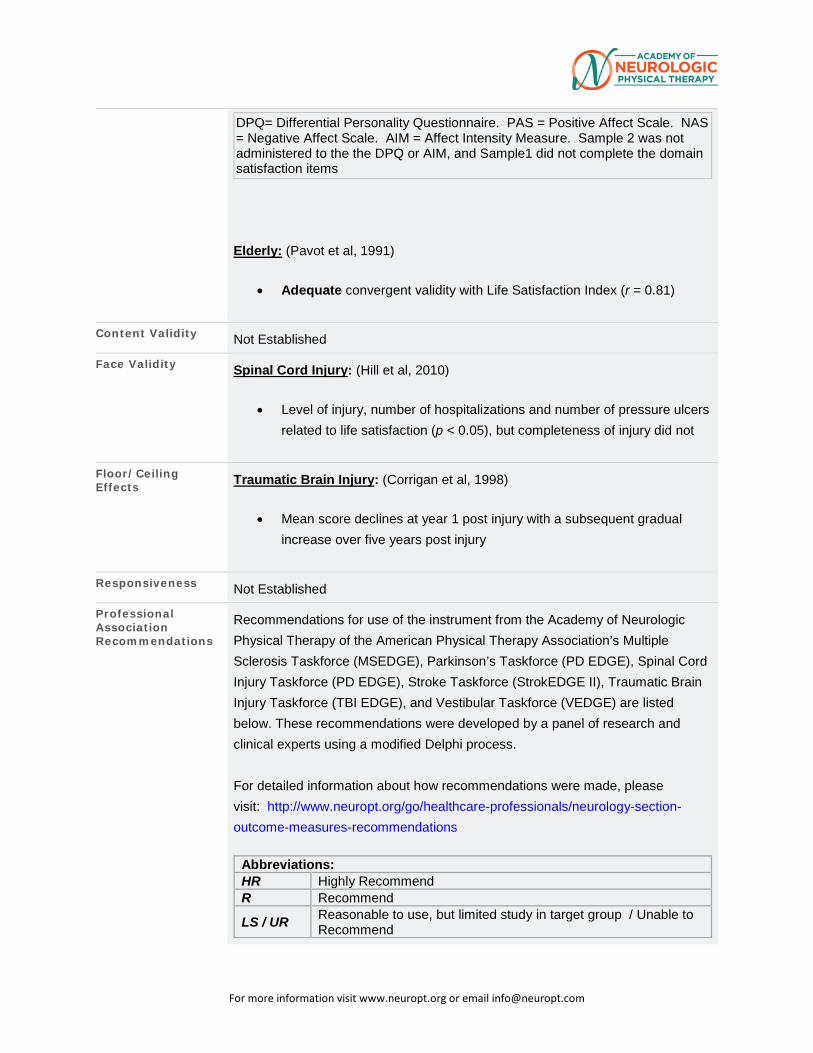
For more information visit www.neuropt.org or email [email protected]
DPQ= Differential Personality Questionnaire. PAS = Positive Affect Scale. NAS = Negative Affect Scale. AIM = Affect Intensity Measure. Sample 2 was not administered to the the DPQ or AIM, and Sample1 did not complete the domain satisfaction items
Elderly: (Pavot et al, 1991)
• Adequate convergent validity with Life Satisfaction Index (r = 0.81)
Content Validity Not Established
Face Validity Spinal Cord Injury: (Hill et al, 2010)
• Level of injury, number of hospitalizations and number of pressure ulcers related to life satisfaction (p < 0.05), but completeness of injury did not
Floor/Ceiling Effects Traumatic Brain Injury: (Corrigan et al, 1998)
• Mean score declines at year 1 post injury with a subsequent gradual increase over five years post injury
Responsiveness Not Established
Professional Association Recommendations
Recommendations for use of the instrument from the Academy of Neurologic Physical Therapy of the American Physical Therapy Association’s Multiple Sclerosis Taskforce (MSEDGE), Parkinson’s Taskforce (PD EDGE), Spinal Cord Injury Taskforce (PD EDGE), Stroke Taskforce (StrokEDGE II), Traumatic Brain Injury Taskforce (TBI EDGE), and Vestibular Taskforce (VEDGE) are listed below. These recommendations were developed by a panel of research and clinical experts using a modified Delphi process. For detailed information about how recommendations were made, please visit: http://www.neuropt.org/go/healthcare-professionals/neurology-section-outcome-measures-recommendations
Abbreviations: HR Highly Recommend R Recommend LS / UR Reasonable to use, but limited study in target group / Unable to
Recommend
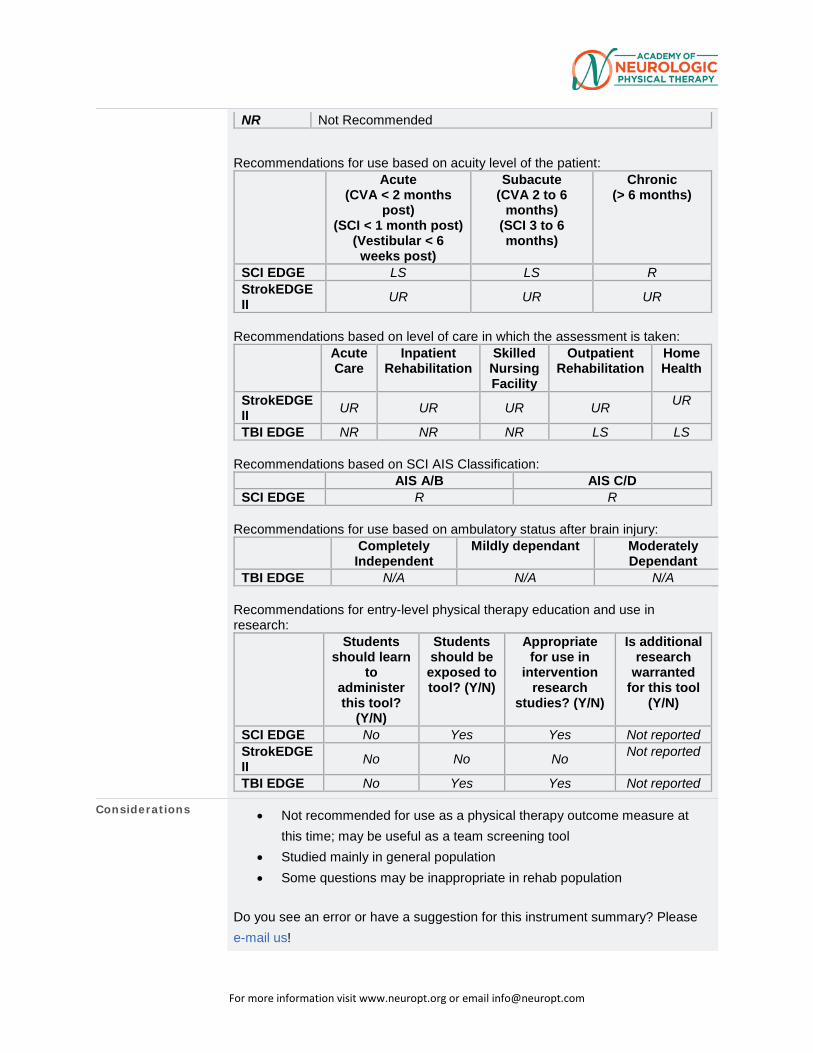
For more information visit www.neuropt.org or email [email protected]
NR Not Recommended Recommendations for use based on acuity level of the patient:
Acute (CVA < 2 months
post) (SCI < 1 month post)
(Vestibular < 6 weeks post)
Subacute (CVA 2 to 6
months) (SCI 3 to 6 months)
Chronic (> 6 months)
SCI EDGE LS LS R StrokEDGE II UR UR UR
Recommendations based on level of care in which the assessment is taken:
Acute Care
Inpatient Rehabilitation
Skilled Nursing Facility
Outpatient Rehabilitation
Home Health
StrokEDGE II UR UR UR UR UR
TBI EDGE NR NR NR LS LS Recommendations based on SCI AIS Classification:
AIS A/B AIS C/D SCI EDGE R R
Recommendations for use based on ambulatory status after brain injury:
Completely Independent
Mildly dependant Moderately Dependant
TBI EDGE N/A N/A N/A Recommendations for entry-level physical therapy education and use in research:
Students should learn
to administer this tool?
(Y/N)
Students should be exposed to tool? (Y/N)
Appropriate for use in
intervention research
studies? (Y/N)
Is additional research
warranted for this tool
(Y/N)
SCI EDGE No Yes Yes Not reported StrokEDGE II No No No Not reported
TBI EDGE No Yes Yes Not reported
Considerations • Not recommended for use as a physical therapy outcome measure at this time; may be useful as a team screening tool
• Studied mainly in general population • Some questions may be inappropriate in rehab population
Do you see an error or have a suggestion for this instrument summary? Please e-mail us!
For more information visit www.neuropt.org or email [email protected]
Bibliography Corrigan, J. D., Smith-Knapp, K., et al. (1998). "Outcomes in the first 5 years after traumatic brain injury." Arch Phys Med Rehabil 79(3): 298-305. Find it on PubMed
Diener, E., Emmons, R. A., et al. (1985). "The Satisfaction With Life Scale." J Pers Assess 49(1): 71-75. Find it on PubMed
Durak, M., Senol-Durak, E., et al. (2010). "Psychometric properties of the Satisfaction with Life Scale among Turkish university students, correctional officers, and elderly adults." Social indicators research 99(3): 413-429.
Hanks, R. A., Millis, S. R., et al. (2008). "The predictive validity of a brief inpatient neuropsychologic battery for persons with traumatic brain injury." Arch Phys Med Rehabil 89(5): 950-957. Find it on PubMed
Hill, M. R., Noonan, V. K., et al. (2010). "Quality of life instruments and definitions in individuals with spinal cord injury: a systematic review." Spinal Cord 48(6): 438-450. Find it on PubMed
Pavot, W. and Diener, E. (1993). "Review of the satisfaction with life scale." Psychological Assessment 5(2): 164.
Pavot, W., Diener, E., et al. (1991). "Further validation of the Satisfaction with Life Scale: evidence for the cross-method convergence of well-being measures." J Pers Assess 57(1): 149-161. Find it on PubMed
Year published 1985
Instrument in PDF Format Yes
Approval Status Approved
For more information visit www.neuropt.org or email [email protected]
28. REHAB MEASURES DATABASE—SHORT FORM 36
Link to instrument Available for purchase at SF-36.org (external link)
Title of Assessment Medical Outcomes Study Short Form 36
Acronym SF-36; SF-36v2
Instrument Reviewer(s)
Initially reviewed by the Rehabilitation Measures Team; Updated by Wendy Romney, PT, DPT, NCS, Cara Weisbach, PT, DPT, and the SCI EDGE task force of the Academy of Neurologic Physical Therapy - a component of APTA in 2012; Updated by Sue Saliga PT, DHSc, CEEAA and the TBI EDGE task force of the Academy of Neurologic Physical Therapy - a component of APTA in 2012. Updated by Erin Hussey, PT, DPT, MS, NCS and Cathy Harro PT, PhD and the PD EDGE task force of the Academy of Neurologic Physical Therapy - a component of APTA in 2013. Updated by Melissa Eden, PT, DPT, OCS in 2014. Updated by Carmen Capo-Lugo, PT, PhD and Dorian Rose PT, PhD of the STROKEdge II task force in 2016.
Summary Date 9/20/2015; 10/2/2016
Purpose The SF-36 is a generic patient-reported outcome measure aimed at quantifying health status, and is often used as a measure of health-related quality of life.
Description 36 item measure divided into 8 subscales and 2 composite domains
The 8 subscales are:
(1) Physical Functioning
(2) Role Limitations due to Physical Problems
(3) General Health Perceptions
(4) Vitality
(5) Social Functioning
(6) Role Limitations due to Emotional Problems
(7) General Mental Health
(8) Health Transition
Respondents are asked to answer items referring to the past 4 weeks
For more information visit www.neuropt.org or email [email protected]
Recommended scoring system for the SF-36 is a weighted Likert system for each item
Items within subscales are totaled to provide a summed score for each subscale or dimension.
Each of the 8 summed scores is linearly transformed onto a scale from 0 (negative health) to 100 (positive health) to provide a score for each subscale. Each subscale can be used independently.
For each domain (physical and mental composite) mean score = 50 and standard deviation = 10
Version 2 norms are based on the 1998 National Survey of Functional Health Status (NSFHS); more information on version 2 can be found on the SF-36 website: http://www.sf-36.org/tools/sf36html
Area of Assessment
Activities of Daily Living; Quality of Life
Body Part Not Applicable
ICF Domain Body Function; Activity; Participation
Domain ADL; General Health
Assessment Type Patient Reported Outcomes
Length of Test 06 to 30 Minutes
Time to Administer 10 minutes; 41 and 47 minutes, respectively, for individuals with paraplegia & tetraplegia (Anderson, et al 1999)
Number of Items 36
Equipment Required
Suggests enlarged copy of item response options (Steffen & Seney 2008)
Training Required Acquire and reading manual needed for item administration and scoring.
Type of training required
No Training
For more information visit www.neuropt.org or email [email protected]
Cost Not Free
Actual Cost Contact QualityMetric Incorporated for information regarding licensing fees for your institution.
Age Range Adult: 18-64 years; Elderly adult: 65+
Administration Mode
Paper/Pencil
Diagnosis Arthritis; Cardiac Conditions; Geriatrics; Multiple Sclerosis; Pain; Spinal Cord Injury; Stroke; Traumatic Brain Injury
Populations Tested The following conditions each have 50 or more publications (Turner-Bowker et al, 2002):
Arthritis
Back pain
Cancer of the Head & Neck
Low back pain
Multiple sclerosis
Musculoskeletal conditions
Neuromuscular conditions
Osteoarthritis
Parkinson Disease
Rheumatoid arthritis
Spinal injuries
Stroke
Trauma
Traumatic Brain Injury (Nichol et al, 2011)
Standard Error of Measurement (SEM)
Not Established
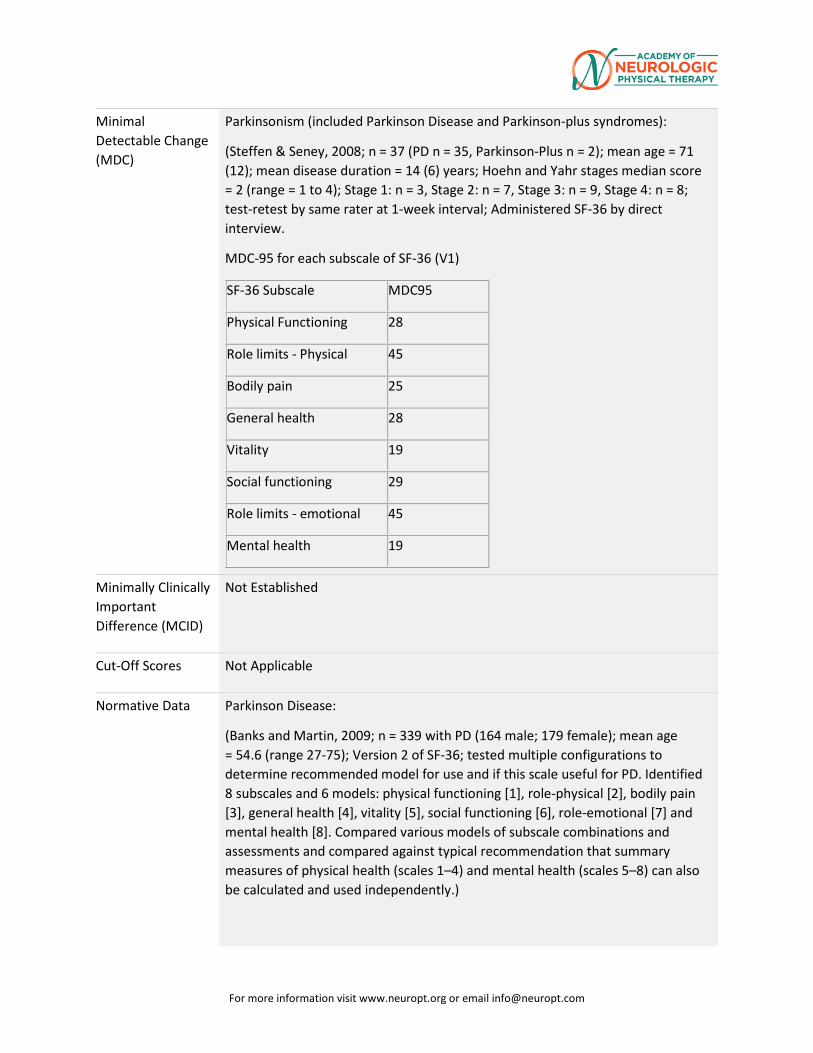
For more information visit www.neuropt.org or email [email protected]
Minimal Detectable Change (MDC)
Parkinsonism (included Parkinson Disease and Parkinson-plus syndromes):
(Steffen & Seney, 2008; n = 37 (PD n = 35, Parkinson-Plus n = 2); mean age = 71 (12); mean disease duration = 14 (6) years; Hoehn and Yahr stages median score = 2 (range = 1 to 4); Stage 1: n = 3, Stage 2: n = 7, Stage 3: n = 9, Stage 4: n = 8; test-retest by same rater at 1-week interval; Administered SF-36 by direct interview.
MDC-95 for each subscale of SF-36 (V1)
SF-36 Subscale MDC95
Physical Functioning 28
Role limits - Physical 45
Bodily pain 25
General health 28
Vitality 19
Social functioning 29
Role limits - emotional 45
Mental health 19
Minimally Clinically Important Difference (MCID)
Not Established
Cut-Off Scores Not Applicable
Normative Data Parkinson Disease:
(Banks and Martin, 2009; n = 339 with PD (164 male; 179 female); mean age = 54.6 (range 27-75); Version 2 of SF-36; tested multiple configurations to determine recommended model for use and if this scale useful for PD. Identified 8 subscales and 6 models: physical functioning [1], role-physical [2], bodily pain [3], general health [4], vitality [5], social functioning [6], role-emotional [7] and mental health [8]. Compared various models of subscale combinations and assessments and compared against typical recommendation that summary measures of physical health (scales 1–4) and mental health (scales 5–8) can also be calculated and used independently.)
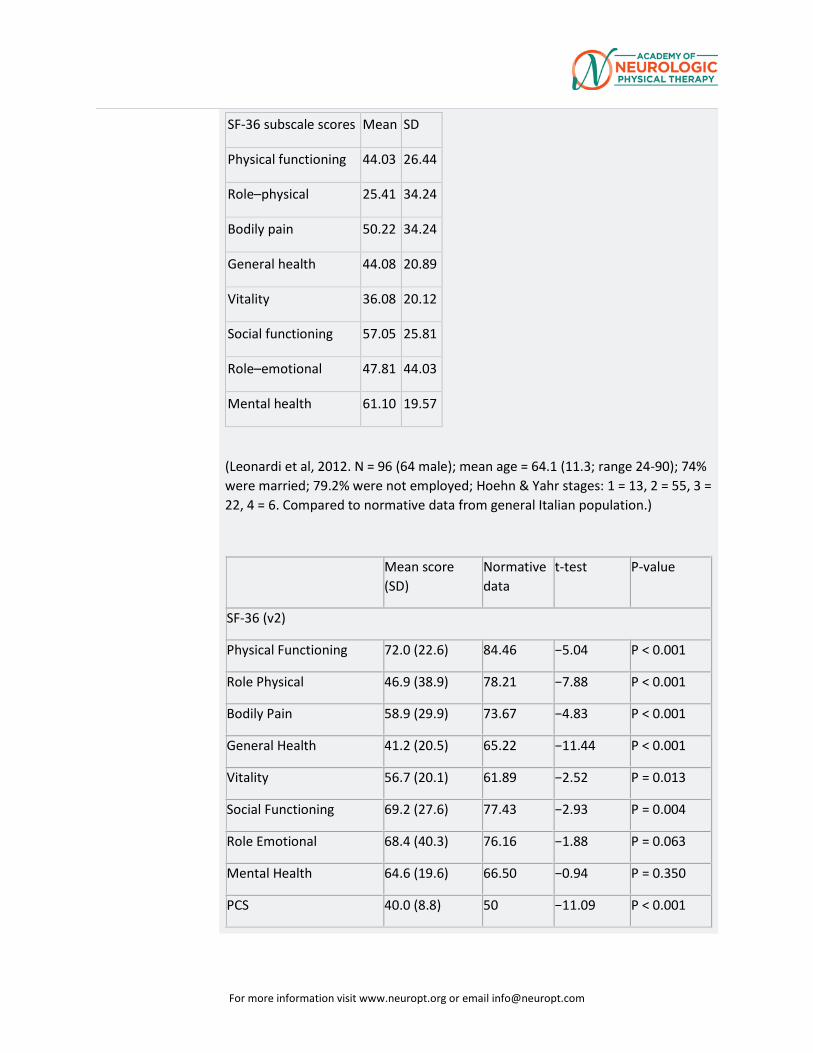
For more information visit www.neuropt.org or email [email protected]
SF-36 subscale scores Mean SD
Physical functioning 44.03 26.44
Role–physical 25.41 34.24
Bodily pain 50.22 34.24
General health 44.08 20.89
Vitality 36.08 20.12
Social functioning 57.05 25.81
Role–emotional 47.81 44.03
Mental health 61.10 19.57
(Leonardi et al, 2012. N = 96 (64 male); mean age = 64.1 (11.3; range 24-90); 74% were married; 79.2% were not employed; Hoehn & Yahr stages: 1 = 13, 2 = 55, 3 = 22, 4 = 6. Compared to normative data from general Italian population.)
Mean score (SD)
Normative data
t-test P-value
SF-36 (v2)
Physical Functioning 72.0 (22.6) 84.46 −5.04 P < 0.001
Role Physical 46.9 (38.9) 78.21 −7.88 P < 0.001
Bodily Pain 58.9 (29.9) 73.67 −4.83 P < 0.001
General Health 41.2 (20.5) 65.22 −11.44 P < 0.001
Vitality 56.7 (20.1) 61.89 −2.52 P = 0.013
Social Functioning 69.2 (27.6) 77.43 −2.93 P = 0.004
Role Emotional 68.4 (40.3) 76.16 −1.88 P = 0.063
Mental Health 64.6 (19.6) 66.50 −0.94 P = 0.350
PCS 40.0 (8.8) 50 −11.09 P < 0.001
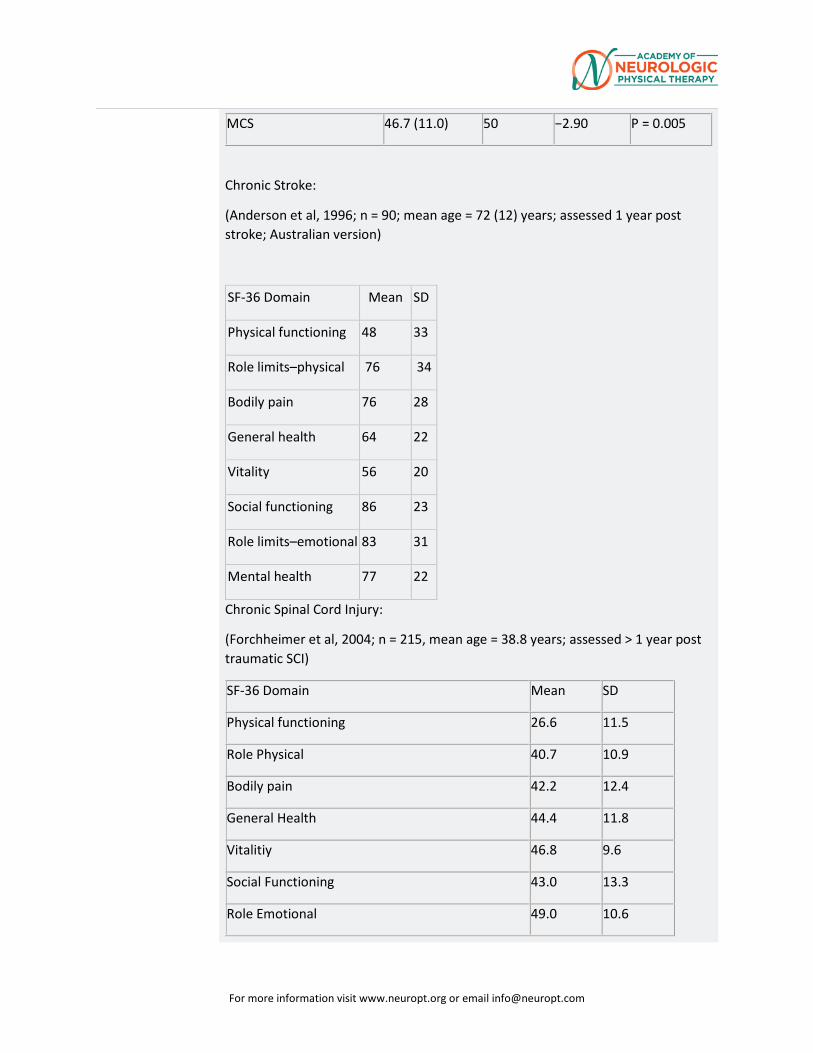
For more information visit www.neuropt.org or email [email protected]
MCS 46.7 (11.0) 50 −2.90 P = 0.005
Chronic Stroke:
(Anderson et al, 1996; n = 90; mean age = 72 (12) years; assessed 1 year post stroke; Australian version)
SF-36 Domain Mean SD
Physical functioning 48 33
Role limits–physical 76 34
Bodily pain 76 28
General health 64 22
Vitality 56 20
Social functioning 86 23
Role limits–emotional 83 31
Mental health 77 22
Chronic Spinal Cord Injury:
(Forchheimer et al, 2004; n = 215, mean age = 38.8 years; assessed > 1 year post traumatic SCI)
SF-36 Domain Mean SD
Physical functioning 26.6 11.5
Role Physical 40.7 10.9
Bodily pain 42.2 12.4
General Health 44.4 11.8
Vitalitiy 46.8 9.6
Social Functioning 43.0 13.3
Role Emotional 49.0 10.6
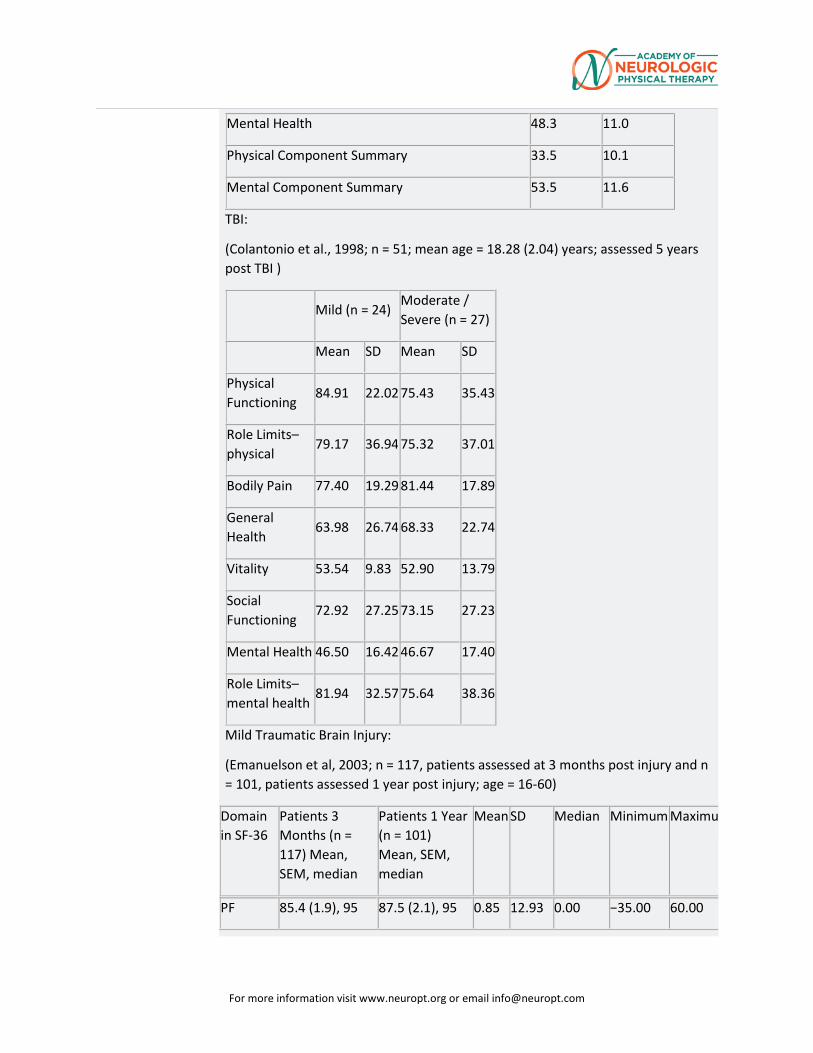
For more information visit www.neuropt.org or email [email protected]
Mental Health 48.3 11.0
Physical Component Summary 33.5 10.1
Mental Component Summary 53.5 11.6
TBI:
(Colantonio et al., 1998; n = 51; mean age = 18.28 (2.04) years; assessed 5 years post TBI )
Mild (n = 24) Moderate / Severe (n = 27)
Mean SD Mean SD
Physical Functioning
84.91 22.02 75.43 35.43
Role Limits–physical
79.17 36.94 75.32 37.01
Bodily Pain 77.40 19.29 81.44 17.89
General Health
63.98 26.74 68.33 22.74
Vitality 53.54 9.83 52.90 13.79
Social Functioning
72.92 27.25 73.15 27.23
Mental Health 46.50 16.42 46.67 17.40
Role Limits–mental health
81.94 32.57 75.64 38.36
Mild Traumatic Brain Injury:
(Emanuelson et al, 2003; n = 117, patients assessed at 3 months post injury and n = 101, patients assessed 1 year post injury; age = 16-60)
Domain in SF-36
Patients 3 Months (n = 117) Mean, SEM, median
Patients 1 Year (n = 101) Mean, SEM, median
Mean SD Median Minimum Maximu
PF 85.4 (1.9), 95 87.5 (2.1), 95 0.85 12.93 0.00 −35.00 60.00
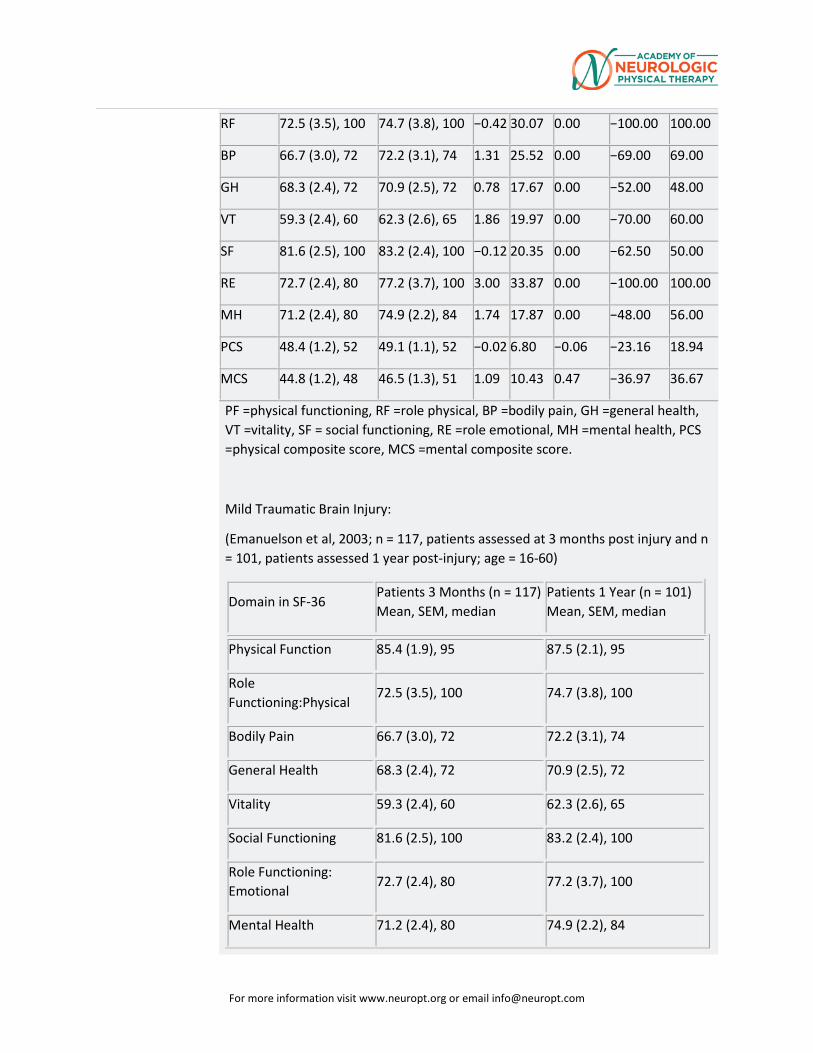
For more information visit www.neuropt.org or email [email protected]
PF =physical functioning, RF =role physical, BP =bodily pain, GH =general health, VT =vitality, SF = social functioning, RE =role emotional, MH =mental health, PCS =physical composite score, MCS =mental composite score.
Mild Traumatic Brain Injury:
(Emanuelson et al, 2003; n = 117, patients assessed at 3 months post injury and n = 101, patients assessed 1 year post-injury; age = 16-60)
RF 72.5 (3.5), 100 74.7 (3.8), 100 −0.42 30.07 0.00 −100.00 100.00
BP 66.7 (3.0), 72 72.2 (3.1), 74 1.31 25.52 0.00 −69.00 69.00
GH 68.3 (2.4), 72 70.9 (2.5), 72 0.78 17.67 0.00 −52.00 48.00
VT 59.3 (2.4), 60 62.3 (2.6), 65 1.86 19.97 0.00 −70.00 60.00
SF 81.6 (2.5), 100 83.2 (2.4), 100 −0.12 20.35 0.00 −62.50 50.00
RE 72.7 (2.4), 80 77.2 (3.7), 100 3.00 33.87 0.00 −100.00 100.00
MH 71.2 (2.4), 80 74.9 (2.2), 84 1.74 17.87 0.00 −48.00 56.00
PCS 48.4 (1.2), 52 49.1 (1.1), 52 −0.02 6.80 −0.06 −23.16 18.94
MCS 44.8 (1.2), 48 46.5 (1.3), 51 1.09 10.43 0.47 −36.97 36.67
Domain in SF-36 Patients 3 Months (n = 117) Mean, SEM, median
Patients 1 Year (n = 101) Mean, SEM, median
Physical Function 85.4 (1.9), 95 87.5 (2.1), 95
Role Functioning:Physical
72.5 (3.5), 100 74.7 (3.8), 100
Bodily Pain 66.7 (3.0), 72 72.2 (3.1), 74
General Health 68.3 (2.4), 72 70.9 (2.5), 72
Vitality 59.3 (2.4), 60 62.3 (2.6), 65
Social Functioning 81.6 (2.5), 100 83.2 (2.4), 100
Role Functioning: Emotional
72.7 (2.4), 80 77.2 (3.7), 100
Mental Health 71.2 (2.4), 80 74.9 (2.2), 84
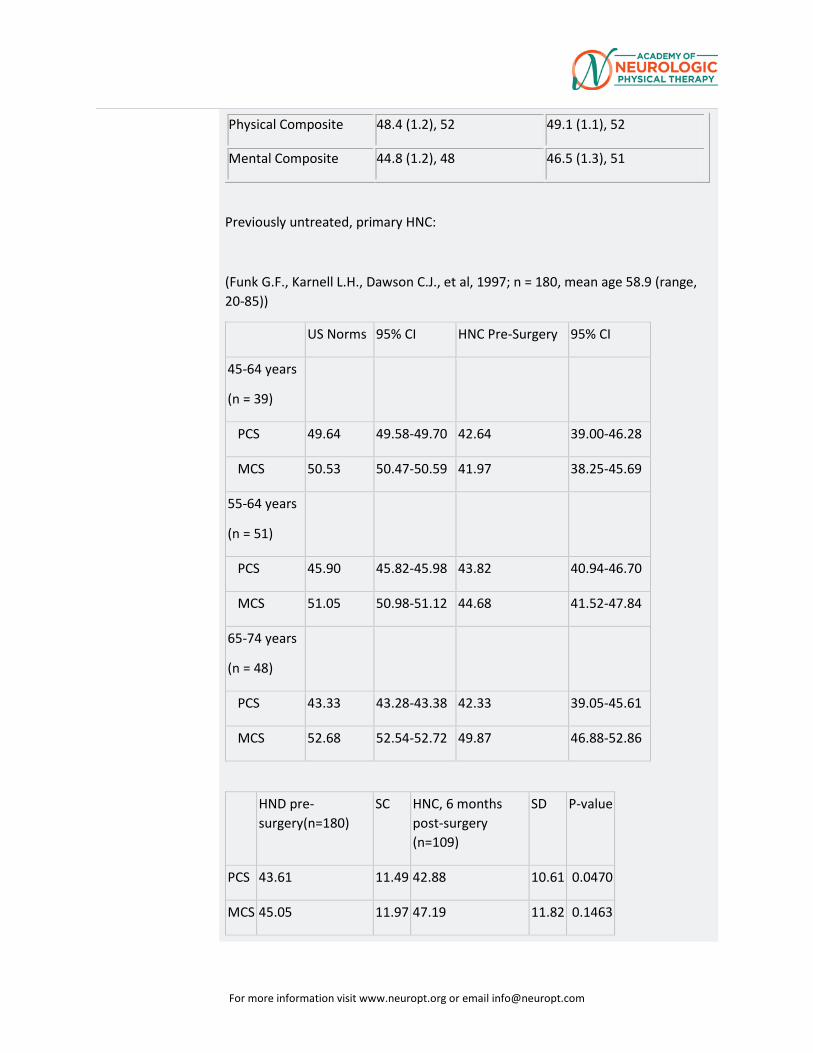
For more information visit www.neuropt.org or email [email protected]
Previously untreated, primary HNC:
(Funk G.F., Karnell L.H., Dawson C.J., et al, 1997; n = 180, mean age 58.9 (range, 20-85))
US Norms 95% CI HNC Pre-Surgery 95% CI
45-64 years
(n = 39)
PCS 49.64 49.58-49.70 42.64 39.00-46.28
MCS 50.53 50.47-50.59 41.97 38.25-45.69
55-64 years
(n = 51)
PCS 45.90 45.82-45.98 43.82 40.94-46.70
MCS 51.05 50.98-51.12 44.68 41.52-47.84
65-74 years
(n = 48)
PCS 43.33 43.28-43.38 42.33 39.05-45.61
MCS 52.68 52.54-52.72 49.87 46.88-52.86
HND pre-surgery(n=180)
SC HNC, 6 months post-surgery (n=109)
SD P-value
PCS 43.61 11.49 42.88 10.61 0.0470
MCS 45.05 11.97 47.19 11.82 0.1463
Physical Composite 48.4 (1.2), 52 49.1 (1.1), 52
Mental Composite 44.8 (1.2), 48 46.5 (1.3), 51
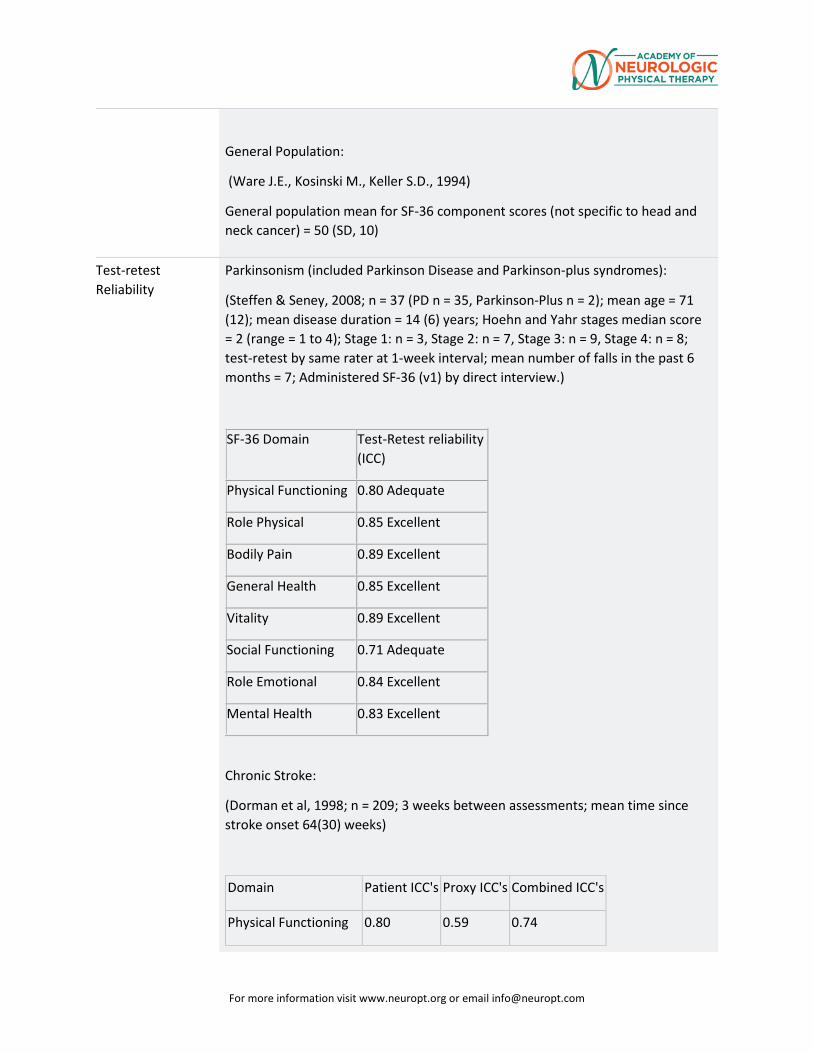
For more information visit www.neuropt.org or email [email protected]
General Population:
(Ware J.E., Kosinski M., Keller S.D., 1994)
General population mean for SF-36 component scores (not specific to head and neck cancer) = 50 (SD, 10)
Test-retest Reliability
Parkinsonism (included Parkinson Disease and Parkinson-plus syndromes):
(Steffen & Seney, 2008; n = 37 (PD n = 35, Parkinson-Plus n = 2); mean age = 71 (12); mean disease duration = 14 (6) years; Hoehn and Yahr stages median score = 2 (range = 1 to 4); Stage 1: n = 3, Stage 2: n = 7, Stage 3: n = 9, Stage 4: n = 8; test-retest by same rater at 1-week interval; mean number of falls in the past 6 months = 7; Administered SF-36 (v1) by direct interview.)
SF-36 Domain Test-Retest reliability (ICC)
Physical Functioning 0.80 Adequate
Role Physical 0.85 Excellent
Bodily Pain 0.89 Excellent
General Health 0.85 Excellent
Vitality 0.89 Excellent
Social Functioning 0.71 Adequate
Role Emotional 0.84 Excellent
Mental Health 0.83 Excellent
Chronic Stroke:
(Dorman et al, 1998; n = 209; 3 weeks between assessments; mean time since stroke onset 64(30) weeks)
Domain Patient ICC's Proxy ICC's Combined ICC's
Physical Functioning 0.80 0.59 0.74
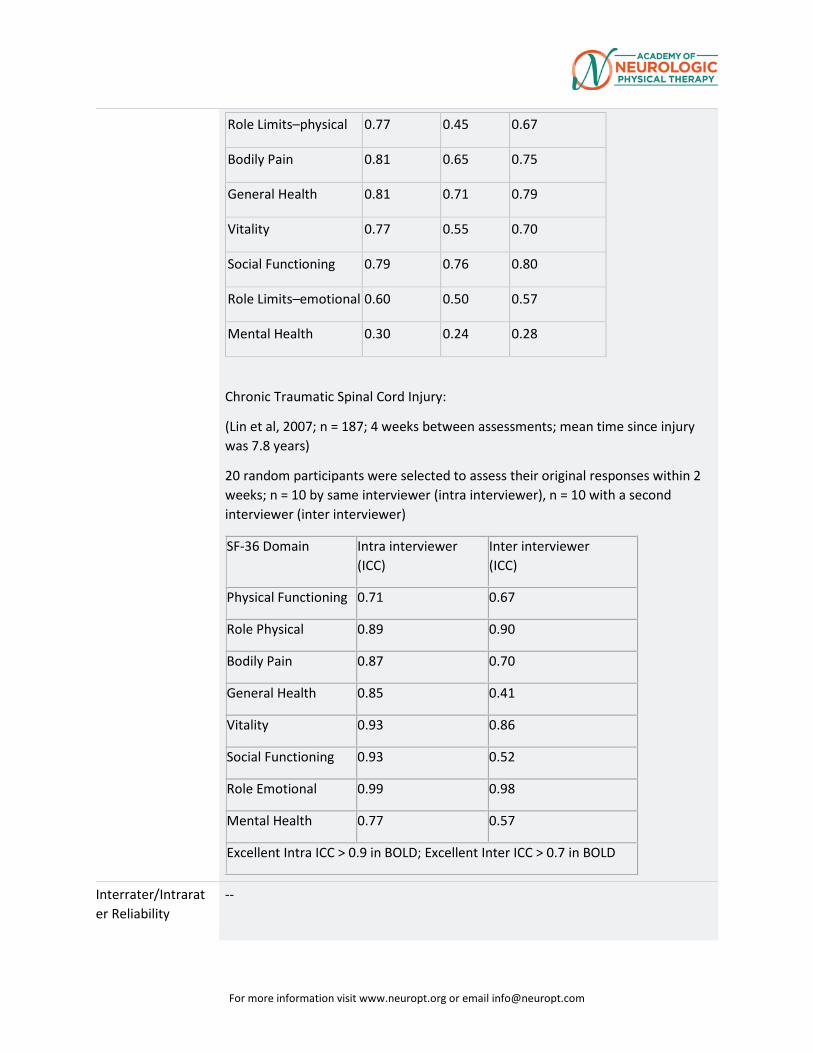
For more information visit www.neuropt.org or email [email protected]
Role Limits–physical 0.77 0.45 0.67
Bodily Pain 0.81 0.65 0.75
General Health 0.81 0.71 0.79
Vitality 0.77 0.55 0.70
Social Functioning 0.79 0.76 0.80
Role Limits–emotional 0.60 0.50 0.57
Mental Health 0.30 0.24 0.28
Chronic Traumatic Spinal Cord Injury:
(Lin et al, 2007; n = 187; 4 weeks between assessments; mean time since injury was 7.8 years)
20 random participants were selected to assess their original responses within 2 weeks; n = 10 by same interviewer (intra interviewer), n = 10 with a second interviewer (inter interviewer)
SF-36 Domain Intra interviewer (ICC)
Inter interviewer (ICC)
Physical Functioning 0.71 0.67
Role Physical 0.89 0.90
Bodily Pain 0.87 0.70
General Health 0.85 0.41
Vitality 0.93 0.86
Social Functioning 0.93 0.52
Role Emotional 0.99 0.98
Mental Health 0.77 0.57
Excellent Intra ICC > 0.9 in BOLD; Excellent Inter ICC > 0.7 in BOLD
Interrater/Intrarater Reliability
--
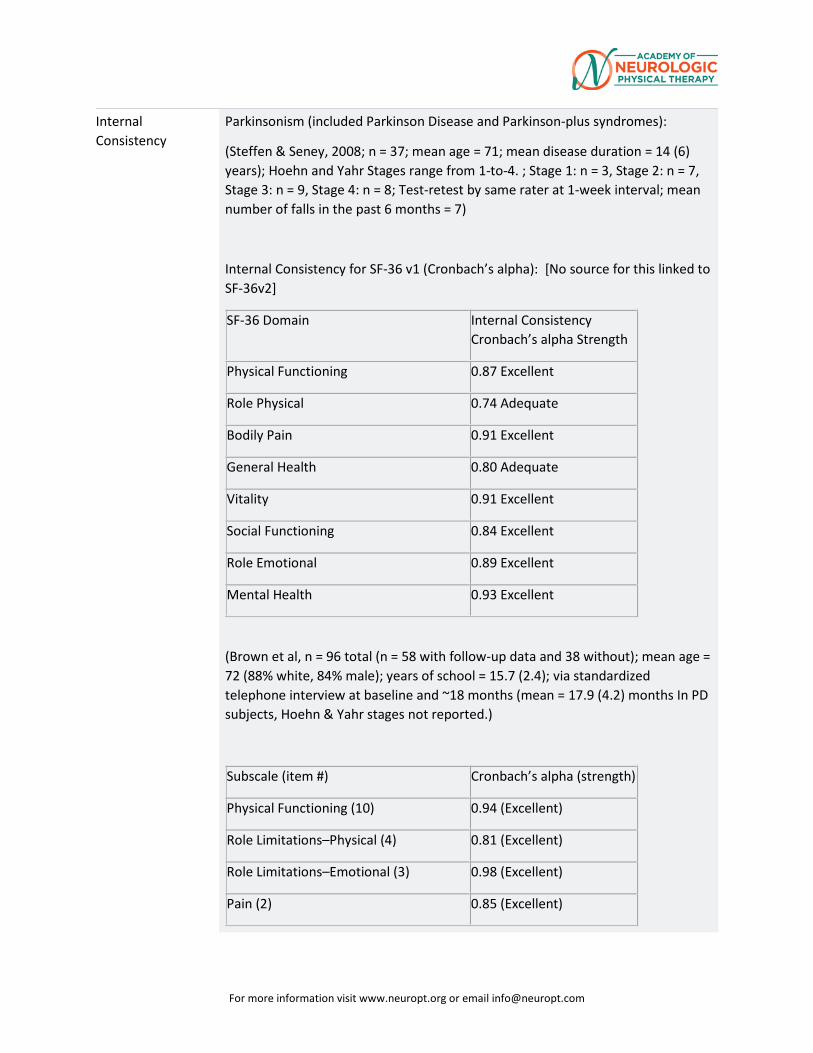
For more information visit www.neuropt.org or email [email protected]
Internal Consistency
Parkinsonism (included Parkinson Disease and Parkinson-plus syndromes):
(Steffen & Seney, 2008; n = 37; mean age = 71; mean disease duration = 14 (6) years); Hoehn and Yahr Stages range from 1-to-4. ; Stage 1: n = 3, Stage 2: n = 7, Stage 3: n = 9, Stage 4: n = 8; Test-retest by same rater at 1-week interval; mean number of falls in the past 6 months = 7)
Internal Consistency for SF-36 v1 (Cronbach’s alpha): [No source for this linked to SF-36v2]
SF-36 Domain Internal Consistency Cronbach’s alpha Strength
Physical Functioning 0.87 Excellent
Role Physical 0.74 Adequate
Bodily Pain 0.91 Excellent
General Health 0.80 Adequate
Vitality 0.91 Excellent
Social Functioning 0.84 Excellent
Role Emotional 0.89 Excellent
Mental Health 0.93 Excellent
(Brown et al, n = 96 total (n = 58 with follow-up data and 38 without); mean age = 72 (88% white, 84% male); years of school = 15.7 (2.4); via standardized telephone interview at baseline and ~18 months (mean = 17.9 (4.2) months In PD subjects, Hoehn & Yahr stages not reported.)
Subscale (item #) Cronbach’s alpha (strength)
Physical Functioning (10) 0.94 (Excellent)
Role Limitations–Physical (4) 0.81 (Excellent)
Role Limitations–Emotional (3) 0.98 (Excellent)
Pain (2) 0.85 (Excellent)
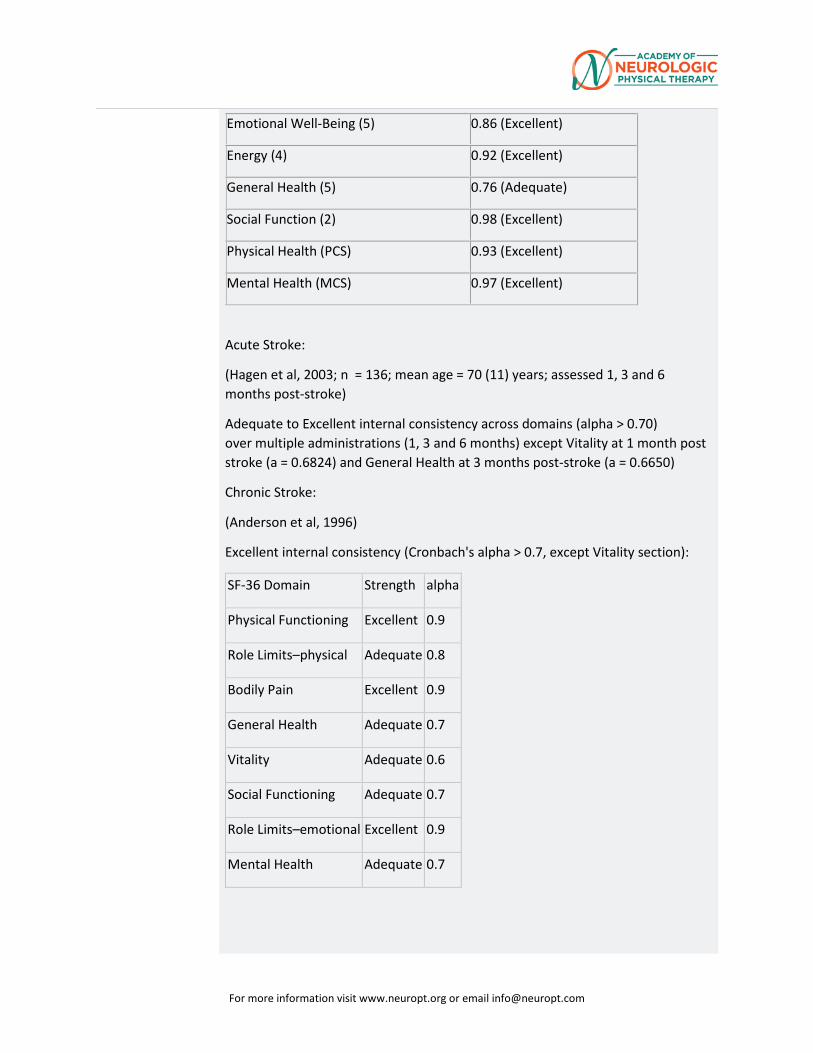
For more information visit www.neuropt.org or email [email protected]
Emotional Well-Being (5) 0.86 (Excellent)
Energy (4) 0.92 (Excellent)
General Health (5) 0.76 (Adequate)
Social Function (2) 0.98 (Excellent)
Physical Health (PCS) 0.93 (Excellent)
Mental Health (MCS) 0.97 (Excellent)
Acute Stroke:
(Hagen et al, 2003; n = 136; mean age = 70 (11) years; assessed 1, 3 and 6 months post-stroke)
Adequate to Excellent internal consistency across domains (alpha > 0.70) over multiple administrations (1, 3 and 6 months) except Vitality at 1 month post stroke (a = 0.6824) and General Health at 3 months post-stroke (a = 0.6650)
Chronic Stroke:
(Anderson et al, 1996)
Excellent internal consistency (Cronbach's alpha > 0.7, except Vitality section):
SF-36 Domain Strength alpha
Physical Functioning Excellent 0.9
Role Limits–physical Adequate 0.8
Bodily Pain Excellent 0.9
General Health Adequate 0.7
Vitality Adequate 0.6
Social Functioning Adequate 0.7
Role Limits–emotional Excellent 0.9
Mental Health Adequate 0.7
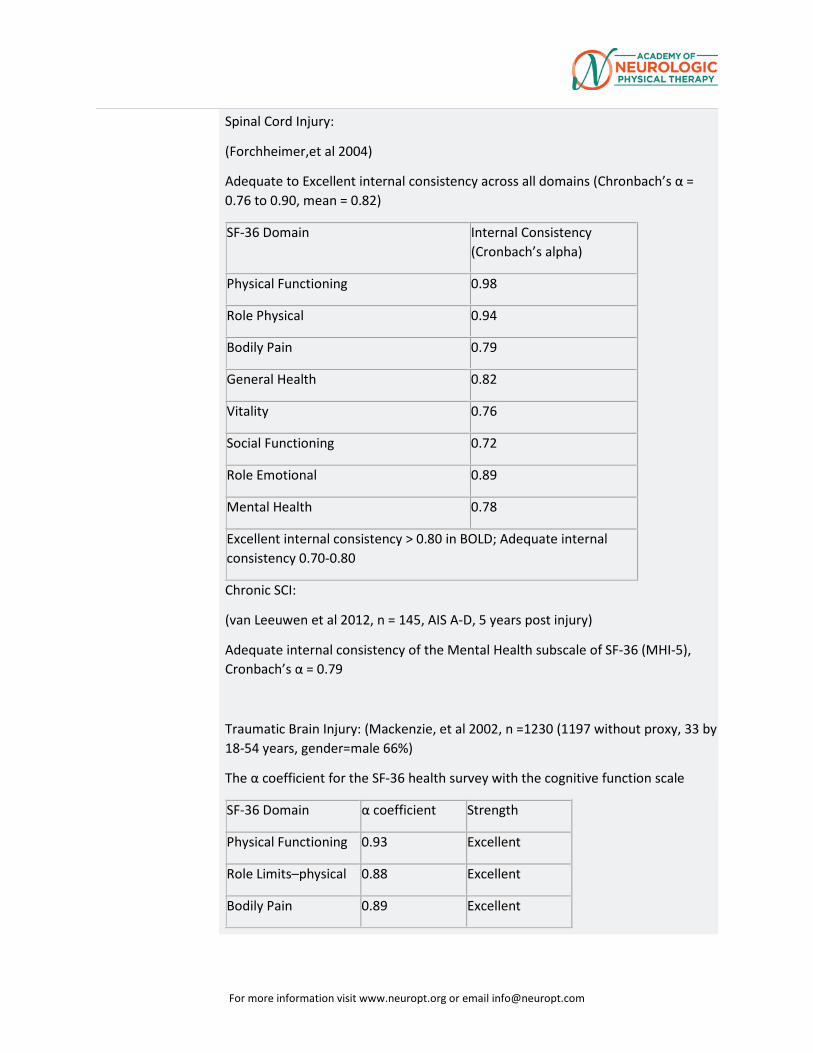
For more information visit www.neuropt.org or email [email protected]
Spinal Cord Injury:
(Forchheimer,et al 2004)
Adequate to Excellent internal consistency across all domains (Chronbach’s α = 0.76 to 0.90, mean = 0.82)
SF-36 Domain Internal Consistency (Cronbach’s alpha)
Physical Functioning 0.98
Role Physical 0.94
Bodily Pain 0.79
General Health 0.82
Vitality 0.76
Social Functioning 0.72
Role Emotional 0.89
Mental Health 0.78
Excellent internal consistency > 0.80 in BOLD; Adequate internal consistency 0.70-0.80
Chronic SCI:
(van Leeuwen et al 2012, n = 145, AIS A-D, 5 years post injury)
Adequate internal consistency of the Mental Health subscale of SF-36 (MHI-5), Cronbach’s α = 0.79
Traumatic Brain Injury: (Mackenzie, et al 2002, n =1230 (1197 without proxy, 33 by 18-54 years, gender=male 66%)
The α coefficient for the SF-36 health survey with the cognitive function scale
SF-36 Domain α coefficient Strength
Physical Functioning 0.93 Excellent
Role Limits–physical 0.88 Excellent
Bodily Pain 0.89 Excellent
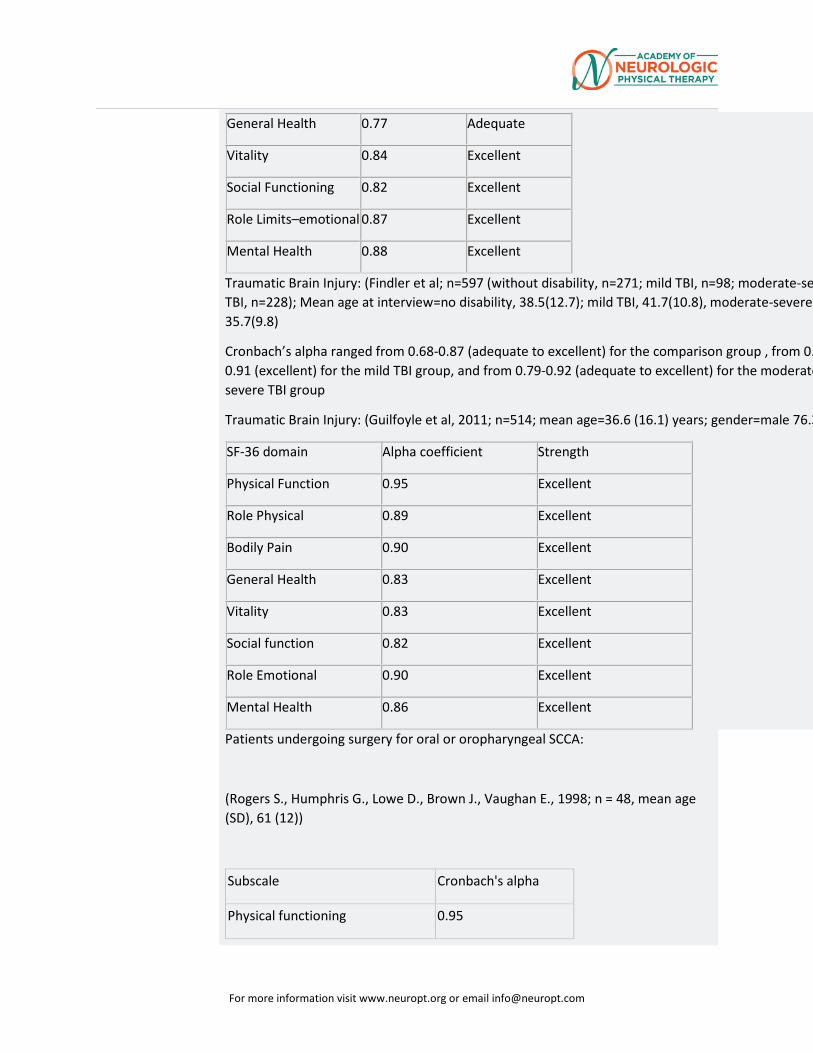
For more information visit www.neuropt.org or email [email protected]
General Health 0.77 Adequate
Vitality 0.84 Excellent
Social Functioning 0.82 Excellent
Role Limits–emotional 0.87 Excellent
Mental Health 0.88 Excellent
Traumatic Brain Injury: (Findler et al; n=597 (without disability, n=271; mild TBI, n=98; moderate-se TBI, n=228); Mean age at interview=no disability, 38.5(12.7); mild TBI, 41.7(10.8), moderate-severe 35.7(9.8)
Cronbach’s alpha ranged from 0.68-0.87 (adequate to excellent) for the comparison group , from 0.0.91 (excellent) for the mild TBI group, and from 0.79-0.92 (adequate to excellent) for the moderatesevere TBI group
Traumatic Brain Injury: (Guilfoyle et al, 2011; n=514; mean age=36.6 (16.1) years; gender=male 76.3
SF-36 domain Alpha coefficient Strength
Physical Function 0.95 Excellent
Role Physical 0.89 Excellent
Bodily Pain 0.90 Excellent
General Health 0.83 Excellent
Vitality 0.83 Excellent
Social function 0.82 Excellent
Role Emotional 0.90 Excellent
Mental Health 0.86 Excellent
Patients undergoing surgery for oral or oropharyngeal SCCA:
(Rogers S., Humphris G., Lowe D., Brown J., Vaughan E., 1998; n = 48, mean age (SD), 61 (12))
Subscale Cronbach's alpha
Physical functioning 0.95
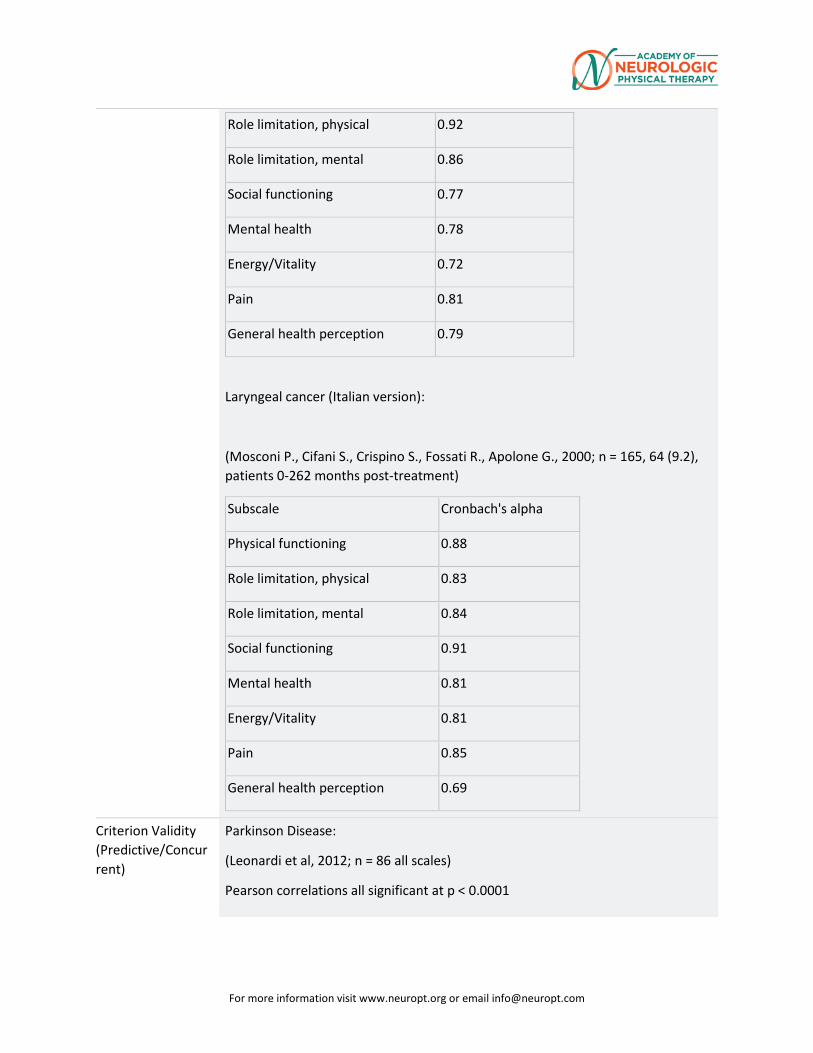
For more information visit www.neuropt.org or email [email protected]
Role limitation, physical 0.92
Role limitation, mental 0.86
Social functioning 0.77
Mental health 0.78
Energy/Vitality 0.72
Pain 0.81
General health perception 0.79
Laryngeal cancer (Italian version):
(Mosconi P., Cifani S., Crispino S., Fossati R., Apolone G., 2000; n = 165, 64 (9.2), patients 0-262 months post-treatment)
Subscale Cronbach's alpha
Physical functioning 0.88
Role limitation, physical 0.83
Role limitation, mental 0.84
Social functioning 0.91
Mental health 0.81
Energy/Vitality 0.81
Pain 0.85
General health perception 0.69
Criterion Validity (Predictive/Concurrent)
Parkinson Disease:
(Leonardi et al, 2012; n = 86 all scales)
Pearson correlations all significant at p < 0.0001
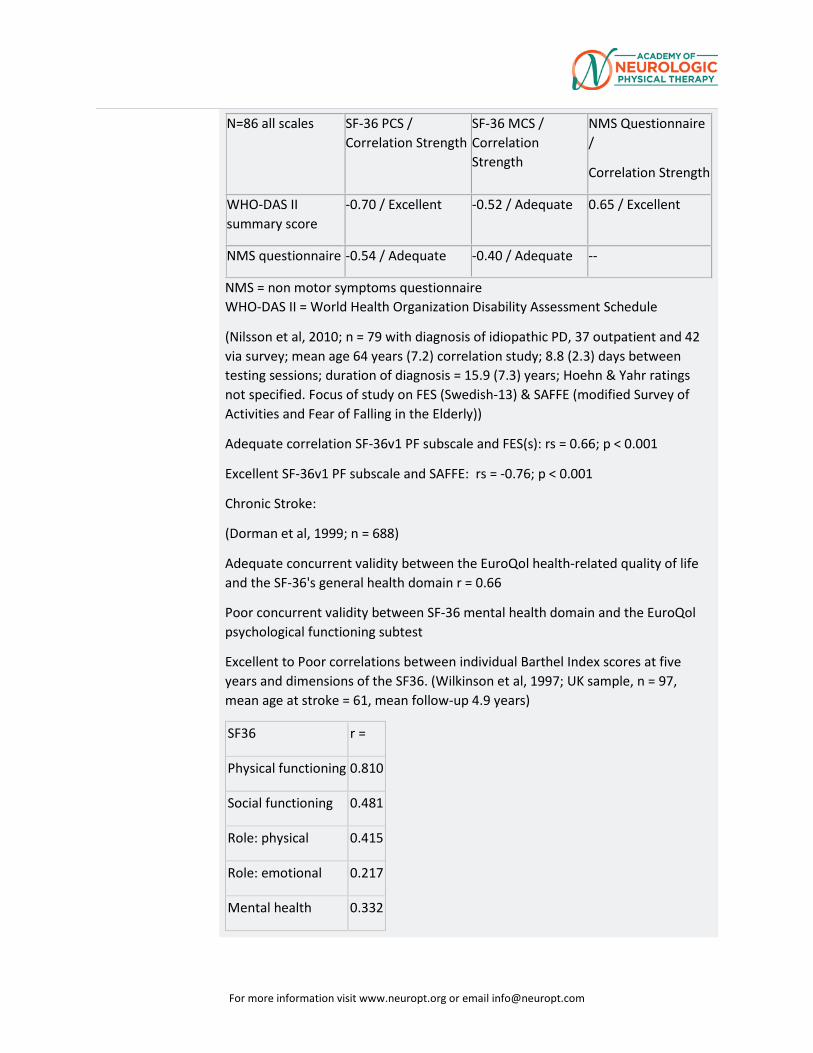
For more information visit www.neuropt.org or email [email protected]
N=86 all scales SF-36 PCS / Correlation Strength
SF-36 MCS / Correlation Strength
NMS Questionnaire /
Correlation Strength
WHO-DAS II summary score
-0.70 / Excellent -0.52 / Adequate 0.65 / Excellent
NMS questionnaire -0.54 / Adequate -0.40 / Adequate --
NMS = non motor symptoms questionnaire WHO-DAS II = World Health Organization Disability Assessment Schedule
(Nilsson et al, 2010; n = 79 with diagnosis of idiopathic PD, 37 outpatient and 42 via survey; mean age 64 years (7.2) correlation study; 8.8 (2.3) days between testing sessions; duration of diagnosis = 15.9 (7.3) years; Hoehn & Yahr ratings not specified. Focus of study on FES (Swedish-13) & SAFFE (modified Survey of Activities and Fear of Falling in the Elderly))
Adequate correlation SF-36v1 PF subscale and FES(s): rs = 0.66; p < 0.001
Excellent SF-36v1 PF subscale and SAFFE: rs = -0.76; p < 0.001
Chronic Stroke:
(Dorman et al, 1999; n = 688)
Adequate concurrent validity between the EuroQol health-related quality of life and the SF-36's general health domain r = 0.66
Poor concurrent validity between SF-36 mental health domain and the EuroQol psychological functioning subtest
Excellent to Poor correlations between individual Barthel Index scores at five years and dimensions of the SF36. (Wilkinson et al, 1997; UK sample, n = 97, mean age at stroke = 61, mean follow-up 4.9 years)
SF36 r =
Physical functioning 0.810
Social functioning 0.481
Role: physical 0.415
Role: emotional 0.217
Mental health 0.332
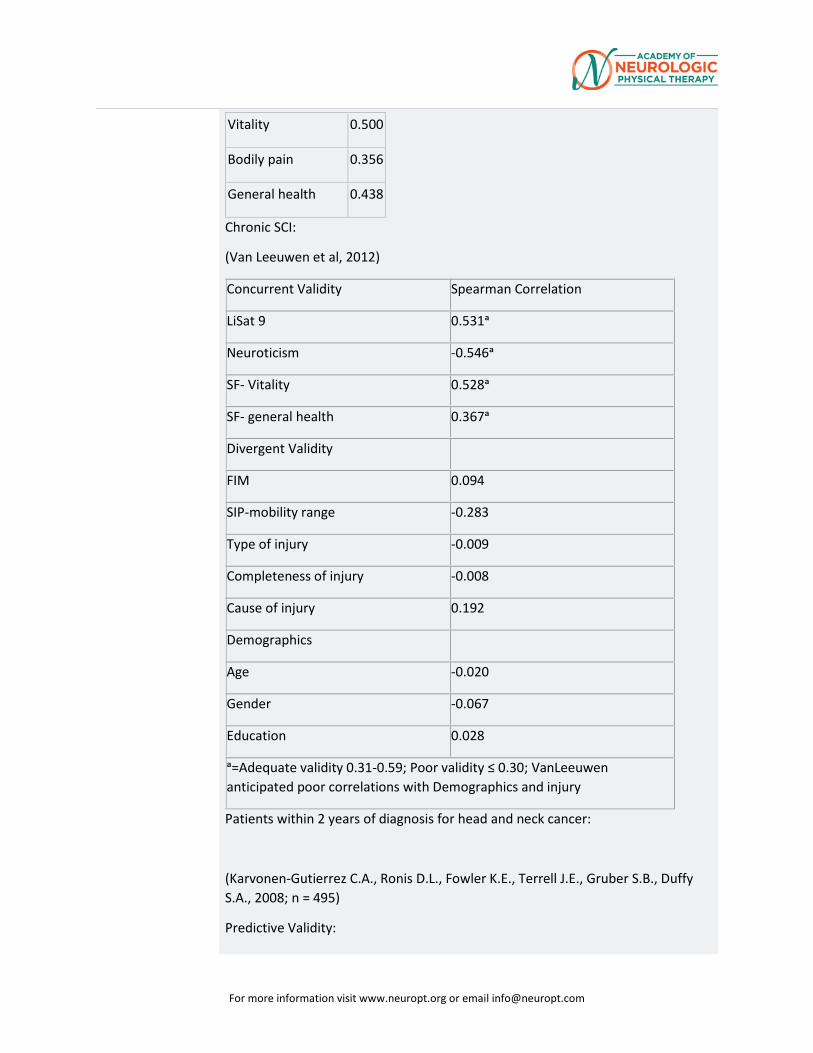
For more information visit www.neuropt.org or email [email protected]
Vitality 0.500
Bodily pain 0.356
General health 0.438
Chronic SCI:
(Van Leeuwen et al, 2012)
Concurrent Validity Spearman Correlation
LiSat 9 0.531ᵃ
Neuroticism -0.546ᵃ
SF- Vitality 0.528ᵃ
SF- general health 0.367ᵃ
Divergent Validity
FIM 0.094
SIP-mobility range -0.283
Type of injury -0.009
Completeness of injury -0.008
Cause of injury 0.192
Demographics
Age -0.020
Gender -0.067
Education 0.028
ᵃ=Adequate validity 0.31-0.59; Poor validity ≤ 0.30; VanLeeuwen anticipated poor correlations with Demographics and injury
Patients within 2 years of diagnosis for head and neck cancer:
(Karvonen-Gutierrez C.A., Ronis D.L., Fowler K.E., Terrell J.E., Gruber S.B., Duffy S.A., 2008; n = 495)
Predictive Validity:
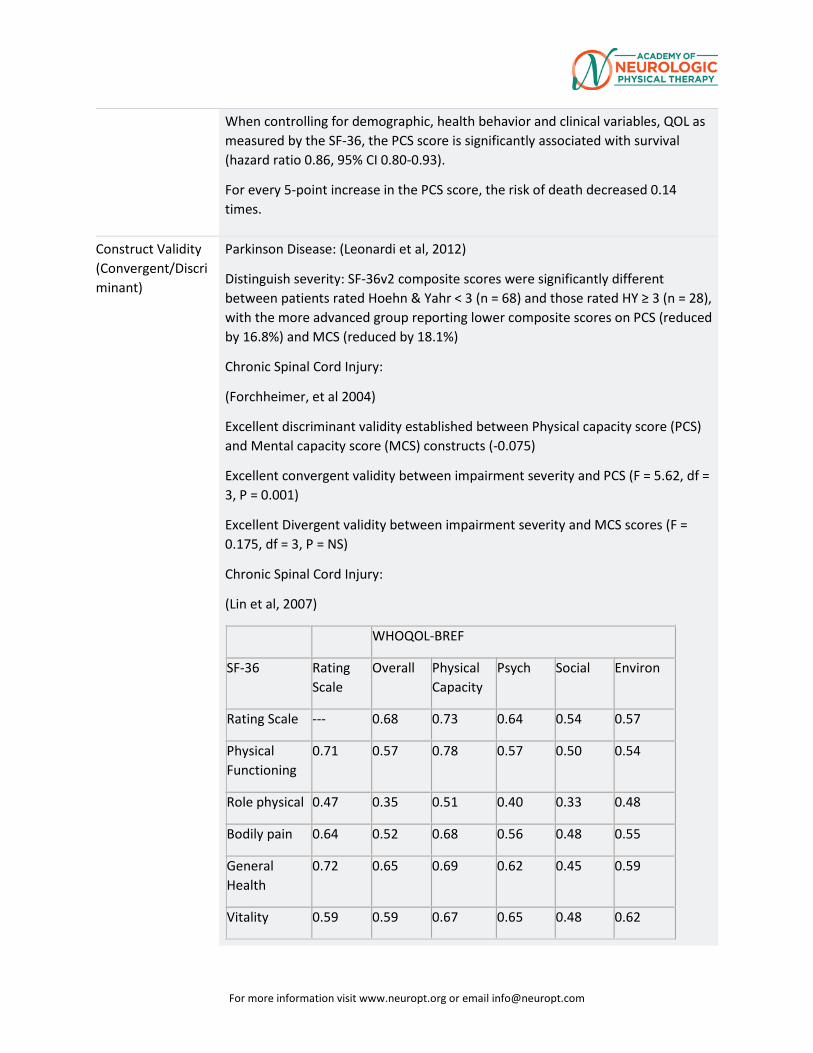
For more information visit www.neuropt.org or email [email protected]
When controlling for demographic, health behavior and clinical variables, QOL as measured by the SF-36, the PCS score is significantly associated with survival (hazard ratio 0.86, 95% CI 0.80-0.93).
For every 5-point increase in the PCS score, the risk of death decreased 0.14 times.
Construct Validity (Convergent/Discriminant)
Parkinson Disease: (Leonardi et al, 2012)
Distinguish severity: SF-36v2 composite scores were significantly different between patients rated Hoehn & Yahr < 3 (n = 68) and those rated HY ≥ 3 (n = 28), with the more advanced group reporting lower composite scores on PCS (reduced by 16.8%) and MCS (reduced by 18.1%)
Chronic Spinal Cord Injury:
(Forchheimer, et al 2004)
Excellent discriminant validity established between Physical capacity score (PCS) and Mental capacity score (MCS) constructs (-0.075)
Excellent convergent validity between impairment severity and PCS (F = 5.62, df = 3, P = 0.001)
Excellent Divergent validity between impairment severity and MCS scores (F = 0.175, df = 3, P = NS)
Chronic Spinal Cord Injury:
(Lin et al, 2007)
WHOQOL-BREF
SF-36 Rating Scale
Overall Physical Capacity
Psych Social Environ
Rating Scale --- 0.68 0.73 0.64 0.54 0.57
Physical Functioning
0.71 0.57 0.78 0.57 0.50 0.54
Role physical 0.47 0.35 0.51 0.40 0.33 0.48
Bodily pain 0.64 0.52 0.68 0.56 0.48 0.55
General Health
0.72 0.65 0.69 0.62 0.45 0.59
Vitality 0.59 0.59 0.67 0.65 0.48 0.62
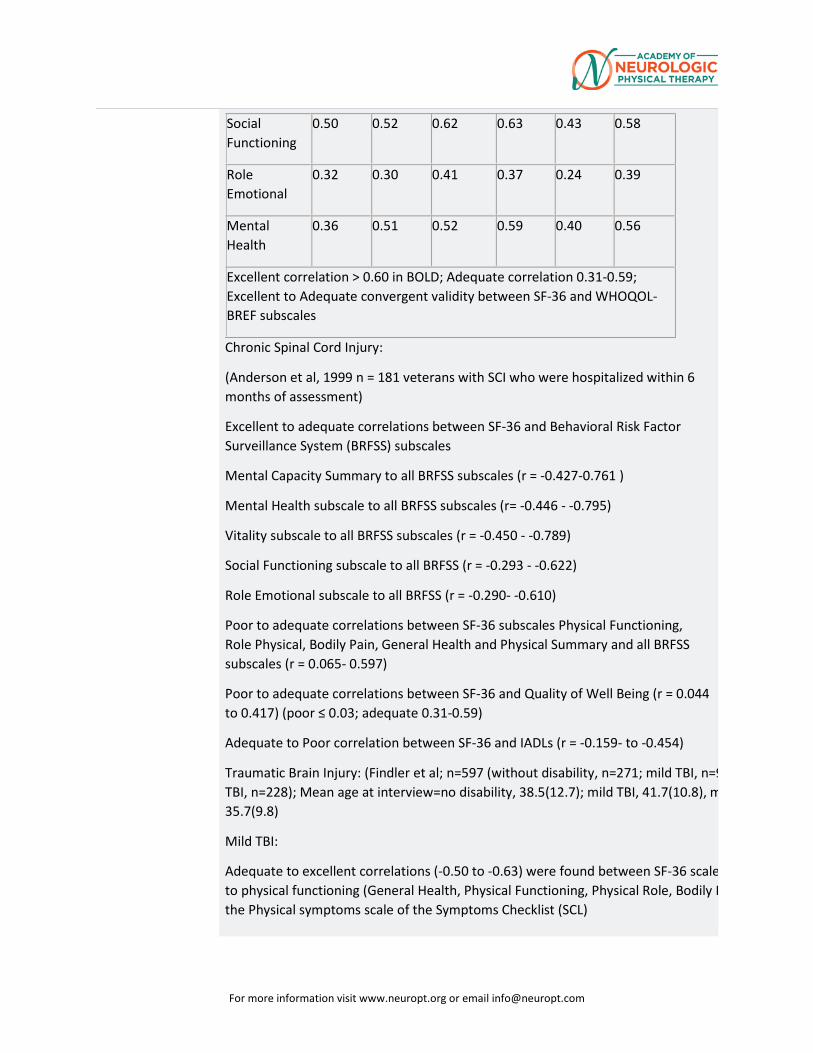
For more information visit www.neuropt.org or email [email protected]
Social Functioning
0.50 0.52 0.62 0.63 0.43 0.58
Role Emotional
0.32 0.30 0.41 0.37 0.24 0.39
Mental Health
0.36 0.51 0.52 0.59 0.40 0.56
Excellent correlation > 0.60 in BOLD; Adequate correlation 0.31-0.59; Excellent to Adequate convergent validity between SF-36 and WHOQOL-BREF subscales
Chronic Spinal Cord Injury:
(Anderson et al, 1999 n = 181 veterans with SCI who were hospitalized within 6 months of assessment)
Excellent to adequate correlations between SF-36 and Behavioral Risk Factor Surveillance System (BRFSS) subscales
Mental Capacity Summary to all BRFSS subscales (r = -0.427-0.761 )
Mental Health subscale to all BRFSS subscales (r= -0.446 - -0.795)
Vitality subscale to all BRFSS subscales (r = -0.450 - -0.789)
Social Functioning subscale to all BRFSS (r = -0.293 - -0.622)
Role Emotional subscale to all BRFSS (r = -0.290- -0.610)
Poor to adequate correlations between SF-36 subscales Physical Functioning, Role Physical, Bodily Pain, General Health and Physical Summary and all BRFSS subscales (r = 0.065- 0.597)
Poor to adequate correlations between SF-36 and Quality of Well Being (r = 0.044 to 0.417) (poor ≤ 0.03; adequate 0.31-0.59)
Adequate to Poor correlation between SF-36 and IADLs (r = -0.159- to -0.454)
Traumatic Brain Injury: (Findler et al; n=597 (without disability, n=271; mild TBI, n=9 TBI, n=228); Mean age at interview=no disability, 38.5(12.7); mild TBI, 41.7(10.8), m 35.7(9.8)
Mild TBI:
Adequate to excellent correlations (-0.50 to -0.63) were found between SF-36 scale to physical functioning (General Health, Physical Functioning, Physical Role, Bodily P the Physical symptoms scale of the Symptoms Checklist (SCL)
For more information visit www.neuropt.org or email [email protected]
Excellent correlations between SF-36 scales and participants’ Health Problems List (HPL) responses 0.60 to -0.75)
Emotional Role and Mental Health scores were more strongly related to psychological factors (Cognitive and Affective/Behavioral) than to physical factors on the Symptom Checklist (SCL)
Adequate to excellent correlations (-0.52 to -0.77) were found between Beck Depression Inventory second edition (BDI-II) scores and the SF-36 subscales
Moderate to Severe TBI:
Correlations were lower and more uniform, strongest correlations found between the SF-36 Emotio Role scale and the SCL Affective/Behavioral scale (-0.53).
Correlations between the Physical Functioning scale of the SF-36 and the Cognitive and Affective/Behavioural scales of the SCL were lower than other correlations between scales within th group (-0.11 and -0.19, respectively).
Multiple Neurologic Diagnosis (polio, acute stroke, and TBI): McNaughton et al., 2005; n=308, Polio n=38, Stroke n=181, TBI n=89; mean age=polio 62.5 (11.3), stroke=74.4 (12.0), TBI=34.0 (17.8); gend female=polio 27%, stroke 96%, TBI 32%)
examined validity of the mental component score (MCS) and physical component score (PCS)
Principal component analysis (PCA) on the 12-month measures for subjects with stroke and TBI: 2 dimensions might account for a large proportion of the variability in the data set
Varimax rotation shows that the 2-factor model has 85% of the variance of the underlying variables with 1 factor loading mainly onto the Barthel Index, Functional Independence Meausre (FIM), PCS,Community Integration Questionnaire (CIQ), and London Handicap Scale (LHS) and the other fa mainly onto the MCS
Traumatic Brain Injury: (Guilfoyle et al; n=514; mean age=36.6 (16.1) years; gender=male 76.3%)
Principal component analysis (PCA) of the correlation matrix of the eight SF-36 domains extracted a single PC with an eigenvalue exceeding unity, which explained 59.2% of the variance in the data
The second PC extracted had an associated eigenvalue of 0.75, and accounted for only 9.4% of the variance
Known Groups
Traumatic Brain Injury: (Findler et al; n=597 (without disability, n=271; mild TBI, n=98; moderate-se TBI, n=228); Mean age at interview=no disability, 38.5(12.7); mild TBI, 41.7(10.8), moderate-severe 35.7(9.8)
mild TBI and moderate to severe TBI groups reported significantly lower health status across all sca compared to the comparison group
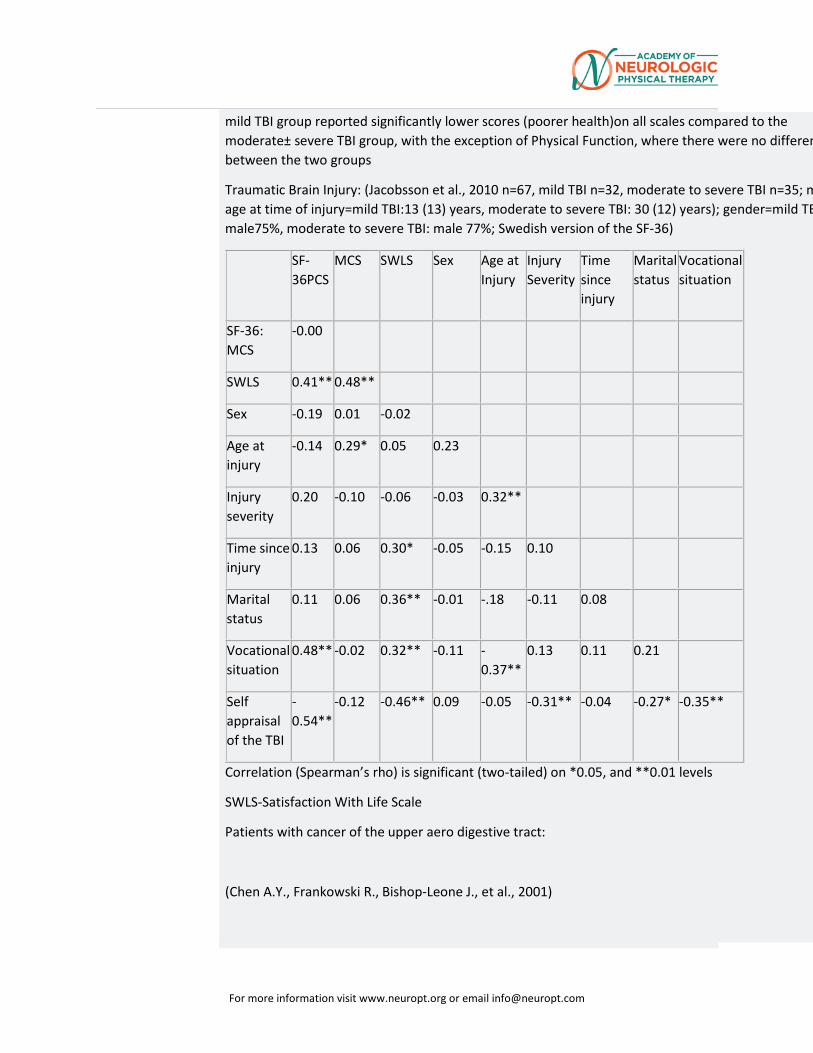
For more information visit www.neuropt.org or email [email protected]
mild TBI group reported significantly lower scores (poorer health)on all scales compared to the moderate± severe TBI group, with the exception of Physical Function, where there were no differen between the two groups
Traumatic Brain Injury: (Jacobsson et al., 2010 n=67, mild TBI n=32, moderate to severe TBI n=35; m age at time of injury=mild TBI:13 (13) years, moderate to severe TBI: 30 (12) years); gender=mild TB male75%, moderate to severe TBI: male 77%; Swedish version of the SF-36)
SF-36PCS
MCS SWLS Sex Age at Injury
Injury Severity
Time since injury
Marital status
Vocational situation
SF-36: MCS
-0.00
SWLS 0.41** 0.48**
Sex -0.19 0.01 -0.02
Age at injury
-0.14 0.29* 0.05 0.23
Injury severity
0.20 -0.10 -0.06 -0.03 0.32**
Time since injury
0.13 0.06 0.30* -0.05 -0.15 0.10
Marital status
0.11 0.06 0.36** -0.01 -.18 -0.11 0.08
Vocational situation
0.48** -0.02 0.32** -0.11 -0.37**
0.13 0.11 0.21
Self appraisal of the TBI
-0.54**
-0.12 -0.46** 0.09 -0.05 -0.31** -0.04 -0.27* -0.35**
Correlation (Spearman’s rho) is significant (two-tailed) on *0.05, and **0.01 levels
SWLS-Satisfaction With Life Scale
Patients with cancer of the upper aero digestive tract:
(Chen A.Y., Frankowski R., Bishop-Leone J., et al., 2001)
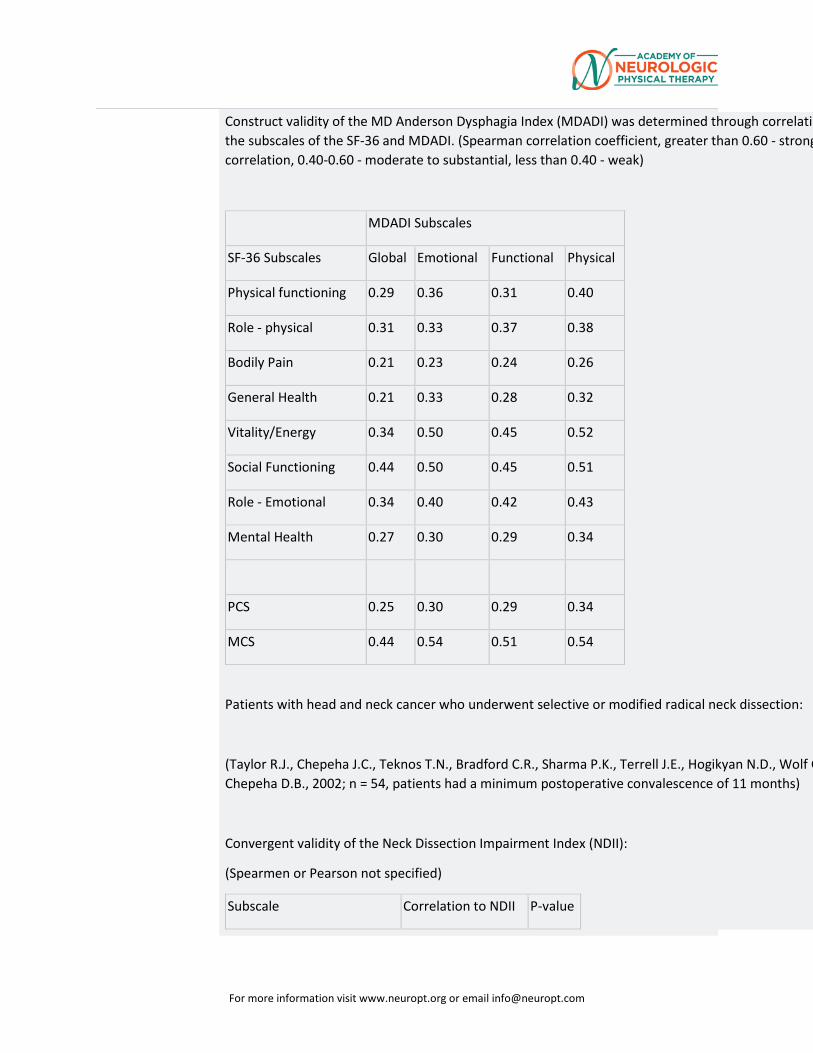
For more information visit www.neuropt.org or email [email protected]
Construct validity of the MD Anderson Dysphagia Index (MDADI) was determined through correlatin the subscales of the SF-36 and MDADI. (Spearman correlation coefficient, greater than 0.60 - strong correlation, 0.40-0.60 - moderate to substantial, less than 0.40 - weak)
MDADI Subscales
SF-36 Subscales Global Emotional Functional Physical
Physical functioning 0.29 0.36 0.31 0.40
Role - physical 0.31 0.33 0.37 0.38
Bodily Pain 0.21 0.23 0.24 0.26
General Health 0.21 0.33 0.28 0.32
Vitality/Energy 0.34 0.50 0.45 0.52
Social Functioning 0.44 0.50 0.45 0.51
Role - Emotional 0.34 0.40 0.42 0.43
Mental Health 0.27 0.30 0.29 0.34
PCS 0.25 0.30 0.29 0.34
MCS 0.44 0.54 0.51 0.54
Patients with head and neck cancer who underwent selective or modified radical neck dissection:
(Taylor R.J., Chepeha J.C., Teknos T.N., Bradford C.R., Sharma P.K., Terrell J.E., Hogikyan N.D., Wolf G Chepeha D.B., 2002; n = 54, patients had a minimum postoperative convalescence of 11 months)
Convergent validity of the Neck Dissection Impairment Index (NDII):
(Spearmen or Pearson not specified)
Subscale Correlation to NDII P-value
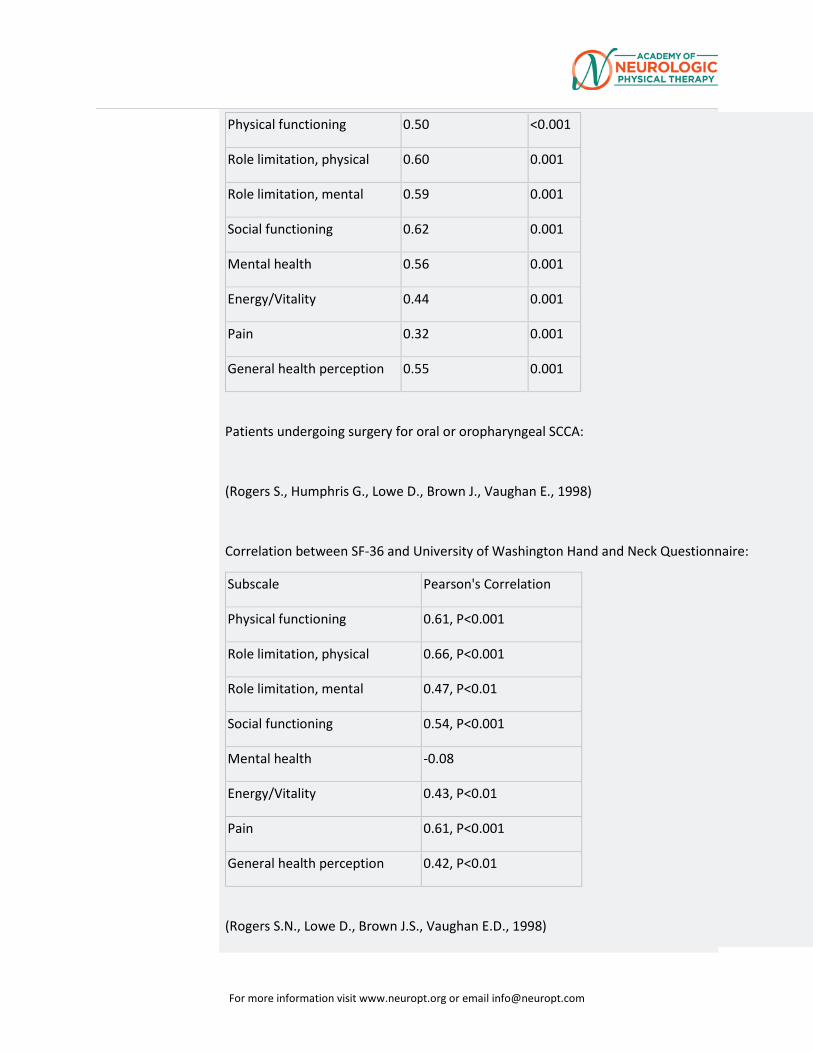
For more information visit www.neuropt.org or email [email protected]
Physical functioning 0.50 <0.001
Role limitation, physical 0.60 0.001
Role limitation, mental 0.59 0.001
Social functioning 0.62 0.001
Mental health 0.56 0.001
Energy/Vitality 0.44 0.001
Pain 0.32 0.001
General health perception 0.55 0.001
Patients undergoing surgery for oral or oropharyngeal SCCA:
(Rogers S., Humphris G., Lowe D., Brown J., Vaughan E., 1998)
Correlation between SF-36 and University of Washington Hand and Neck Questionnaire:
Subscale Pearson's Correlation
Physical functioning 0.61, P<0.001
Role limitation, physical 0.66, P<0.001
Role limitation, mental 0.47, P<0.01
Social functioning 0.54, P<0.001
Mental health -0.08
Energy/Vitality 0.43, P<0.01
Pain 0.61, P<0.001
General health perception 0.42, P<0.01
(Rogers S.N., Lowe D., Brown J.S., Vaughan E.D., 1998)
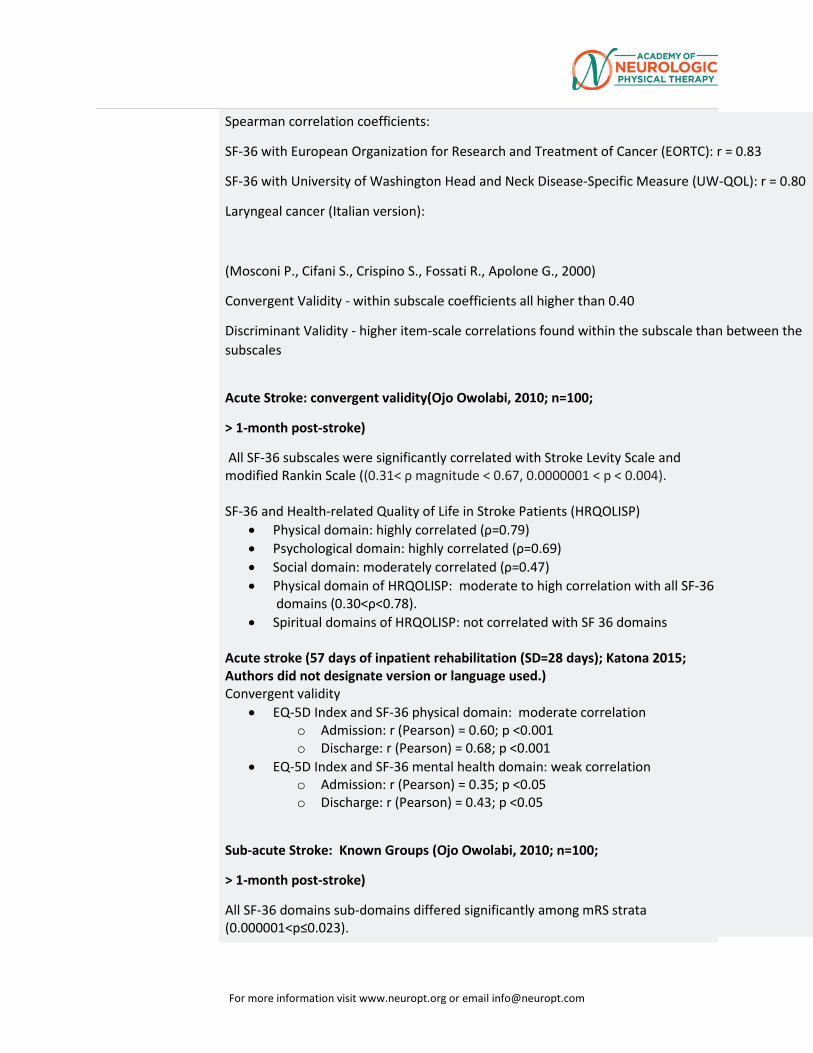
For more information visit www.neuropt.org or email [email protected]
Spearman correlation coefficients:
SF-36 with European Organization for Research and Treatment of Cancer (EORTC): r = 0.83
SF-36 with University of Washington Head and Neck Disease-Specific Measure (UW-QOL): r = 0.80
Laryngeal cancer (Italian version):
(Mosconi P., Cifani S., Crispino S., Fossati R., Apolone G., 2000)
Convergent Validity - within subscale coefficients all higher than 0.40
Discriminant Validity - higher item-scale correlations found within the subscale than between the subscales
Acute Stroke: convergent validity(Ojo Owolabi, 2010; n=100;
> 1-month post-stroke)
All SF-36 subscales were significantly correlated with Stroke Levity Scale and modified Rankin Scale ((0.31< ρ magnitude < 0.67, 0.0000001 < p < 0.004). SF-36 and Health-related Quality of Life in Stroke Patients (HRQOLISP)
• Physical domain: highly correlated (ρ=0.79) • Psychological domain: highly correlated (ρ=0.69) • Social domain: moderately correlated (ρ=0.47) • Physical domain of HRQOLISP: moderate to high correlation with all SF-36
domains (0.30<ρ<0.78). • Spiritual domains of HRQOLISP: not correlated with SF 36 domains
Acute stroke (57 days of inpatient rehabilitation (SD=28 days); Katona 2015; Authors did not designate version or language used.) Convergent validity
• EQ-5D Index and SF-36 physical domain: moderate correlation o Admission: r (Pearson) = 0.60; p <0.001 o Discharge: r (Pearson) = 0.68; p <0.001
• EQ-5D Index and SF-36 mental health domain: weak correlation o Admission: r (Pearson) = 0.35; p <0.05 o Discharge: r (Pearson) = 0.43; p <0.05
Sub-acute Stroke: Known Groups (Ojo Owolabi, 2010; n=100;
> 1-month post-stroke)
All SF-36 domains sub-domains differed significantly among mRS strata (0.000001<p≤0.023).
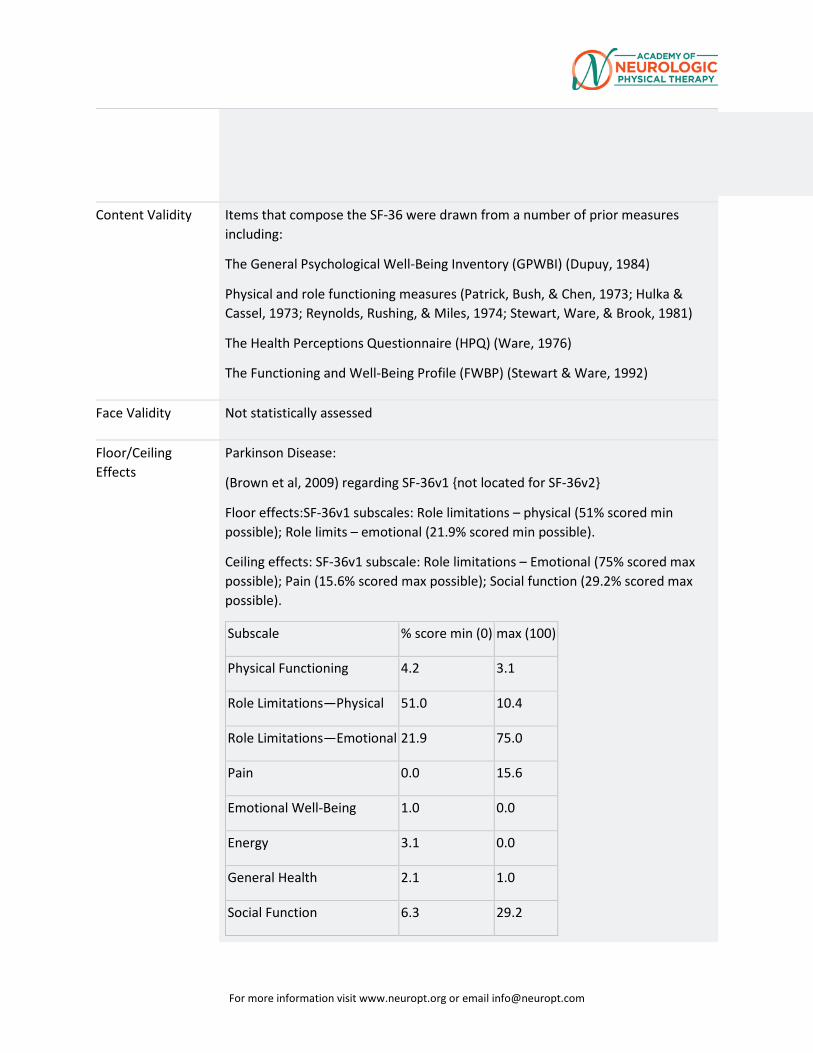
For more information visit www.neuropt.org or email [email protected]
Content Validity Items that compose the SF-36 were drawn from a number of prior measures including:
The General Psychological Well-Being Inventory (GPWBI) (Dupuy, 1984)
Physical and role functioning measures (Patrick, Bush, & Chen, 1973; Hulka & Cassel, 1973; Reynolds, Rushing, & Miles, 1974; Stewart, Ware, & Brook, 1981)
The Health Perceptions Questionnaire (HPQ) (Ware, 1976)
The Functioning and Well-Being Profile (FWBP) (Stewart & Ware, 1992)
Face Validity Not statistically assessed
Floor/Ceiling Effects
Parkinson Disease:
(Brown et al, 2009) regarding SF-36v1 {not located for SF-36v2}
Floor effects:SF-36v1 subscales: Role limitations – physical (51% scored min possible); Role limits – emotional (21.9% scored min possible).
Ceiling effects: SF-36v1 subscale: Role limitations – Emotional (75% scored max possible); Pain (15.6% scored max possible); Social function (29.2% scored max possible).
Subscale % score min (0) max (100)
Physical Functioning 4.2 3.1
Role Limitations—Physical 51.0 10.4
Role Limitations—Emotional 21.9 75.0
Pain 0.0 15.6
Emotional Well-Being 1.0 0.0
Energy 3.1 0.0
General Health 2.1 1.0
Social Function 6.3 29.2
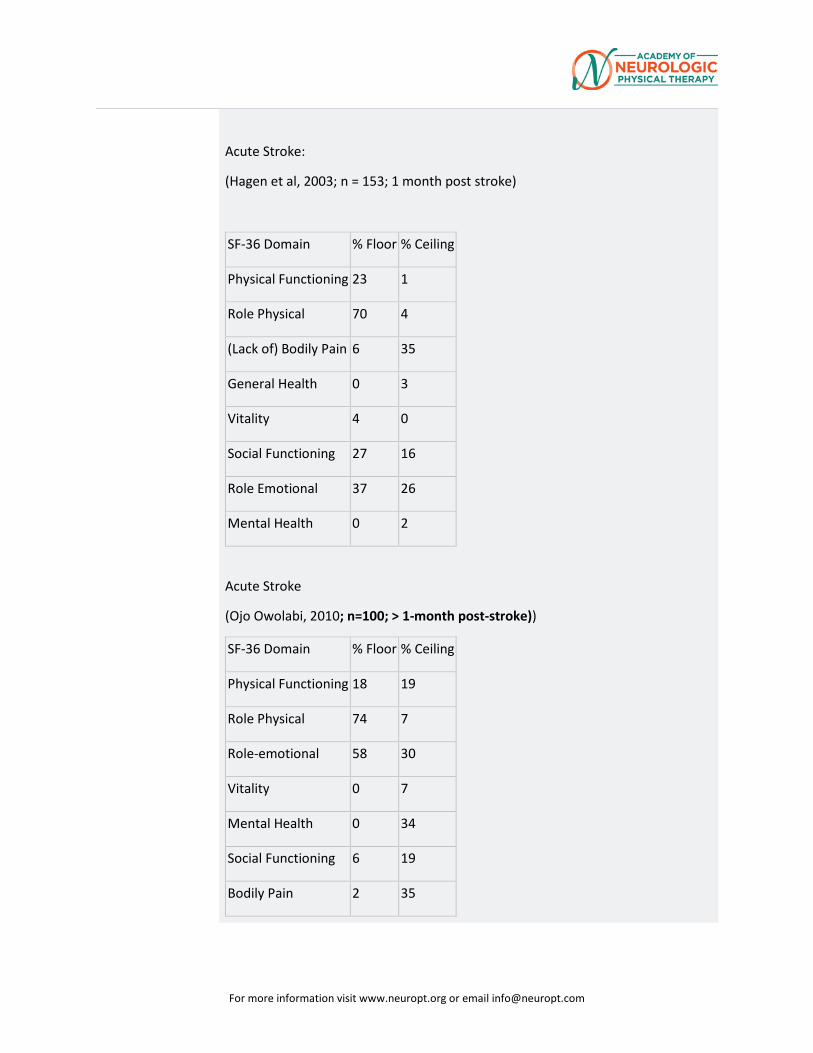
For more information visit www.neuropt.org or email [email protected]
Acute Stroke:
(Hagen et al, 2003; n = 153; 1 month post stroke)
SF-36 Domain % Floor % Ceiling
Physical Functioning 23 1
Role Physical 70 4
(Lack of) Bodily Pain 6 35
General Health 0 3
Vitality 4 0
Social Functioning 27 16
Role Emotional 37 26
Mental Health 0 2
Acute Stroke
(Ojo Owolabi, 2010; n=100; > 1-month post-stroke))
SF-36 Domain % Floor % Ceiling
Physical Functioning 18 19
Role Physical 74 7
Role-emotional 58 30
Vitality 0 7
Mental Health 0 34
Social Functioning 6 19
Bodily Pain 2 35
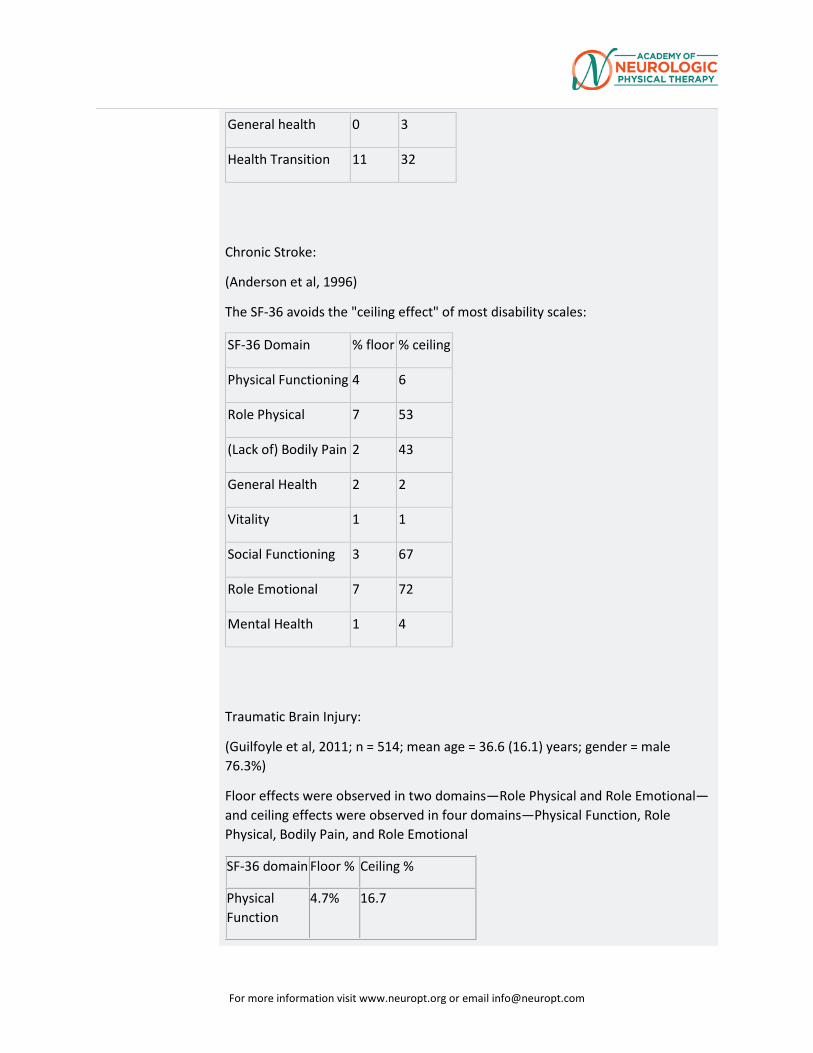
For more information visit www.neuropt.org or email [email protected]
General health 0 3
Health Transition 11 32
Chronic Stroke:
(Anderson et al, 1996)
The SF-36 avoids the "ceiling effect" of most disability scales:
SF-36 Domain % floor % ceiling
Physical Functioning 4 6
Role Physical 7 53
(Lack of) Bodily Pain 2 43
General Health 2 2
Vitality 1 1
Social Functioning 3 67
Role Emotional 7 72
Mental Health 1 4
Traumatic Brain Injury:
(Guilfoyle et al, 2011; n = 514; mean age = 36.6 (16.1) years; gender = male 76.3%)
Floor effects were observed in two domains—Role Physical and Role Emotional—and ceiling effects were observed in four domains—Physical Function, Role Physical, Bodily Pain, and Role Emotional
SF-36 domain Floor % Ceiling %
Physical Function
4.7% 16.7
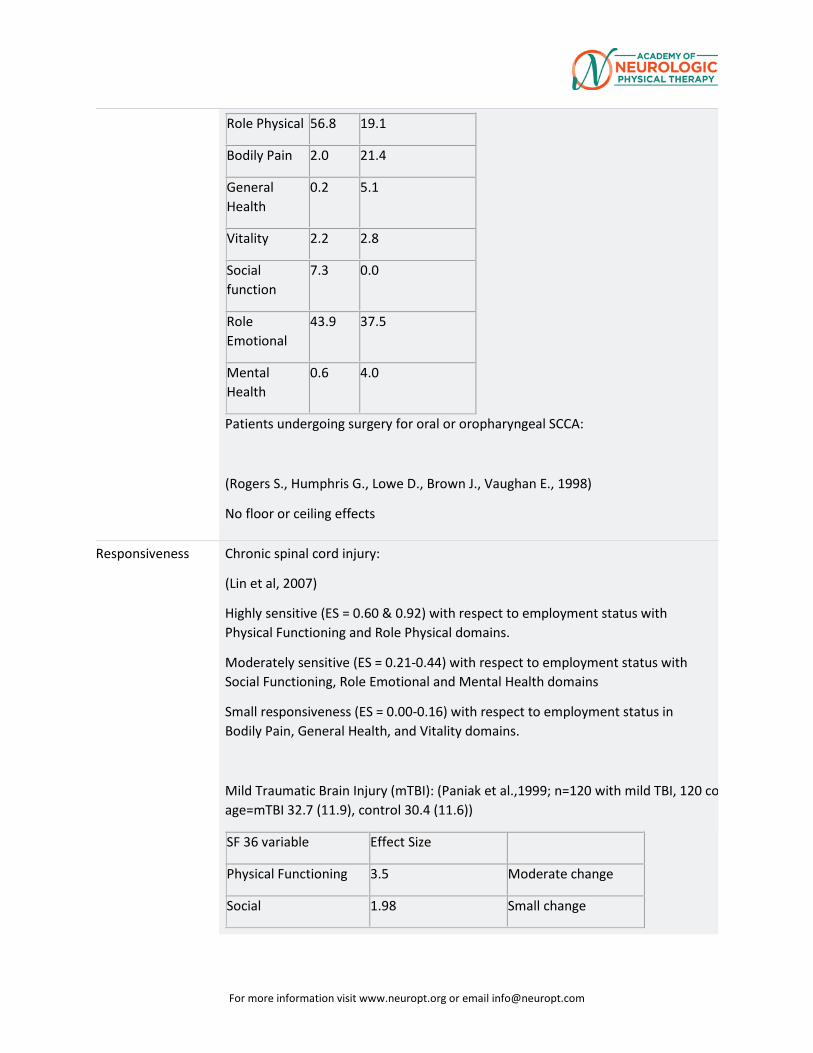
For more information visit www.neuropt.org or email [email protected]
Role Physical 56.8 19.1
Bodily Pain 2.0 21.4
General Health
0.2 5.1
Vitality 2.2 2.8
Social function
7.3 0.0
Role Emotional
43.9 37.5
Mental Health
0.6 4.0
Patients undergoing surgery for oral or oropharyngeal SCCA:
(Rogers S., Humphris G., Lowe D., Brown J., Vaughan E., 1998)
No floor or ceiling effects
Responsiveness Chronic spinal cord injury:
(Lin et al, 2007)
Highly sensitive (ES = 0.60 & 0.92) with respect to employment status with Physical Functioning and Role Physical domains.
Moderately sensitive (ES = 0.21-0.44) with respect to employment status with Social Functioning, Role Emotional and Mental Health domains
Small responsiveness (ES = 0.00-0.16) with respect to employment status in Bodily Pain, General Health, and Vitality domains.
Mild Traumatic Brain Injury (mTBI): (Paniak et al.,1999; n=120 with mild TBI, 120 co age=mTBI 32.7 (11.9), control 30.4 (11.6))
SF 36 variable Effect Size
Physical Functioning 3.5 Moderate change
Social 1.98 Small change
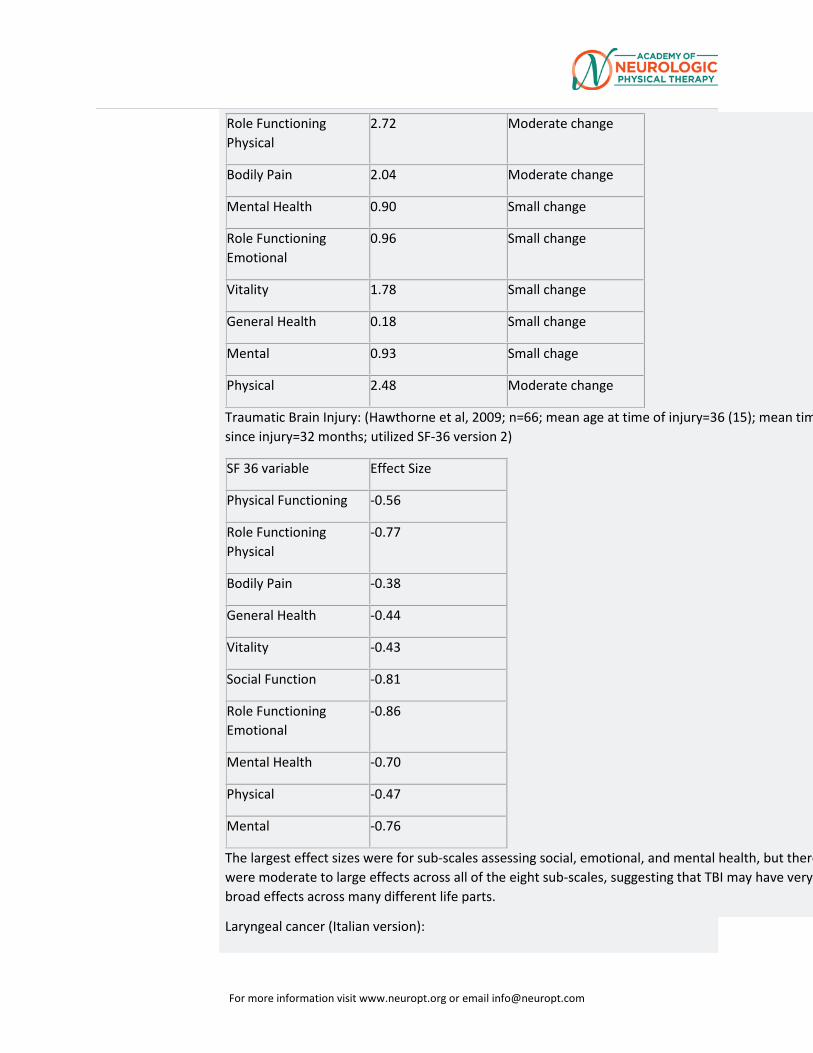
For more information visit www.neuropt.org or email [email protected]
Role Functioning Physical
2.72 Moderate change
Bodily Pain 2.04 Moderate change
Mental Health 0.90 Small change
Role Functioning Emotional
0.96 Small change
Vitality 1.78 Small change
General Health 0.18 Small change
Mental 0.93 Small chage
Physical 2.48 Moderate change
Traumatic Brain Injury: (Hawthorne et al, 2009; n=66; mean age at time of injury=36 (15); mean tim since injury=32 months; utilized SF-36 version 2)
SF 36 variable Effect Size
Physical Functioning -0.56
Role Functioning Physical
-0.77
Bodily Pain -0.38
General Health -0.44
Vitality -0.43
Social Function -0.81
Role Functioning Emotional
-0.86
Mental Health -0.70
Physical -0.47
Mental -0.76
The largest effect sizes were for sub-scales assessing social, emotional, and mental health, but there were moderate to large effects across all of the eight sub-scales, suggesting that TBI may have very broad effects across many different life parts.
Laryngeal cancer (Italian version):
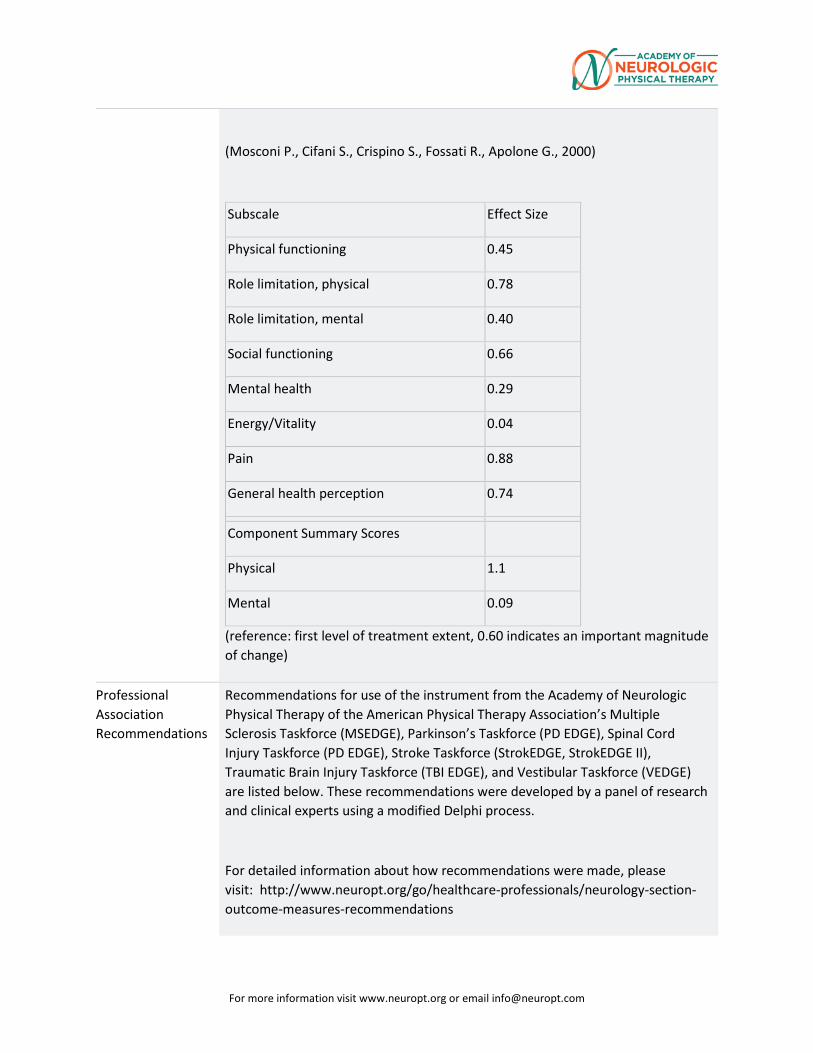
For more information visit www.neuropt.org or email [email protected]
(Mosconi P., Cifani S., Crispino S., Fossati R., Apolone G., 2000)
Subscale Effect Size
Physical functioning 0.45
Role limitation, physical 0.78
Role limitation, mental 0.40
Social functioning 0.66
Mental health 0.29
Energy/Vitality 0.04
Pain 0.88
General health perception 0.74 Component Summary Scores
Physical 1.1
Mental 0.09
(reference: first level of treatment extent, 0.60 indicates an important magnitude of change)
Professional Association Recommendations
Recommendations for use of the instrument from the Academy of Neurologic Physical Therapy of the American Physical Therapy Association’s Multiple Sclerosis Taskforce (MSEDGE), Parkinson’s Taskforce (PD EDGE), Spinal Cord Injury Taskforce (PD EDGE), Stroke Taskforce (StrokEDGE, StrokEDGE II), Traumatic Brain Injury Taskforce (TBI EDGE), and Vestibular Taskforce (VEDGE) are listed below. These recommendations were developed by a panel of research and clinical experts using a modified Delphi process.
For detailed information about how recommendations were made, please visit: http://www.neuropt.org/go/healthcare-professionals/neurology-section-outcome-measures-recommendations
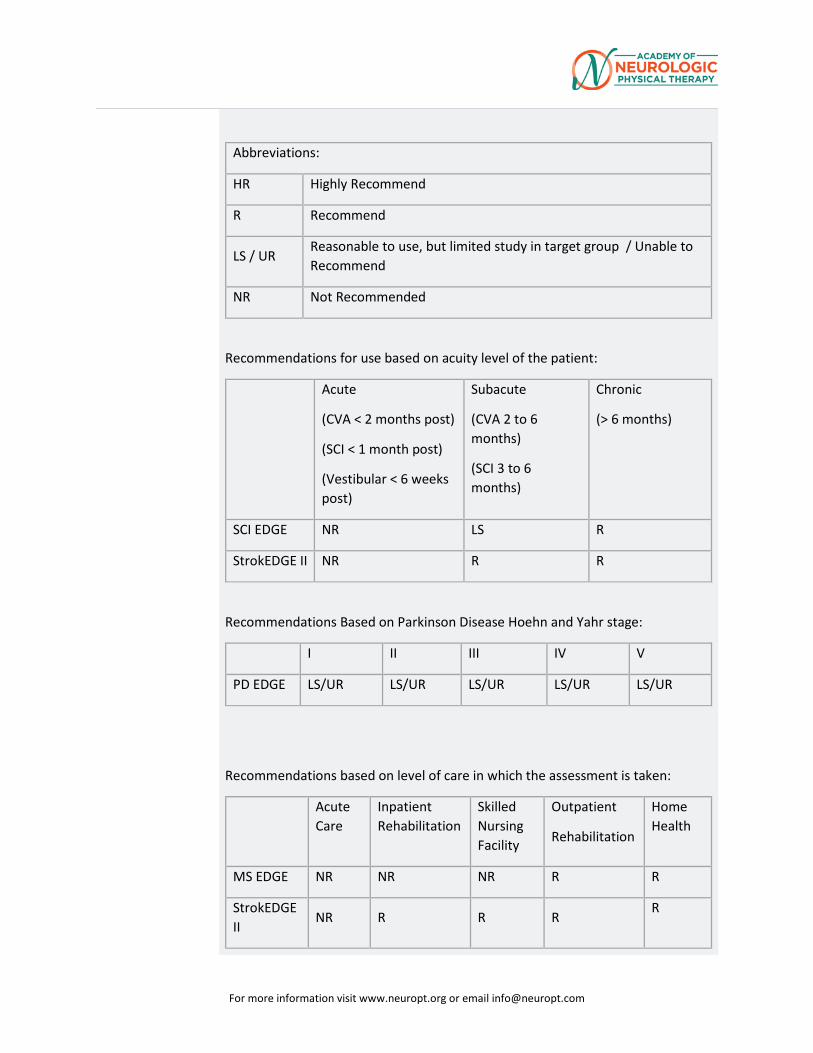
For more information visit www.neuropt.org or email [email protected]
Abbreviations:
HR Highly Recommend
R Recommend
LS / UR Reasonable to use, but limited study in target group / Unable to Recommend
NR Not Recommended
Recommendations for use based on acuity level of the patient:
Acute
(CVA < 2 months post)
(SCI < 1 month post)
(Vestibular < 6 weeks post)
Subacute
(CVA 2 to 6 months)
(SCI 3 to 6 months)
Chronic
(> 6 months)
SCI EDGE NR LS R
StrokEDGE II NR R R
Recommendations Based on Parkinson Disease Hoehn and Yahr stage:
I II III IV V
PD EDGE LS/UR LS/UR LS/UR LS/UR LS/UR
Recommendations based on level of care in which the assessment is taken:
Acute Care
Inpatient Rehabilitation
Skilled Nursing Facility
Outpatient
Rehabilitation
Home Health
MS EDGE NR NR NR R R
StrokEDGE II
NR R R R R
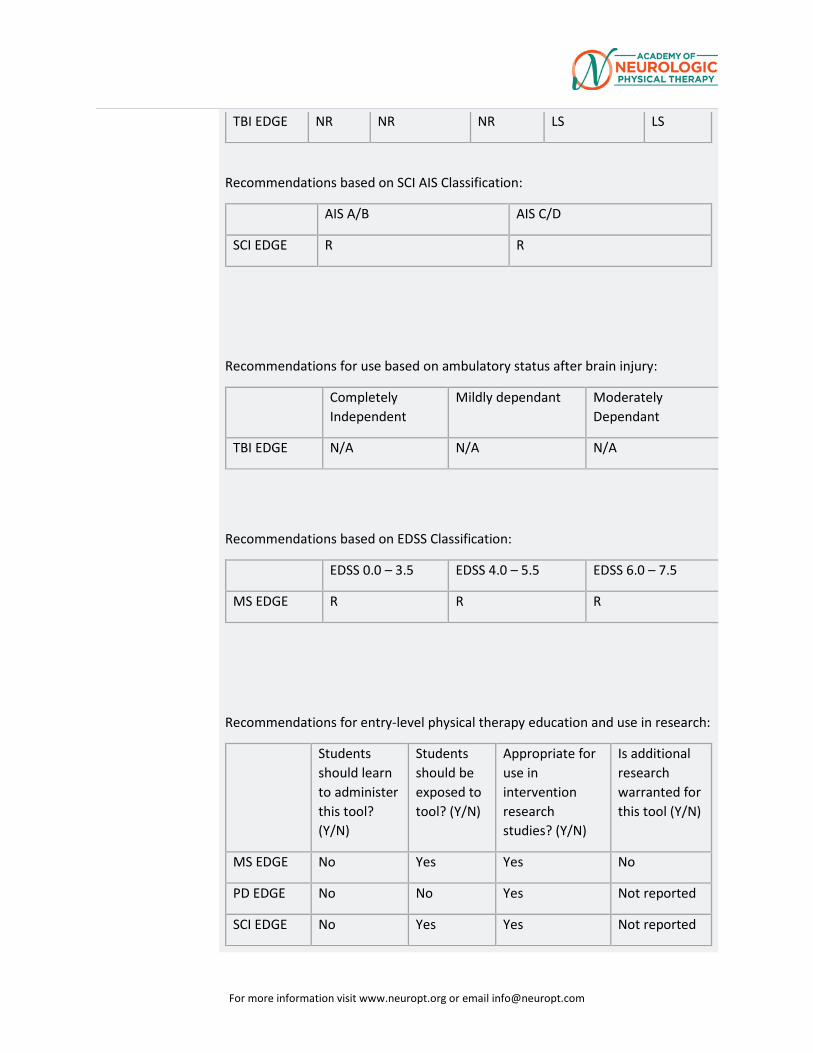
For more information visit www.neuropt.org or email [email protected]
TBI EDGE NR NR NR LS LS
Recommendations based on SCI AIS Classification:
AIS A/B AIS C/D
SCI EDGE R R
Recommendations for use based on ambulatory status after brain injury:
Completely Independent
Mildly dependant Moderately Dependant
TBI EDGE N/A N/A N/A
Recommendations based on EDSS Classification:
EDSS 0.0 – 3.5 EDSS 4.0 – 5.5 EDSS 6.0 – 7.5
MS EDGE R R R
Recommendations for entry-level physical therapy education and use in research:
Students should learn to administer this tool? (Y/N)
Students should be exposed to tool? (Y/N)
Appropriate for use in intervention research studies? (Y/N)
Is additional research warranted for this tool (Y/N)
MS EDGE No Yes Yes No
PD EDGE No No Yes Not reported
SCI EDGE No Yes Yes Not reported
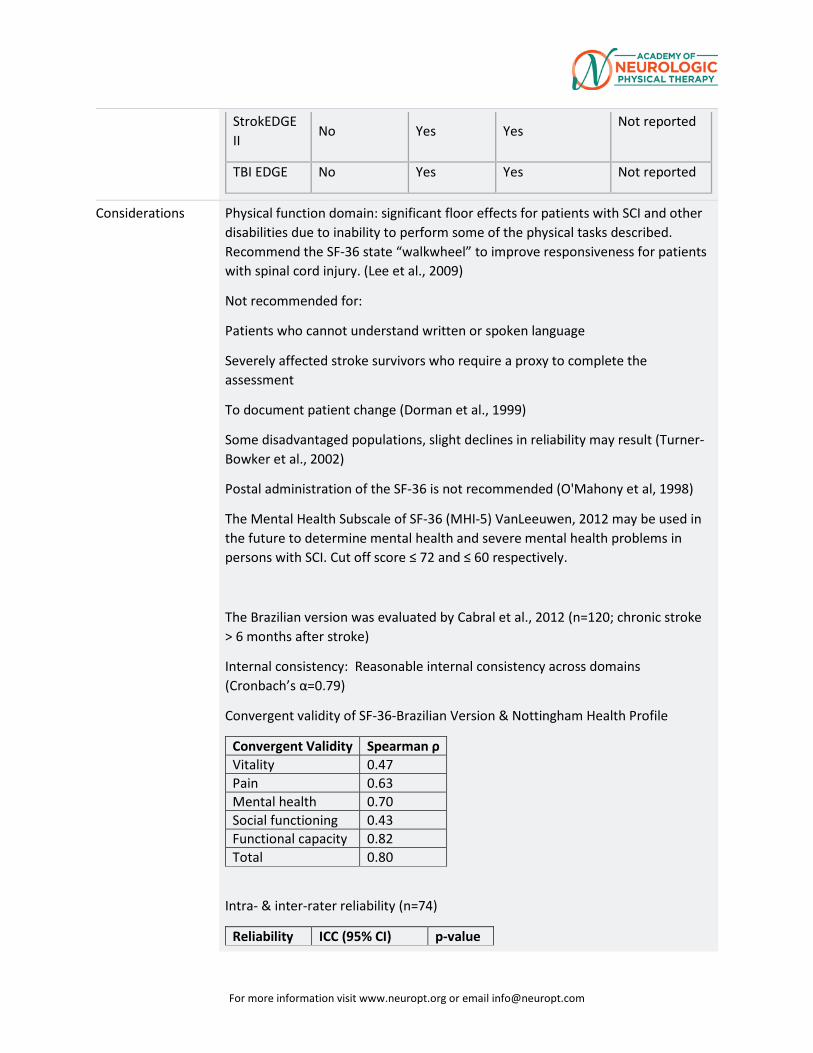
For more information visit www.neuropt.org or email [email protected]
StrokEDGE II
No Yes Yes Not reported
TBI EDGE No Yes Yes Not reported
Considerations Physical function domain: significant floor effects for patients with SCI and other disabilities due to inability to perform some of the physical tasks described. Recommend the SF-36 state “walkwheel” to improve responsiveness for patients with spinal cord injury. (Lee et al., 2009)
Not recommended for:
Patients who cannot understand written or spoken language
Severely affected stroke survivors who require a proxy to complete the assessment
To document patient change (Dorman et al., 1999)
Some disadvantaged populations, slight declines in reliability may result (Turner-Bowker et al., 2002)
Postal administration of the SF-36 is not recommended (O'Mahony et al, 1998)
The Mental Health Subscale of SF-36 (MHI-5) VanLeeuwen, 2012 may be used in the future to determine mental health and severe mental health problems in persons with SCI. Cut off score ≤ 72 and ≤ 60 respectively.
The Brazilian version was evaluated by Cabral et al., 2012 (n=120; chronic stroke > 6 months after stroke)
Internal consistency: Reasonable internal consistency across domains (Cronbach’s α=0.79)
Convergent validity of SF-36-Brazilian Version & Nottingham Health Profile
Convergent Validity Spearman ρ Vitality 0.47 Pain 0.63 Mental health 0.70 Social functioning 0.43 Functional capacity 0.82 Total 0.80
Intra- & inter-rater reliability (n=74)
Reliability ICC (95% CI) p-value
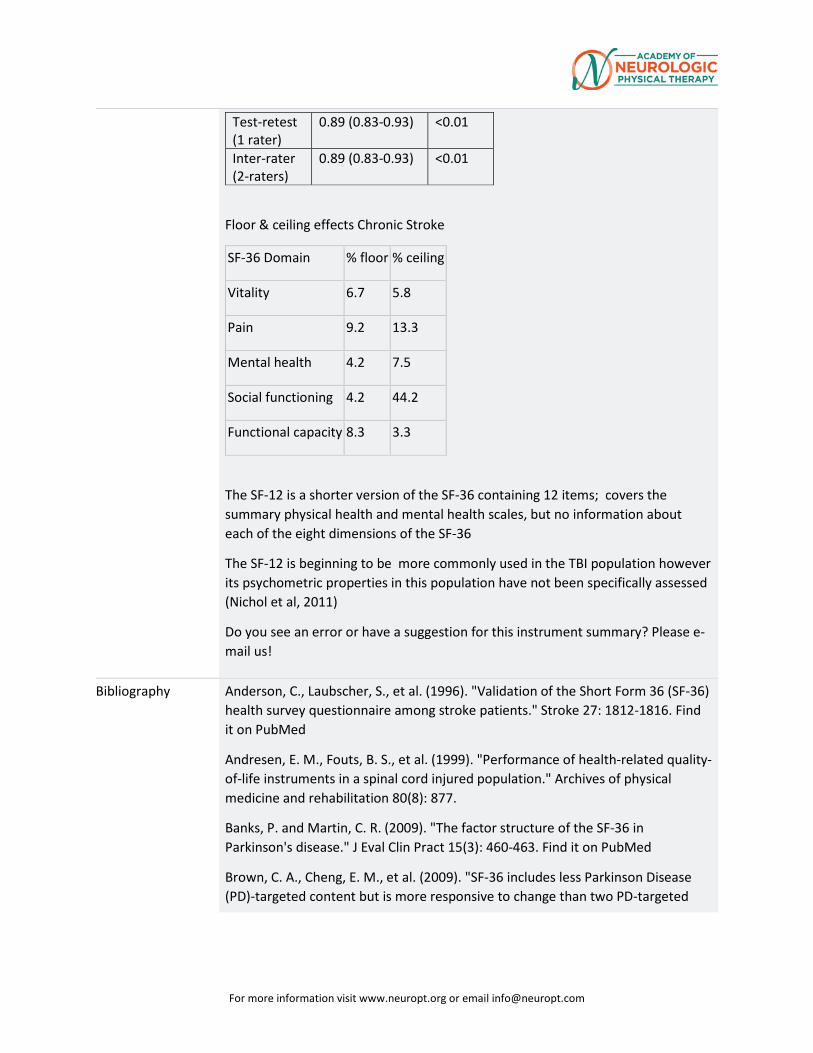
For more information visit www.neuropt.org or email [email protected]
Test-retest (1 rater)
0.89 (0.83-0.93) <0.01
Inter-rater (2-raters)
0.89 (0.83-0.93) <0.01
Floor & ceiling effects Chronic Stroke
SF-36 Domain % floor % ceiling
Vitality 6.7 5.8
Pain 9.2 13.3
Mental health 4.2 7.5
Social functioning 4.2 44.2
Functional capacity 8.3 3.3
The SF-12 is a shorter version of the SF-36 containing 12 items; covers the summary physical health and mental health scales, but no information about each of the eight dimensions of the SF-36
The SF-12 is beginning to be more commonly used in the TBI population however its psychometric properties in this population have not been specifically assessed (Nichol et al, 2011)
Do you see an error or have a suggestion for this instrument summary? Please e-mail us!
Bibliography Anderson, C., Laubscher, S., et al. (1996). "Validation of the Short Form 36 (SF-36) health survey questionnaire among stroke patients." Stroke 27: 1812-1816. Find it on PubMed
Andresen, E. M., Fouts, B. S., et al. (1999). "Performance of health-related quality-of-life instruments in a spinal cord injured population." Archives of physical medicine and rehabilitation 80(8): 877.
Banks, P. and Martin, C. R. (2009). "The factor structure of the SF-36 in Parkinson's disease." J Eval Clin Pract 15(3): 460-463. Find it on PubMed
Brown, C. A., Cheng, E. M., et al. (2009). "SF-36 includes less Parkinson Disease (PD)-targeted content but is more responsive to change than two PD-targeted
For more information visit www.neuropt.org or email [email protected]
health-related quality of life measures." Quality of Life Research 18(9): 1219-1237.
Dorman, P., Slattery, J., et al. (1998). "Qualitative comparison of the reliability of health status assessments with the EuroQol and SF-36 questionnaires after stroke. United Kingdom Collaborators in the International Stroke Trial." Stroke 29: 63-68. Find it on PubMed
Dorman, P. J., Dennis, M., et al. (1999). "How do scores on the EuroQol relate to scores on the SF-36 after stroke?" Stroke 30: 2146-2151. Find it on PubMed
Emanuelson, I., Andersson Holmkvist, E., et al. (2003). "Quality of life and post-concussion symptoms in adults after mild traumatic brain injury: a population-based study in western Sweden." Acta Neurol Scand 108(5): 332-338. Find it on PubMed
Findler, M., Cantor, J., et al. (2001). "The reliability and validity of the SF-36 health survey questionnaire for use with individuals with traumatic brain injury." Brain Inj 15(8): 715-723. Find it on PubMed
Forchheimer, M., McAweeney, M., et al. (2004). "Use of the SF-36 among persons with spinal cord injury." Am J Phys Med Rehabil 83(5): 390-395. Find it on PubMed
Guilfoyle, M. R., Seeley, H. M., et al. (2010). "Assessing quality of life after traumatic brain injury: examination of the short form 36 health survey." J Neurotrauma 27(12): 2173-2181. Find it on PubMed
Hagen, S., Bugge, C., et al. (2003). "Psychometric properties of the SF-36 in the early post-stroke phase." Journal of Advanced Nursing 44(5): 461-468. Find it on PubMed
Jacobsson, L. J., Westerberg, M., et al. (2010). "Health-related quality-of-life and life satisfaction 6-15 years after traumatic brain injuries in northern Sweden." Brain Inj 24(9): 1075-1086. Find it on PubMed
Lee, B. B., Simpson, J. M., et al. (2009). "The SF-36 walk-wheel: a simple modification of the SF-36 physical domain improves its responsiveness for measuring health status change in spinal cord injury." Spinal Cord 47(1): 50-55. Find it on PubMed
Leonardi, M., Raggi, A., et al. (2012). "Relationships between disability, quality of life and prevalence of nonmotor symptoms in Parkinson’s disease." Parkinsonism & related disorders 18(1): 35-39.
Lin, M. R., Hwang, H. F., et al. (2007). "Comparisons of the brief form of the World Health Organization Quality of Life and Short Form-36 for persons with spinal
For more information visit www.neuropt.org or email [email protected]
cord injuries." American journal of physical medicine & rehabilitation 86(2): 104-113.
MacKenzie, E. J., McCarthy, M. L., et al. (2002). "Using the SF-36 for characterizing outcome after multiple trauma involving head injury." The Journal of Trauma and Acute Care Surgery 52(3): 527-534.
Martinez-Martin, P., Jeukens-Visser, M., et al. (2011). "Health-related quality-of-life scales in Parkinson's disease: critique and recommendations." Mov Disord 26(13): 2371-2380. Find it on PubMed
McNaughton, H. K., Weatherall, M., et al. (2005). "Functional measures across neurologic disease states: analysis of factors in common." Arch Phys Med Rehabil 86(11): 2184-2188. Find it on PubMed
Nilsson, M. H., Drake, A. M., et al. (2010). "Assessment of fall-related self-efficacy and activity avoidance in people with Parkinson's disease." BMC Geriatr 10(1): 78. Find it on PubMed
O'Mahony, P. G., Rodgers, H., et al. (1998). "Is the SF-36 suitable for assessing health status of older stroke patients?" Age Ageing 27: 19-22. Find it on PubMed
Paniak, C., Phillips, K., et al. (1999). "Sensitivity of three recent questionnaires to mild traumatic brain injury-related effects." J Head Trauma Rehabil 14(3): 211-219. Find it on PubMed
Steffen, T. and Seney, M. (2008). "Test-retest reliability and minimal detectable change on balance and ambulation tests, the 36-item short-form health survey, and the unified Parkinson disease rating scale in people with parkinsonism." Phys Ther 88(6): 733-746. Find it on PubMed
Turner-Bowker, D., Bartley, P., et al. (2002). "SF-36® Health Survey & “SF” Bibliography:(1988–2000)." Lincoln, RI: Quality Metric Incorporated.
van Leeuwen, C. M., van der Woude, L. H., et al. (2012). "Validity of the mental health subscale of the SF-36 in persons with spinal cord injury." Spinal Cord 50(9): 707-710. Find it on PubMed
Wilkinson, P. R., Wolfe, C. D., et al. (1997). "Longer term quality of life and outcome in stroke patients: is the Barthel index alone an adequate measure of outcome?" Quality in Health Care 6(3): 125-130. Find it on PubMed
Year published 1992
Instrument in PDF Format
Yes
For more information visit www.neuropt.org or email [email protected]
REHAB 29. MEASURES DATABASE: STROKE IMPACT SCALE
Title of Assessment Stroke Impact Scale
Link to instrument Available for free at the Landon Center on Aging SIS Homepage (external link)
Purpose Assesses health status following stroke
Acronym SIS
Instrument Reviewer(s) Initially reviewed by Jason Raad, MS and Jennifer Moore, PT, DHS, NCS and the Rehabilitation Measures Team; Updated by Jane Sullivan, PT, DHS and the Stroke EDGE taskforce of the Academy of Neurologic Physical Therapy - a component of APTA; Updated by Jill Smiley, MPH and the Rehabilitation Measures Team in June 2013. Updated by Maggie Bland and Nancy Byl and the Stroke EDGE II taskforce Academy of Neurologic Physical Therapy - a component of APTA in 2016.
Summary Date 07 06 2013
Description • A 59 item measure
• 8 domains assessed:
o Strength (4 items)
o Hand function (5 items)
o ADL/IADL (10 items)
o Mobility (9 items)
o Communication (7 items)
o Emotion (9 items)
o Memory and thinking (7 items)
o Participation/Role function (8 items)
• Each item is rated in a 5-point Likert scale in terms of the difficulty the patient has experienced in completing each item
• Summative scores are generated for each domain, scores range from 0-100
For more information visit www.neuropt.org or email [email protected]
• An extra question on stroke recovery asks that the client rate on a scale from 0-100 how much the client feels that he/she has recovered from his/her stroke
• Formula for scoring domains: Transformed Scale = [(Actual raw score - lowest possible raw score) / Possible raw score] * 100 (free scoring software available)
• 3 items change polarity in the "emotion" domain: 3f, 3h, and 3i; when manually scoring items must be reverse-scored
• A proxy version is available if patients are unable to answer (Duncan et al, 2002)
• Designed for repeated administration to track changes over time (refer to manual)
• Can be used in both in clinical and research applications (Refer to manual)
• Factor analysis of the SIS 2.0 revealed that the 4 domains (strength, hand function, mobility, and ADL/IADL) could be summed together to create a physical dimension score (the SIS-16)
• The SIS-16 consists of 16 items capturing daily activities
• For each item, the individual is asked to rate the level of difficulty of the item in the past 2 weeks using the following scale:
o 1 = could not do it at all
o 2 = very difficult
o 3 = somewhat difficult
o 4 = a little difficult
o 5 = not difficult at all
ICF Domain Activity, Participation
Time to Administer 15-20 minutes
Number of Items 59
For more information visit www.neuropt.org or email [email protected]
Equipment Required Score sheet; Computer scoring requires Microsoft Access, find it free at the instruments website
Training Required • Yes, refer to the measures website for more information:
• The SIS Manual is also available
Actual Cost Free to non-profit users via link above.
Contact information and permission to use: MAPI Research Trust, Lyon, France: Email: [email protected] Internet: www.mapi-trust.org
Scale: http://www.mapi-trust.org/services/questionnairelicensing/catalog-questionnaires/298-sis
Populations Tested Stroke
Standard Error of Measurement (SEM)
Stroke:
(Lin et al, 2010; n = 74; mean age = 54.1 (11.4); mean time post-stroke = 17.5 (17.7) months, Chronic Stroke)
• Strength = 8.7
• ADL/IADL = 6.3
• Mobility = 5.5
• Hand function = 9.4
Minimal Detectable Change (MDC)
Stroke:
Minimal Detectable Change (Lin et al, 2010, Chronic Stroke)
• Strength = 24.0
• ADL/IADL = 17.3
• Mobility = 15.1
• Hand function = 25.9
For more information visit www.neuropt.org or email [email protected]
Minimally Clinically Important Difference (MCID)
Stroke:
Clinically Important Differences (Lin et al, 2010, Chronic Stroke)
• Strength = 9.2
• ADL/IADL = 5.9
• Mobility = 4.5
• Hand function = 17.8
Cut-Off Scores Not Applicable
Normative Data Stroke:
(Duncan et al, 2002; n = 287; mean age = 72.6 (10.0) years; < 28 days post-stroke; SIS Version 3.0, Acute Stroke)
SIS Domain Mean (SD)
Strength 61.9 (22.0)
Memory 77.8 (19.1)
Emotion 74.3 (18.1)
Communication 81.0 (19.1)
ADL/IADL 66.5 (23.2)
Mobility 60.2 (23.1)
Hand function 55.9 (34.5)
Social participation 58.9 (25.7)
SIS-16 physical 67.5 (21.2)
(Huang et al, 2010; n = 58; mean age = 56.42 (11.67) years; 17.85 months post stroke, range 7-88, Chronic Stroke)
For more information visit www.neuropt.org or email [email protected]
SIS Domain Mean (SD)
Strength 40.73 (20.05)
Memory 81.54 (19.17)
Emotion 59.63 (17.25)
Communication 89.71 (16.87)
ADL/IADL 67.41 (20.10)
Mobility 79.25 (18.08)
Hand function 29.63 (25.39
Social participation 47.92 (25.13)
SIS-16 physical 61.98 (12.27)
Test-retest Reliability Stroke:
(Duncan et al, 1999; n = 33 minor severity; n = 58 moderate severity; mean age minor severity = 69.3 (10.1); mean age moderate severity 71.9 (10.1); enrolled < 14 days post-stroke, Acute Stroke)
SIS version 2.0 (current version = 3.0) at 1, 3 and 6 months post-stroke:
• Adequate to Excellent test-retest reliability ICC = 0.70 to 0.92 (except for the emotion domain, ICC = 0.57)
(Edwards and O'connell, 2003; n = 74 individuals who suffered from a stroke; mean age = 58.35(14.80) years; mean time since stroke = 56.8 months; Anglo-Saxon Australian sample, Chronic Stroke)
• Adequate to Excellent test-retest reliability in all domains except for the emotion domain
• Poor test-retest reliability in the emotion domain
For more information visit www.neuropt.org or email [email protected]
Interrater/Intrarater
Reliability
Stroke:
(Carod-Artal et al, 2009); N = 180 proxy-stroke patient pairs; mean age = 57.9 (13.5) years; Gender = 100 males and 80 females; mean time since stroke = 20.3 (23.6) months post stroke (chronic),
• Excellent interrater reliability for hand function (ICC = 0.82) and mobility (ICC = 0.80) domains
• Adequate interrater reliability for strength (ICC = 0.61), ADL/IADL (ICC = 0.74), and memory and thinking (ICC = 0.43) domains
• Poor interrater reliability for communication (ICC = 0.39), emotion (ICC = 0.17), and social participation (ICC = 0.29) domains
(Chou et al, 2015) In Taiwan, patients post stroke (N=121) were tested and retested while in acute hospital, acute rehabilitation or outpatient clinic in Taiwan with baseline test and retested 2 weeks later.
SIS 3.0 Cronbach’s Alpha ICC SEM SRD
Total Score 0.96 0.94 4.3 12.0
Composite Physical
0.97 0.92 4.3 12.0
SIS-16 0.94 0.95 4.8 13.2
Internal Consistency Stroke:
(Duncan et al, 1999; SIS version 2.0, Acute Stroke)
• Excellent: Cronbach's alpha ranged from 0.83 to 0.90 across the 8 domains
(Carod-Artal et al, 2009, Chronic Stroke)
• Excellent internal consistency for 7 of the domains:
o Strength (ICC = 0.82)
o Hand function (ICC = 0.95)
o Mobility (ICC = 0.94)
o ADL/IADL (ICC = 0.87)
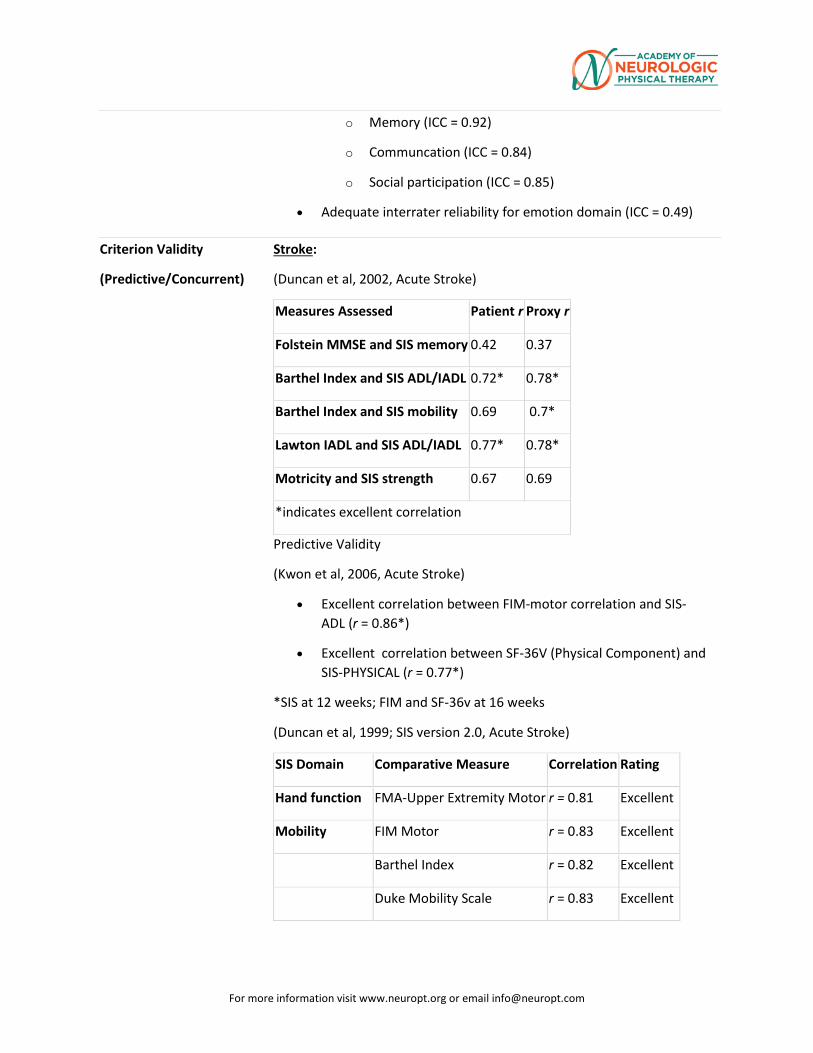
For more information visit www.neuropt.org or email [email protected]
o Memory (ICC = 0.92)
o Communcation (ICC = 0.84)
o Social participation (ICC = 0.85)
• Adequate interrater reliability for emotion domain (ICC = 0.49)
Criterion Validity
(Predictive/Concurrent)
Stroke:
(Duncan et al, 2002, Acute Stroke)
Measures Assessed Patient r Proxy r
Folstein MMSE and SIS memory 0.42 0.37
Barthel Index and SIS ADL/IADL 0.72* 0.78*
Barthel Index and SIS mobility 0.69 0.7*
Lawton IADL and SIS ADL/IADL 0.77* 0.78*
Motricity and SIS strength 0.67 0.69
*indicates excellent correlation
Predictive Validity
(Kwon et al, 2006, Acute Stroke)
• Excellent correlation between FIM-motor correlation and SIS-ADL (r = 0.86*)
• Excellent correlation between SF-36V (Physical Component) and SIS-PHYSICAL (r = 0.77*)
*SIS at 12 weeks; FIM and SF-36v at 16 weeks
(Duncan et al, 1999; SIS version 2.0, Acute Stroke)
SIS Domain Comparative Measure Correlation Rating
Hand function FMA-Upper Extremity Motor r = 0.81 Excellent
Mobility FIM Motor r = 0.83 Excellent
Barthel Index r = 0.82 Excellent
Duke Mobility Scale r = 0.83 Excellent
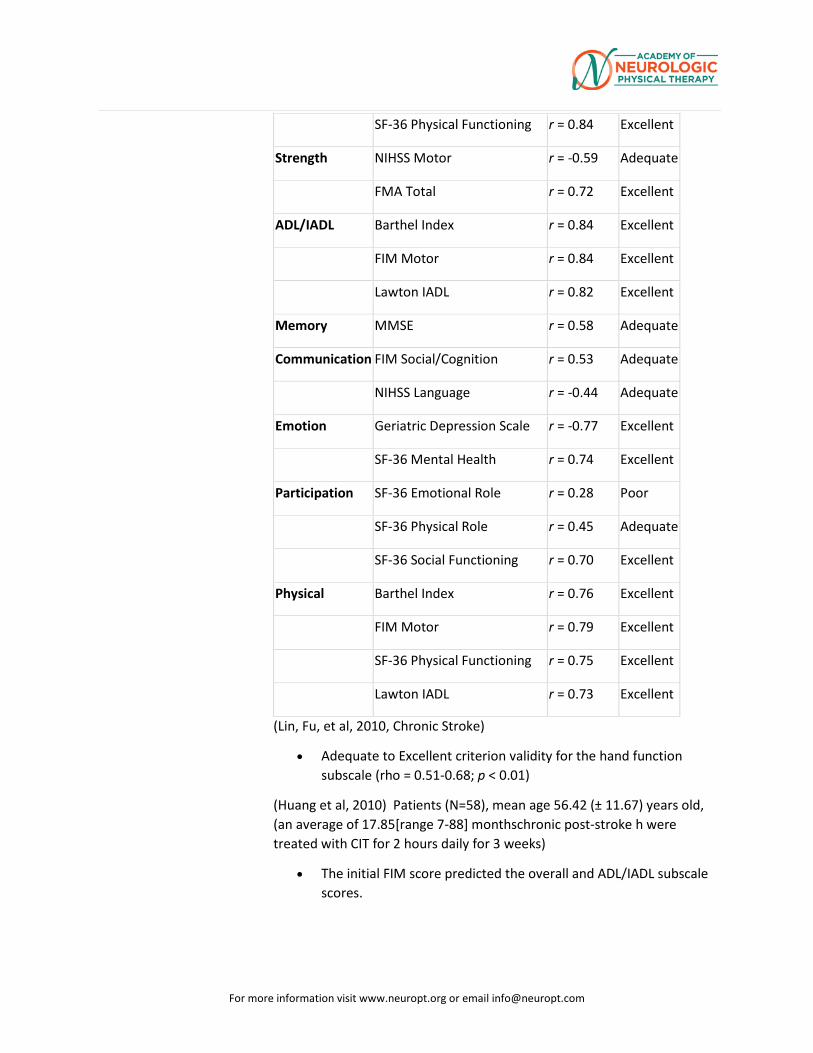
For more information visit www.neuropt.org or email [email protected]
SF-36 Physical Functioning r = 0.84 Excellent
Strength NIHSS Motor r = -0.59 Adequate
FMA Total r = 0.72 Excellent
ADL/IADL Barthel Index r = 0.84 Excellent
FIM Motor r = 0.84 Excellent
Lawton IADL r = 0.82 Excellent
Memory MMSE r = 0.58 Adequate
Communication FIM Social/Cognition r = 0.53 Adequate
NIHSS Language r = -0.44 Adequate
Emotion Geriatric Depression Scale r = -0.77 Excellent
SF-36 Mental Health r = 0.74 Excellent
Participation SF-36 Emotional Role r = 0.28 Poor
SF-36 Physical Role r = 0.45 Adequate
SF-36 Social Functioning r = 0.70 Excellent
Physical Barthel Index r = 0.76 Excellent
FIM Motor r = 0.79 Excellent
SF-36 Physical Functioning r = 0.75 Excellent
Lawton IADL r = 0.73 Excellent
(Lin, Fu, et al, 2010, Chronic Stroke)
• Adequate to Excellent criterion validity for the hand function subscale (rho = 0.51-0.68; p < 0.01)
(Huang et al, 2010) Patients (N=58), mean age 56.42 (± 11.67) years old, (an average of 17.85[range 7-88] monthschronic post-stroke h were treated with CIT for 2 hours daily for 3 weeks)
• The initial FIM score predicted the overall and ADL/IADL subscale scores.
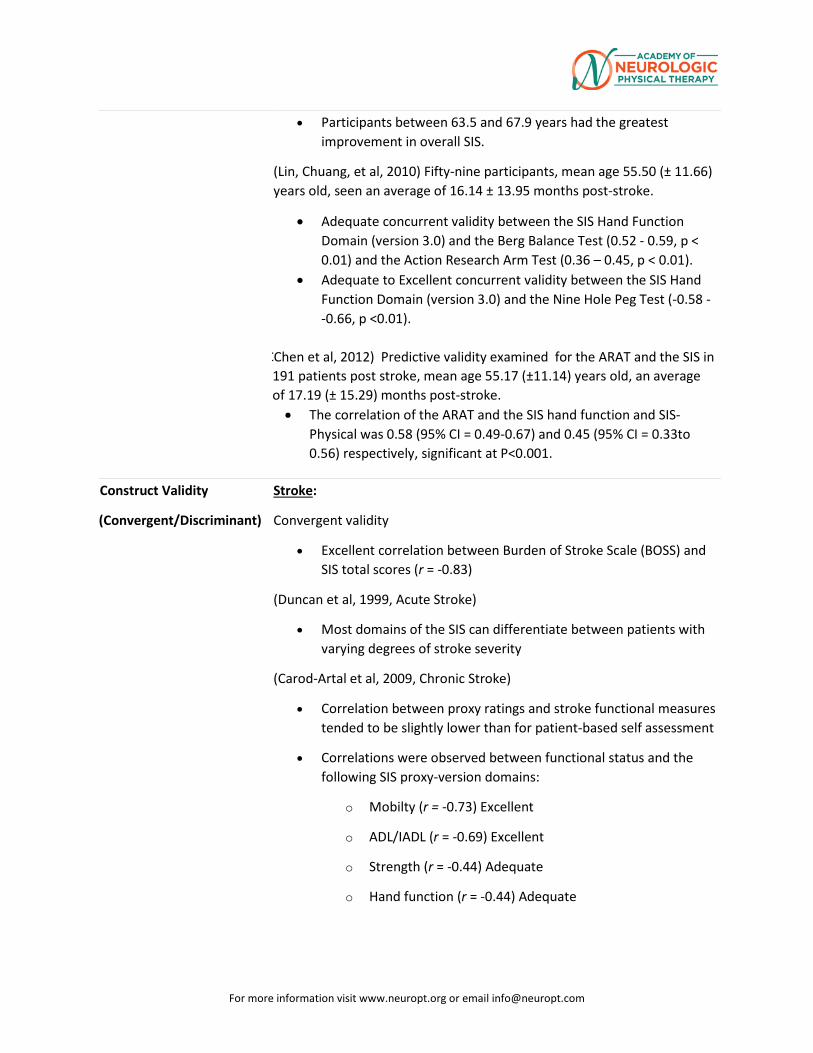
For more information visit www.neuropt.org or email [email protected]
• Participants between 63.5 and 67.9 years had the greatest improvement in overall SIS.
(Lin, Chuang, et al, 2010) Fifty-nine participants, mean age 55.50 (± 11.66) years old, seen an average of 16.14 ± 13.95 months post-stroke.
• Adequate concurrent validity between the SIS Hand Function Domain (version 3.0) and the Berg Balance Test (0.52 - 0.59, p < 0.01) and the Action Research Arm Test (0.36 – 0.45, p < 0.01).
• Adequate to Excellent concurrent validity between the SIS Hand Function Domain (version 3.0) and the Nine Hole Peg Test (-0.58 - -0.66, p <0.01).
CChen et al, 2012) Predictive validity examined for the ARAT and the SIS in 191 patients post stroke, mean age 55.17 (±11.14) years old, an average of 17.19 (± 15.29) months post-stroke. • The correlation of the ARAT and the SIS hand function and SIS-
Physical was 0.58 (95% CI = 0.49-0.67) and 0.45 (95% CI = 0.33to 0.56) respectively, significant at P<0.001.
Construct Validity
(Convergent/Discriminant)
Stroke:
Convergent validity
• Excellent correlation between Burden of Stroke Scale (BOSS) and SIS total scores (r = -0.83)
(Duncan et al, 1999, Acute Stroke)
• Most domains of the SIS can differentiate between patients with varying degrees of stroke severity
(Carod-Artal et al, 2009, Chronic Stroke)
• Correlation between proxy ratings and stroke functional measures tended to be slightly lower than for patient-based self assessment
• Correlations were observed between functional status and the following SIS proxy-version domains:
o Mobilty (r = -0.73) Excellent
o ADL/IADL (r = -0.69) Excellent
o Strength (r = -0.44) Adequate
o Hand function (r = -0.44) Adequate
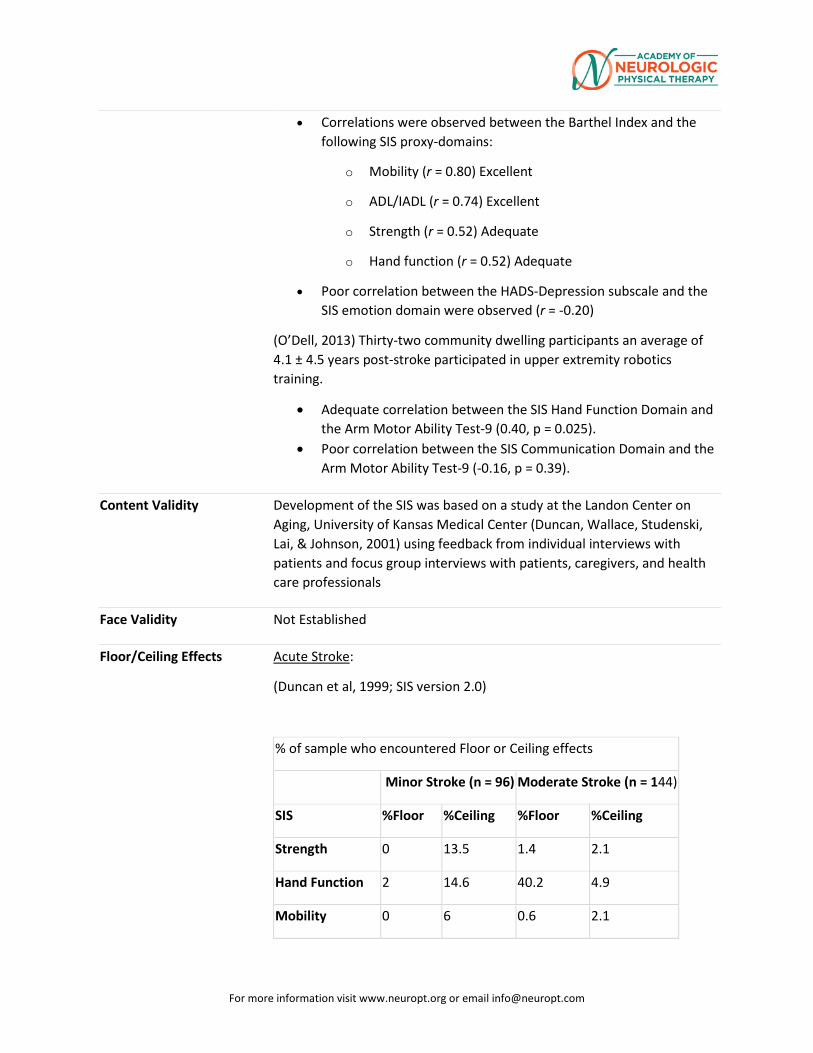
For more information visit www.neuropt.org or email [email protected]
• Correlations were observed between the Barthel Index and the following SIS proxy-domains:
o Mobility (r = 0.80) Excellent
o ADL/IADL (r = 0.74) Excellent
o Strength (r = 0.52) Adequate
o Hand function (r = 0.52) Adequate
• Poor correlation between the HADS-Depression subscale and the SIS emotion domain were observed (r = -0.20)
(O’Dell, 2013) Thirty-two community dwelling participants an average of 4.1 ± 4.5 years post-stroke participated in upper extremity robotics training.
• Adequate correlation between the SIS Hand Function Domain and the Arm Motor Ability Test-9 (0.40, p = 0.025).
• Poor correlation between the SIS Communication Domain and the Arm Motor Ability Test-9 (-0.16, p = 0.39).
Content Validity Development of the SIS was based on a study at the Landon Center on Aging, University of Kansas Medical Center (Duncan, Wallace, Studenski, Lai, & Johnson, 2001) using feedback from individual interviews with patients and focus group interviews with patients, caregivers, and health care professionals
Face Validity Not Established
Floor/Ceiling Effects Acute Stroke:
(Duncan et al, 1999; SIS version 2.0)
% of sample who encountered Floor or Ceiling effects
Minor Stroke (n = 96) Moderate Stroke (n = 144)
SIS %Floor %Ceiling %Floor %Ceiling
Strength 0 13.5 1.4 2.1
Hand Function 2 14.6 40.2 4.9
Mobility 0 6 0.6 2.1
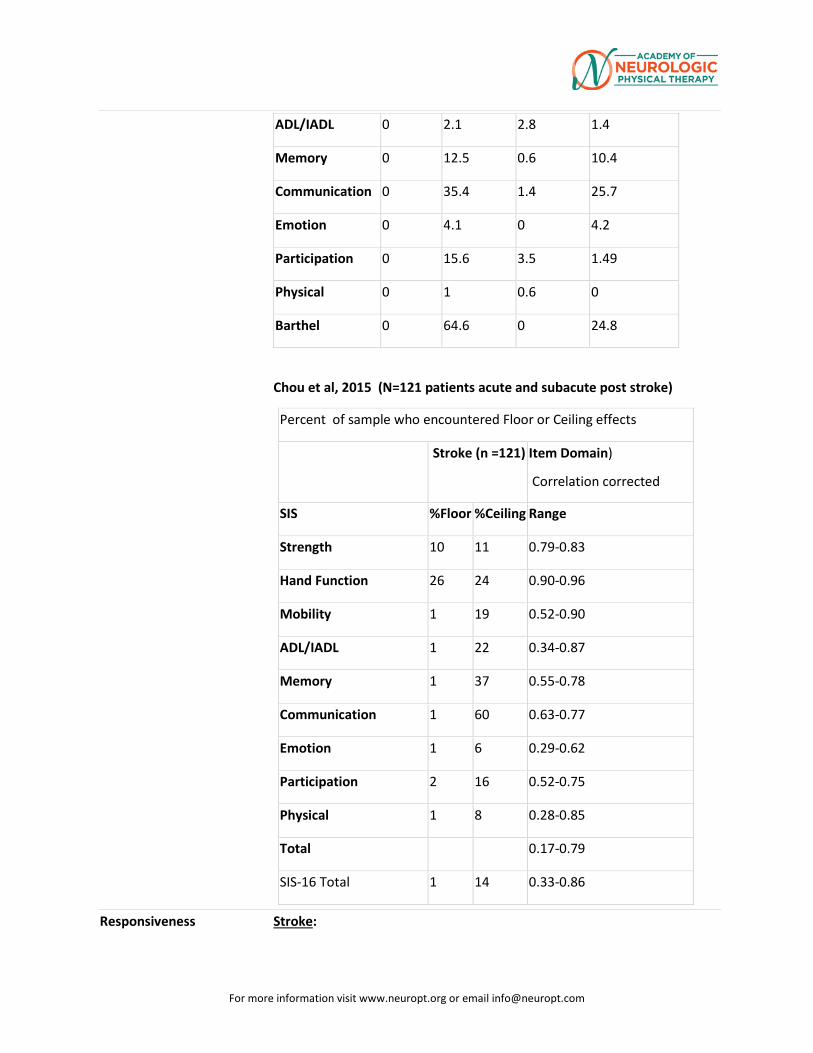
For more information visit www.neuropt.org or email [email protected]
ADL/IADL 0 2.1 2.8 1.4
Memory 0 12.5 0.6 10.4
Communication 0 35.4 1.4 25.7
Emotion 0 4.1 0 4.2
Participation 0 15.6 3.5 1.49
Physical 0 1 0.6 0
Barthel 0 64.6 0 24.8
Chou et al, 2015 (N=121 patients acute and subacute post stroke)
Percent of sample who encountered Floor or Ceiling effects
Stroke (n =121) Item Domain)
Correlation corrected
SIS %Floor %Ceiling Range
Strength 10 11 0.79-0.83
Hand Function 26 24 0.90-0.96
Mobility 1 19 0.52-0.90
ADL/IADL 1 22 0.34-0.87
Memory 1 37 0.55-0.78
Communication 1 60 0.63-0.77
Emotion 1 6 0.29-0.62
Participation 2 16 0.52-0.75
Physical 1 8 0.28-0.85
Total 0.17-0.79
SIS-16 Total 1 14 0.33-0.86
Responsiveness Stroke:
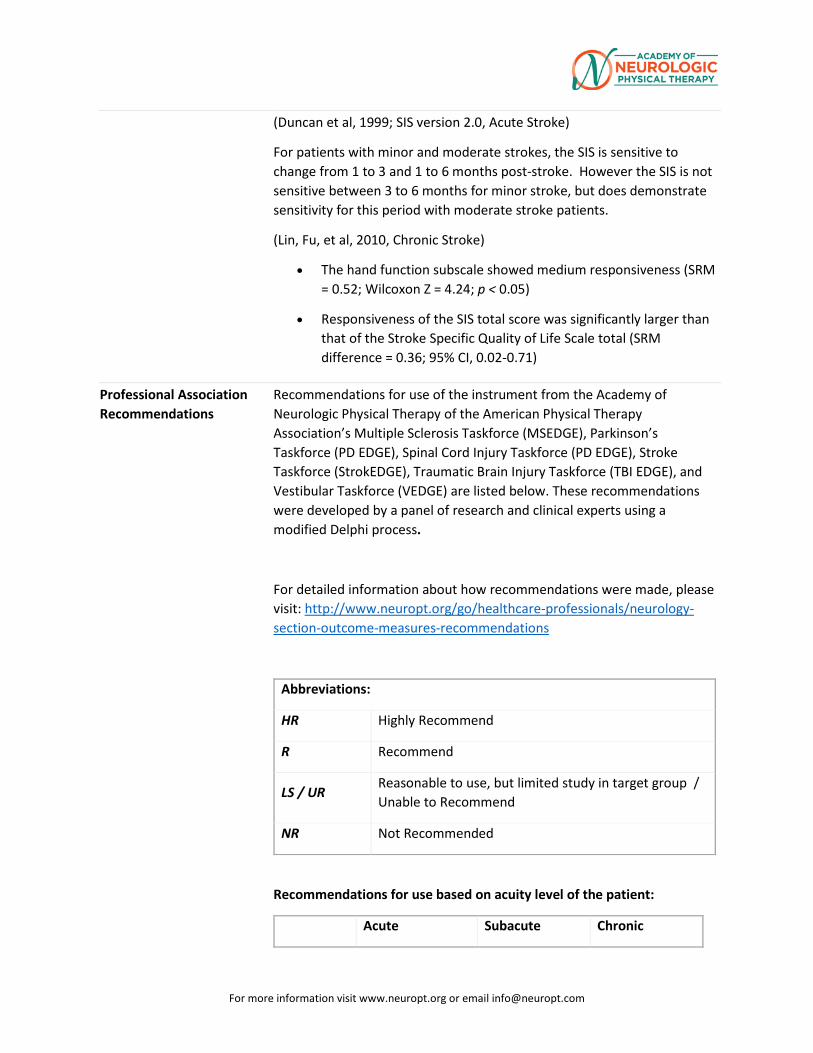
For more information visit www.neuropt.org or email [email protected]
(Duncan et al, 1999; SIS version 2.0, Acute Stroke)
For patients with minor and moderate strokes, the SIS is sensitive to change from 1 to 3 and 1 to 6 months post-stroke. However the SIS is not sensitive between 3 to 6 months for minor stroke, but does demonstrate sensitivity for this period with moderate stroke patients.
(Lin, Fu, et al, 2010, Chronic Stroke)
• The hand function subscale showed medium responsiveness (SRM = 0.52; Wilcoxon Z = 4.24; p < 0.05)
• Responsiveness of the SIS total score was significantly larger than that of the Stroke Specific Quality of Life Scale total (SRM difference = 0.36; 95% CI, 0.02-0.71)
Professional Association Recommendations
Recommendations for use of the instrument from the Academy of Neurologic Physical Therapy of the American Physical Therapy Association’s Multiple Sclerosis Taskforce (MSEDGE), Parkinson’s Taskforce (PD EDGE), Spinal Cord Injury Taskforce (PD EDGE), Stroke Taskforce (StrokEDGE), Traumatic Brain Injury Taskforce (TBI EDGE), and Vestibular Taskforce (VEDGE) are listed below. These recommendations were developed by a panel of research and clinical experts using a modified Delphi process.
For detailed information about how recommendations were made, please visit: http://www.neuropt.org/go/healthcare-professionals/neurology-section-outcome-measures-recommendations
Abbreviations:
HR Highly Recommend
R Recommend
LS / UR Reasonable to use, but limited study in target group / Unable to Recommend
NR Not Recommended
Recommendations for use based on acuity level of the patient:
Acute Subacute Chronic
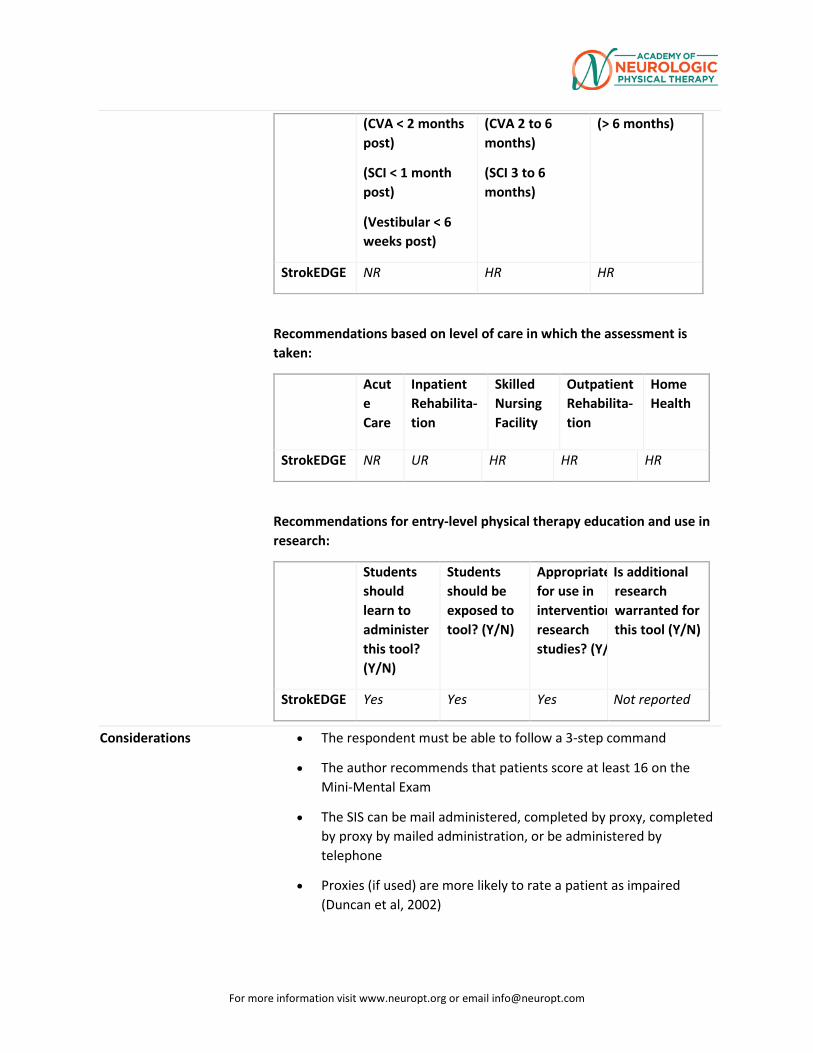
For more information visit www.neuropt.org or email [email protected]
(CVA < 2 months post)
(SCI < 1 month post)
(Vestibular < 6 weeks post)
(CVA 2 to 6 months)
(SCI 3 to 6 months)
(> 6 months)
StrokEDGE NR HR HR
Recommendations based on level of care in which the assessment is taken:
Acute Care
Inpatient Rehabilita- tion
Skilled Nursing Facility
Outpatient Rehabilita-tion
Home Health
StrokEDGE NR UR HR HR HR
Recommendations for entry-level physical therapy education and use in research:
Students should learn to administer this tool? (Y/N)
Students should be exposed to tool? (Y/N)
Appropriate for use in intervention research studies? (Y/
Is additional research warranted for this tool (Y/N)
StrokEDGE Yes Yes Yes Not reported
Considerations • The respondent must be able to follow a 3-step command
• The author recommends that patients score at least 16 on the Mini-Mental Exam
• The SIS can be mail administered, completed by proxy, completed by proxy by mailed administration, or be administered by telephone
• Proxies (if used) are more likely to rate a patient as impaired (Duncan et al, 2002)
For more information visit www.neuropt.org or email [email protected]
• The SIS should be used with caution in individuals with mild impairment as the items in the communication, memory, and emotion domains are considered easy and only capture limitations in most impaired individuals
• Would be appropriate in these settings provided the client has spent time living in the community since stroke diagnosis as many items relate to living at home
• Alternately, the tool could be used and a percentage score calculated omitting "home-based" items
Do you see an error or have a suggestion for this instrument summary? Please e-mail us!
Bibliography Carod-Artal, F. J., Coral, L. F., et al. (2008). "The stroke impact scale 3.0: evaluation of acceptability, reliability, and validity of the Brazilian version." Stroke 39(9): 2477-2484. Find it on PubMed
Carod-Artal, F. J., Coral, L. F., et al. (2009). "Self-and proxy-report agreement on the stroke impact scale." Stroke 40(10): 3308-3314.
Chen, H-F, Lin, K-C, Wu, C-Y, Chen, C-L (2012) Rasch validation and predictive validity of the Action Research Arm Test (ARAT). Arch Phys Med Rehabil 2:93:1039-45
Chou, C-Y, Ou, Y-C , Chiang, T-R (2015) Psychometric comparisons of four disease-specific health-related quality of life measures for stroke survivors Clinical Rehabilitation 29(8) 816-819. Add Find it on PubMed Link
Doyle, P. J., McNeil, M. R., et al. (2007). "The Burden of Stroke Scale (BOSS) provided valid, reliable, and responsive score estimates of functioning and well-being during the first year of recovery from stroke." Qual Life Res 16(8): 1389-1398. Find it on PubMed
Duncan, P. W., Bode, R. K., et al. (2003). "Rasch analysis of a new stroke-specific outcome scale: the Stroke Impact Scale." Arch Phys Med Rehabil 84(7): 950-963. Find it on PubMed
Duncan, P. W., Lai, S. M., et al. (2002). "Evaluation of proxy responses to the Stroke Impact Scale." Stroke 33(11): 2593-2599. Find it on PubMed
For more information visit www.neuropt.org or email [email protected]
Duncan, P. W., Wallace, D., et al. (1999). "The stroke impact scale version 2.0. Evaluation of reliability, validity, and sensitivity to change." Stroke 30(10): 2131-2140. Find it on PubMed
Edwards, B. and O'Connell, B. (2003). "Internal consistency and validity of the Stroke Impact Scale 2.0 (SIS 2.0) and SIS-16 in an Australian sample." Qual Life Res 12(8): 1127-1135. Find it on PubMed
Huang, Y. H., Wu, C. Y., et al. (2010). "Predictors of change in quality of life after distributed constraint-induced therapy in patients with chronic stroke." Neurorehabil Neural Repair 24(6): 559-566. Find it on PubMed
Lin, K., Chuang, L., Wu, C., Hsieh, Y., Chang, W. (2010). “Responsiveness and validity of three dexterous function measures in stroke rehabilitation.” Journal of Rehabilitation Research & Development 47(6): 563-572
Lin, K. C., Fu, T., et al. (2010). "Psychometric comparisons of the Stroke Impact Scale 3.0 and Stroke-Specific Quality of Life Scale." Qual Life Res 19(3): 435-443. Find it on PubMed
Lin, K. C., Fu, T., et al. (2010). "Minimal detectable change and clinically important difference of the Stroke Impact Scale in stroke patients." Neurorehabil Neural Repair 24(5): 486-492. Find it on PubMed
O’Dell, M.W., Kim, G., Rivera, L., et al. (2013) “A psychometric evaluation of the arm motor ability test.” J Rehabil Med 45(6): 519-527.
Stewart, A. L. and Ware, J. E. (1992). Measuring functioning and well-being: the medical outcomes study approach, Duke University Press Books.
Link to instrument Available for free at the Landon Center on Aging SIS Homepage (external link)
For more information visit www.neuropt.org or email [email protected]
30. REHAB MEASURES DATABASE: STROKE REHABILITATION ASSESSMENT OF MOVEMENT MEASURE
Link to instrument
STREAM
Title of Assessment
Stroke Rehabilitation Assessment of Movement Measure
Acronym STREAM
Instrument Reviewer(s)
Reviewed by Heather Anderson and Rie Yoshida of the StrokEdge II task force, Neurology Section, APTA.
Summary Date 3/24/16
Purpose • The STREAM was designed for use by physical therapists to provide a quantitative evaluation of motor functioning for stroke patients. The STREAM was specifically designed to be easy to administer in a clinical setting.
Description The STREAM is composed of 30 items distributed across 3 domains:
• Upper-limb (UL) movements (scored on a 3-point ordinal scale
• Lower-limb (LL) movements (scored on a 3-point ordinal scale)
• Basic mobility (MO) items (scored on a 4-point ordinal scale)
Scoring the STREAM:
• Total of 20 points for each of the limb sub-scales (40 points total)
• Total of 30 points for the mobility subscale
• Scores can be transformed, allowing for items that can't be scored
• Subscales are converted to a percentage, even though the scores are not interval based. This is done to allow for occasional items that cannot be scored. Total scores are calculated using the average of the 3 subscale scores
• Instructions for score transformation can be found in the instruments manual
Three versions of STREAM exists: the original 30 item STREAM-30, revised STREAM-27, and simplified STREAM-15
• STREAM-27 omitted 2 UL subscale items: scapular elevation and opposition; 1 LL subscale item: hip abduction from STREAM-30
• STREAM-15 comprises of 5 items in each of the subscales from original STREAM-30
For more information visit www.neuropt.org or email [email protected]
Area of Assessment
Coordination; Functional Mobility; Range of Motion
Body Part Upper Extremity; Lower Extremity
ICF Domain Body Function; Activity
Domain Motor
Assessment Type
Performance Measure
Length of Test 06 to 30 Minutes
Time to Administer
15 minutes
Number of Items
30
Equipment Required
None
Training Required
None
Type of training required
No Training
Cost Free
Actual Cost Free
Age Range Adult: 18-64 years; Elderly adult: 65+
Administration Mode
Paper/Pencil
Diagnosis Stroke
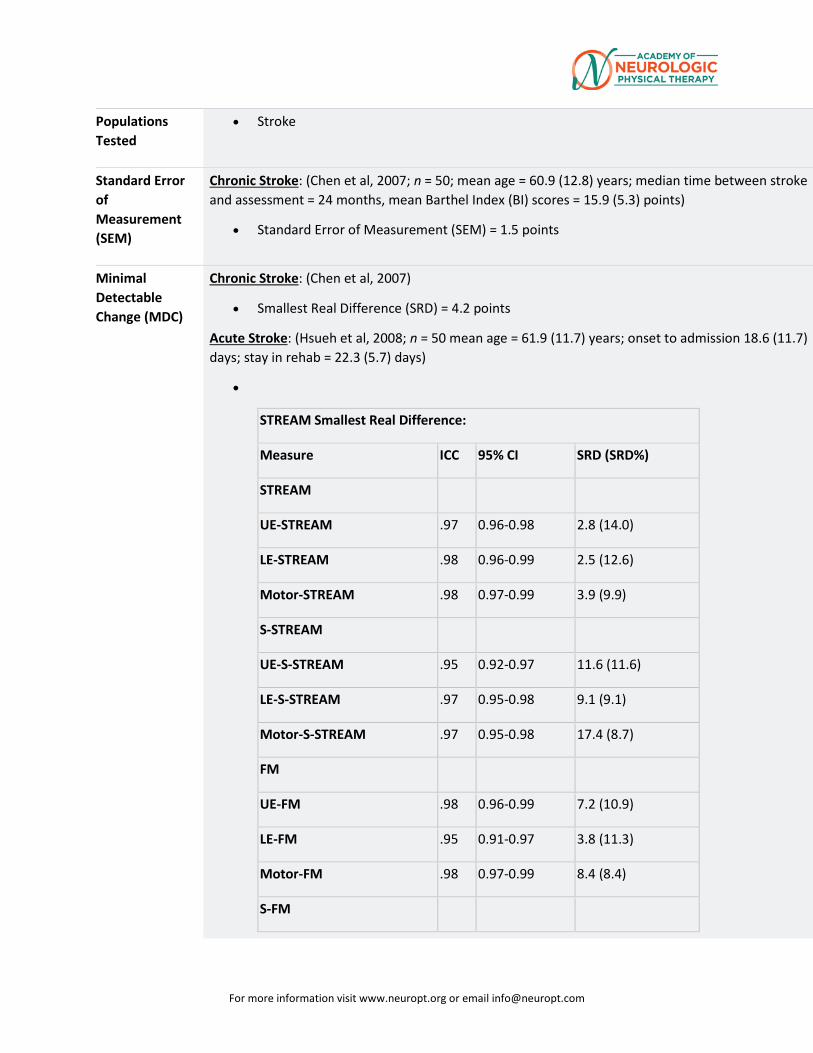
For more information visit www.neuropt.org or email [email protected]
Populations Tested
• Stroke
Standard Error of Measurement (SEM)
Chronic Stroke: (Chen et al, 2007; n = 50; mean age = 60.9 (12.8) years; median time between stroke and assessment = 24 months, mean Barthel Index (BI) scores = 15.9 (5.3) points)
• Standard Error of Measurement (SEM) = 1.5 points
Minimal Detectable Change (MDC)
Chronic Stroke: (Chen et al, 2007)
• Smallest Real Difference (SRD) = 4.2 points
Acute Stroke: (Hsueh et al, 2008; n = 50 mean age = 61.9 (11.7) years; onset to admission 18.6 (11.7) days; stay in rehab = 22.3 (5.7) days)
•
STREAM Smallest Real Difference:
Measure ICC 95% CI SRD (SRD%)
STREAM
UE-STREAM .97 0.96-0.98 2.8 (14.0)
LE-STREAM .98 0.96-0.99 2.5 (12.6)
Motor-STREAM .98 0.97-0.99 3.9 (9.9)
S-STREAM
UE-S-STREAM .95 0.92-0.97 11.6 (11.6)
LE-S-STREAM .97 0.95-0.98 9.1 (9.1)
Motor-S-STREAM .97 0.95-0.98 17.4 (8.7)
FM
UE-FM .98 0.96-0.99 7.2 (10.9)
LE-FM .95 0.91-0.97 3.8 (11.3)
Motor-FM .98 0.97-0.99 8.4 (8.4)
S-FM
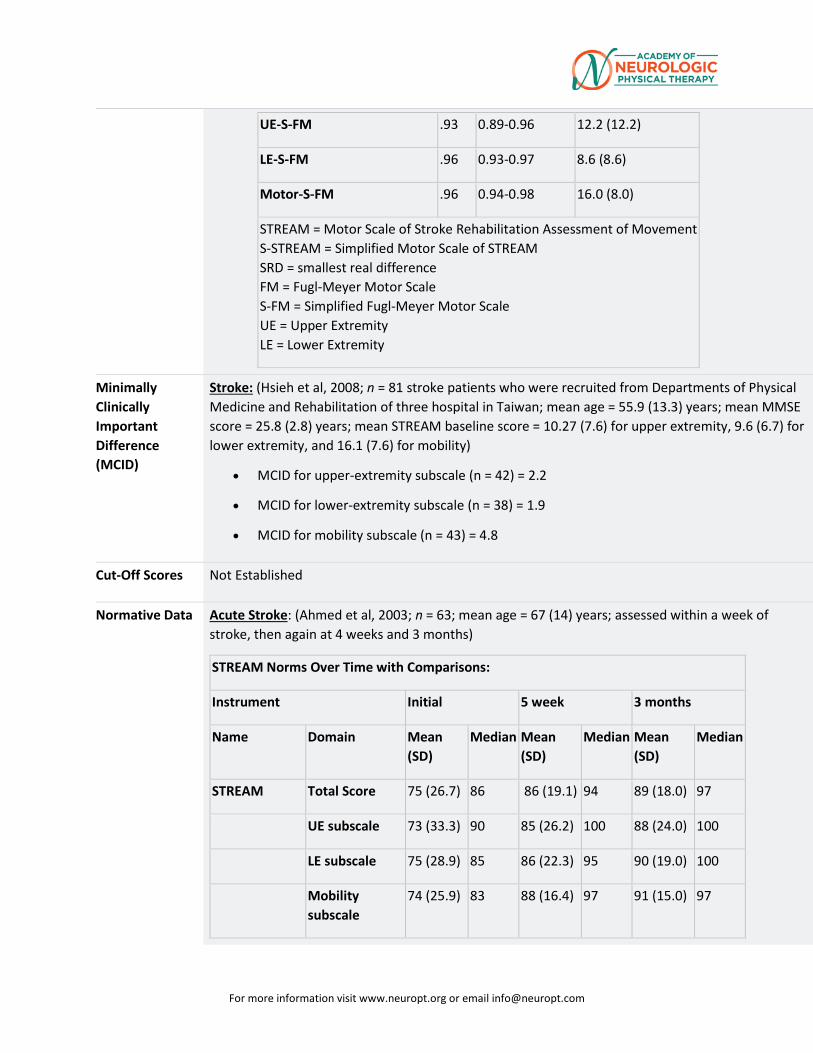
For more information visit www.neuropt.org or email [email protected]
UE-S-FM .93 0.89-0.96 12.2 (12.2)
LE-S-FM .96 0.93-0.97 8.6 (8.6)
Motor-S-FM .96 0.94-0.98 16.0 (8.0)
STREAM = Motor Scale of Stroke Rehabilitation Assessment of Movement S-STREAM = Simplified Motor Scale of STREAM SRD = smallest real difference FM = Fugl-Meyer Motor Scale S-FM = Simplified Fugl-Meyer Motor Scale UE = Upper Extremity LE = Lower Extremity
Minimally Clinically Important Difference (MCID)
Stroke: (Hsieh et al, 2008; n = 81 stroke patients who were recruited from Departments of Physical Medicine and Rehabilitation of three hospital in Taiwan; mean age = 55.9 (13.3) years; mean MMSE score = 25.8 (2.8) years; mean STREAM baseline score = 10.27 (7.6) for upper extremity, 9.6 (6.7) for lower extremity, and 16.1 (7.6) for mobility)
• MCID for upper-extremity subscale (n = 42) = 2.2
• MCID for lower-extremity subscale (n = 38) = 1.9
• MCID for mobility subscale (n = 43) = 4.8
Cut-Off Scores Not Established
Normative Data Acute Stroke: (Ahmed et al, 2003; n = 63; mean age = 67 (14) years; assessed within a week of stroke, then again at 4 weeks and 3 months)
STREAM Norms Over Time with Comparisons:
Instrument Initial 5 week 3 months
Name Domain Mean (SD)
Median Mean (SD)
Median Mean (SD)
Median
STREAM Total Score 75 (26.7) 86 86 (19.1) 94 89 (18.0) 97
UE subscale 73 (33.3) 90 85 (26.2) 100 88 (24.0) 100
LE subscale 75 (28.9) 85 86 (22.3) 95 90 (19.0) 100
Mobility subscale
74 (25.9) 83 88 (16.4) 97 91 (15.0) 97
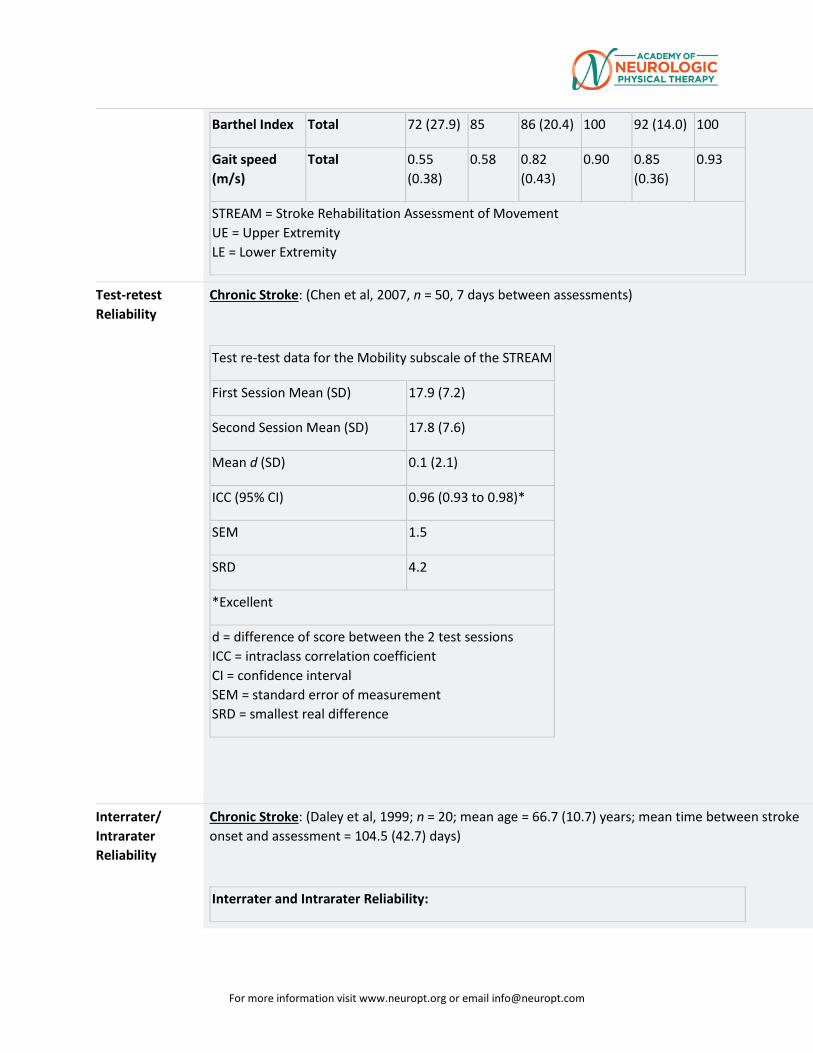
For more information visit www.neuropt.org or email [email protected]
Barthel Index Total 72 (27.9) 85 86 (20.4) 100 92 (14.0) 100
Gait speed (m/s)
Total 0.55 (0.38)
0.58 0.82 (0.43)
0.90 0.85 (0.36)
0.93
STREAM = Stroke Rehabilitation Assessment of Movement UE = Upper Extremity LE = Lower Extremity
Test-retest Reliability
Chronic Stroke: (Chen et al, 2007, n = 50, 7 days between assessments)
Test re-test data for the Mobility subscale of the STREAM
First Session Mean (SD) 17.9 (7.2)
Second Session Mean (SD) 17.8 (7.6)
Mean d (SD) 0.1 (2.1)
ICC (95% CI) 0.96 (0.93 to 0.98)*
SEM 1.5
SRD 4.2
*Excellent
d = difference of score between the 2 test sessions ICC = intraclass correlation coefficient CI = confidence interval SEM = standard error of measurement SRD = smallest real difference
Interrater/ Intrarater Reliability
Chronic Stroke: (Daley et al, 1999; n = 20; mean age = 66.7 (10.7) years; mean time between stroke onset and assessment = 104.5 (42.7) days)
Interrater and Intrarater Reliability:
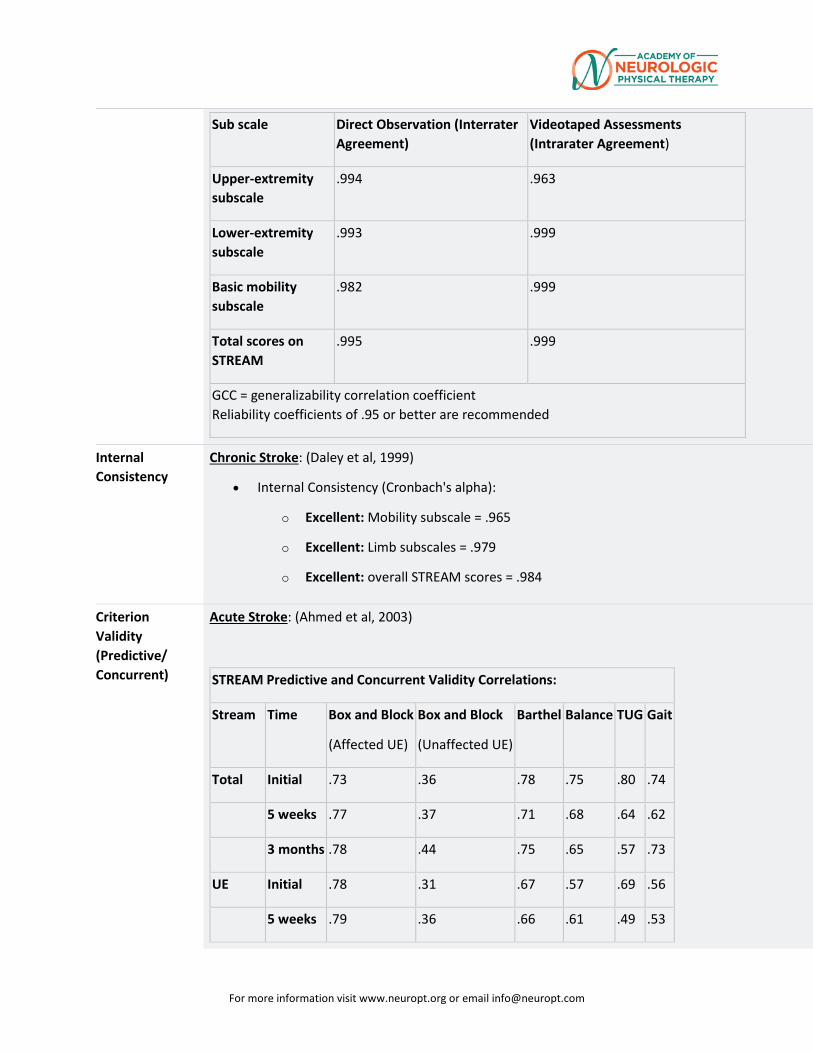
For more information visit www.neuropt.org or email [email protected]
Sub scale Direct Observation (Interrater Agreement)
Videotaped Assessments (Intrarater Agreement)
Upper-extremity subscale
.994 .963
Lower-extremity subscale
.993 .999
Basic mobility subscale
.982 .999
Total scores on STREAM
.995 .999
GCC = generalizability correlation coefficient Reliability coefficients of .95 or better are recommended
Internal Consistency
Chronic Stroke: (Daley et al, 1999)
• Internal Consistency (Cronbach's alpha):
o Excellent: Mobility subscale = .965
o Excellent: Limb subscales = .979
o Excellent: overall STREAM scores = .984
Criterion Validity (Predictive/ Concurrent)
Acute Stroke: (Ahmed et al, 2003)
STREAM Predictive and Concurrent Validity Correlations:
Stream Time Box and Block
(Affected UE)
Box and Block
(Unaffected UE)
Barthel Balance TUG Gait
Total Initial .73 .36 .78 .75 .80 .74
5 weeks .77 .37 .71 .68 .64 .62
3 months .78 .44 .75 .65 .57 .73
UE Initial .78 .31 .67 .57 .69 .56
5 weeks .79 .36 .66 .61 .49 .53
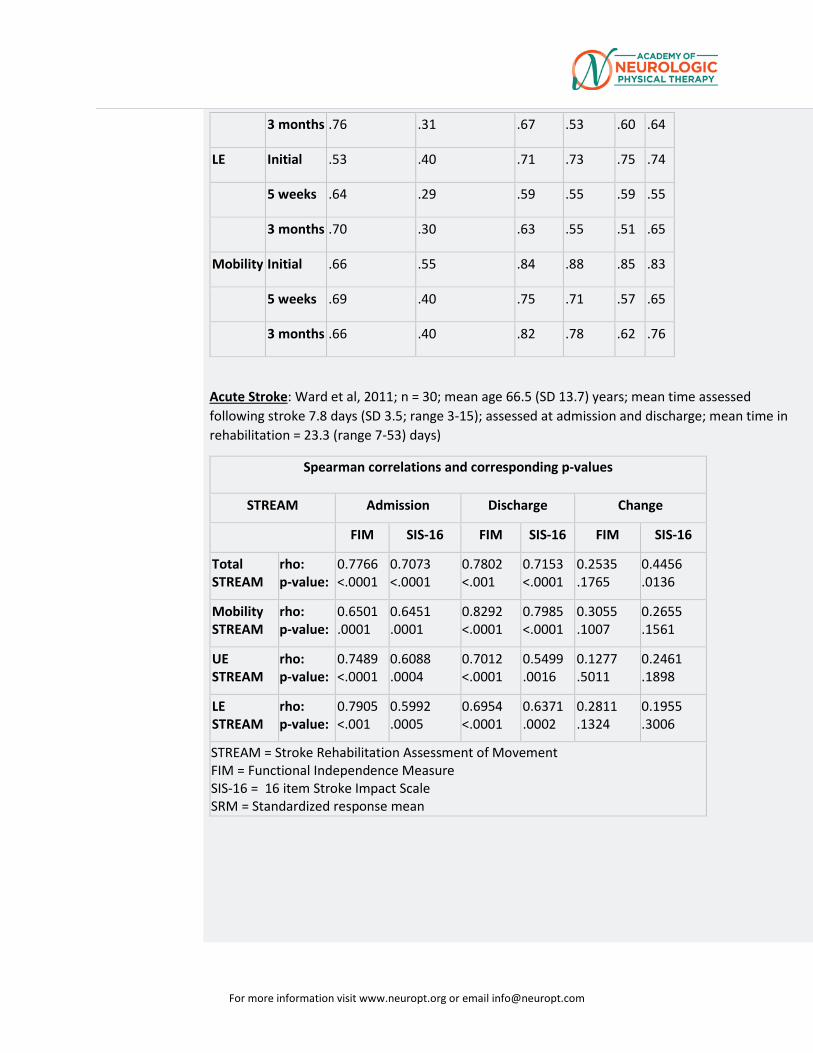
For more information visit www.neuropt.org or email [email protected]
3 months .76 .31 .67 .53 .60 .64
LE Initial .53 .40 .71 .73 .75 .74
5 weeks .64 .29 .59 .55 .59 .55
3 months .70 .30 .63 .55 .51 .65
Mobility Initial .66 .55 .84 .88 .85 .83
5 weeks .69 .40 .75 .71 .57 .65
3 months .66 .40 .82 .78 .62 .76
Acute Stroke: Ward et al, 2011; n = 30; mean age 66.5 (SD 13.7) years; mean time assessed following stroke 7.8 days (SD 3.5; range 3-15); assessed at admission and discharge; mean time in rehabilitation = 23.3 (range 7-53) days)
Spearman correlations and corresponding p-values
STREAM Admission Discharge Change
FIM SIS-16 FIM SIS-16 FIM SIS-16
Total STREAM
rho: p-value:
0.7766 <.0001
0.7073 <.0001
0.7802 <.001
0.7153 <.0001
0.2535 .1765
0.4456 .0136
Mobility STREAM
rho: p-value:
0.6501 .0001
0.6451 .0001
0.8292 <.0001
0.7985 <.0001
0.3055 .1007
0.2655 .1561
UE STREAM
rho: p-value:
0.7489 <.0001
0.6088 .0004
0.7012 <.0001
0.5499 .0016
0.1277 .5011
0.2461 .1898
LE STREAM
rho: p-value:
0.7905 <.001
0.5992 .0005
0.6954 <.0001
0.6371 .0002
0.2811 .1324
0.1955 .3006
STREAM = Stroke Rehabilitation Assessment of Movement FIM = Functional Independence Measure SIS-16 = 16 item Stroke Impact Scale SRM = Standardized response mean
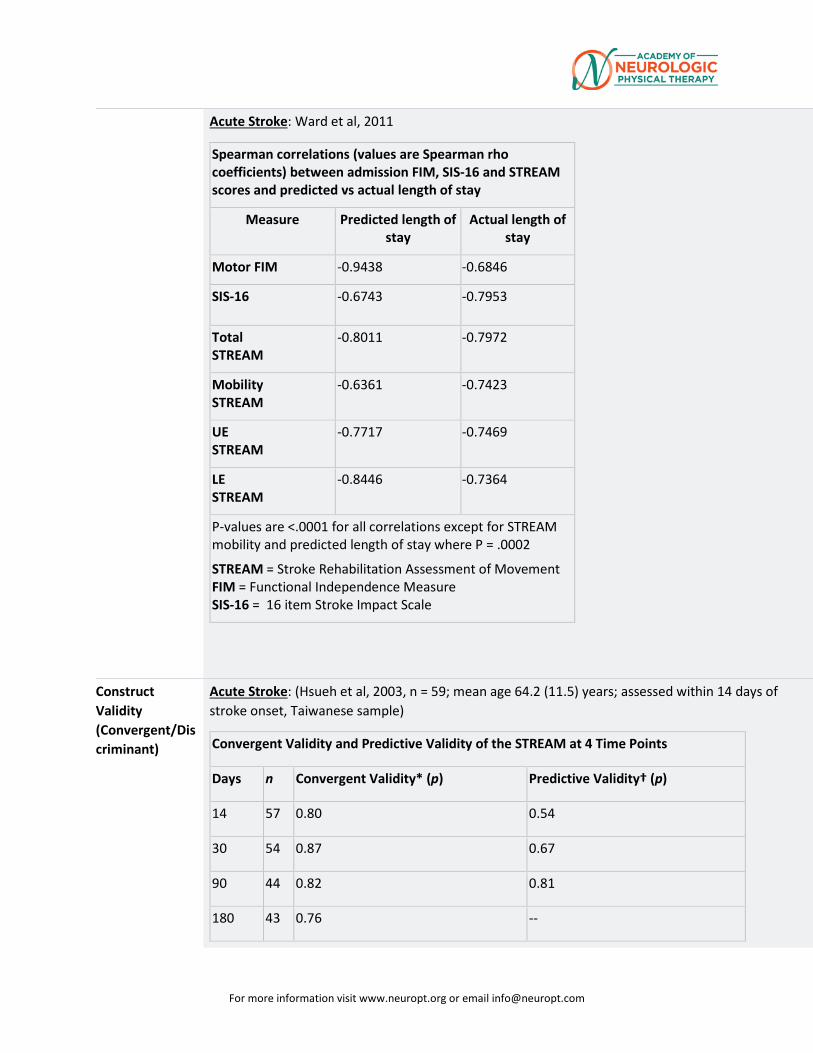
For more information visit www.neuropt.org or email [email protected]
Acute Stroke: Ward et al, 2011
Spearman correlations (values are Spearman rho coefficients) between admission FIM, SIS-16 and STREAM scores and predicted vs actual length of stay
Measure Predicted length of stay
Actual length of stay
Motor FIM -0.9438 -0.6846
SIS-16 -0.6743 -0.7953
Total STREAM
-0.8011 -0.7972
Mobility STREAM
-0.6361 -0.7423
UE STREAM
-0.7717 -0.7469
LE STREAM
-0.8446 -0.7364
P-values are <.0001 for all correlations except for STREAM mobility and predicted length of stay where P = .0002
STREAM = Stroke Rehabilitation Assessment of Movement FIM = Functional Independence Measure SIS-16 = 16 item Stroke Impact Scale
Construct Validity (Convergent/Discriminant)
Acute Stroke: (Hsueh et al, 2003, n = 59; mean age 64.2 (11.5) years; assessed within 14 days of stroke onset, Taiwanese sample)
Convergent Validity and Predictive Validity of the STREAM at 4 Time Points
Days n Convergent Validity* (p) Predictive Validity† (p)
14 57 0.80 0.54
30 54 0.87 0.67
90 44 0.82 0.81
180 43 0.76 --
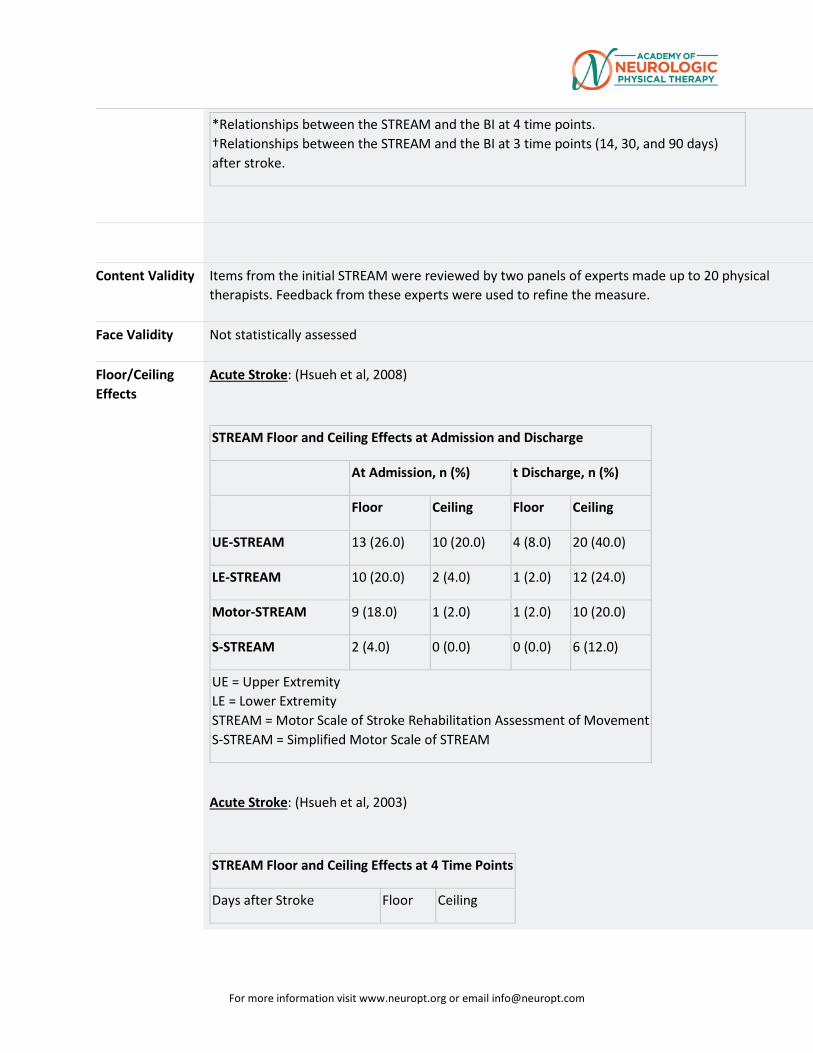
For more information visit www.neuropt.org or email [email protected]
*Relationships between the STREAM and the BI at 4 time points. †Relationships between the STREAM and the BI at 3 time points (14, 30, and 90 days) after stroke.
Content Validity Items from the initial STREAM were reviewed by two panels of experts made up to 20 physical therapists. Feedback from these experts were used to refine the measure.
Face Validity Not statistically assessed
Floor/Ceiling Effects
Acute Stroke: (Hsueh et al, 2008)
STREAM Floor and Ceiling Effects at Admission and Discharge
At Admission, n (%) t Discharge, n (%)
Floor Ceiling Floor Ceiling
UE-STREAM 13 (26.0) 10 (20.0) 4 (8.0) 20 (40.0)
LE-STREAM 10 (20.0) 2 (4.0) 1 (2.0) 12 (24.0)
Motor-STREAM 9 (18.0) 1 (2.0) 1 (2.0) 10 (20.0)
S-STREAM 2 (4.0) 0 (0.0) 0 (0.0) 6 (12.0)
UE = Upper Extremity LE = Lower Extremity STREAM = Motor Scale of Stroke Rehabilitation Assessment of Movement S-STREAM = Simplified Motor Scale of STREAM
Acute Stroke: (Hsueh et al, 2003)
STREAM Floor and Ceiling Effects at 4 Time Points
Days after Stroke Floor Ceiling
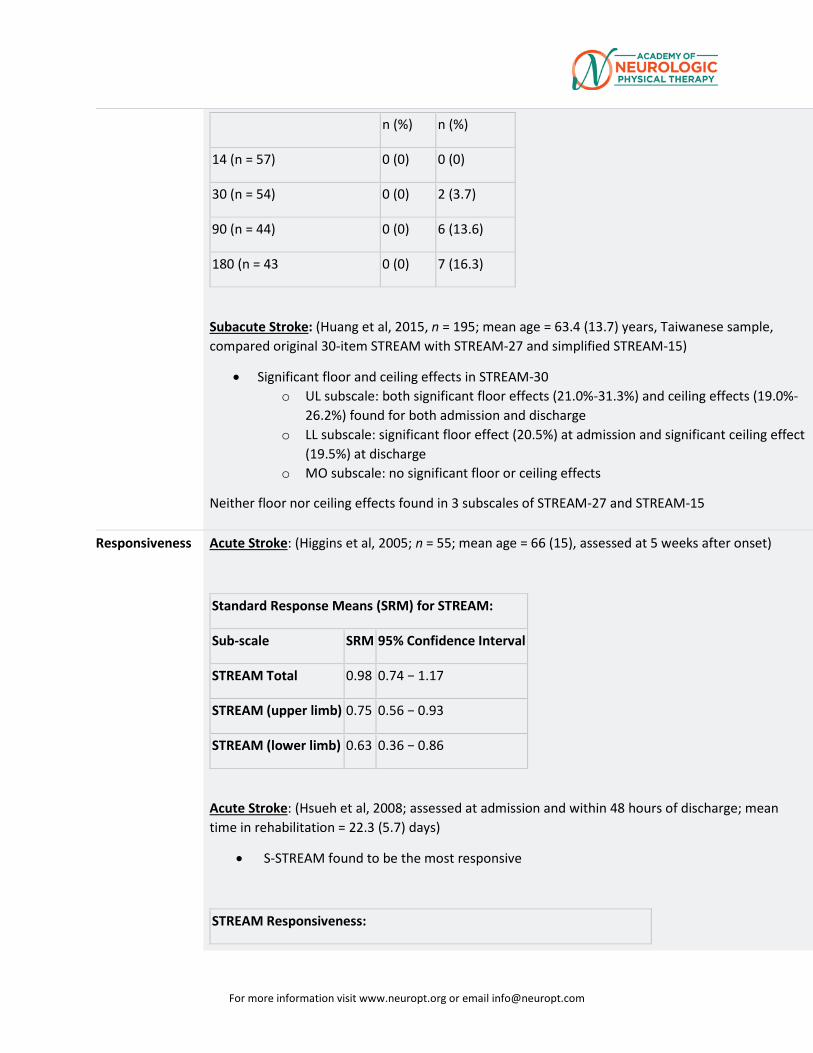
For more information visit www.neuropt.org or email [email protected]
n (%) n (%)
14 (n = 57) 0 (0) 0 (0)
30 (n = 54) 0 (0) 2 (3.7)
90 (n = 44) 0 (0) 6 (13.6)
180 (n = 43 0 (0) 7 (16.3)
Subacute Stroke: (Huang et al, 2015, n = 195; mean age = 63.4 (13.7) years, Taiwanese sample, compared original 30-item STREAM with STREAM-27 and simplified STREAM-15)
• Significant floor and ceiling effects in STREAM-30 o UL subscale: both significant floor effects (21.0%-31.3%) and ceiling effects (19.0%-
26.2%) found for both admission and discharge o LL subscale: significant floor effect (20.5%) at admission and significant ceiling effect
(19.5%) at discharge o MO subscale: no significant floor or ceiling effects
Neither floor nor ceiling effects found in 3 subscales of STREAM-27 and STREAM-15
Responsiveness Acute Stroke: (Higgins et al, 2005; n = 55; mean age = 66 (15), assessed at 5 weeks after onset)
Standard Response Means (SRM) for STREAM:
Sub-scale SRM 95% Confidence Interval
STREAM Total 0.98 0.74 − 1.17
STREAM (upper limb) 0.75 0.56 − 0.93
STREAM (lower limb) 0.63 0.36 − 0.86
Acute Stroke: (Hsueh et al, 2008; assessed at admission and within 48 hours of discharge; mean time in rehabilitation = 22.3 (5.7) days)
• S-STREAM found to be the most responsive
STREAM Responsiveness:
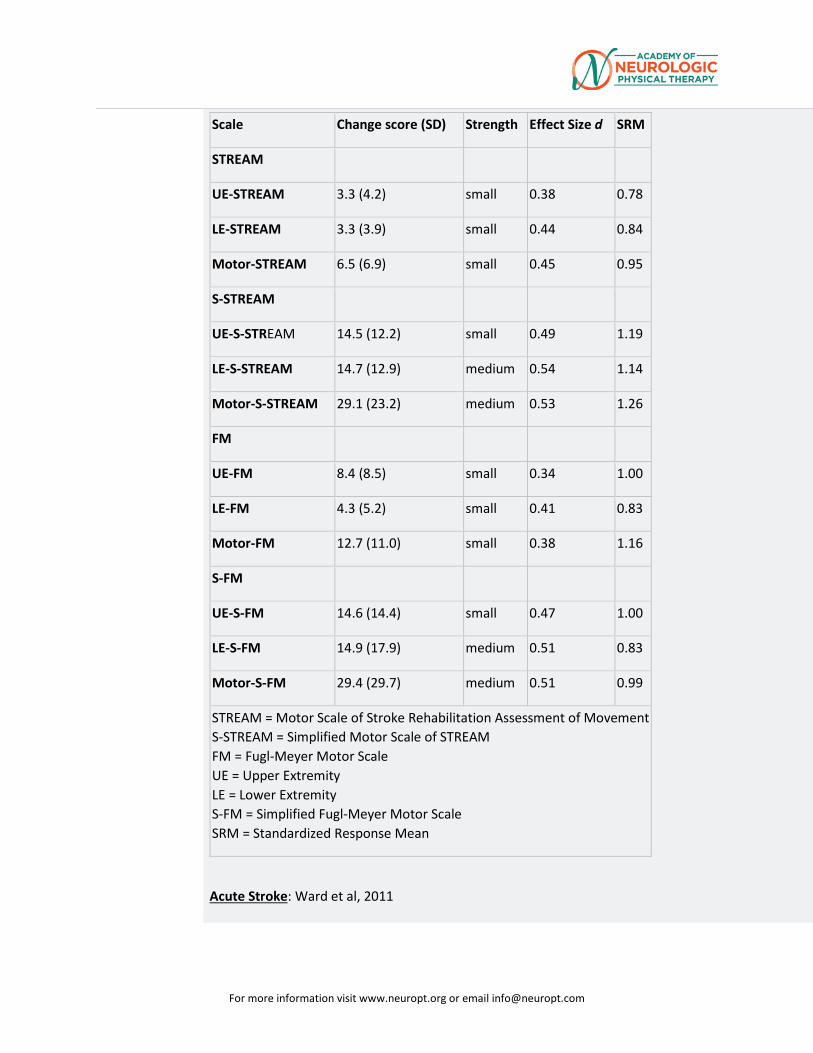
For more information visit www.neuropt.org or email [email protected]
Scale Change score (SD) Strength Effect Size d SRM
STREAM
UE-STREAM 3.3 (4.2) small 0.38 0.78
LE-STREAM 3.3 (3.9) small 0.44 0.84
Motor-STREAM 6.5 (6.9) small 0.45 0.95
S-STREAM
UE-S-STREAM 14.5 (12.2) small 0.49 1.19
LE-S-STREAM 14.7 (12.9) medium 0.54 1.14
Motor-S-STREAM 29.1 (23.2) medium 0.53 1.26
FM
UE-FM 8.4 (8.5) small 0.34 1.00
LE-FM 4.3 (5.2) small 0.41 0.83
Motor-FM 12.7 (11.0) small 0.38 1.16
S-FM
UE-S-FM 14.6 (14.4) small 0.47 1.00
LE-S-FM 14.9 (17.9) medium 0.51 0.83
Motor-S-FM 29.4 (29.7) medium 0.51 0.99
STREAM = Motor Scale of Stroke Rehabilitation Assessment of Movement S-STREAM = Simplified Motor Scale of STREAM FM = Fugl-Meyer Motor Scale UE = Upper Extremity LE = Lower Extremity S-FM = Simplified Fugl-Meyer Motor Scale SRM = Standardized Response Mean
Acute Stroke: Ward et al, 2011
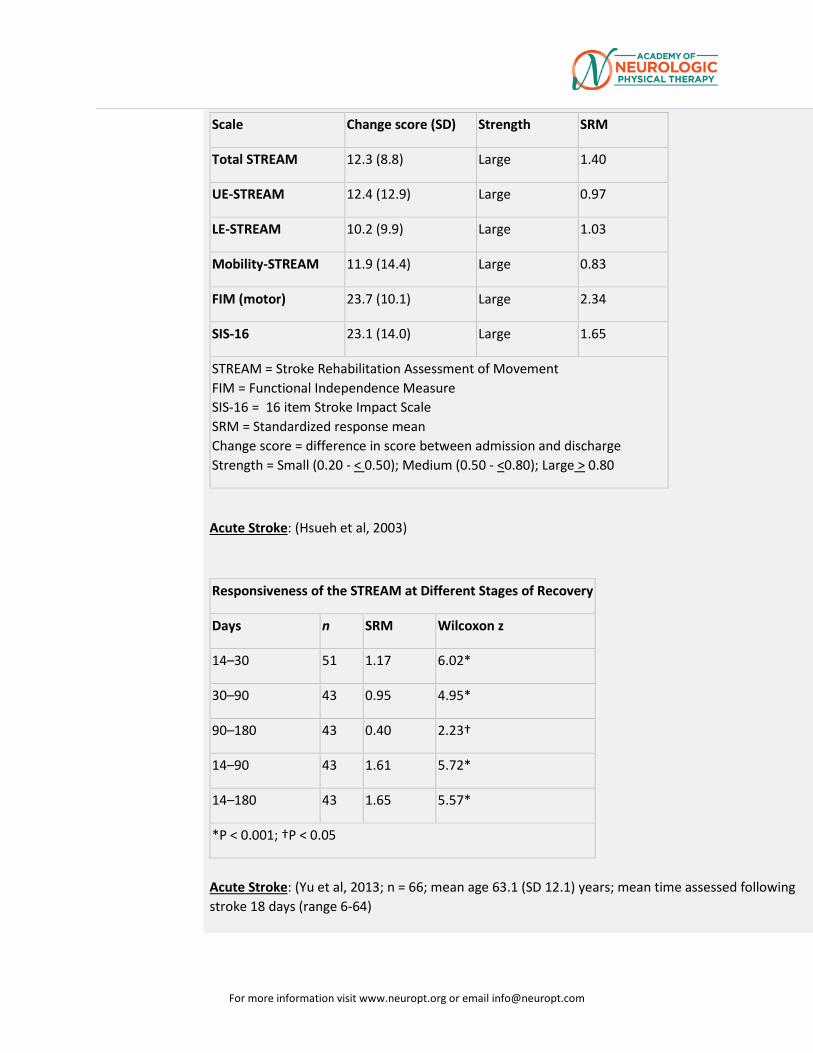
For more information visit www.neuropt.org or email [email protected]
Scale Change score (SD) Strength SRM
Total STREAM 12.3 (8.8) Large 1.40
UE-STREAM 12.4 (12.9) Large 0.97
LE-STREAM 10.2 (9.9) Large 1.03
Mobility-STREAM 11.9 (14.4) Large 0.83
FIM (motor) 23.7 (10.1) Large 2.34
SIS-16 23.1 (14.0) Large 1.65
STREAM = Stroke Rehabilitation Assessment of Movement FIM = Functional Independence Measure SIS-16 = 16 item Stroke Impact Scale SRM = Standardized response mean Change score = difference in score between admission and discharge Strength = Small (0.20 - < 0.50); Medium (0.50 - <0.80); Large > 0.80
Acute Stroke: (Hsueh et al, 2003)
Responsiveness of the STREAM at Different Stages of Recovery
Days n SRM Wilcoxon z
14–30 51 1.17 6.02*
30–90 43 0.95 4.95*
90–180 43 0.40 2.23†
14–90 43 1.61 5.72*
14–180 43 1.65 5.57*
*P < 0.001; †P < 0.05
Acute Stroke: (Yu et al, 2013; n = 66; mean age 63.1 (SD 12.1) years; mean time assessed following stroke 18 days (range 6-64)
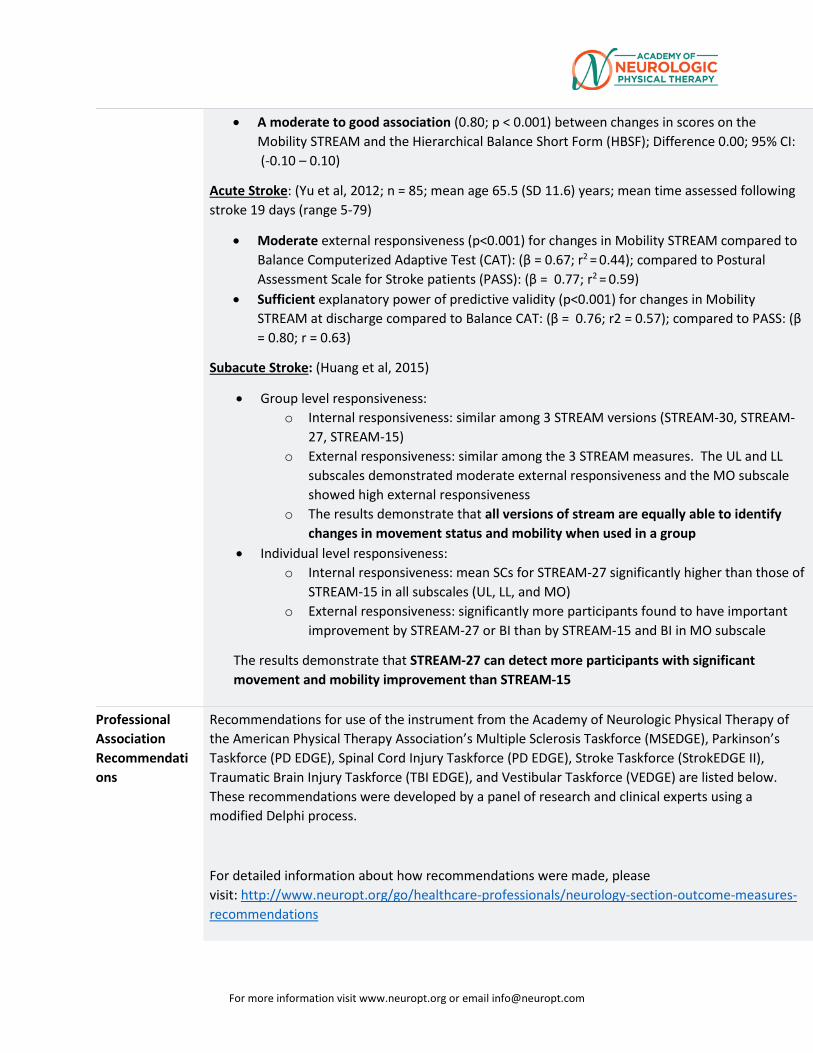
For more information visit www.neuropt.org or email [email protected]
• A moderate to good association (0.80; p < 0.001) between changes in scores on the Mobility STREAM and the Hierarchical Balance Short Form (HBSF); Difference 0.00; 95% CI: (-0.10 – 0.10)
Acute Stroke: (Yu et al, 2012; n = 85; mean age 65.5 (SD 11.6) years; mean time assessed following stroke 19 days (range 5-79)
• Moderate external responsiveness (p<0.001) for changes in Mobility STREAM compared to Balance Computerized Adaptive Test (CAT): (β = 0.67; r2 = 0.44); compared to Postural Assessment Scale for Stroke patients (PASS): (β = 0.77; r2 = 0.59)
• Sufficient explanatory power of predictive validity (p<0.001) for changes in Mobility STREAM at discharge compared to Balance CAT: (β = 0.76; r2 = 0.57); compared to PASS: (β = 0.80; r = 0.63)
Subacute Stroke: (Huang et al, 2015)
• Group level responsiveness: o Internal responsiveness: similar among 3 STREAM versions (STREAM-30, STREAM-
27, STREAM-15) o External responsiveness: similar among the 3 STREAM measures. The UL and LL
subscales demonstrated moderate external responsiveness and the MO subscale showed high external responsiveness
o The results demonstrate that all versions of stream are equally able to identify changes in movement status and mobility when used in a group
• Individual level responsiveness: o Internal responsiveness: mean SCs for STREAM-27 significantly higher than those of
STREAM-15 in all subscales (UL, LL, and MO) o External responsiveness: significantly more participants found to have important
improvement by STREAM-27 or BI than by STREAM-15 and BI in MO subscale
The results demonstrate that STREAM-27 can detect more participants with significant movement and mobility improvement than STREAM-15
Professional Association Recommendations
Recommendations for use of the instrument from the Academy of Neurologic Physical Therapy of the American Physical Therapy Association’s Multiple Sclerosis Taskforce (MSEDGE), Parkinson’s Taskforce (PD EDGE), Spinal Cord Injury Taskforce (PD EDGE), Stroke Taskforce (StrokEDGE II), Traumatic Brain Injury Taskforce (TBI EDGE), and Vestibular Taskforce (VEDGE) are listed below. These recommendations were developed by a panel of research and clinical experts using a modified Delphi process.
For detailed information about how recommendations were made, please visit: http://www.neuropt.org/go/healthcare-professionals/neurology-section-outcome-measures-recommendations
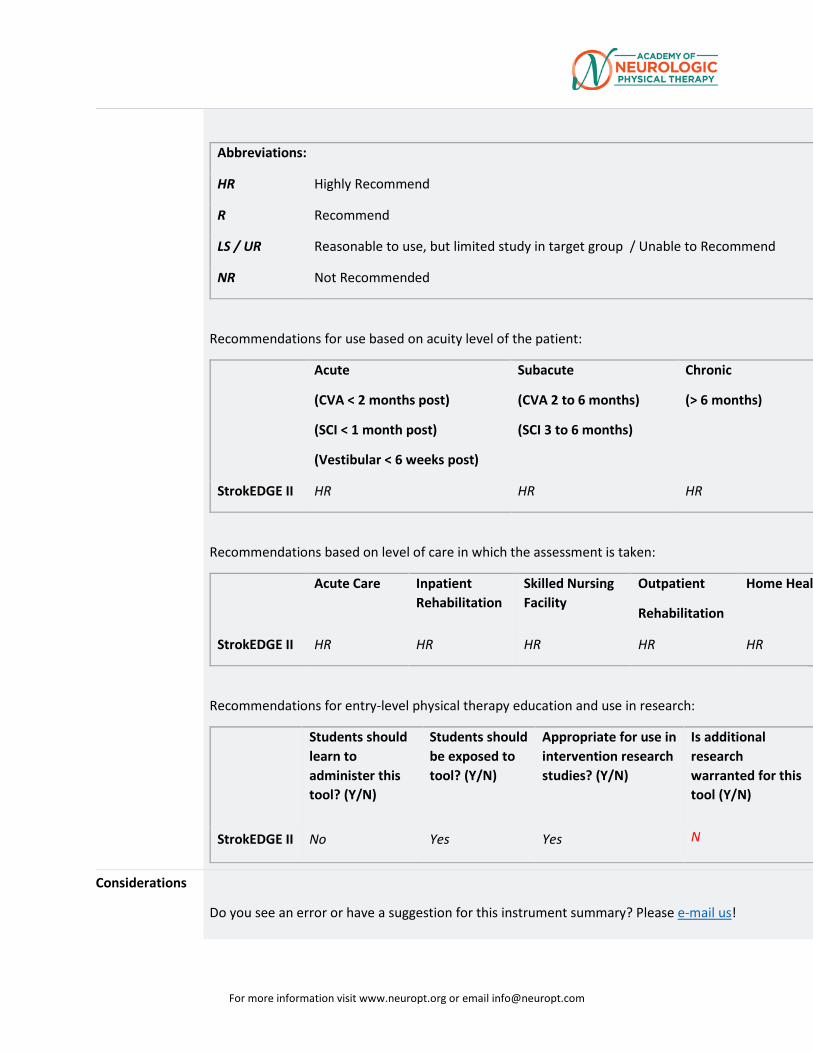
For more information visit www.neuropt.org or email [email protected]
Abbreviations:
HR Highly Recommend
R Recommend
LS / UR Reasonable to use, but limited study in target group / Unable to Recommend
NR Not Recommended
Recommendations for use based on acuity level of the patient:
Acute
(CVA < 2 months post)
(SCI < 1 month post)
(Vestibular < 6 weeks post)
Subacute
(CVA 2 to 6 months)
(SCI 3 to 6 months)
Chronic
(> 6 months)
StrokEDGE II HR HR HR
Recommendations based on level of care in which the assessment is taken:
Acute Care Inpatient Rehabilitation
Skilled Nursing Facility
Outpatient
Rehabilitation
Home Healt
StrokEDGE II HR HR HR HR HR
Recommendations for entry-level physical therapy education and use in research:
Students should learn to administer this tool? (Y/N)
Students should be exposed to tool? (Y/N)
Appropriate for use in intervention research studies? (Y/N)
Is additional research warranted for this tool (Y/N)
StrokEDGE II No Yes Yes N
Considerations
Do you see an error or have a suggestion for this instrument summary? Please e-mail us!
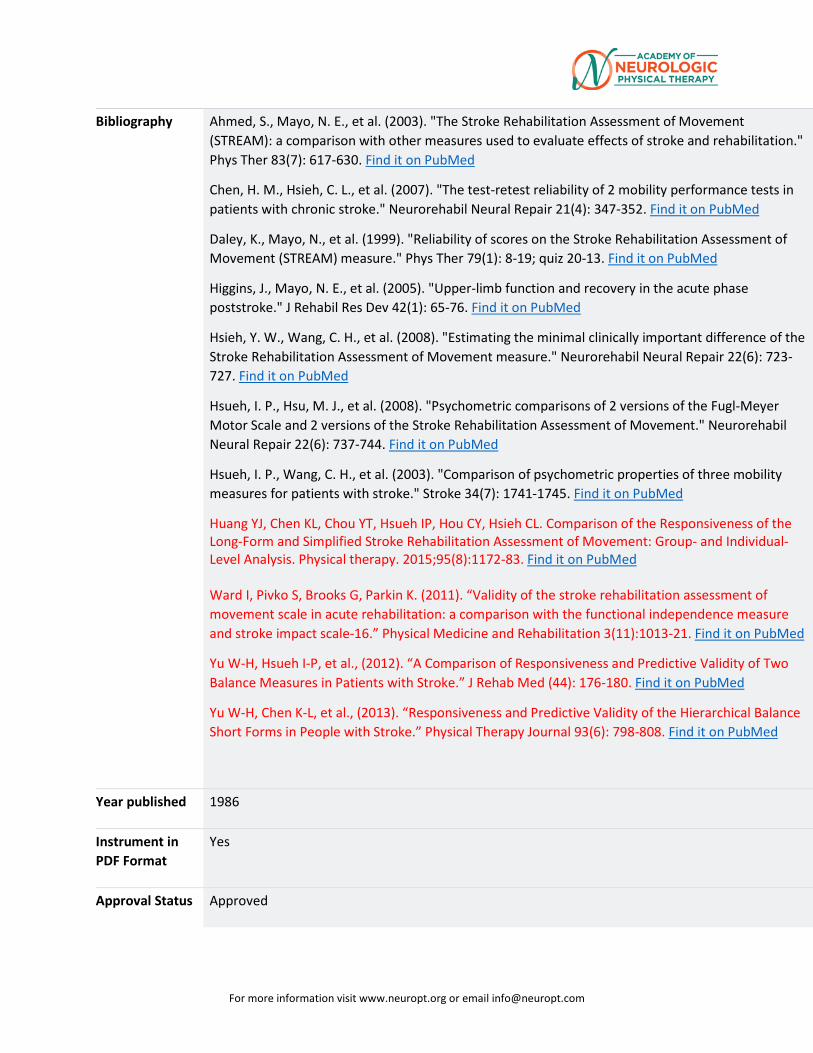
For more information visit www.neuropt.org or email [email protected]
Bibliography Ahmed, S., Mayo, N. E., et al. (2003). "The Stroke Rehabilitation Assessment of Movement (STREAM): a comparison with other measures used to evaluate effects of stroke and rehabilitation." Phys Ther 83(7): 617-630. Find it on PubMed
Chen, H. M., Hsieh, C. L., et al. (2007). "The test-retest reliability of 2 mobility performance tests in patients with chronic stroke." Neurorehabil Neural Repair 21(4): 347-352. Find it on PubMed
Daley, K., Mayo, N., et al. (1999). "Reliability of scores on the Stroke Rehabilitation Assessment of Movement (STREAM) measure." Phys Ther 79(1): 8-19; quiz 20-13. Find it on PubMed
Higgins, J., Mayo, N. E., et al. (2005). "Upper-limb function and recovery in the acute phase poststroke." J Rehabil Res Dev 42(1): 65-76. Find it on PubMed
Hsieh, Y. W., Wang, C. H., et al. (2008). "Estimating the minimal clinically important difference of the Stroke Rehabilitation Assessment of Movement measure." Neurorehabil Neural Repair 22(6): 723-727. Find it on PubMed
Hsueh, I. P., Hsu, M. J., et al. (2008). "Psychometric comparisons of 2 versions of the Fugl-Meyer Motor Scale and 2 versions of the Stroke Rehabilitation Assessment of Movement." Neurorehabil Neural Repair 22(6): 737-744. Find it on PubMed
Hsueh, I. P., Wang, C. H., et al. (2003). "Comparison of psychometric properties of three mobility measures for patients with stroke." Stroke 34(7): 1741-1745. Find it on PubMed
Huang YJ, Chen KL, Chou YT, Hsueh IP, Hou CY, Hsieh CL. Comparison of the Responsiveness of the Long-Form and Simplified Stroke Rehabilitation Assessment of Movement: Group- and Individual-Level Analysis. Physical therapy. 2015;95(8):1172-83. Find it on PubMed Ward I, Pivko S, Brooks G, Parkin K. (2011). “Validity of the stroke rehabilitation assessment of movement scale in acute rehabilitation: a comparison with the functional independence measure and stroke impact scale-16.” Physical Medicine and Rehabilitation 3(11):1013-21. Find it on PubMed
Yu W-H, Hsueh I-P, et al., (2012). “A Comparison of Responsiveness and Predictive Validity of Two Balance Measures in Patients with Stroke.” J Rehab Med (44): 176-180. Find it on PubMed
Yu W-H, Chen K-L, et al., (2013). “Responsiveness and Predictive Validity of the Hierarchical Balance Short Forms in People with Stroke.” Physical Therapy Journal 93(6): 798-808. Find it on PubMed
Year published 1986
Instrument in PDF Format
Yes
Approval Status Approved
For more information visit www.neuropt.org or email [email protected]
31. REHAB MEASURES DATABASE: STROKE SPECIFIC QUALITY OF LIFE SCALE
Link to instrument http://www.strokengine.ca/wp-content/uploads/2015/01/Stroke-Specific-Quality-of-Life-Scale.pdf
Title of Assessment Stroke Specific Quality of Life Scale
Acronym SS-QOL
Instrument Reviewer(s) Initially reviewed by Michele Sulwer, PT, DPT, NCS and Genevieve Pinto-Zipp, PT, EdD, of the StrokEDGE II, Neurology Section, APTA, in 3/2016
Summary Date
Purpose Assessment of health-related quality of life specific to stroke survivors
Description • 49 items
• Items are assessed on 5-point Likert Scale
o Each item is answered using 1 of 3 different response sets (1) amount of help required to do specific tasks, ranging from no help to total help (2) amount of trouble experienced when attempting tasks, ranging from unable to do it to no trouble at all (3) degree of agreement with statements regarding their functioning, ranging from strongly agree to strongly disagree
• Provides both summary and domain specific scores
o Domain scores are composed of unweighted averages
o Summary scores are composed of an unweighted average of the 12 domain average scores
• Scores range from 49-245
• Higher scores indicate better functioning
For more information visit www.neuropt.org or email [email protected]
• The twelve domains include
o Mobility
o Energy
o Upper Extremity Function
o Work and Productivity
o Mood
o Self-care
o Social Roles
o Family Roles
o Vision
o Language
o Thinking
o Personality
• May be used with proxies, however research suggests agreement between patient and proxy was best for observable physical domains (Duncan et al, 2002)
Area of Assessment Behavior; Cognition; Functional Mobility; Language; Negative Affect; Personality; Quality of Life; Social Relationships; Upper Extremity Function
Body Part Not Applicable
ICF Domain Participation
Domain Cognition; Emotion; General Health; Motor
Assessment Type Patient Reported Outcomes
Length of Test 06 to 30 Minutes
Time to Administer 10-15 minutes
Number of Items 49
For more information visit www.neuropt.org or email [email protected]
Equipment Required None
Training Required None
Type of training required No Training
Cost Free
Actual Cost Scale can be found in:
Williams, L. S., M. Weinberger, et al. (1999). "Development of a stroke-specific quality of life scale." Stroke 30(7): 1362-1369.
Age Range Adult: 18-64 years; Elderly adult: 65+
Administration Mode Paper/Pencil
Diagnosis Stroke
Populations Tested Stroke
Standard Error of Measurement (SEM)
Not Established
Minimal Detectable Change (MDC) Chronic Stroke: (Lin et al 2011);n=25 patients >6 months post stroke.
MDC95 % of patients exceeding MDC95
Mobility Subscale 5.9 points 9.5% - 28.4%
Self-Care Subscale 4.0 points 6.8% - 28.4%
UE Function Subscale
5.3 points 12.2% - 33.8%
Minimally Clinically Important Difference (MCID)
Chronic Stroke: (Lin et al 2011); n=74; patients >6 months post stroke
MDC95 % of patients exceeding MDC95
Mobility Subscale 1.5 – 2.4 points 9.5% - 28.4%
For more information visit www.neuropt.org or email [email protected]
Self-Care Subscale 1.2 – 1.9 points 6.8% - 28.4%
UE Function Subscale
1.2 – 1.8 points 12.2% - 33.8%
Cut-Off Scores Not Established
Normative Data Acute Stroke: (Williams et al, 1999; n = 34; mean age = 61 years; patients assessed 1 & 3 months post stroke (+/- 1 week); mean Canadian Neurologic Scale at admission = 9.2)
Scores 1 and 3 Months After Stroke by HRQOL*
1 Month** 3 Months**
Measure A Lot Worse
A Little Worse
Same A Lot Worse
A Little Worse
Same
SS-QOL 3.23 3.61 4.19 3.10 3.89 4.35
SF-3 41 52 63 33 49 68
BI 93 91 97 92 98 99
NIHSS 3.4 3.2 1.5 2.4 1.1 1.1
*Overall HRQOL was rated by patients at both time points
** mean scores
Test-retest Reliability Not Established
Interrater/Intrarater Reliability Not Established
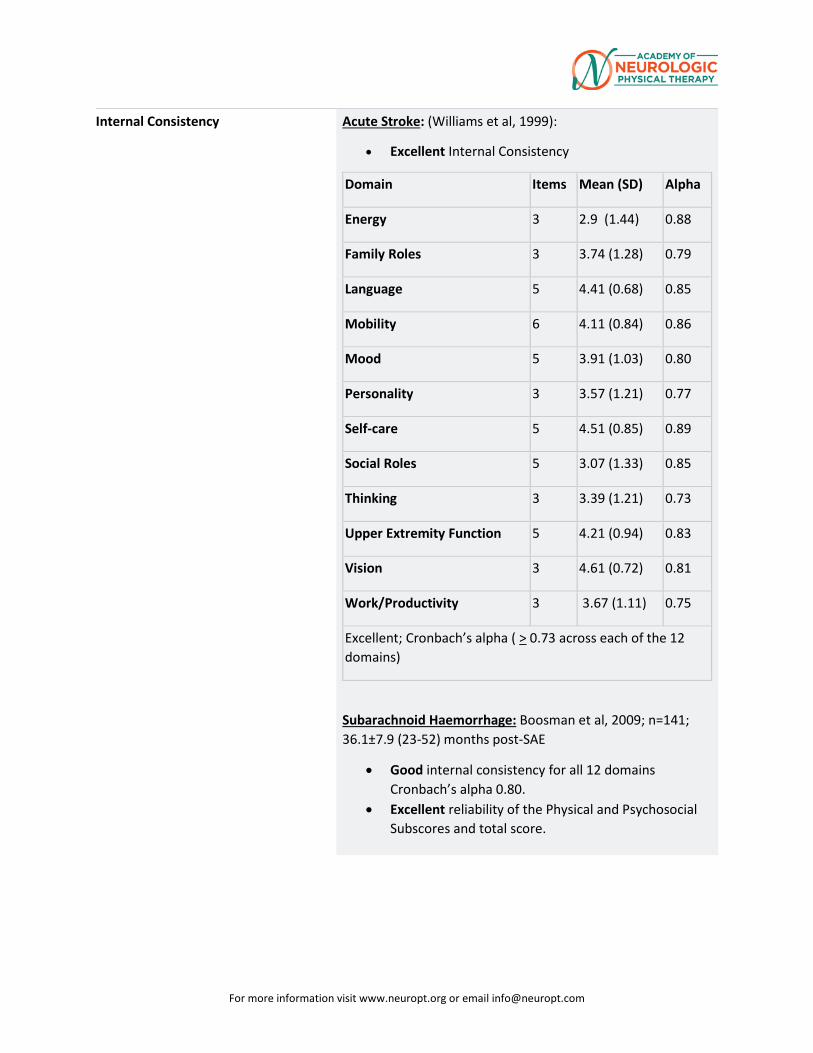
For more information visit www.neuropt.org or email [email protected]
Internal Consistency Acute Stroke: (Williams et al, 1999):
• Excellent Internal Consistency
Domain Items Mean (SD) Alpha
Energy 3 2.9 (1.44) 0.88
Family Roles 3 3.74 (1.28) 0.79
Language 5 4.41 (0.68) 0.85
Mobility 6 4.11 (0.84) 0.86
Mood 5 3.91 (1.03) 0.80
Personality 3 3.57 (1.21) 0.77
Self-care 5 4.51 (0.85) 0.89
Social Roles 5 3.07 (1.33) 0.85
Thinking 3 3.39 (1.21) 0.73
Upper Extremity Function 5 4.21 (0.94) 0.83
Vision 3 4.61 (0.72) 0.81
Work/Productivity 3 3.67 (1.11) 0.75
Excellent; Cronbach’s alpha ( > 0.73 across each of the 12 domains)
Subarachnoid Haemorrhage: Boosman et al, 2009; n=141; 36.1±7.9 (23-52) months post-SAE
• Good internal consistency for all 12 domains Cronbach’s alpha 0.80.
• Excellent reliability of the Physical and Psychosocial Subscores and total score.
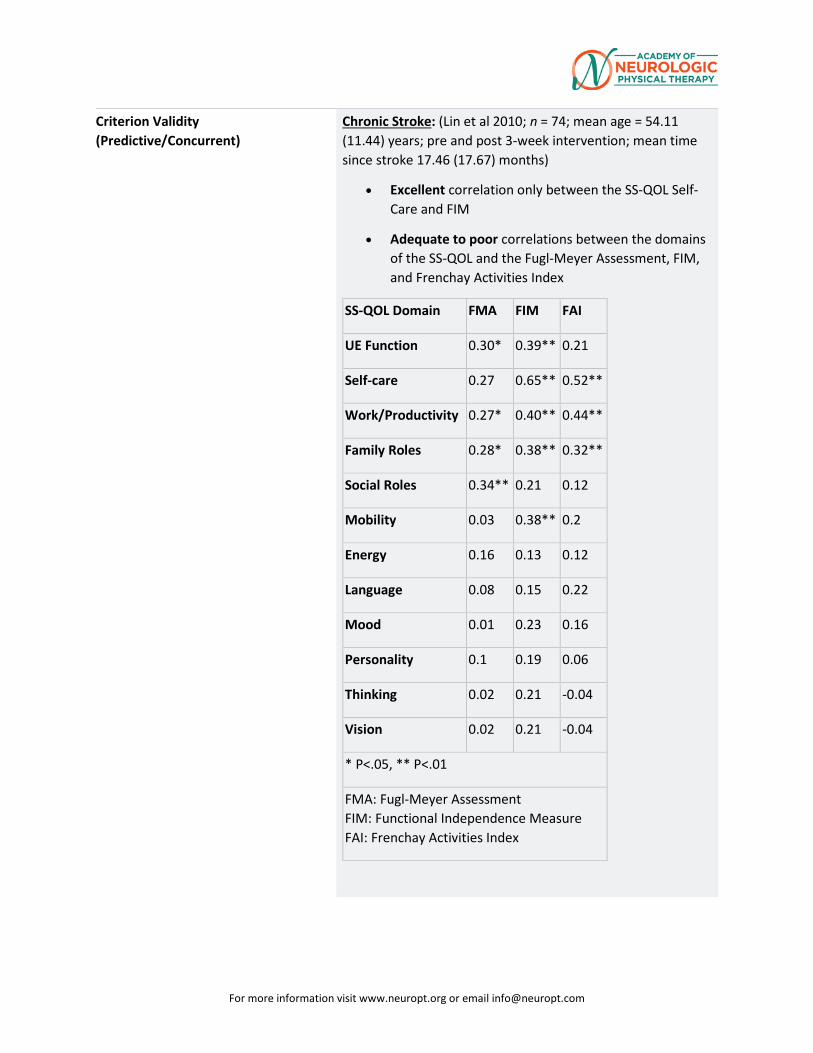
For more information visit www.neuropt.org or email [email protected]
Criterion Validity (Predictive/Concurrent)
Chronic Stroke: (Lin et al 2010; n = 74; mean age = 54.11 (11.44) years; pre and post 3-week intervention; mean time since stroke 17.46 (17.67) months)
• Excellent correlation only between the SS-QOL Self-Care and FIM
• Adequate to poor correlations between the domains of the SS-QOL and the Fugl-Meyer Assessment, FIM, and Frenchay Activities Index
SS-QOL Domain FMA FIM FAI
UE Function 0.30* 0.39** 0.21
Self-care 0.27 0.65** 0.52**
Work/Productivity 0.27* 0.40** 0.44**
Family Roles 0.28* 0.38** 0.32**
Social Roles 0.34** 0.21 0.12
Mobility 0.03 0.38** 0.2
Energy 0.16 0.13 0.12
Language 0.08 0.15 0.22
Mood 0.01 0.23 0.16
Personality 0.1 0.19 0.06
Thinking 0.02 0.21 -0.04
Vision 0.02 0.21 -0.04
* P<.05, ** P<.01
FMA: Fugl-Meyer Assessment FIM: Functional Independence Measure FAI: Frenchay Activities Index
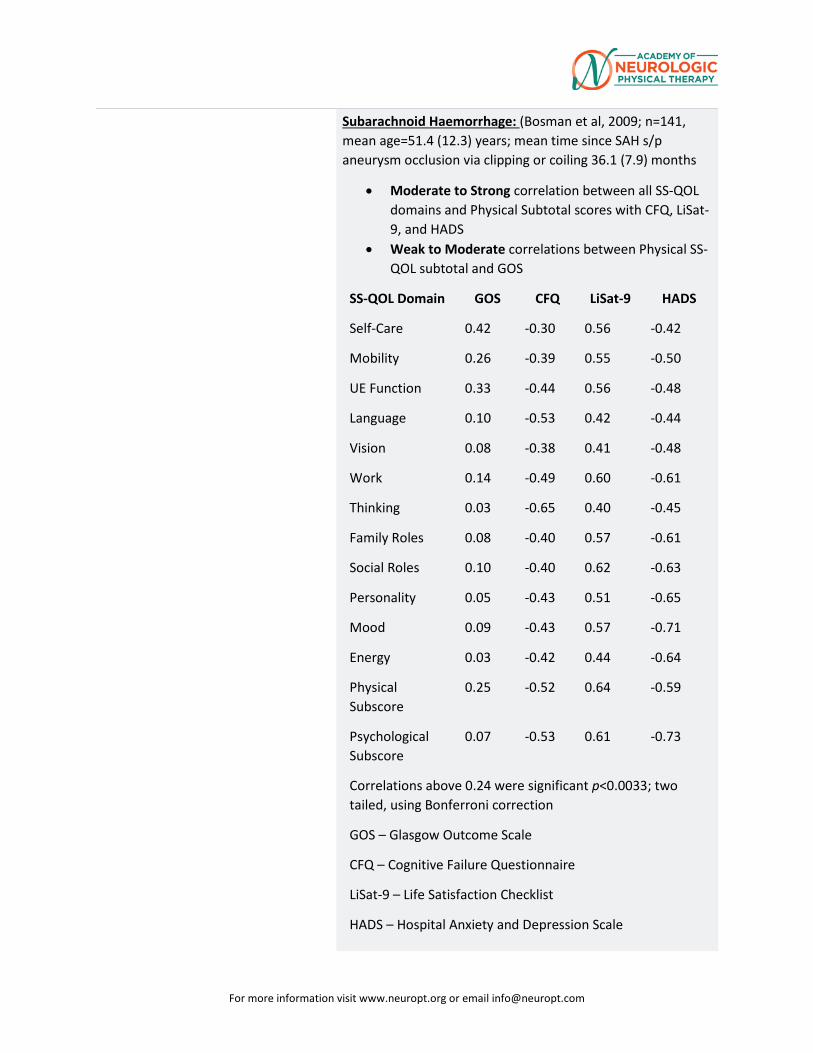
For more information visit www.neuropt.org or email [email protected]
Subarachnoid Haemorrhage: (Bosman et al, 2009; n=141, mean age=51.4 (12.3) years; mean time since SAH s/p aneurysm occlusion via clipping or coiling 36.1 (7.9) months
• Moderate to Strong correlation between all SS-QOL domains and Physical Subtotal scores with CFQ, LiSat-9, and HADS
• Weak to Moderate correlations between Physical SS-QOL subtotal and GOS
SS-QOL Domain GOS CFQ LiSat-9 HADS
Self-Care 0.42 -0.30 0.56 -0.42
Mobility 0.26 -0.39 0.55 -0.50
UE Function 0.33 -0.44 0.56 -0.48
Language 0.10 -0.53 0.42 -0.44
Vision 0.08 -0.38 0.41 -0.48
Work 0.14 -0.49 0.60 -0.61
Thinking 0.03 -0.65 0.40 -0.45
Family Roles 0.08 -0.40 0.57 -0.61
Social Roles 0.10 -0.40 0.62 -0.63
Personality 0.05 -0.43 0.51 -0.65
Mood 0.09 -0.43 0.57 -0.71
Energy 0.03 -0.42 0.44 -0.64
Physical Subscore
0.25 -0.52 0.64 -0.59
Psychological Subscore
0.07 -0.53 0.61 -0.73
Correlations above 0.24 were significant p<0.0033; two tailed, using Bonferroni correction
GOS – Glasgow Outcome Scale
CFQ – Cognitive Failure Questionnaire
LiSat-9 – Life Satisfaction Checklist
HADS – Hospital Anxiety and Depression Scale
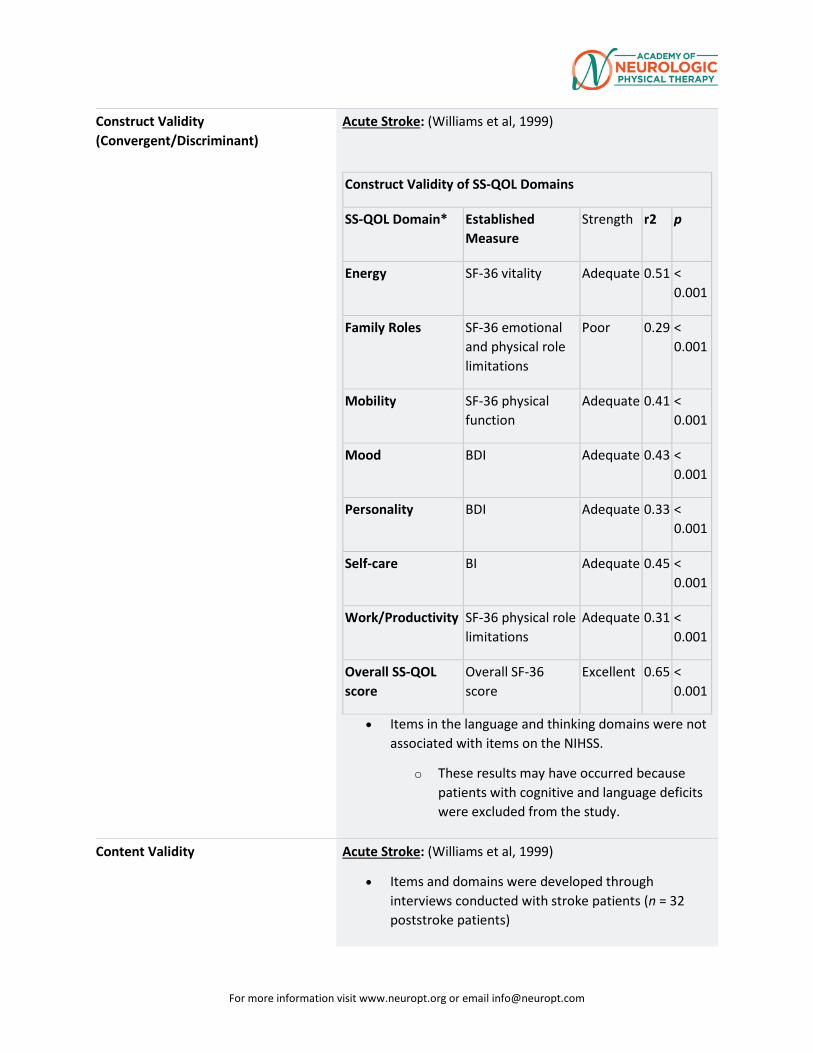
For more information visit www.neuropt.org or email [email protected]
Construct Validity (Convergent/Discriminant)
Acute Stroke: (Williams et al, 1999)
Construct Validity of SS-QOL Domains
SS-QOL Domain* Established Measure
Strength r2 p
Energy SF-36 vitality Adequate 0.51 < 0.001
Family Roles SF-36 emotional and physical role limitations
Poor 0.29 < 0.001
Mobility SF-36 physical function
Adequate 0.41 < 0.001
Mood BDI Adequate 0.43 < 0.001
Personality BDI Adequate 0.33 < 0.001
Self-care BI Adequate 0.45 < 0.001
Work/Productivity SF-36 physical role limitations
Adequate 0.31 < 0.001
Overall SS-QOL score
Overall SF-36 score
Excellent 0.65 < 0.001
• Items in the language and thinking domains were not associated with items on the NIHSS.
o These results may have occurred because patients with cognitive and language deficits were excluded from the study.
Content Validity Acute Stroke: (Williams et al, 1999)
• Items and domains were developed through interviews conducted with stroke patients (n = 32 poststroke patients)
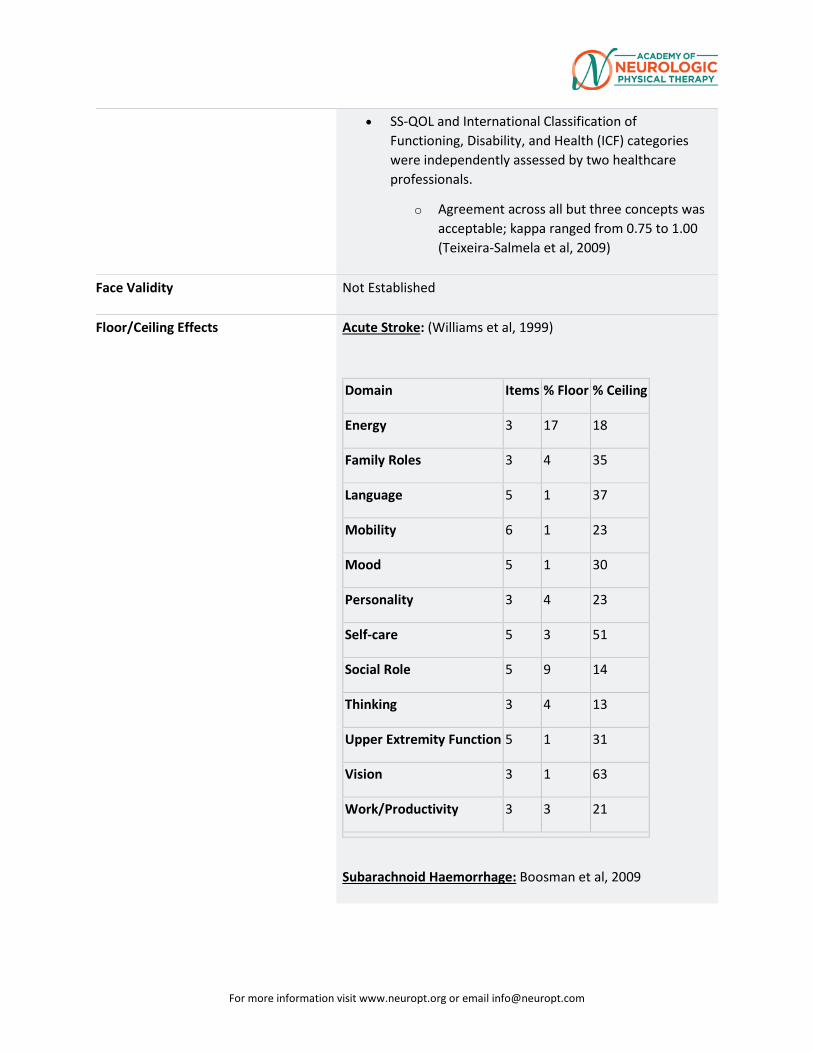
For more information visit www.neuropt.org or email [email protected]
• SS-QOL and International Classification of Functioning, Disability, and Health (ICF) categories were independently assessed by two healthcare professionals.
o Agreement across all but three concepts was acceptable; kappa ranged from 0.75 to 1.00 (Teixeira-Salmela et al, 2009)
Face Validity Not Established
Floor/Ceiling Effects Acute Stroke: (Williams et al, 1999)
Domain Items % Floor % Ceiling
Energy 3 17 18
Family Roles 3 4 35
Language 5 1 37
Mobility 6 1 23
Mood 5 1 30
Personality 3 4 23
Self-care 5 3 51
Social Role 5 9 14
Thinking 3 4 13
Upper Extremity Function 5 1 31
Vision 3 1 63
Work/Productivity 3 3 21
Subarachnoid Haemorrhage: Boosman et al, 2009
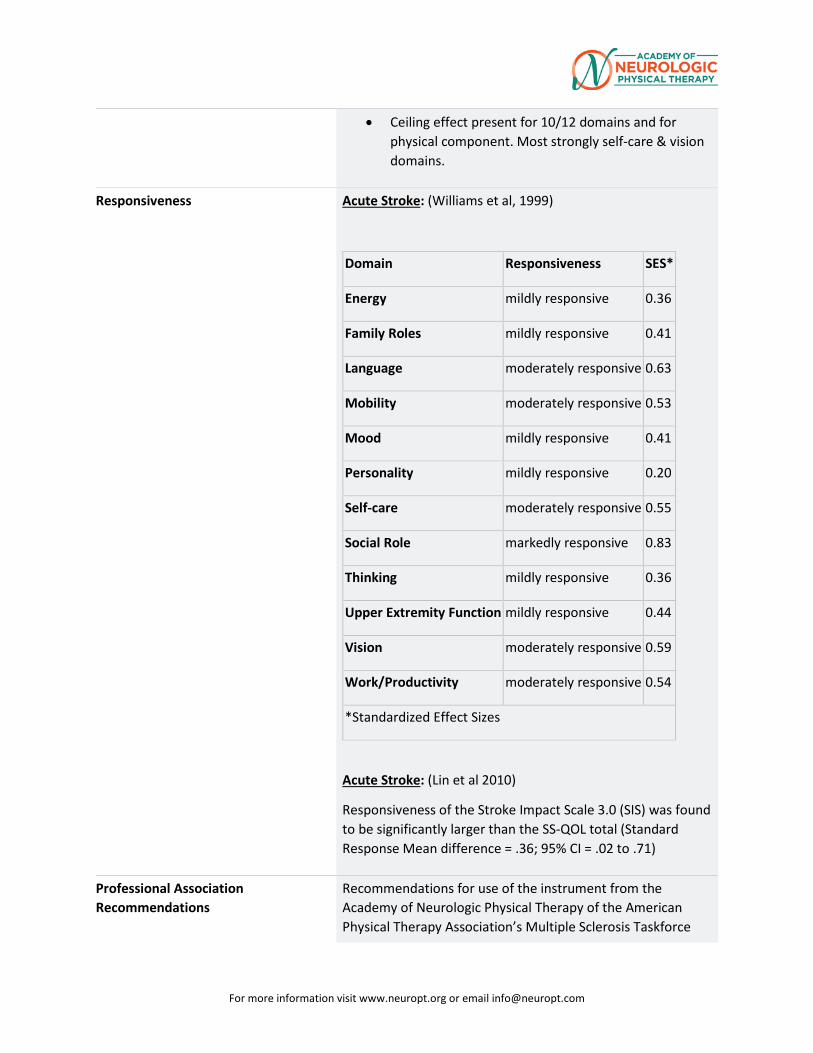
For more information visit www.neuropt.org or email [email protected]
• Ceiling effect present for 10/12 domains and for physical component. Most strongly self-care & vision domains.
Responsiveness Acute Stroke: (Williams et al, 1999)
Domain Responsiveness SES*
Energy mildly responsive 0.36
Family Roles mildly responsive 0.41
Language moderately responsive 0.63
Mobility moderately responsive 0.53
Mood mildly responsive 0.41
Personality mildly responsive 0.20
Self-care moderately responsive 0.55
Social Role markedly responsive 0.83
Thinking mildly responsive 0.36
Upper Extremity Function mildly responsive 0.44
Vision moderately responsive 0.59
Work/Productivity moderately responsive 0.54
*Standardized Effect Sizes
Acute Stroke: (Lin et al 2010)
Responsiveness of the Stroke Impact Scale 3.0 (SIS) was found to be significantly larger than the SS-QOL total (Standard Response Mean difference = .36; 95% CI = .02 to .71)
Professional Association Recommendations
Recommendations for use of the instrument from the Academy of Neurologic Physical Therapy of the American Physical Therapy Association’s Multiple Sclerosis Taskforce
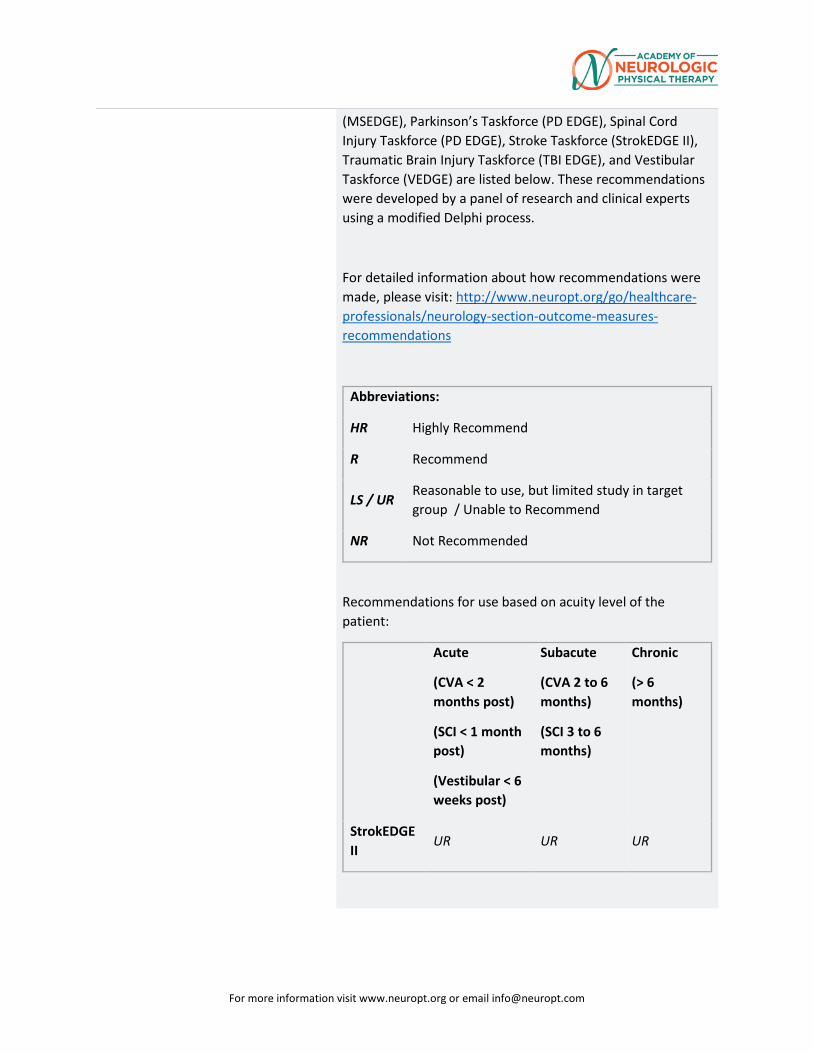
For more information visit www.neuropt.org or email [email protected]
(MSEDGE), Parkinson’s Taskforce (PD EDGE), Spinal Cord Injury Taskforce (PD EDGE), Stroke Taskforce (StrokEDGE II), Traumatic Brain Injury Taskforce (TBI EDGE), and Vestibular Taskforce (VEDGE) are listed below. These recommendations were developed by a panel of research and clinical experts using a modified Delphi process.
For detailed information about how recommendations were made, please visit: http://www.neuropt.org/go/healthcare-professionals/neurology-section-outcome-measures-recommendations
Abbreviations:
HR Highly Recommend
R Recommend
LS / UR Reasonable to use, but limited study in target group / Unable to Recommend
NR Not Recommended
Recommendations for use based on acuity level of the patient:
Acute
(CVA < 2 months post)
(SCI < 1 month post)
(Vestibular < 6 weeks post)
Subacute
(CVA 2 to 6 months)
(SCI 3 to 6 months)
Chronic
(> 6 months)
StrokEDGE II
UR UR UR
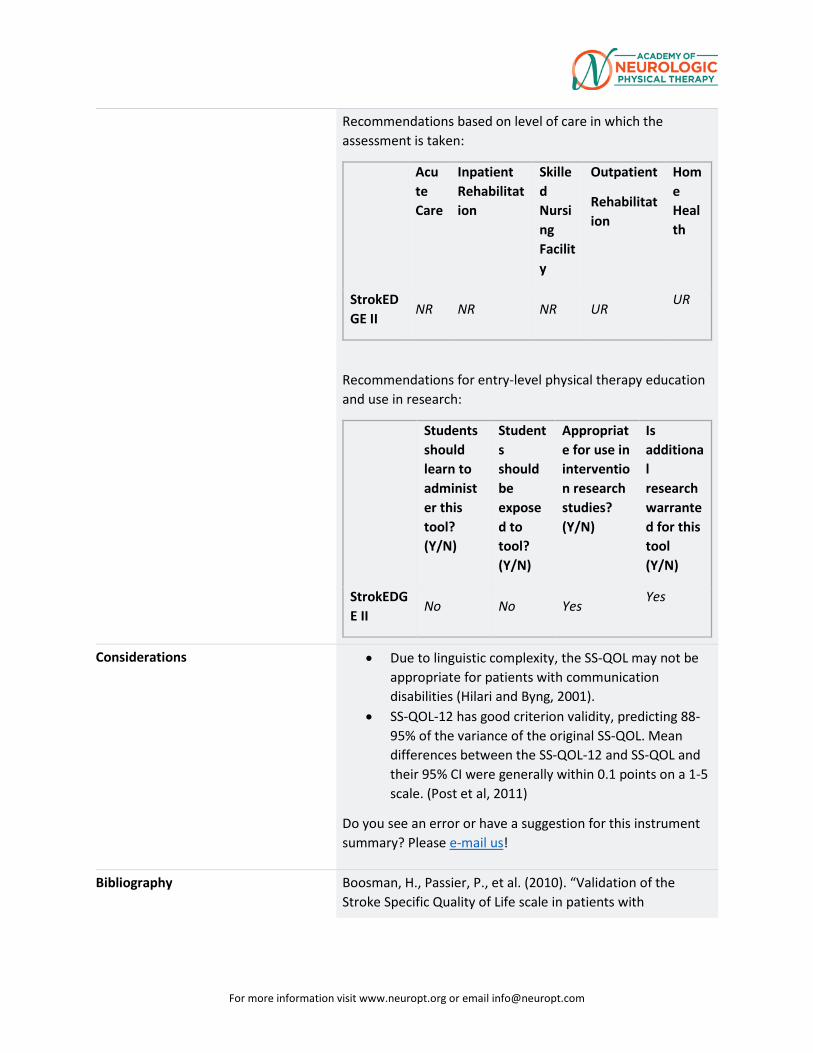
For more information visit www.neuropt.org or email [email protected]
Recommendations based on level of care in which the assessment is taken:
Acute Care
Inpatient Rehabilitation
Skilled Nursing Facility
Outpatient
Rehabilitation
Home Health
StrokEDGE II
NR NR NR UR UR
Recommendations for entry-level physical therapy education and use in research:
Students should learn to administer this tool? (Y/N)
Students should be exposed to tool? (Y/N)
Appropriate for use in intervention research studies? (Y/N)
Is additional research warranted for this tool (Y/N)
StrokEDGE II
No No Yes Yes
Considerations • Due to linguistic complexity, the SS-QOL may not be appropriate for patients with communication disabilities (Hilari and Byng, 2001).
• SS-QOL-12 has good criterion validity, predicting 88-95% of the variance of the original SS-QOL. Mean differences between the SS-QOL-12 and SS-QOL and their 95% CI were generally within 0.1 points on a 1-5 scale. (Post et al, 2011)
Do you see an error or have a suggestion for this instrument summary? Please e-mail us!
Bibliography Boosman, H., Passier, P., et al. (2010). “Validation of the Stroke Specific Quality of Life scale in patients with
For more information visit www.neuropt.org or email [email protected]
aneurysmal subarachnoid haemorrhage.” J Neurol Neurosurg Psychiatry 81:485-489. Find it on PubMed
Duncan, P. W., Lai, S. M., et al. (2002). "Evaluation of proxy responses to the Stroke Impact Scale." Stroke 33: 2593-2599. Find it on PubMed
Hilari, K. and Byng, S. (2001). "Measuring quality of life in people with aphasia: The Stroke Specific Quality of Life Scale." International Journal of Language & Communication Disorders 36(Suppl): 86-91. Find it on PubMed
Lin, K.-C., Fu, T., et al. (2010). "Psychometric comparisons of the Stroke Impact Scale 3.0 and Stroke-Specific Quality of Life Scale." Quality of Life Research: An International Journal of Quality of Life Aspects of Treatment, Care & Rehabilitation 19(3): 435-443. Find it on PubMed
Lin, K.-C., Fu, T., et al. (2011). “Assessing the Stroke-Specific Quality of Life for Outcome Measurement in Stroke Rehabilitation: Minimal Detectable Change and Clinically Important Difference. Health and Quality of Life Outcomes 9:5. Find it on PubMed
Muus, I., Williams, L. S., et al. (2007). "Validation of the Stroke Specific Quality of Life Scale (SS-QOL): test of reliability and validity of the Danish version (SS-QOL-DK)." Clin Rehabil 21(7): 620-627. Find it on PubMed
Post, M.W.M., Boosman, H., et al. (2011). “Development and validation of a short version of the Stroke Specific Quality of Life Scale.” J Neurol Neurosurg Psychiatry 82:283-286. Find it on PubMed
Teixeira-Salmela, L. F., Neto, M. G., et al. (2009). "Content comparisons of stroke-specific quality of life based upon the international classification of functioning, disability, and health." Quality of Life Research: An International Journal of Quality of Life Aspects of Treatment, Care & Rehabilitation 18(6): 765-773. Find it on PubMed
Williams, L. S., Weinberger, M., et al. (1999). "Measuring quality of life in a way that is meaningful to stroke patients." Neurology 53: 1839-1843. Find it on PubMed
For more information visit www.neuropt.org or email [email protected]
Williams, L. S., Weinberger, M., et al. (1999). "Development of a stroke-specific quality of life scale." Stroke 30(7): 1362-1369. Find it on PubMed
Year published 1999
Instrument in PDF Format Yes
Approval Status Approved
32. REHAB MEASURES DATABASE—TARDIEU SPASTICITY SCALE
Link to instrument
Title of Assessment Tardieu Scale/Modified Tardieu Scale
Acronym MTS
Instrument Reviewer(s) Initially reviewed by Christopher Newman, PT, MPT, NCS, Jennifer H. Kahn, PT,
DPT, NCS, and the SCI EDGE task force of the Academy of Neurologic Physical Therapy - a component of APTA in 8/2012. Updated by Michele Sulwer, PT, DPT, NCS and Genevieve Pinto-Zipp, PT, EdD, of the StrokEDGE II, Neurology Section, APTA, 3/2016
Summary Date 12/23/2013; March 2016
Purpose To assess the muscle's response to stretch at various given velocities.
Description Tardieu is a scale for measuring spasticity that takes into account resistance to passive movement at both slow and fast speed. The scale originally began development in the 1950s and has gone through multiple revisions (reviewed in Haugh 2006). The most recent versions of the Modified Tardieu Scale use the following criteria:
• Individuals are positioned in sitting to test the UEs and supine to test the LEs
• 2 Measurements: o Quality of muscle reaction o Angle of muscle reaction
• 3 Speed definitions: o V1 is slow as possible o V2 speed of limb falling under gravity o V3 moving as fast as possible
• Quality of Muscle Reaction (scored 0-5); 0 is no resistance to passive ROM to 5 indicating joint is immobile. (Some versions scored 0-4)
Grade Description 0 No resistance throughout the course of the passive movement
For more information visit www.neuropt.org or email [email protected]
1 Slight resistance throughout the course of the passive movement, with no clear catch at precise angle
2 Clear catch at precise angle, interrupting the passive movement, followed by release
3 Fatigable clonus (<10 seconds when maintaining pressure) occurring at precise angle
4 Infatigable clonus (>10 seconds when maintaining pressure) occurring at precise angle
• Joint Angle: Modified Tardieu describes R1 and R2; R1 is the angle of
muscle reaction, R2 is the full PROM • The angle of full ROM (R2) is taken at a very slow speed (V1). The angle
of muscle reaction (R1) is defined as the angle in which a catch or clonus is found during a quick stretch (V3). R1 is then subtracted from R2 and this represents the dynamic tone component of the muscle. (Boyd 1999)
Area of Assessment Functional Mobility
Body Part Not Applicable
ICF Domain Body Structure; Body Function
Domain Motor
Assessment Type Performance Measure
Length of Test
Time to Administer Dependent on number of joints being tested.
Number of Items Dependent on number of joints being tested.
Equipment Required Goniometer
Training Required No formal training required. Recommend training from an experienced tester for better understanding of how to correctly administer test.
Type of training required No Training
Cost Free
Actual Cost Free
Age Range
Administration Mode
Diagnosis Cerebral Palsy; Geriatrics; Stroke; Traumatic Brain Injury
Populations Tested • Cerebral Palsy
• Adults with severe brain injury
• Stroke
For more information visit www.neuropt.org or email [email protected]
• Adults with profound intellectual and multiple disabilities (PIMD)
Standard Error of Measurement (SEM)
Stroke: (Paulis et al, 2011; n = 13 subjects living in a nursing home; mean age = 70.2(12.30) years; compared test-retest and interrater reliability of Tardieu of elbow flexors measured with goniometry vs. inertial sensors (IS))
• Tardieu (R2-R1) SEM Goni = 6.19, IS = 8.81 • Passive ROM (R2) SEM Goni= 5.04, IS= 6.80 • Angle of Catch (R1) SEM Goni = 4.47, IS= 5.72
Severe Brain Injury: (Mehrholz et al, 2005; n = 30, patients with impaired consciousness due to severe cerebral damage of various etiologies; mean age = 63.9(12.9) years)
SEM for Intra-rater Reliability Domain SEM Shoulder flexion 0.05 Shoulder external rotation 0.05 Elbow flexion 0.04 Elbow extension 0.04 Wrist flexion 0.02 Wrist extension 0.04 Hip flexion 0.02 Hip extension 0.04 Knee flexion 0.05 Knee extension 0.03 Ankle extension (knee joint flexed) 0.02 Ankle extension (knee joint fully extended) 0.04
SEM for Inter-rater Reliability Domain SEM Shoulder flexion 0.05 Shoulder external rotation 0.05 Elbow flexion 0.03 Elbow extension 0.03 Wrist flexion 0.07 Wrist extension 0.03 Hip flexion 0.04 Hip extension 0.03 Knee flexion 0.04 Knee extension 0.03 Ankle extension (knee joint flexed) 0.03 Ankle extension (knee joint fully extended) 0.04
Minimal Detectable Change (MDC)
Stroke: (Paulis et al, 2011) Smallest Detectable Difference (SDD) calculated from above referenced SEM data and test retest data:
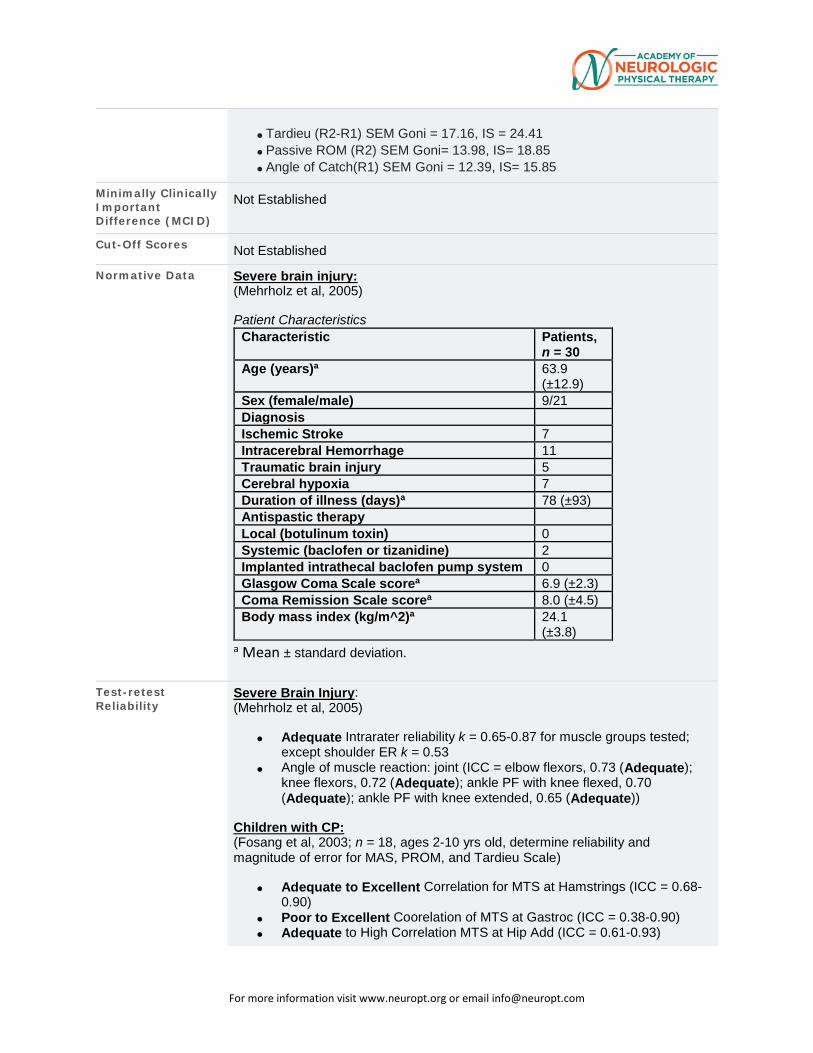
For more information visit www.neuropt.org or email [email protected]
• Tardieu (R2-R1) SEM Goni = 17.16, IS = 24.41 • Passive ROM (R2) SEM Goni= 13.98, IS= 18.85 • Angle of Catch(R1) SEM Goni = 12.39, IS= 15.85
Minimally Clinically Important Difference (MCID)
Not Established
Cut-Off Scores Not Established
Normative Data Severe brain injury: (Mehrholz et al, 2005) Patient Characteristics
Characteristic Patients, n = 30
Age (years)a 63.9 (±12.9)
Sex (female/male) 9/21 Diagnosis
Ischemic Stroke 7 Intracerebral Hemorrhage 11 Traumatic brain injury 5 Cerebral hypoxia 7 Duration of illness (days)a 78 (±93) Antispastic therapy
Local (botulinum toxin) 0 Systemic (baclofen or tizanidine) 2 Implanted intrathecal baclofen pump system 0 Glasgow Coma Scale scorea 6.9 (±2.3) Coma Remission Scale scorea 8.0 (±4.5) Body mass index (kg/m^2)a 24.1
(±3.8) a Mean ± standard deviation.
Test-retest Reliability
Severe Brain Injury: (Mehrholz et al, 2005)
• Adequate Intrarater reliability k = 0.65-0.87 for muscle groups tested; except shoulder ER k = 0.53
• Angle of muscle reaction: joint (ICC = elbow flexors, 0.73 (Adequate); knee flexors, 0.72 (Adequate); ankle PF with knee flexed, 0.70 (Adequate); ankle PF with knee extended, 0.65 (Adequate))
Children with CP: (Fosang et al, 2003; n = 18, ages 2-10 yrs old, determine reliability and magnitude of error for MAS, PROM, and Tardieu Scale)
• Adequate to Excellent Correlation for MTS at Hamstrings (ICC = 0.68-0.90)
• Poor to Excellent Coorelation of MTS at Gastroc (ICC = 0.38-0.90) • Adequate to High Correlation MTS at Hip Add (ICC = 0.61-0.93)
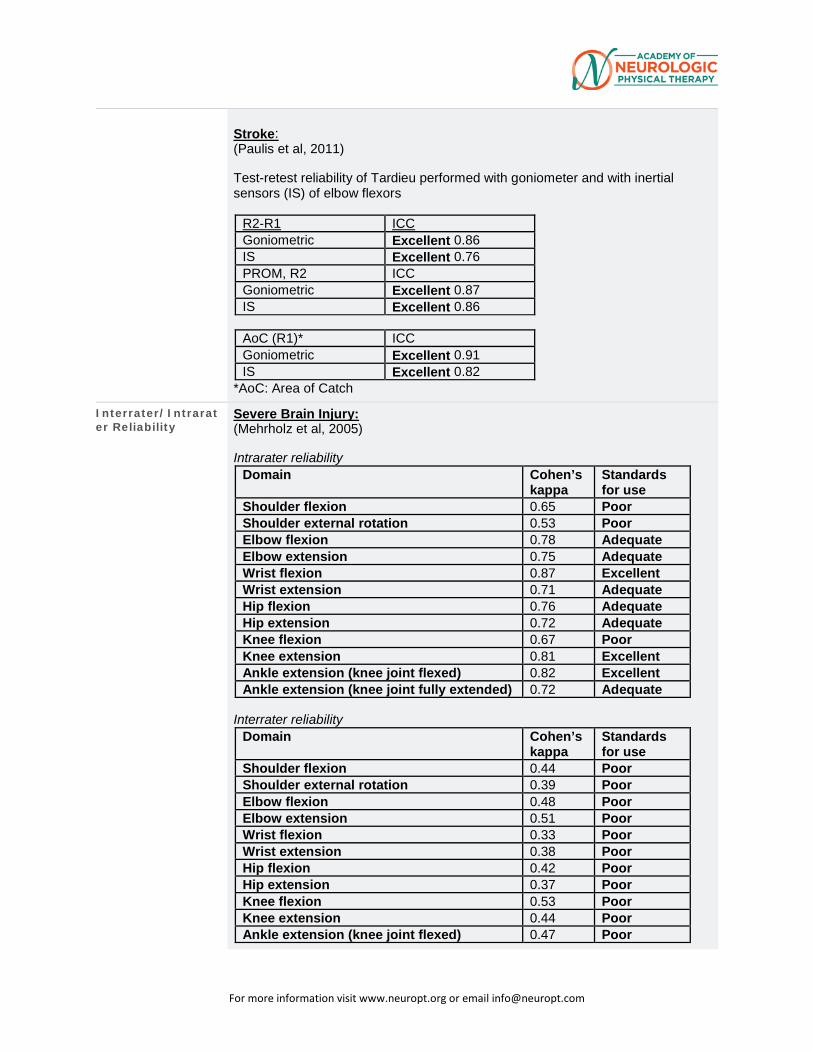
For more information visit www.neuropt.org or email [email protected]
Stroke: (Paulis et al, 2011) Test-retest reliability of Tardieu performed with goniometer and with inertial sensors (IS) of elbow flexors
R2-R1 ICC Goniometric Excellent 0.86 IS Excellent 0.76 PROM, R2 ICC Goniometric Excellent 0.87 IS Excellent 0.86
AoC (R1)* ICC Goniometric Excellent 0.91 IS Excellent 0.82
*AoC: Area of Catch
Interrater/Intrarater Reliability
Severe Brain Injury: (Mehrholz et al, 2005) Intrarater reliability
Domain Cohen’s kappa
Standards for use
Shoulder flexion 0.65 Poor Shoulder external rotation 0.53 Poor Elbow flexion 0.78 Adequate Elbow extension 0.75 Adequate Wrist flexion 0.87 Excellent Wrist extension 0.71 Adequate Hip flexion 0.76 Adequate Hip extension 0.72 Adequate Knee flexion 0.67 Poor Knee extension 0.81 Excellent Ankle extension (knee joint flexed) 0.82 Excellent Ankle extension (knee joint fully extended) 0.72 Adequate
Interrater reliability
Domain Cohen’s kappa
Standards for use
Shoulder flexion 0.44 Poor Shoulder external rotation 0.39 Poor Elbow flexion 0.48 Poor Elbow extension 0.51 Poor Wrist flexion 0.33 Poor Wrist extension 0.38 Poor Hip flexion 0.42 Poor Hip extension 0.37 Poor Knee flexion 0.53 Poor Knee extension 0.44 Poor Ankle extension (knee joint flexed) 0.47 Poor
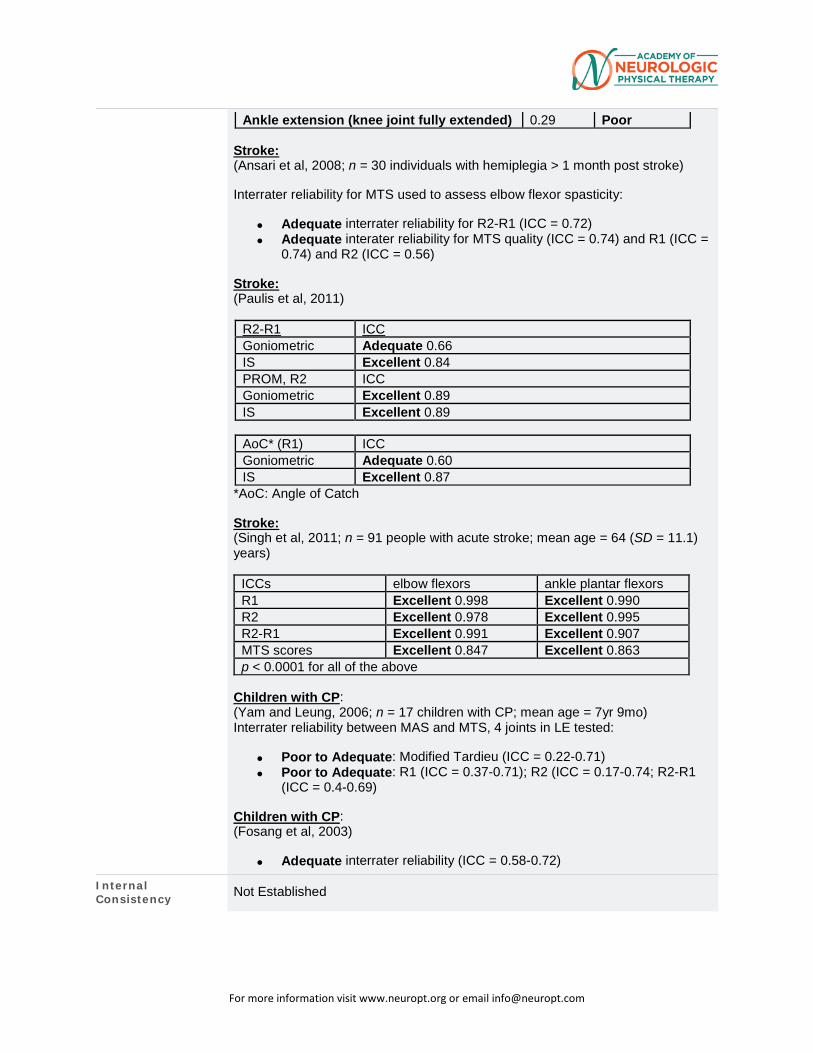
For more information visit www.neuropt.org or email [email protected]
Ankle extension (knee joint fully extended) 0.29 Poor Stroke: (Ansari et al, 2008; n = 30 individuals with hemiplegia > 1 month post stroke) Interrater reliability for MTS used to assess elbow flexor spasticity:
• Adequate interrater reliability for R2-R1 (ICC = 0.72) • Adequate interater reliability for MTS quality (ICC = 0.74) and R1 (ICC =
0.74) and R2 (ICC = 0.56) Stroke: (Paulis et al, 2011)
R2-R1 ICC Goniometric Adequate 0.66 IS Excellent 0.84 PROM, R2 ICC Goniometric Excellent 0.89 IS Excellent 0.89
AoC* (R1) ICC Goniometric Adequate 0.60 IS Excellent 0.87
*AoC: Angle of Catch Stroke: (Singh et al, 2011; n = 91 people with acute stroke; mean age = 64 (SD = 11.1) years)
ICCs elbow flexors ankle plantar flexors R1 Excellent 0.998 Excellent 0.990 R2 Excellent 0.978 Excellent 0.995 R2-R1 Excellent 0.991 Excellent 0.907 MTS scores Excellent 0.847 Excellent 0.863 p < 0.0001 for all of the above
Children with CP: (Yam and Leung, 2006; n = 17 children with CP; mean age = 7yr 9mo) Interrater reliability between MAS and MTS, 4 joints in LE tested:
• Poor to Adequate: Modified Tardieu (ICC = 0.22-0.71) • Poor to Adequate: R1 (ICC = 0.37-0.71); R2 (ICC = 0.17-0.74; R2-R1
(ICC = 0.4-0.69)
Children with CP: (Fosang et al, 2003)
• Adequate interrater reliability (ICC = 0.58-0.72)
Internal Consistency Not Established
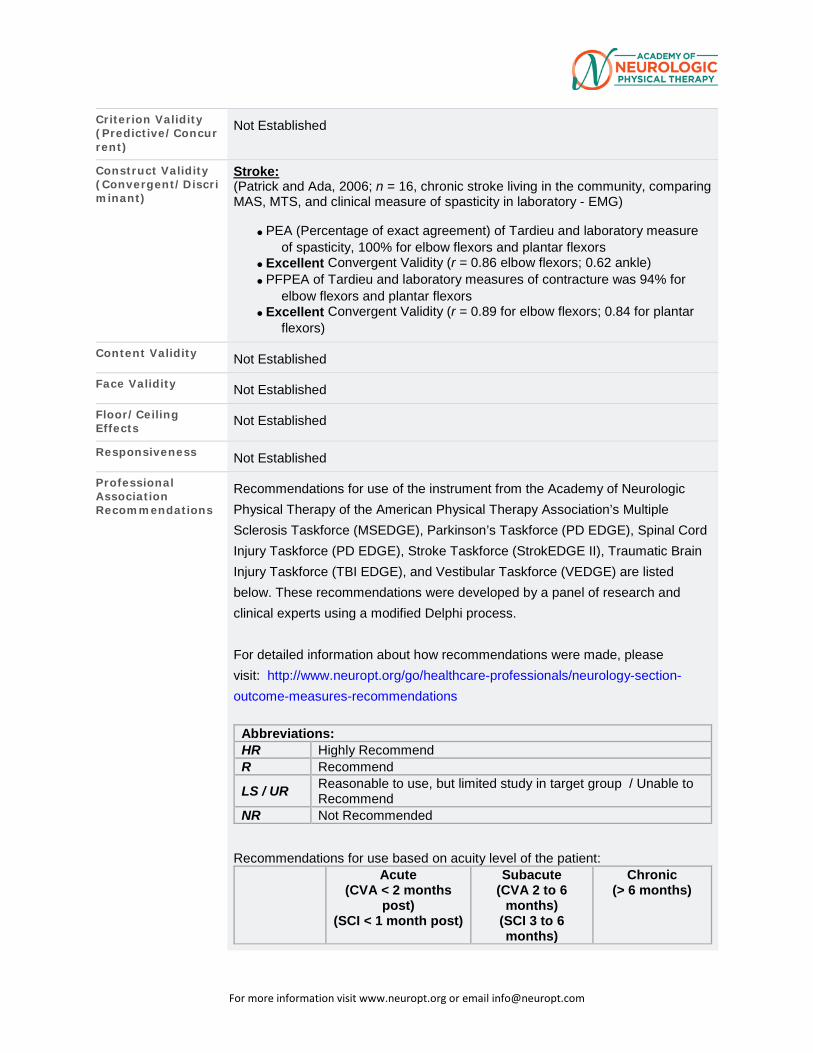
For more information visit www.neuropt.org or email [email protected]
Criterion Validity (Predictive/Concurrent)
Not Established
Construct Validity (Convergent/Discriminant)
Stroke: (Patrick and Ada, 2006; n = 16, chronic stroke living in the community, comparing MAS, MTS, and clinical measure of spasticity in laboratory - EMG)
• PEA (Percentage of exact agreement) of Tardieu and laboratory measure of spasticity, 100% for elbow flexors and plantar flexors
• Excellent Convergent Validity (r = 0.86 elbow flexors; 0.62 ankle) • PFPEA of Tardieu and laboratory measures of contracture was 94% for
elbow flexors and plantar flexors • Excellent Convergent Validity (r = 0.89 for elbow flexors; 0.84 for plantar
flexors)
Content Validity Not Established
Face Validity Not Established
Floor/Ceiling Effects Not Established
Responsiveness Not Established
Professional Association Recommendations
Recommendations for use of the instrument from the Academy of Neurologic Physical Therapy of the American Physical Therapy Association’s Multiple Sclerosis Taskforce (MSEDGE), Parkinson’s Taskforce (PD EDGE), Spinal Cord Injury Taskforce (PD EDGE), Stroke Taskforce (StrokEDGE II), Traumatic Brain Injury Taskforce (TBI EDGE), and Vestibular Taskforce (VEDGE) are listed below. These recommendations were developed by a panel of research and clinical experts using a modified Delphi process.
For detailed information about how recommendations were made, please visit: http://www.neuropt.org/go/healthcare-professionals/neurology-section-outcome-measures-recommendations
Abbreviations: HR Highly Recommend R Recommend LS / UR Reasonable to use, but limited study in target group / Unable to
Recommend NR Not Recommended
Recommendations for use based on acuity level of the patient: Acute
(CVA < 2 months post)
(SCI < 1 month post)
Subacute (CVA 2 to 6
months) (SCI 3 to 6 months)
Chronic (> 6 months)
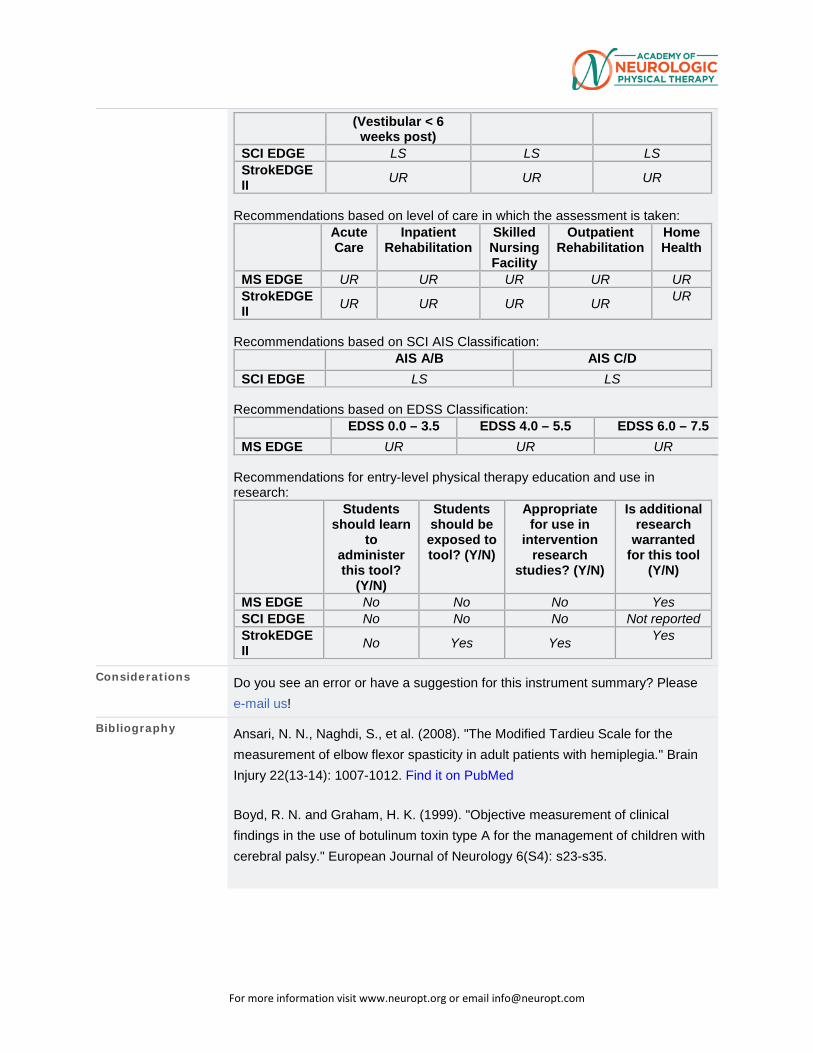
For more information visit www.neuropt.org or email [email protected]
(Vestibular < 6 weeks post)
SCI EDGE LS LS LS StrokEDGE II UR UR UR
Recommendations based on level of care in which the assessment is taken: Acute
Care Inpatient
Rehabilitation Skilled Nursing Facility
Outpatient Rehabilitation
Home Health
MS EDGE UR UR UR UR UR StrokEDGE II UR UR UR UR UR
Recommendations based on SCI AIS Classification: AIS A/B AIS C/D SCI EDGE LS LS
Recommendations based on EDSS Classification: EDSS 0.0 – 3.5 EDSS 4.0 – 5.5 EDSS 6.0 – 7.5 MS EDGE UR UR UR
Recommendations for entry-level physical therapy education and use in research: Students
should learn to
administer this tool?
(Y/N)
Students should be exposed to tool? (Y/N)
Appropriate for use in
intervention research
studies? (Y/N)
Is additional research
warranted for this tool
(Y/N)
MS EDGE No No No Yes SCI EDGE No No No Not reported StrokEDGE II No Yes Yes Yes
Considerations Do you see an error or have a suggestion for this instrument summary? Please e-mail us!
Bibliography Ansari, N. N., Naghdi, S., et al. (2008). "The Modified Tardieu Scale for the measurement of elbow flexor spasticity in adult patients with hemiplegia." Brain Injury 22(13-14): 1007-1012. Find it on PubMed
Boyd, R. N. and Graham, H. K. (1999). "Objective measurement of clinical findings in the use of botulinum toxin type A for the management of children with cerebral palsy." European Journal of Neurology 6(S4): s23-s35.
For more information visit www.neuropt.org or email [email protected]
Fosang, A. L., Galea, M. P., et al. (2003). "Measures of muscle and joint performance in the lower limb of children with cerebral palsy." Developmental Medicine and Child Neurology 45(10): 664-670. Find it on PubMed
Haugh, A. B., Pandyan, A. D., et al. (2006). "A systematic review of the Tardieu Scale for the measurement of spasticity." Disability and Rehabilitation 28(15): 899-907. Find it on PubMed
Mehrholz, J., Wagner, K., et al. (2005). "Reliability of the Modified Tardieu Scale and the Modified Ashworth Scale in adult patients with severe brain injury: a comparison study." Clinical Rehabilitation 19(7): 751-759. Find it on PubMed
Patrick, E. and Ada, L. (2006). "The Tardieu Scale differentiates contracture from spasticity whereas the Ashworth Scale is confounded by it." Clinical Rehabilitation 20(2): 173-182. Find it on PubMed
Paulis, W. D., Horemans, H. L., et al. (2011). "Excellent test-retest and inter-rater reliability for Tardieu Scale measurements with inertial sensors in elbow flexors of stroke patients." Gait and Posture 33(2): 185-189. Find it on PubMed
Singh, P., Joshua, A. M., et al. (2011). "Intra-rater reliability of the modified Tardieu scale to quantify spasticity in elbow flexors and ankle plantar flexors in adult stroke subjects." Ann Indian Acad Neurol 14(1): 23-26. Find it on PubMed
Yam, W. K. and Leung, M. S. (2006). "Interrater reliability of Modified Ashworth Scale and Modified Tardieu Scale in children with spastic cerebral palsy." Journal of Child Neurology 21(12): 1031-1035. Find it on PubMed
Year published
Instrument in PDF Format Yes
Approval Status Approved
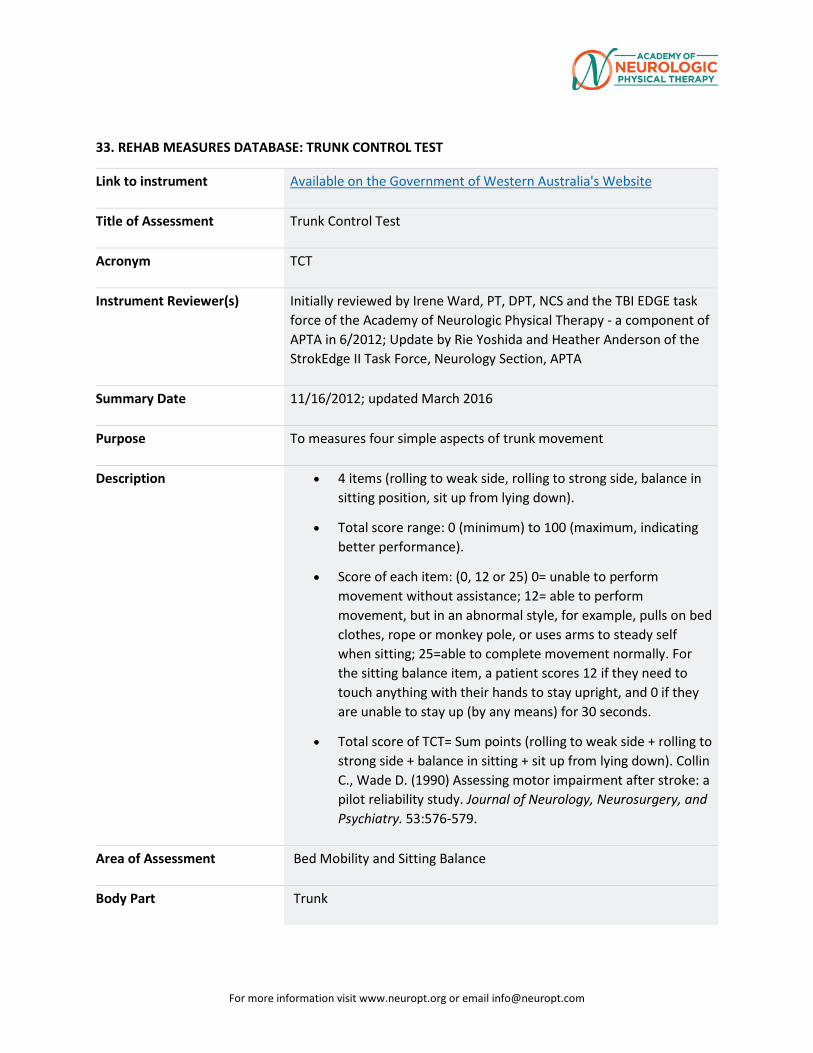
For more information visit www.neuropt.org or email [email protected]
33. REHAB MEASURES DATABASE: TRUNK CONTROL TEST
Link to instrument Available on the Government of Western Australia's Website
Title of Assessment Trunk Control Test
Acronym TCT
Instrument Reviewer(s) Initially reviewed by Irene Ward, PT, DPT, NCS and the TBI EDGE task force of the Academy of Neurologic Physical Therapy - a component of APTA in 6/2012; Update by Rie Yoshida and Heather Anderson of the StrokEdge II Task Force, Neurology Section, APTA
Summary Date 11/16/2012; updated March 2016
Purpose To measures four simple aspects of trunk movement
Description • 4 items (rolling to weak side, rolling to strong side, balance in sitting position, sit up from lying down).
• Total score range: 0 (minimum) to 100 (maximum, indicating better performance).
• Score of each item: (0, 12 or 25) 0= unable to perform movement without assistance; 12= able to perform movement, but in an abnormal style, for example, pulls on bed clothes, rope or monkey pole, or uses arms to steady self when sitting; 25=able to complete movement normally. For the sitting balance item, a patient scores 12 if they need to touch anything with their hands to stay upright, and 0 if they are unable to stay up (by any means) for 30 seconds.
• Total score of TCT= Sum points (rolling to weak side + rolling to strong side + balance in sitting + sit up from lying down). Collin C., Wade D. (1990) Assessing motor impairment after stroke: a pilot reliability study. Journal of Neurology, Neurosurgery, and Psychiatry. 53:576-579.
Area of Assessment Bed Mobility and Sitting Balance
Body Part Trunk
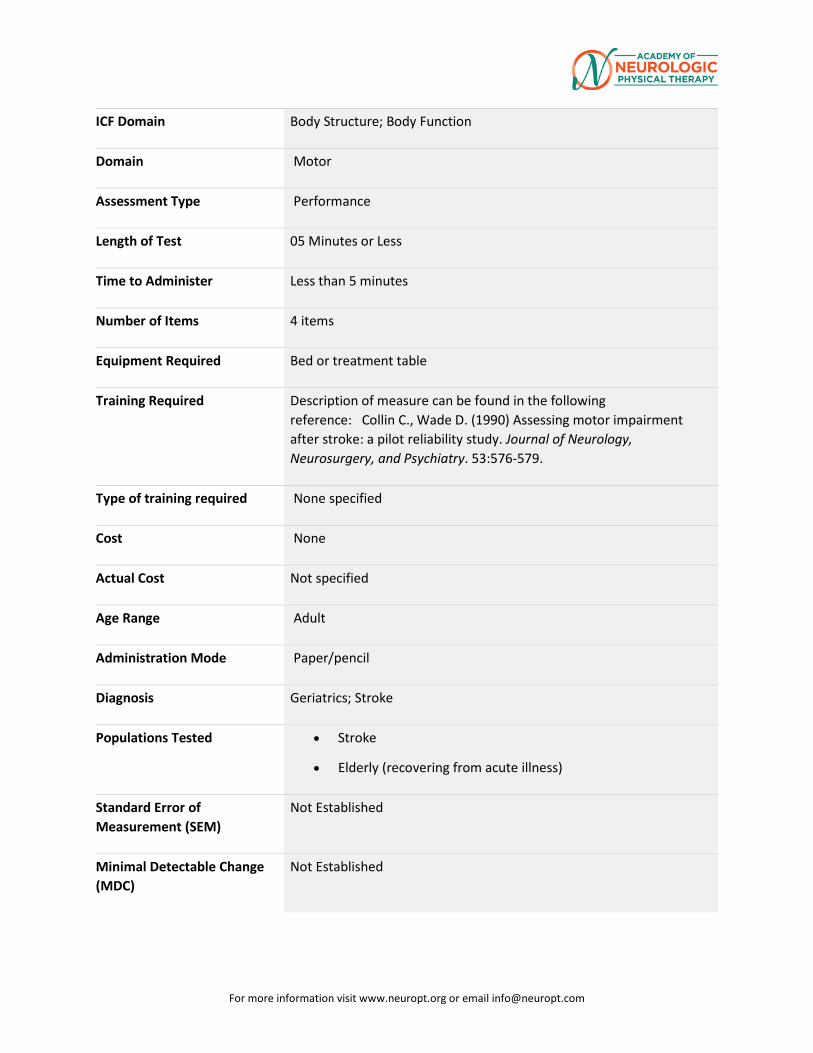
For more information visit www.neuropt.org or email [email protected]
ICF Domain Body Structure; Body Function
Domain Motor
Assessment Type Performance
Length of Test 05 Minutes or Less
Time to Administer Less than 5 minutes
Number of Items 4 items
Equipment Required Bed or treatment table
Training Required Description of measure can be found in the following reference: Collin C., Wade D. (1990) Assessing motor impairment after stroke: a pilot reliability study. Journal of Neurology, Neurosurgery, and Psychiatry. 53:576-579.
Type of training required None specified
Cost None
Actual Cost Not specified
Age Range Adult
Administration Mode Paper/pencil
Diagnosis Geriatrics; Stroke
Populations Tested • Stroke
• Elderly (recovering from acute illness)
Standard Error of Measurement (SEM)
Not Established
Minimal Detectable Change (MDC)
Not Established
For more information visit www.neuropt.org or email [email protected]
Minimally Clinically Important Difference (MCID)
Not Established
Cut-Off Scores Stroke: (Collin and Wade, 1990; 12 female and 24 male patients, age range of male patients = 15-77 years, age range of women = 45-69 years; tested 6, 12 and 18 weeks post stroke)
• At 18 weeks, scores of 50 or more were associated with recovery of walking
• Patients scoring under 40 were non-ambulatory
Normative Data Chronic stroke: (Verheyden et al, 2006, n = 51,16 females, 35 males, mean age= 65 (11) years, range 39-84 years; median days post stroke= 129 days; 29 patients walked without assistance, 22 patients could not walk without assistance or were non-ambulatory)
• The median score on TCT was 61 points (61%)
• Subjects unable to walk without physical assistance had a median score on the TCT of 43 points (24-49)
• Subjects who were able to walk without physical assistance had a median score on the TCT of 61 points (61-100)
Test-retest Reliability Not Established
Interrater/Intrarater Reliability
Stroke: (Collin and Wade, 1990)
• Excellent interrater reliability (r = 0.76, p<0.001)
Internal Consistency Stroke: (Franchignoni et al,1997; n = 49, mean age=68 (13) years; average interval from onset of stroke to admission to rehab was 46 days (median, 40; range 31-78 days))
• Cronbach’s index suggests that the items of the TCT describe a homogeneous variable: the values for the TCT at admission and at discharge were alpha=0.86 and alpha=0.83, respectively.
Criterion Validity (Predictive/Concurrent)
Predictive Validity:
Stroke: (Duarte et al, 2002, n= 28, mean time after stroke onset= 15.3 (6) days; mean initial disability measured with the FIM and motFIM was 84 (22.4) and 52.7 (19.2); mean TCT= 76.4 (24))
For more information visit www.neuropt.org or email [email protected]
• The better the initial trunk control patients have, the longer walking distance and the faster speed they achieve at hospital discharge.
o TCT showed a statistically significant difference (p=0.003) between patients whose walking distance at discharge was longer than 50 m (mean TCT 88.9 (SD 14.3)) and patients whose walking distance was shorter than 50 m (mean TCT 61.9(25.2)).
o Excellent correlations were also statistically significant between the TCT and the time required to walk a 10 m straight walkway at a comfortable (r = -0.644) and at maximal (r =-0.654) safe pace: the better initial TCT was, the higher gait velocities at discharge were.
• Excellent inverse correlation between TCT and length of stay: hemiparetic patients with worse trunk control at admission stay longer in a rehabilitation ward. (r=-0.722).
• Excellent correlation between admission TCT scores and FIM at discharge. Total FIM r = 0.738, motFIM =0.723.
Elderly: (Farriols et al, 2009, n = 21 patients, mean age 78.5(6.7) years, who had developed walking disability after prolonged bed rest for an acute condition)
• Contrary to earlier studies involving younger individuals with stroke, this study failed to show a good correlation between TCT and ability to walk in elderly patients after prolonged bed rest for an acute illness.
Acquired Brain Injury: (Montecchi, 2013, n = 59 patients, mean age 48.9(14.01) years, who had developed ABI following stroke, head trauma or anoxia)
• Excellent correlation between TCT and TRS (Trunk Recovery Scale). Spearman’s rank correlation coefficient rs = 0.943; 95% CI: 0.904 – 0.967)
Construct Validity (Convergent/Discriminant)
Stroke: (Collin and Wade, 1990)
• Excellent construct validity between the TCT and the gross motor function subscale of the Rivermead Motor Assessment at 6, 12 and 18 weeks post stroke. (r = 0.70 to 0.79)
For more information visit www.neuropt.org or email [email protected]
Content Validity Not Established
Face Validity Not Established
Floor/Ceiling Effects Chronic stroke: (Verheyden et al, 2006)
• Twelve participants (24%) reached the maximum score of 100 points on the TCT.
• This indicates a ceiling effect on the TCT in non-acute and chronic stroke patients.
Responsiveness Stroke: (Franchignoni et al, 1997)
• 36 patients (72%) changed the overall TCT score at discharge
• The TCT test showed a good sensitivity to change
Professional Association Recommendations
Recommendations for use of the instrument from the Academy of Neurologic Physical Therapy of the American Physical Therapy Association’s Multiple Sclerosis Taskforce (MSEDGE), Parkinson’s Taskforce (PD EDGE), Spinal Cord Injury Taskforce (PD EDGE), Stroke Taskforce (StrokEDGE II), Traumatic Brain Injury Taskforce (TBI EDGE), and Vestibular Taskforce (VEDGE) are listed below. These recommendations were developed by a panel of research and clinical experts using a modified Delphi process.
For detailed information about how recommendations were made, please visit: http://www.neuropt.org/go/healthcare-professionals/neurology-section-outcome-measures-recommendations
Abbreviations:
HR Highly Recommend
R Recommend
LS / UR Reasonable to use, but limited study in target group / Unable to Recommend
NR Not Recommended
For more information visit www.neuropt.org or email [email protected]
Recommendations for use based on acuity level of the patient:
Acute
(CVA < 2 months post)
(SCI < 1 month post)
(Vestibular < 6 weeks post)
Subacute
(CVA 2 to 6 months)
(SCI 3 to 6 months)
Chronic
(> 6 months)
StrokEDGE II
NR NR NR
Recommendations based on level of care in which the assessment is taken:
Acute Care
Inpatient Rehabilitation
Skilled Nursing Facility
Outpatient
Rehabilitation
Home Health
MS EDGE UR UR UR NR UR
StrokEDGE II
LS LS NR NR NR
TBI EDGE LS LS LS LS LS
Recommendations for use based on ambulatory status after brain injury:
Completely Independent
Mildly dependant Moderate Dependan
TBI EDGE N/A N/A N/A
Recommendations based on EDSS Classification:
EDSS 0.0 – 3.5 EDSS 4.0 – 5.5 EDSS 6.0 –
MS EDGE NR NR NR
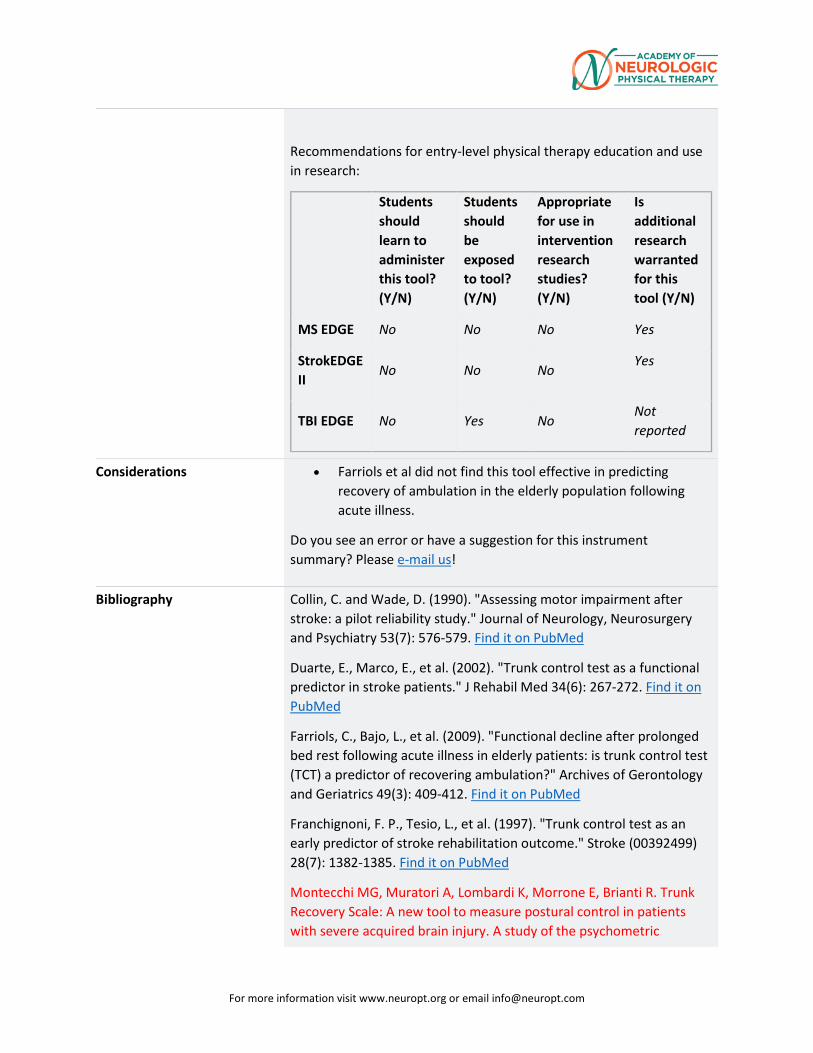
For more information visit www.neuropt.org or email [email protected]
Recommendations for entry-level physical therapy education and use in research:
Students should learn to administer this tool? (Y/N)
Students should be exposed to tool? (Y/N)
Appropriate for use in intervention research studies? (Y/N)
Is additional research warranted for this tool (Y/N)
MS EDGE No No No Yes
StrokEDGE II
No No No Yes
TBI EDGE No Yes No Not reported
Considerations • Farriols et al did not find this tool effective in predicting recovery of ambulation in the elderly population following acute illness.
Do you see an error or have a suggestion for this instrument summary? Please e-mail us!
Bibliography Collin, C. and Wade, D. (1990). "Assessing motor impairment after stroke: a pilot reliability study." Journal of Neurology, Neurosurgery and Psychiatry 53(7): 576-579. Find it on PubMed
Duarte, E., Marco, E., et al. (2002). "Trunk control test as a functional predictor in stroke patients." J Rehabil Med 34(6): 267-272. Find it on PubMed
Farriols, C., Bajo, L., et al. (2009). "Functional decline after prolonged bed rest following acute illness in elderly patients: is trunk control test (TCT) a predictor of recovering ambulation?" Archives of Gerontology and Geriatrics 49(3): 409-412. Find it on PubMed
Franchignoni, F. P., Tesio, L., et al. (1997). "Trunk control test as an early predictor of stroke rehabilitation outcome." Stroke (00392499) 28(7): 1382-1385. Find it on PubMed
Montecchi MG, Muratori A, Lombardi K, Morrone E, Brianti R. Trunk Recovery Scale: A new tool to measure postural control in patients with severe acquired brain injury. A study of the psychometric
For more information visit www.neuropt.org or email [email protected]
properties. European Journal of Physical Medicine and Rehabilitation. 2013; 49(3):341-351. Find it on PubMed
Verheyden, G., Nieuwboer, A., et al. (2007). "Clinical tools to measure trunk performance after stroke: a systematic review of the literature." Clinical Rehabilitation 21(5): 387-394. Find it on PubMed
Verheyden, G., Vereeck, L., et al. (2006). "Trunk performance after stroke and the relationship with balance, gait and functional ability." Clinical Rehabilitation 20(5): 451-458. Find it on PubMed
Year published
Instrument in PDF Format Yes
Approval Status Approved
For more information visit www.neuropt.org or email [email protected]
34. REHAB MEASURES DATABASE: TRUNK IMPAIRMENT SCALE
Link to instrument Available on the Government of Western Australia's Website
Title of Assessment Trunk Impairment Scale
Acronym TIS
Instrument Reviewer(s) Initially reviewed by Irene Ward, PT, DPT, NCS and the TBI task force of the Academy of Neurologic Physical Therapy - a component of APTA in 6/2012; Updated by Onkar J. Rajadhyaksha, PT in 10/2012; Updated with references from the PD population by Rosemary Gallagher, PT, DPT, GCS and the PDEdge Taskforce of the Academy of Neurologic Physical Therapy - a component of APTA in 2/2013; Updated by Michele Sulwer, PT, DPT, NCS and Genevieve Pinto-Zipp, PT, of the StrokEdge II, Neurology Section, APTA in 3/2016
Summary Date 1/29/2014
Purpose To measure the motor impairment of the trunk after a stroke through the evaluation of static and dynamic sitting balance as well as co-ordination of trunk movement (Verheyden et al, 2004)
Description • Scores range from a minimum of 0 to a maximum of 23. If patient scores 0 on the first item, the total score on the TIS is 0. Each item can be performed three times. The highest score counts. Otherwise, no practice session allowed.
• The patient can be corrected between attempts.
• The tests are verbally explained to the patient and can be demonstrated if needed.
• Three subscales: static sitting, balance, dynamic sitting balance and coordination. Each subscale has between three and 10 items.
• Starting position: patient is sitting at the edge of a bed or treatment table without back and arm support. Thighs are supported, knees at 90*, feet flat on the floor, arms resting on the legs, head and trunk in midline position. If hypertonia is present, the position of the arm is taken as the starting position.
For more information visit www.neuropt.org or email [email protected]
• The TIS can be found in the Appendix of the following article: Verheyden G. and Nieuwboer A. (2004). The trunk impairment scale: a new tool to measure motor impairment of the trunk after stroke. Clinical Rehabilitation. 18:326-334.
Area of Assessment
Body Part
ICF Domain Body Structure; Body Function; Activity
Domain
Assessment Type Performance Measure
Length of Test 06 to 30 Minutes
Time to Administer < 20 minutes
Number of Items 17 items
Equipment Required • Treatment table or bed without back and arm support
• Score sheet
• Stop watch
Training Required None necessary
Type of training required No Training
Cost Not Free
Actual Cost Cost of equipment
Age Range
Administration Mode
Diagnosis Cerebral Palsy; Multiple Sclerosis; Parkinson’s Disease; Stroke; Traumatic Brain Injury
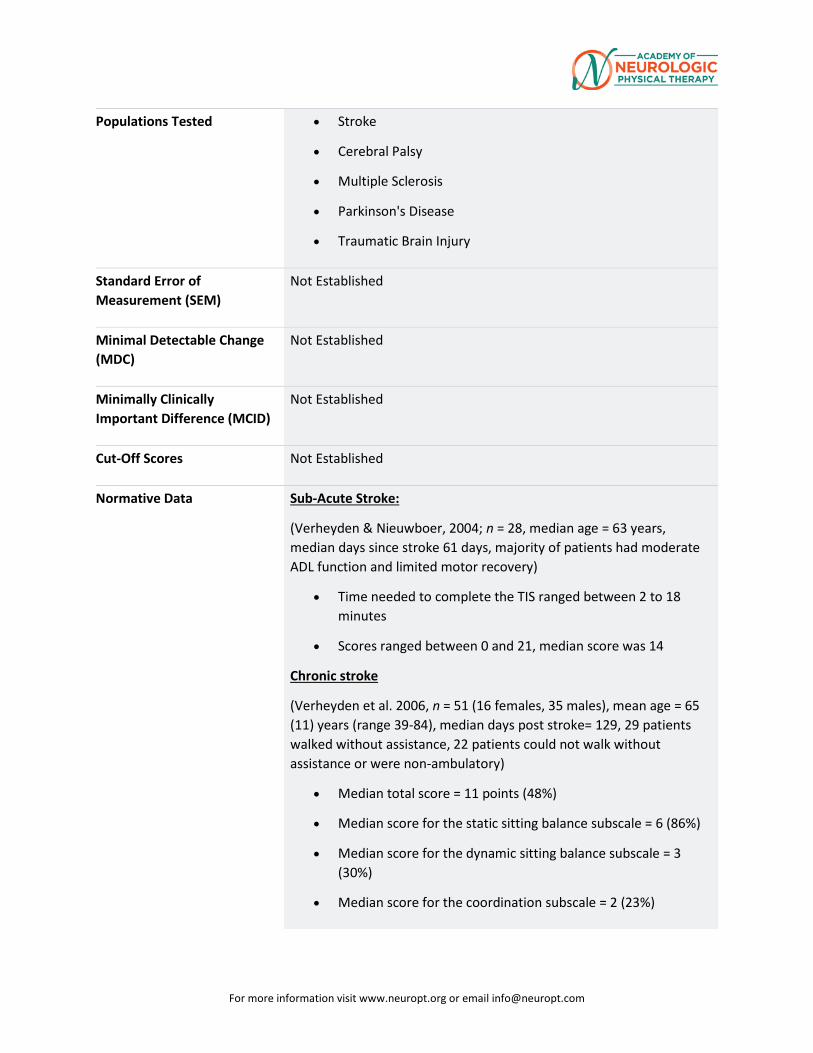
For more information visit www.neuropt.org or email [email protected]
Populations Tested • Stroke
• Cerebral Palsy
• Multiple Sclerosis
• Parkinson's Disease
• Traumatic Brain Injury
Standard Error of Measurement (SEM)
Not Established
Minimal Detectable Change (MDC)
Not Established
Minimally Clinically Important Difference (MCID)
Not Established
Cut-Off Scores Not Established
Normative Data Sub-Acute Stroke:
(Verheyden & Nieuwboer, 2004; n = 28, median age = 63 years, median days since stroke 61 days, majority of patients had moderate ADL function and limited motor recovery)
• Time needed to complete the TIS ranged between 2 to 18 minutes
• Scores ranged between 0 and 21, median score was 14
Chronic stroke
(Verheyden et al. 2006, n = 51 (16 females, 35 males), mean age = 65 (11) years (range 39-84), median days post stroke= 129, 29 patients walked without assistance, 22 patients could not walk without assistance or were non-ambulatory)
• Median total score = 11 points (48%)
• Median score for the static sitting balance subscale = 6 (86%)
• Median score for the dynamic sitting balance subscale = 3 (30%)
• Median score for the coordination subscale = 2 (23%)
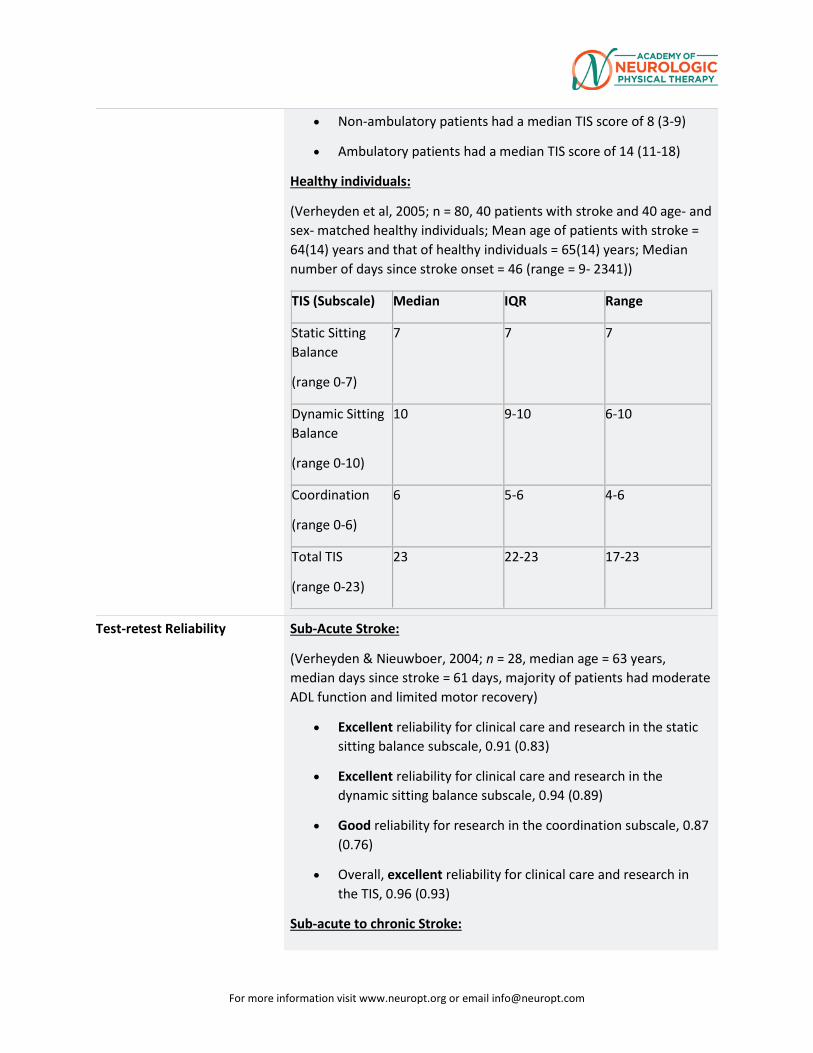
For more information visit www.neuropt.org or email [email protected]
• Non-ambulatory patients had a median TIS score of 8 (3-9)
• Ambulatory patients had a median TIS score of 14 (11-18)
Healthy individuals:
(Verheyden et al, 2005; n = 80, 40 patients with stroke and 40 age- and sex- matched healthy individuals; Mean age of patients with stroke = 64(14) years and that of healthy individuals = 65(14) years; Median number of days since stroke onset = 46 (range = 9- 2341))
TIS (Subscale) Median IQR Range
Static Sitting Balance
(range 0-7)
7 7 7
Dynamic Sitting Balance
(range 0-10)
10 9-10 6-10
Coordination
(range 0-6)
6 5-6 4-6
Total TIS
(range 0-23)
23 22-23 17-23
Test-retest Reliability Sub-Acute Stroke:
(Verheyden & Nieuwboer, 2004; n = 28, median age = 63 years, median days since stroke = 61 days, majority of patients had moderate ADL function and limited motor recovery)
• Excellent reliability for clinical care and research in the static sitting balance subscale, 0.91 (0.83)
• Excellent reliability for clinical care and research in the dynamic sitting balance subscale, 0.94 (0.89)
• Good reliability for research in the coordination subscale, 0.87 (0.76)
• Overall, excellent reliability for clinical care and research in the TIS, 0.96 (0.93)
Sub-acute to chronic Stroke:
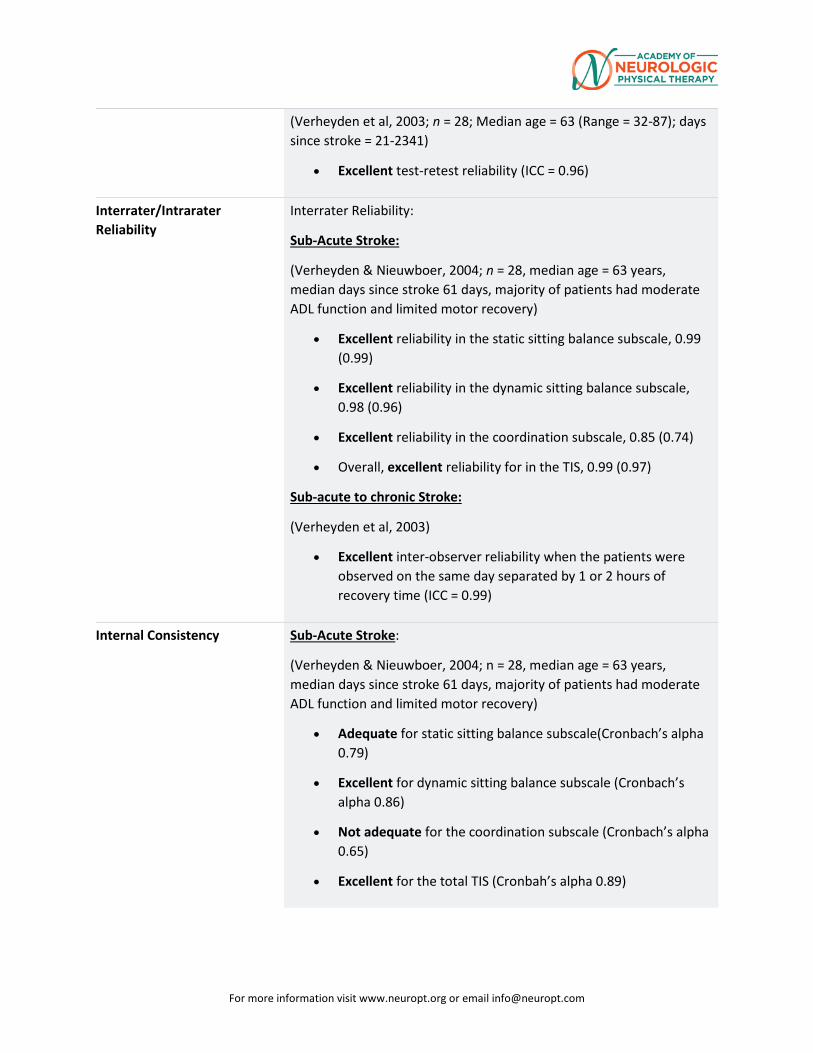
For more information visit www.neuropt.org or email [email protected]
(Verheyden et al, 2003; n = 28; Median age = 63 (Range = 32-87); days since stroke = 21-2341)
• Excellent test-retest reliability (ICC = 0.96)
Interrater/Intrarater Reliability
Interrater Reliability:
Sub-Acute Stroke:
(Verheyden & Nieuwboer, 2004; n = 28, median age = 63 years, median days since stroke 61 days, majority of patients had moderate ADL function and limited motor recovery)
• Excellent reliability in the static sitting balance subscale, 0.99 (0.99)
• Excellent reliability in the dynamic sitting balance subscale, 0.98 (0.96)
• Excellent reliability in the coordination subscale, 0.85 (0.74)
• Overall, excellent reliability for in the TIS, 0.99 (0.97)
Sub-acute to chronic Stroke:
(Verheyden et al, 2003)
• Excellent inter-observer reliability when the patients were observed on the same day separated by 1 or 2 hours of recovery time (ICC = 0.99)
Internal Consistency Sub-Acute Stroke:
(Verheyden & Nieuwboer, 2004; n = 28, median age = 63 years, median days since stroke 61 days, majority of patients had moderate ADL function and limited motor recovery)
• Adequate for static sitting balance subscale(Cronbach’s alpha 0.79)
• Excellent for dynamic sitting balance subscale (Cronbach’s alpha 0.86)
• Not adequate for the coordination subscale (Cronbach’s alpha 0.65)
• Excellent for the total TIS (Cronbah’s alpha 0.89)
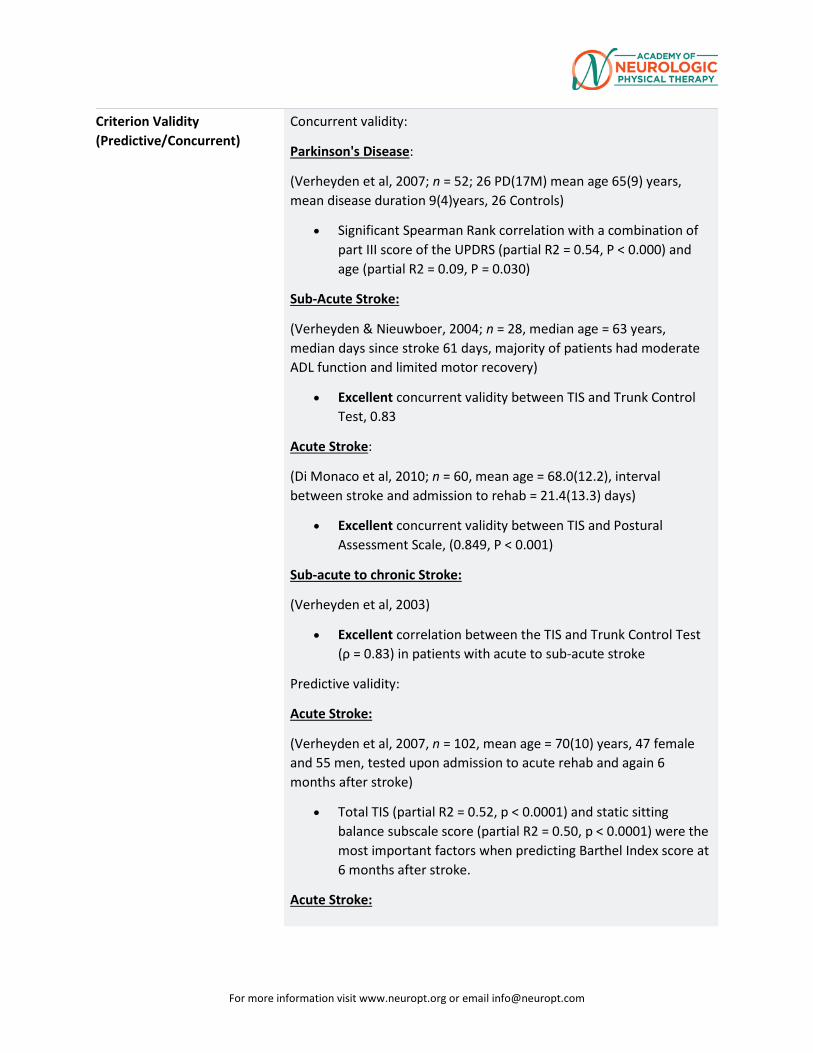
For more information visit www.neuropt.org or email [email protected]
Criterion Validity (Predictive/Concurrent)
Concurrent validity:
Parkinson's Disease:
(Verheyden et al, 2007; n = 52; 26 PD(17M) mean age 65(9) years, mean disease duration 9(4)years, 26 Controls)
• Significant Spearman Rank correlation with a combination of part III score of the UPDRS (partial R2 = 0.54, P < 0.000) and age (partial R2 = 0.09, P = 0.030)
Sub-Acute Stroke:
(Verheyden & Nieuwboer, 2004; n = 28, median age = 63 years, median days since stroke 61 days, majority of patients had moderate ADL function and limited motor recovery)
• Excellent concurrent validity between TIS and Trunk Control Test, 0.83
Acute Stroke:
(Di Monaco et al, 2010; n = 60, mean age = 68.0(12.2), interval between stroke and admission to rehab = 21.4(13.3) days)
• Excellent concurrent validity between TIS and Postural Assessment Scale, (0.849, P < 0.001)
Sub-acute to chronic Stroke:
(Verheyden et al, 2003)
• Excellent correlation between the TIS and Trunk Control Test (ρ = 0.83) in patients with acute to sub-acute stroke
Predictive validity:
Acute Stroke:
(Verheyden et al, 2007, n = 102, mean age = 70(10) years, 47 female and 55 men, tested upon admission to acute rehab and again 6 months after stroke)
• Total TIS (partial R2 = 0.52, p < 0.0001) and static sitting balance subscale score (partial R2 = 0.50, p < 0.0001) were the most important factors when predicting Barthel Index score at 6 months after stroke.
Acute Stroke:
For more information visit www.neuropt.org or email [email protected]
(Di Monaco et al, 2010; n = 60, mean age = 68.0(12.2), interval between stroke and admission to rehab = 21.4(13.3) days)
• Excellent validity between TIS at admission and FIM scores at discharge (0.695, P < 0.001)
• TIS scores assessed at admission to rehabilitation were significantly lower in the patients who were transferred to an institution than those discharged home at the end of inpatient rehabilitation (P = 0.002)
• Odds ratio analysis of TIS and discharge destination (0.620, 95% CI 0.393 to 0.979, P = 0.040)
Sub-acute to Chronic Stroke
(Kim et al, 2015) n = 135, mean age = 62.14 (12.9), tested at 4 weeks post stroke and again at 6 months after stroke.
• Initial total TIS scores (and subscales including Sitting, Dynamic TIS) in non-ambulatory patients were positively correlated with all sub-items in the Korean version of Modified Barthel Index (K-MBI) at 4 weeks after stroke (p<0.05). Particularly the TIS – Dynamic subscale was shown to be the only significant factor for K-MBI 6 months after stroke (R2 = 0.653, p < 0.001)
• Initial total TIS scores (and subscales including Sitting, Dynamic TIS) in non-ambulatory patients were significantly correlated with Functional Ambulation Categories at 4 weeks and 6 months after stroke
Construct Validity (Convergent/Discriminant)
Convergent:
Parkinson's Disease:
(Verheyden et al 2007)
• The authors state that results of the study demonstrate Construct validity of the TIS in people with PD because they had significantly lower scores than controls on the total TIS and static sitting balance and coordination subscale of the TIS. Scores on the dynamic sitting balance subscale were lower for people with PD but were not significant.
Sub-Acute Stroke:
For more information visit www.neuropt.org or email [email protected]
(Verheyden & Nieuwboer, 2004; n = 28, median age = 63 years, median days since stroke 61 days, majority of patients had moderate ADL function and limited motor recovery)
• Adequate construct validity between the TIS and Barthel Index, 0.86
Sub-acute to chronic stroke:
(Verheyden et al, 2003)
• Excellent spearman rank correlation between the TIS and the Barthel Index (ρ = 0.86)
Acute to Sub-acute Stroke:
(Verheyden & Kersten, 2010; n = 162; Mean age = 67(11) years; all stages of stroke)
• Construct validity of dynamic sitting balance and coordination subscale confirmed using Rasch analysis. (chi-square = 42.65;p-value = 0.0052 for dynamic sitting balance, chi-square = 7.87, p-value = 0.446 for coordination subscale)
Discriminant:
Stroke:
(Verheyden et al 2005, 40 stroke patients and 40 age and sex-matched healthy individuals, mean age = 65)
• Significant differences between stroke patients and healthy individuals (P < 0.0001)
Content Validity Sub-Acute Stroke:
(Verheyden & Nieuwboer, 2004; n = 28, median age = 63 years, median days since stroke 61 days, majority of patients had moderate ADL function and limited motor recovery)
• Content validity of the TIS was achieved through literature review, observation of stroke patients, clinical experience of the authors and discussing the content of the scale with stroke rehabilitation specialists.
Face Validity Not Established
Floor/Ceiling Effects Chronic stroke:
For more information visit www.neuropt.org or email [email protected]
(Verheyden et al, 2006, n = 51 (16 females, 35 males), mean age = 65 (11) years (range 39-84), median days post stroke = 129, 29 patients walked without assistance, 22 patients could not walk without assistance or were non-ambulatory)
• No patient was able to score the maximum of 23 points on the TIS as opposed to 12 (24%) participants reached the maximum score of 100 points on the Trunk Control Test.
Acute to Sub-acute Stroke:
(Verheyden & Kersten, 2010; n = 162 from acute unit, in-patient and out-patient rehabilitation setting ; Mean age = 67(11) years; days since stroke = 6-94 days)
• Poor ceiling effects (90%)(ceiling effect for static sitting balance subscale was large and hence, it was excluded from the TIS version 2.0)
Parkinson’s Disease:
(Verheyden et al 2007)
• Poor ceiling effects: 73% reached max score on static sitting balance subscale; 38% reached max score on dynamic sitting balance subscale; (8%) reached max score on coordination subscale; and (4%) reached max score of total TIS
Responsiveness Not Established
Professional Association Recommendations
Recommendations for use of the instrument from the Academy of Neurologic Physical Therapy of the American Physical Therapy Association’s Multiple Sclerosis Taskforce (MSEDGE), Parkinson’s Taskforce (PD EDGE), Spinal Cord Injury Taskforce (PD EDGE), Stroke Taskforce (StrokEDGE II), Traumatic Brain Injury Taskforce (TBI EDGE), and Vestibular Taskforce (VEDGE) are listed below. These recommendations were developed by a panel of research and clinical experts using a modified Delphi process.
For detailed information about how recommendations were made, please visit: http://www.neuropt.org/go/healthcare-professionals/neurology-section-outcome-measures-recommendations
For more information visit www.neuropt.org or email [email protected]
Abbreviations:
HR Highly Recommend
R Recommend
LS / UR Reasonable to use, but limited study in target group / Unable to Recommend
NR Not Recommended
Recommendations for use based on acuity level of the patient:
Acute
(CVA < 2 months post)
(SCI < 1 month post)
(Vestibular < 6 weeks post)
Subacute
(CVA 2 to 6 months)
(SCI 3 to 6 months)
Chronic
(> 6 months)
StrokEDGE II
R R R
Recommendations Based on Parkinson Disease Hoehn and Yahr stage:
I II III IV V
PD EDGE
LS/UR LS/UR LS/UR LS/UR NR
Recommendations based on level of care in which the assessment is taken:
Acute Care
Inpatient Rehabilitation
Skilled Nursing Facility
Outpatient
Rehabilitation
Home Health
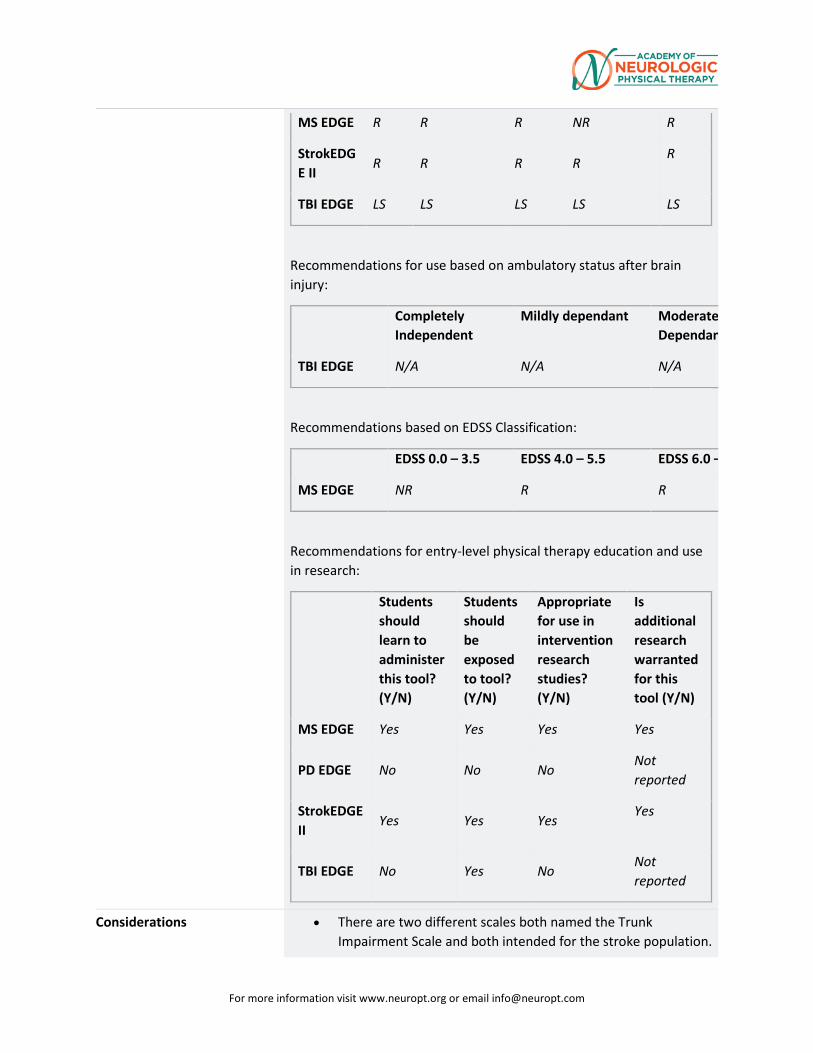
For more information visit www.neuropt.org or email [email protected]
MS EDGE R R R NR R
StrokEDGE II
R R R R R
TBI EDGE LS LS LS LS LS
Recommendations for use based on ambulatory status after brain injury:
Completely Independent
Mildly dependant Moderate Dependan
TBI EDGE N/A N/A N/A
Recommendations based on EDSS Classification:
EDSS 0.0 – 3.5 EDSS 4.0 – 5.5 EDSS 6.0 –
MS EDGE NR R R
Recommendations for entry-level physical therapy education and use in research:
Students should learn to administer this tool? (Y/N)
Students should be exposed to tool? (Y/N)
Appropriate for use in intervention research studies? (Y/N)
Is additional research warranted for this tool (Y/N)
MS EDGE Yes Yes Yes Yes
PD EDGE No No No Not reported
StrokEDGE II
Yes Yes Yes Yes
TBI EDGE No Yes No Not reported
Considerations • There are two different scales both named the Trunk Impairment Scale and both intended for the stroke population.
For more information visit www.neuropt.org or email [email protected]
One scale was originally published in 2004 by Verheyden et al and is the focus of this review. The other scale was published by Fujiwara in 2004 and is not the focus of this review.
• The patient will need to be permitted to sit-up for the test and be able to follow basic commands.
• The TIS has sufficient reliability, internal consistency and validity for use in clinical practice and stroke research (Verheyden et al, 2004).
• Younger individuals, females and individuals who are more active in their daily life are found to score higher on TIS. Older individuals, males and less physically active individuals score lower on TIS. (Verheyden et al, 2005)
• TIS 2.0 consists of dynamic balance subscale and coordination subscale. The sitting balance subscale was not included due to ceiling effects. (Verheyden and Kersten, 2010)
• TIS-modNV is the Norwegian version with modifications of combining items from the dynamic sitting balance and coordination subscales. Six ordinal superitems (called testlets) were constructed. It demonstrated good construct validity, excellent internal consistency, and high intertester and test-retest reliability for the total score. ( Gjelsvik et al, 2012)
• The TIS has been found to have large ceiling effects in two out of the three subscales of the test in this population. Further research is needed regarding: reliability, measurement error, predictive validity, and responsiveness before this measure can be recommended for clinical or use in research.
Do you see an error or have a suggestion for this instrument summary? Please e-mail us!
Bibliography Di Monaco, M., Trucco, M., et al. (2010). "The relationship between initial trunk control or postural balance and inpatient rehabilitation outcome after stroke: a prospective comparative study." Clinical Rehabilitation 24(6): 543-554. Find it on PubMed
Fujiwara, T., Liu, M., et al. (2004). "Development of a new measure to assess trunk impairment after stroke (trunk impairment scale): its psychometric properties." American Journal of Physical Medicine and Rehabilitation 83(9): 681-688. Find it on PubMed

For more information visit www.neuropt.org or email [email protected]
Gjelsvik, B., Breivik, K., et al. (2012). “The Trunk Impairment Scale – modified to ordinal scale in the Norwegian version.” Disability & Rehabilitation 34(16): 1385-1395. Find it on PubMed
Kim J., Seo K., et al. 2015. “The Relationship Between Initial Trunk Performances and Functional Prognosis in Patients With Stroke.” Annals of Rehabilitation Medicine 39(1):66-73. Find it on PubMed
Verheyden, G. and Kersten, P. (2008). "Evaluating the construct validity of the Trunk Impairment Scale: a Rasch analysis of its subscales... Proceedings of SRR: abstracts from the Society for Research in Rehabilitation summer meeting held at Weetwood Hall, Leeds, 3 and 4 July 2007." Clinical Rehabilitation 22(7): 664-664. Find it on PubMed
Verheyden, G. and Kersten, P. (2010). "Investigating the internal validity of the Trunk Impairment Scale (TIS) using Rasch analysis: the TIS 2.0." Disability and Rehabilitation 32(25): 2127-2137. Find it on PubMed
Verheyden, G., Nieuwboer, A., et al. (2007). "Trunk performance after stroke: an eye catching predictor of functional outcome." Journal of Neurology, Neurosurgery and Psychiatry 78(7): 694-698. Find it on PubMed
Verheyden, G., Nieuwboer, A., et al. (2005). "Discriminant ability of the Trunk Impairment Scale: a comparison between stroke patients and healthy individuals." Disability and Rehabilitation 27(17): 1023-1028.Find it on PubMed
Verheyden, G., Nieuwboer, A., et al. (2004). "The Trunk Impairment Scale: a new tool to measure motor impairment of the trunk after stroke." Clinical Rehabilitation 18(3): 326-334. Find it on PubMed
Verheyden, G., Vereeck, L., et al. (2006). "Trunk performance after stroke and the relationship with balance, gait and functional ability." Clinical Rehabilitation 20(5): 451-458. Find it on PubMed
Verheyden, G., Willems, A. M., et al. (2007). "Validity of the trunk impairment scale as a measure of trunk performance in people with Parkinson's disease." Archives of Physical Medicine and Rehabilitation 88(10): 1304-1308. Find it on PubMed
Year published
Instrument in PDF Format Yes
For more information visit www.neuropt.org or email [email protected]
35. REHAB MEASURES DATABASE: WOLF MOTOR FUNCTION TEST
Link to instrument WMFT info can be found on Stroke (external link)
Title of Assessment Wolf Motor Function Test
Originally called the Emory Motor Test (Woodbury et al, 2010)
Acronym WMFT
Instrument Reviewer(s) Initially reviewed by Jason Raad MS and the Rehabilitation Measures Team; Updated by Irene Ward, PT, DPT, NCS and the TBI EDGE task force of the Academy of Neurologic Physical Therapy - a component of APTA in 2012.; Updated by Heather Anderson and Rie Yoshida of the StrokEdge II task force in 2016.
Summary Date 3/19/2016
Purpose Quantitative measure of upper extremity motor ability through timed and functional tasks
Description • The original version consisted of 21 item; the widely used version of the WMFT consists of 17 items
• Composed of 3 parts:
o Time
o Functional ability
o Strength
• Includes 15 function-based tasks and 2 strength based tasks
o Performance time is referred to as WMFT-TIME
o Functional ability is referred to as WMFT-FAS
• Items 1-6 involve timed functional tasks, items 7-14 are measures of strength, and the remaining 9 items consist of analyzing movement quality when completing various tasks
• Examiner should test the less affected upper extremity followed by the most affected side.
• Uses a 6-point ordinal scale
o "0" = “does not attempt with the involved arm” to
For more information visit www.neuropt.org or email [email protected]
o "5" = “arm does participate; movement appears to be normal.”
• Maximum score is 75
• Lower scores are indicative of lower functioning levels
• WMFT-TIME allows 120 seconds per task
Area of Assessment Dexterity; Strength; Upper Extremity Function
Body Part Upper Extremity
ICF Domain Activity
Domain Motor
Assessment Type Performance Measure
Length of Test 06 to 30 Minutes
Time to Administer 35 minutes
Number of Items The original version consisted of 21 items (Wolf et al., 2005)
Equipment Required • Standardized table (54 inches long, 30 inches wide, and 29 inches high) and chair
• Standardized test item template
• Height-adjustable bedside table
• Box (one that does not require patient to flex or abduct shoulder more than 90 degrees)
• Individual wrist weights, 1-20 pounds
• 12-oz beverage can, unopened
• 7” pencil with 6 flat sides
• 2” paper clip
• 3 checkers
• Three 3” x5” note cards
• Standardized lock and key board at 45 degree angle
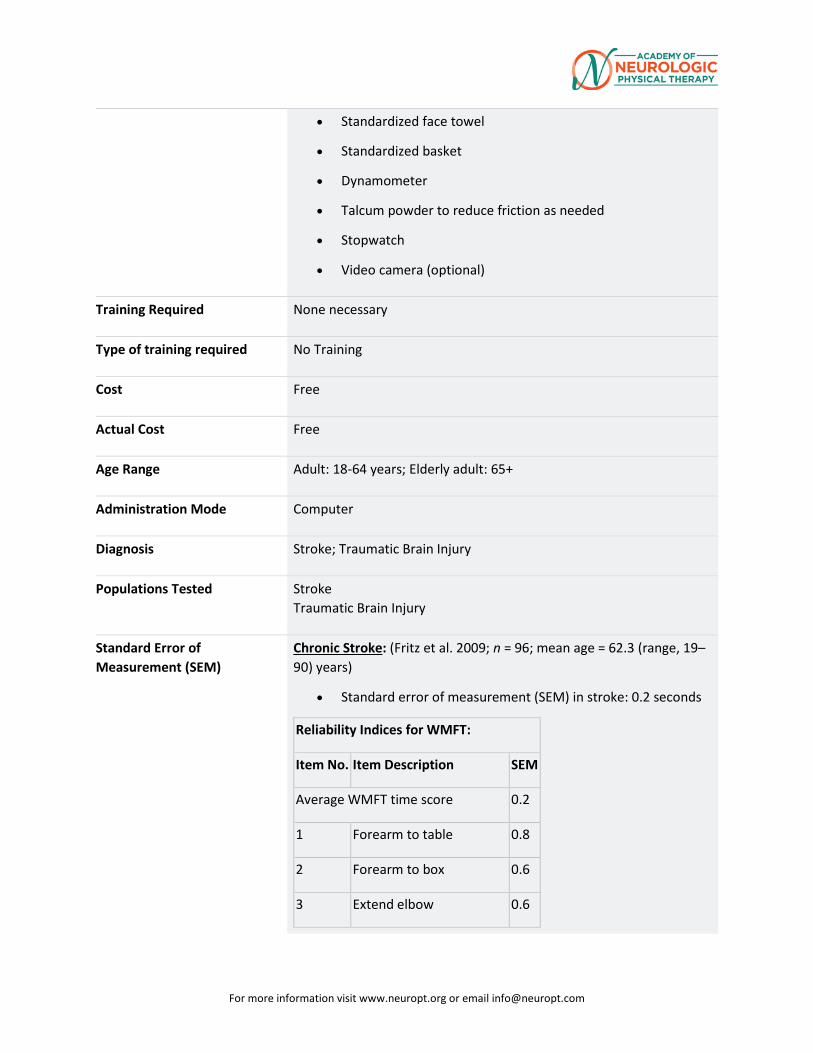
For more information visit www.neuropt.org or email [email protected]
• Standardized face towel
• Standardized basket
• Dynamometer
• Talcum powder to reduce friction as needed
• Stopwatch
• Video camera (optional)
Training Required None necessary
Type of training required No Training
Cost Free
Actual Cost Free
Age Range Adult: 18-64 years; Elderly adult: 65+
Administration Mode Computer
Diagnosis Stroke; Traumatic Brain Injury
Populations Tested Stroke Traumatic Brain Injury
Standard Error of Measurement (SEM)
Chronic Stroke: (Fritz et al. 2009; n = 96; mean age = 62.3 (range, 19–90) years)
• Standard error of measurement (SEM) in stroke: 0.2 seconds
Reliability Indices for WMFT:
Item No. Item Description SEM
Average WMFT time score 0.2
1 Forearm to table 0.8
2 Forearm to box 0.6
3 Extend elbow 0.6
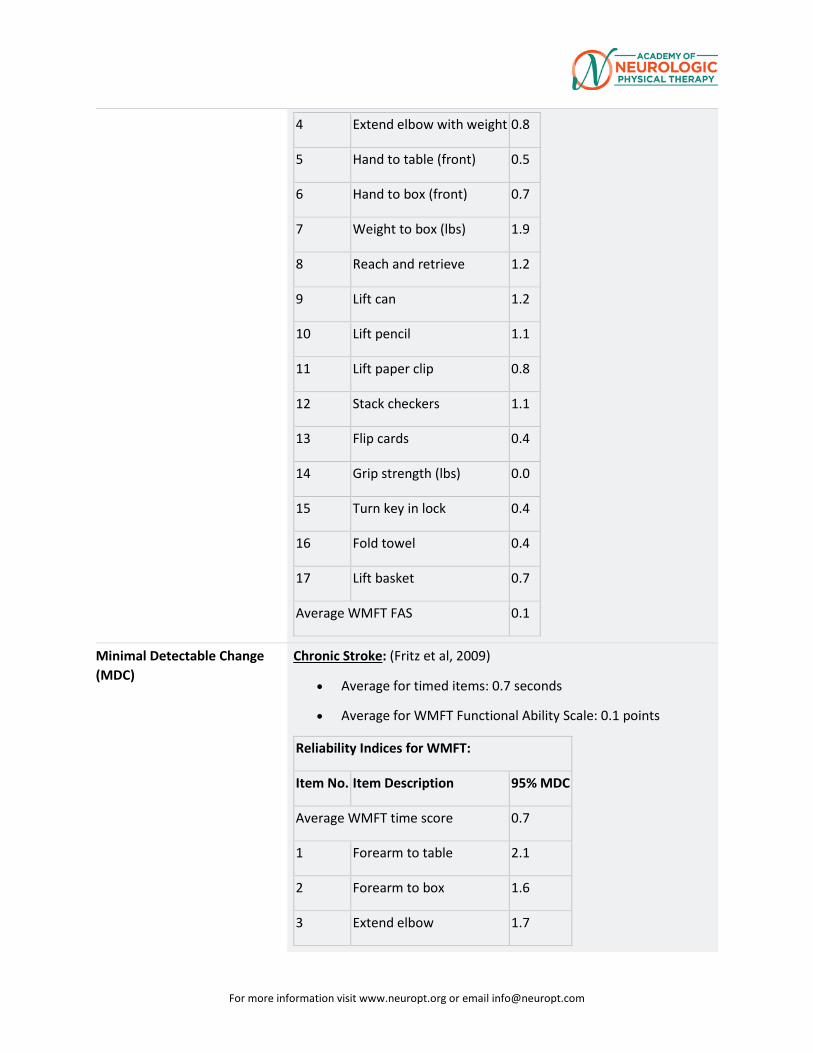
For more information visit www.neuropt.org or email [email protected]
4 Extend elbow with weight 0.8
5 Hand to table (front) 0.5
6 Hand to box (front) 0.7
7 Weight to box (lbs) 1.9
8 Reach and retrieve 1.2
9 Lift can 1.2
10 Lift pencil 1.1
11 Lift paper clip 0.8
12 Stack checkers 1.1
13 Flip cards 0.4
14 Grip strength (lbs) 0.0
15 Turn key in lock 0.4
16 Fold towel 0.4
17 Lift basket 0.7
Average WMFT FAS 0.1
Minimal Detectable Change (MDC)
Chronic Stroke: (Fritz et al, 2009)
• Average for timed items: 0.7 seconds
• Average for WMFT Functional Ability Scale: 0.1 points
Reliability Indices for WMFT:
Item No. Item Description 95% MDC
Average WMFT time score 0.7
1 Forearm to table 2.1
2 Forearm to box 1.6
3 Extend elbow 1.7
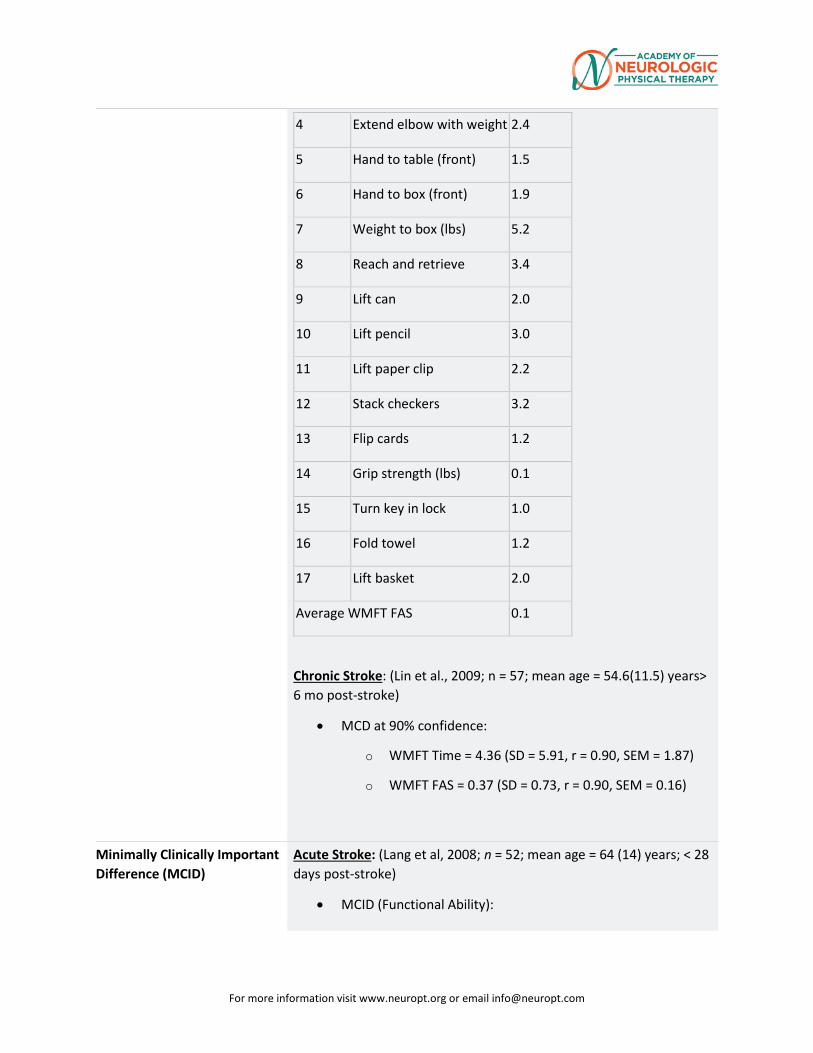
For more information visit www.neuropt.org or email [email protected]
4 Extend elbow with weight 2.4
5 Hand to table (front) 1.5
6 Hand to box (front) 1.9
7 Weight to box (lbs) 5.2
8 Reach and retrieve 3.4
9 Lift can 2.0
10 Lift pencil 3.0
11 Lift paper clip 2.2
12 Stack checkers 3.2
13 Flip cards 1.2
14 Grip strength (lbs) 0.1
15 Turn key in lock 1.0
16 Fold towel 1.2
17 Lift basket 2.0
Average WMFT FAS 0.1
Chronic Stroke: (Lin et al., 2009; n = 57; mean age = 54.6(11.5) years> 6 mo post-stroke)
• MCD at 90% confidence:
o WMFT Time = 4.36 (SD = 5.91, r = 0.90, SEM = 1.87)
o WMFT FAS = 0.37 (SD = 0.73, r = 0.90, SEM = 0.16)
Minimally Clinically Important Difference (MCID)
Acute Stroke: (Lang et al, 2008; n = 52; mean age = 64 (14) years; < 28 days post-stroke)
• MCID (Functional Ability):
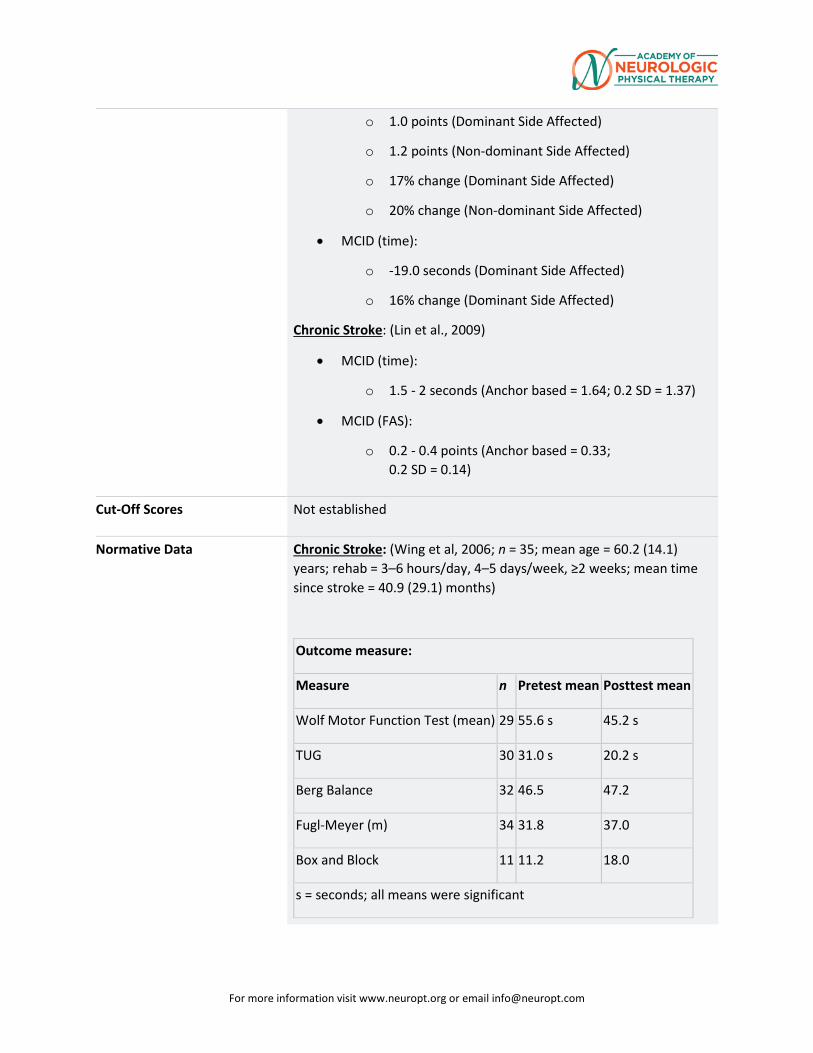
For more information visit www.neuropt.org or email [email protected]
o 1.0 points (Dominant Side Affected)
o 1.2 points (Non-dominant Side Affected)
o 17% change (Dominant Side Affected)
o 20% change (Non-dominant Side Affected)
• MCID (time):
o -19.0 seconds (Dominant Side Affected)
o 16% change (Dominant Side Affected)
Chronic Stroke: (Lin et al., 2009)
• MCID (time):
o 1.5 - 2 seconds (Anchor based = 1.64; 0.2 SD = 1.37)
• MCID (FAS):
o 0.2 - 0.4 points (Anchor based = 0.33; 0.2 SD = 0.14)
Cut-Off Scores Not established
Normative Data Chronic Stroke: (Wing et al, 2006; n = 35; mean age = 60.2 (14.1) years; rehab = 3–6 hours/day, 4–5 days/week, ≥2 weeks; mean time since stroke = 40.9 (29.1) months)
Outcome measure:
Measure n Pretest mean Posttest mean
Wolf Motor Function Test (mean) 29 55.6 s 45.2 s
TUG 30 31.0 s 20.2 s
Berg Balance 32 46.5 47.2
Fugl-Meyer (m) 34 31.8 37.0
Box and Block 11 11.2 18.0
s = seconds; all means were significant
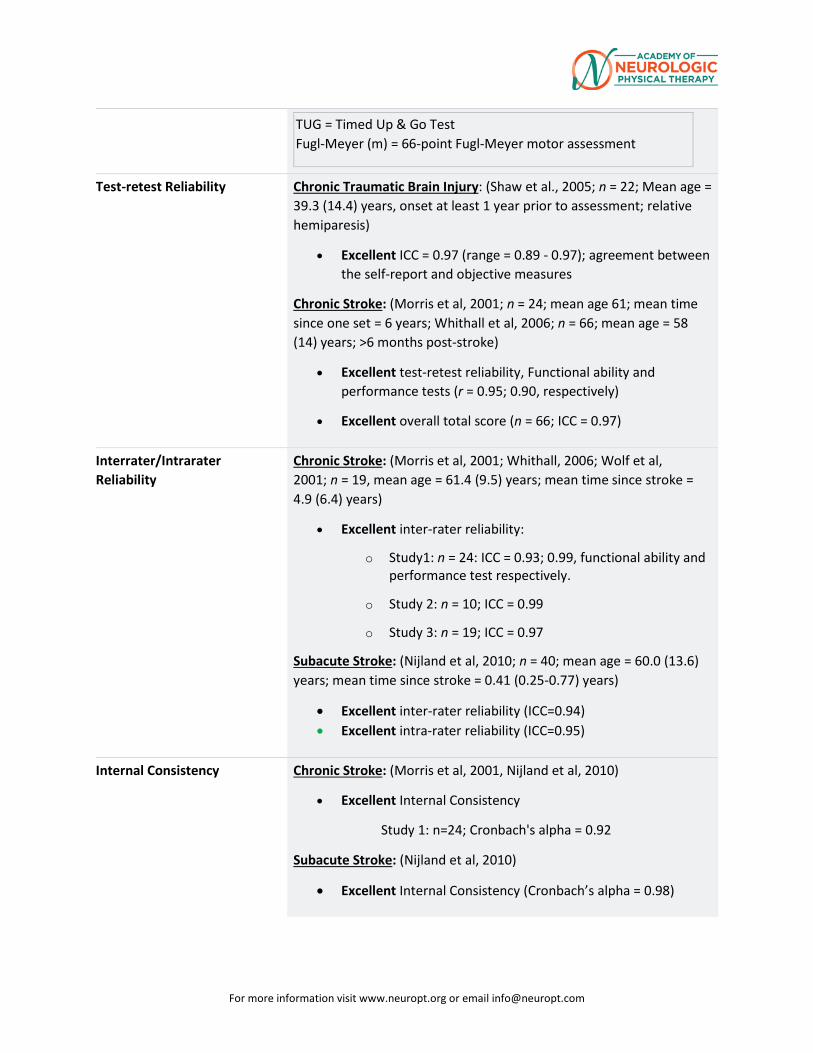
For more information visit www.neuropt.org or email [email protected]
TUG = Timed Up & Go Test Fugl-Meyer (m) = 66-point Fugl-Meyer motor assessment
Test-retest Reliability Chronic Traumatic Brain Injury: (Shaw et al., 2005; n = 22; Mean age = 39.3 (14.4) years, onset at least 1 year prior to assessment; relative hemiparesis)
• Excellent ICC = 0.97 (range = 0.89 - 0.97); agreement between the self-report and objective measures
Chronic Stroke: (Morris et al, 2001; n = 24; mean age 61; mean time since one set = 6 years; Whithall et al, 2006; n = 66; mean age = 58 (14) years; >6 months post-stroke)
• Excellent test-retest reliability, Functional ability and performance tests (r = 0.95; 0.90, respectively)
• Excellent overall total score (n = 66; ICC = 0.97)
Interrater/Intrarater Reliability
Chronic Stroke: (Morris et al, 2001; Whithall, 2006; Wolf et al, 2001; n = 19, mean age = 61.4 (9.5) years; mean time since stroke = 4.9 (6.4) years)
• Excellent inter-rater reliability:
o Study1: n = 24: ICC = 0.93; 0.99, functional ability and performance test respectively.
o Study 2: n = 10; ICC = 0.99
o Study 3: n = 19; ICC = 0.97
Subacute Stroke: (Nijland et al, 2010; n = 40; mean age = 60.0 (13.6) years; mean time since stroke = 0.41 (0.25-0.77) years)
• Excellent inter-rater reliability (ICC=0.94) • Excellent intra-rater reliability (ICC=0.95)
Internal Consistency Chronic Stroke: (Morris et al, 2001, Nijland et al, 2010)
• Excellent Internal Consistency
Study 1: n=24; Cronbach's alpha = 0.92
Subacute Stroke: (Nijland et al, 2010)
• Excellent Internal Consistency (Cronbach’s alpha = 0.98)
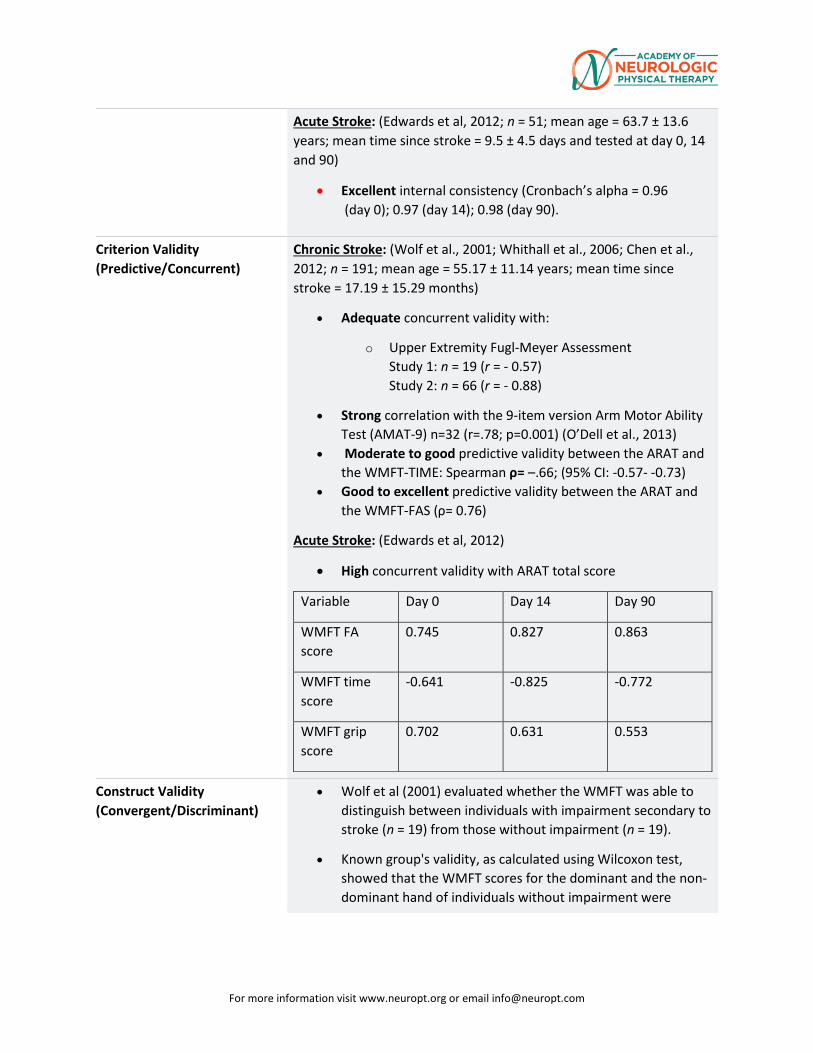
For more information visit www.neuropt.org or email [email protected]
Acute Stroke: (Edwards et al, 2012; n = 51; mean age = 63.7 ± 13.6 years; mean time since stroke = 9.5 ± 4.5 days and tested at day 0, 14 and 90)
• Excellent internal consistency (Cronbach’s alpha = 0.96 (day 0); 0.97 (day 14); 0.98 (day 90).
Criterion Validity (Predictive/Concurrent)
Chronic Stroke: (Wolf et al., 2001; Whithall et al., 2006; Chen et al., 2012; n = 191; mean age = 55.17 ± 11.14 years; mean time since stroke = 17.19 ± 15.29 months)
• Adequate concurrent validity with:
o Upper Extremity Fugl-Meyer Assessment Study 1: n = 19 (r = - 0.57) Study 2: n = 66 (r = - 0.88)
• Strong correlation with the 9-item version Arm Motor Ability Test (AMAT-9) n=32 (r=.78; p=0.001) (O’Dell et al., 2013)
• Moderate to good predictive validity between the ARAT and the WMFT-TIME: Spearman ρ= –.66; (95% CI: -0.57- -0.73)
• Good to excellent predictive validity between the ARAT and the WMFT-FAS (ρ= 0.76)
Acute Stroke: (Edwards et al, 2012)
• High concurrent validity with ARAT total score
Variable Day 0 Day 14 Day 90
WMFT FA score
0.745 0.827 0.863
WMFT time score
-0.641 -0.825 -0.772
WMFT grip score
0.702 0.631 0.553
Construct Validity (Convergent/Discriminant)
• Wolf et al (2001) evaluated whether the WMFT was able to distinguish between individuals with impairment secondary to stroke (n = 19) from those without impairment (n = 19).
• Known group's validity, as calculated using Wilcoxon test, showed that the WMFT scores for the dominant and the non-dominant hand of individuals without impairment were
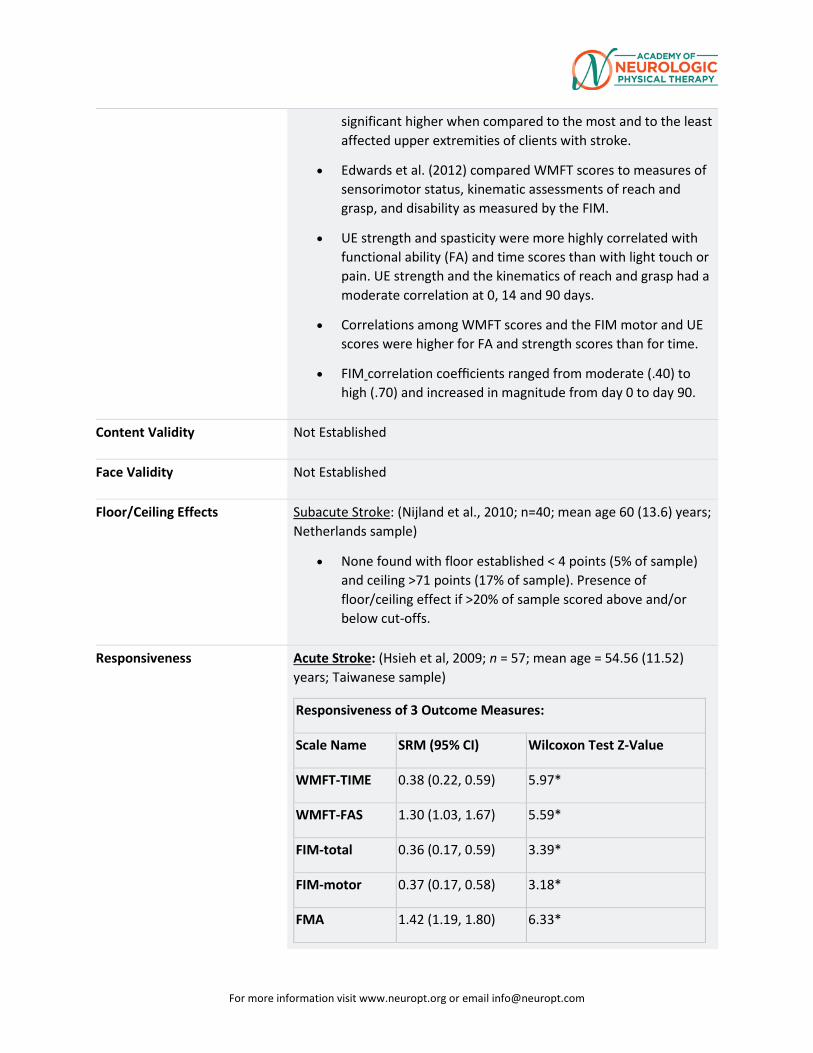
For more information visit www.neuropt.org or email [email protected]
significant higher when compared to the most and to the least affected upper extremities of clients with stroke.
• Edwards et al. (2012) compared WMFT scores to measures of sensorimotor status, kinematic assessments of reach and grasp, and disability as measured by the FIM.
• UE strength and spasticity were more highly correlated with functional ability (FA) and time scores than with light touch or pain. UE strength and the kinematics of reach and grasp had a moderate correlation at 0, 14 and 90 days.
• Correlations among WMFT scores and the FIM motor and UE scores were higher for FA and strength scores than for time.
• FIM correlation coefficients ranged from moderate (.40) to high (.70) and increased in magnitude from day 0 to day 90.
Content Validity Not Established
Face Validity Not Established
Floor/Ceiling Effects Subacute Stroke: (Nijland et al., 2010; n=40; mean age 60 (13.6) years; Netherlands sample)
• None found with floor established < 4 points (5% of sample) and ceiling >71 points (17% of sample). Presence of floor/ceiling effect if >20% of sample scored above and/or below cut-offs.
Responsiveness Acute Stroke: (Hsieh et al, 2009; n = 57; mean age = 54.56 (11.52) years; Taiwanese sample)
Responsiveness of 3 Outcome Measures:
Scale Name SRM (95% CI) Wilcoxon Test Z-Value
WMFT-TIME 0.38 (0.22, 0.59) 5.97*
WMFT-FAS 1.30 (1.03, 1.67) 5.59*
FIM-total 0.36 (0.17, 0.59) 3.39*
FIM-motor 0.37 (0.17, 0.58) 3.18*
FMA 1.42 (1.19, 1.80) 6.33*
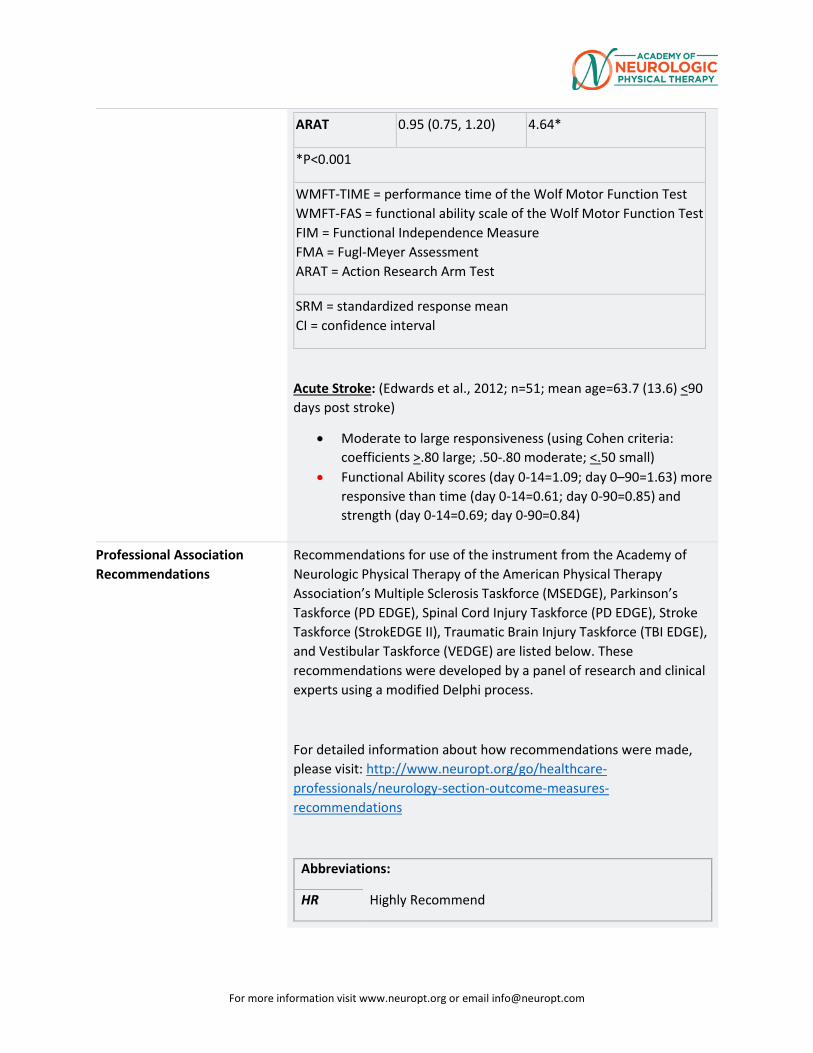
For more information visit www.neuropt.org or email [email protected]
ARAT 0.95 (0.75, 1.20) 4.64*
*P<0.001
WMFT-TIME = performance time of the Wolf Motor Function Test WMFT-FAS = functional ability scale of the Wolf Motor Function Test FIM = Functional Independence Measure FMA = Fugl-Meyer Assessment ARAT = Action Research Arm Test
SRM = standardized response mean CI = confidence interval
Acute Stroke: (Edwards et al., 2012; n=51; mean age=63.7 (13.6) <90 days post stroke)
• Moderate to large responsiveness (using Cohen criteria: coefficients >.80 large; .50-.80 moderate; <.50 small)
• Functional Ability scores (day 0-14=1.09; day 0–90=1.63) more responsive than time (day 0-14=0.61; day 0-90=0.85) and strength (day 0-14=0.69; day 0-90=0.84)
Professional Association Recommendations
Recommendations for use of the instrument from the Academy of Neurologic Physical Therapy of the American Physical Therapy Association’s Multiple Sclerosis Taskforce (MSEDGE), Parkinson’s Taskforce (PD EDGE), Spinal Cord Injury Taskforce (PD EDGE), Stroke Taskforce (StrokEDGE II), Traumatic Brain Injury Taskforce (TBI EDGE), and Vestibular Taskforce (VEDGE) are listed below. These recommendations were developed by a panel of research and clinical experts using a modified Delphi process.
For detailed information about how recommendations were made, please visit: http://www.neuropt.org/go/healthcare-professionals/neurology-section-outcome-measures-recommendations
Abbreviations:
HR Highly Recommend
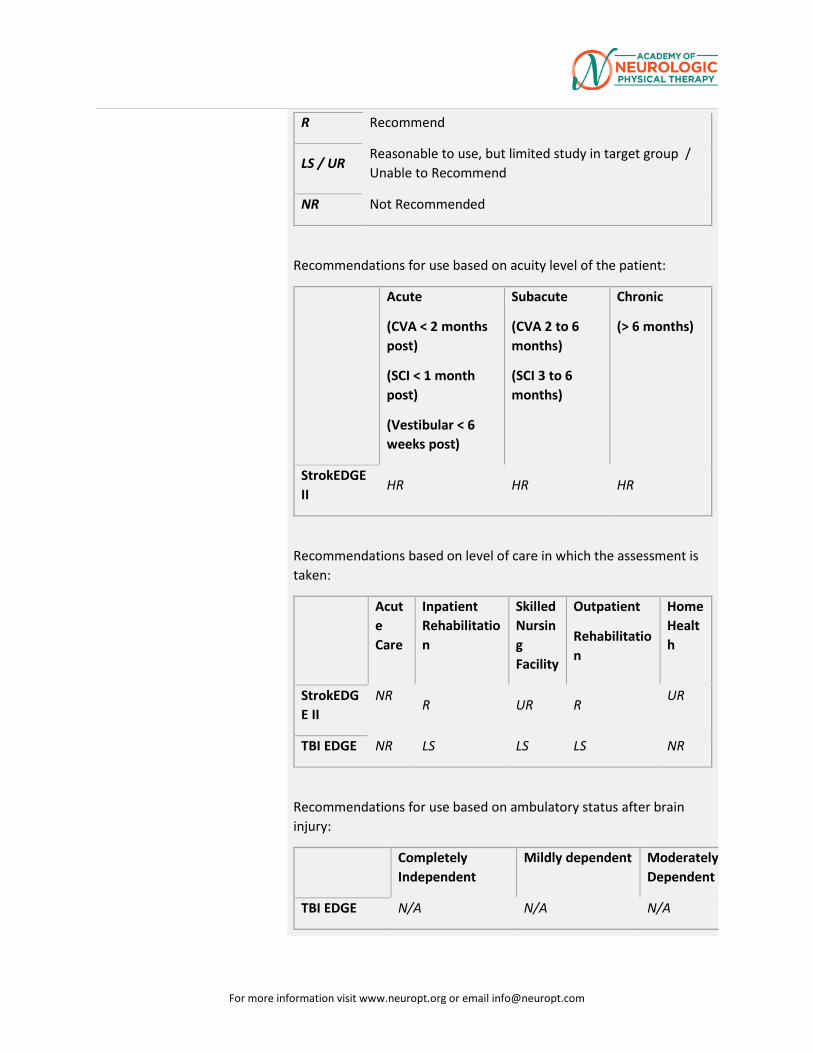
For more information visit www.neuropt.org or email [email protected]
R Recommend
LS / UR Reasonable to use, but limited study in target group / Unable to Recommend
NR Not Recommended
Recommendations for use based on acuity level of the patient:
Acute
(CVA < 2 months post)
(SCI < 1 month post)
(Vestibular < 6 weeks post)
Subacute
(CVA 2 to 6 months)
(SCI 3 to 6 months)
Chronic
(> 6 months)
StrokEDGE II
HR HR HR
Recommendations based on level of care in which the assessment is taken:
Acute Care
Inpatient Rehabilitation
Skilled Nursing Facility
Outpatient
Rehabilitation
Home Health
StrokEDGE II
NR
R UR R UR
TBI EDGE NR LS LS LS NR
Recommendations for use based on ambulatory status after brain injury:
Completely Independent
Mildly dependent Moderately Dependent
TBI EDGE N/A N/A N/A
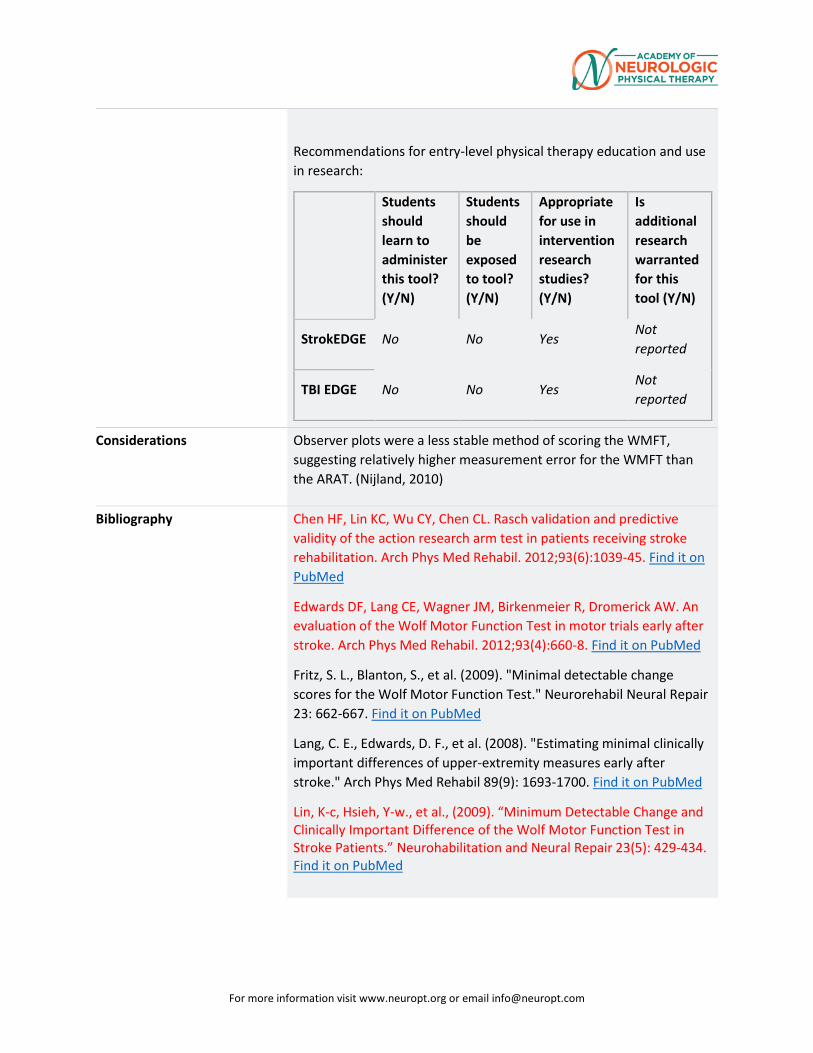
For more information visit www.neuropt.org or email [email protected]
Recommendations for entry-level physical therapy education and use in research:
Students should learn to administer this tool? (Y/N)
Students should be exposed to tool? (Y/N)
Appropriate for use in intervention research studies? (Y/N)
Is additional research warranted for this tool (Y/N)
StrokEDGE No No Yes Not reported
TBI EDGE No No Yes Not reported
Considerations Observer plots were a less stable method of scoring the WMFT, suggesting relatively higher measurement error for the WMFT than the ARAT. (Nijland, 2010)
Bibliography Chen HF, Lin KC, Wu CY, Chen CL. Rasch validation and predictive validity of the action research arm test in patients receiving stroke rehabilitation. Arch Phys Med Rehabil. 2012;93(6):1039-45. Find it on PubMed
Edwards DF, Lang CE, Wagner JM, Birkenmeier R, Dromerick AW. An evaluation of the Wolf Motor Function Test in motor trials early after stroke. Arch Phys Med Rehabil. 2012;93(4):660-8. Find it on PubMed
Fritz, S. L., Blanton, S., et al. (2009). "Minimal detectable change scores for the Wolf Motor Function Test." Neurorehabil Neural Repair 23: 662-667. Find it on PubMed
Lang, C. E., Edwards, D. F., et al. (2008). "Estimating minimal clinically important differences of upper-extremity measures early after stroke." Arch Phys Med Rehabil 89(9): 1693-1700. Find it on PubMed
Lin, K-c, Hsieh, Y-w., et al., (2009). “Minimum Detectable Change and Clinically Important Difference of the Wolf Motor Function Test in Stroke Patients.” Neurohabilitation and Neural Repair 23(5): 429-434. Find it on PubMed
For more information visit www.neuropt.org or email [email protected]
Morris, D. M., Uswatte, G., et al. (2001). "The reliability of the wolf motor function test for assessing upper extremity function after stroke." Arch Phys Med Rehabil 82: 750-755. Find it on PubMed
Nijland, R., van Wegen, E., et al. (2010). "A comparison of two validated tests for upper limb function after stroke: The Wolf Motor Function Test and the Action Research Arm Test." J Rehabil Med 42(7): 694-696.Find it on PubMed
O’Dell, M. W., Grace, K., et al., (2013). “A Psychometric Evaluation of the Arm Motor Ability Test.” J Rehabil Med June; 45(6): 519–527. Find it on PubMed
Shaw, S. E., Morris, D. M., et al. (2005). "Constraint-induced movement therapy for recovery of upper-limb function following traumatic brain injury." J Rehabil Res Dev 42(6): 769-778. Find it on PubMed
Whitall, J., Savin, D. N., Jr., et al. (2006). "Psychometric properties of a modified Wolf Motor Function test for people with mild and moderate upper-extremity hemiparesis." Arch Phys Med Rehabil 87(5): 656-660. Find it on PubMed
Wing, K., Lynskey, J. V., et al. (2008). "Whole-body intensive rehabilitation is feasible and effective in chronic stroke survivors: a retrospective data analysis." Top Stroke Rehabil 15(3): 247-255. Find it on PubMed
Wolf, S. L., Catlin, P. A., et al. (2001). "Assessing Wolf motor function test as outcome measure for research in patients after stroke." Stroke 32: 1635-1639. Find it on PubMed
Woodbury M, Velozo C A., et al., (2010). “Measurement Structure of the Wolf Motor Function Test: Implications for Motor Control Theory.” Neurorehabil Neural Repair;24(9): 791–801. Find it on PubMed
Year published 1989
Instrument in PDF Format No
Approval Status Approved


![[Bank of America] Hybrid ARM MBS - Valuation and Risk Measures](https://img.pdfslide.us/doc/110x75/55205dca4979590a3f8b4684/bank-of-america-hybrid-arm-mbs-valuation-and-risk-measures.jpg)