Embed Size (px)
DESCRIPTION
Citation preview

1Q11 ResultsMay 16, 2011
2
This document contains some statements and information about the Company that reflect the current
views and/or expectations of the Company and its managers with regard to its activities. These
include all statements containing forecasts and projections or that indicate or imply future results,
performance or achievements, which may include such words as "believe", "predict", "expect",
"contemplate", "will probably result", or any other words or expressions of similar meaning. Such
statements are subject to a series of expressive risks, uncertainties and assumptions. Readers are
warned that several important factors may lead actual results to significantly diverge from the plans,
targets, expectations, estimates and intentions expressed herein, there can be no assurance that the
Company will achieve or is likely to achieve the future results or projections contained herein. Under
no circumstances shall the Company or its directors, officers, representatives or employees be liable
to any third parties (including investors) should they make decisions, investments or business acts
based on information and statements presented herein, nor shall the Company be liable for any
indirect damages, loss of profit, or similar consequences thereof. The Company does not intend to
provide any revised versions of the statements or analysis of differences between the statements and
actual results.
THE INITIAL PUBLIC PRIMARY OFFERING OF COMMON SHARES (“SHARES”) OF MAGAZINE
LUIZA S.A. (“COMPANY” AND “OFFERING,” RESPECTIVELY) IS IN PROGRESS. THIS REPORT
SHOULD IN NO WAY BE CONSIDERED A RECOMMENDATION FOR INVESTMENT. BEFORE
INVESTING IN THE SHAES, POTENCIAL INVESTORS SHOULD CARRY OUT THEIR OWN
ANALYSIS AND EVALUATON OF THE COMPANY, ITS BUSINESS AND ITS FINANCIAL
CONDISTIONS AND THE RISKS INVOLVED IN INVESTING IN THE SHARES. INVESTORS
SHOULD READ CAREFULY THE OFFERING PROSPECUTS, ESPECIALLY THE SECTION “RISK
FACTORS.”
Disclamer
3
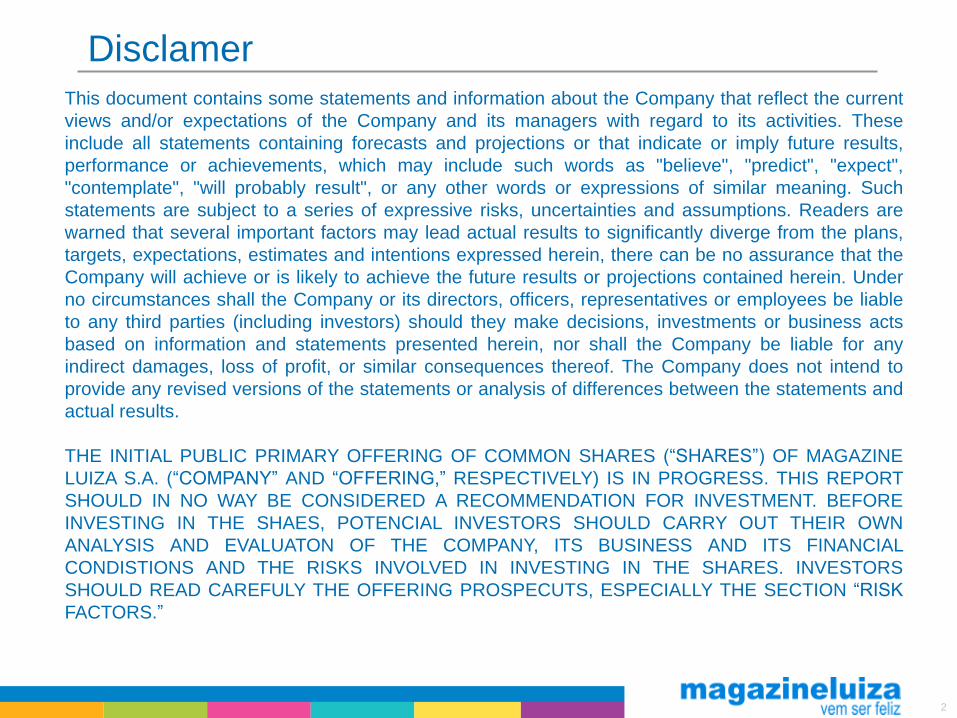
IPO
Shares began trading on the
BM&FBovespa on May 2, 2011
Bovespa “dressed” as a Magazine
Luiza store
Example of the Campaign
Novo Mercado: companies with the
highest standards of corporate governance
Initial price per share: R$16.00
Market value at IPO: R$3.0 bi
Participation of retail investors
Historic Campaign: focus on education,
clarity and transparency
Incentives for employees

4
Our Differentiated Business Model
Strong corporate culture focused on
appreciated people
Broad customer base with customer relationship
management focusing on loyalty and retention
Integrated sales plataform through multiple
channels
Broad, competitive portfolio of
finacial products and services
5
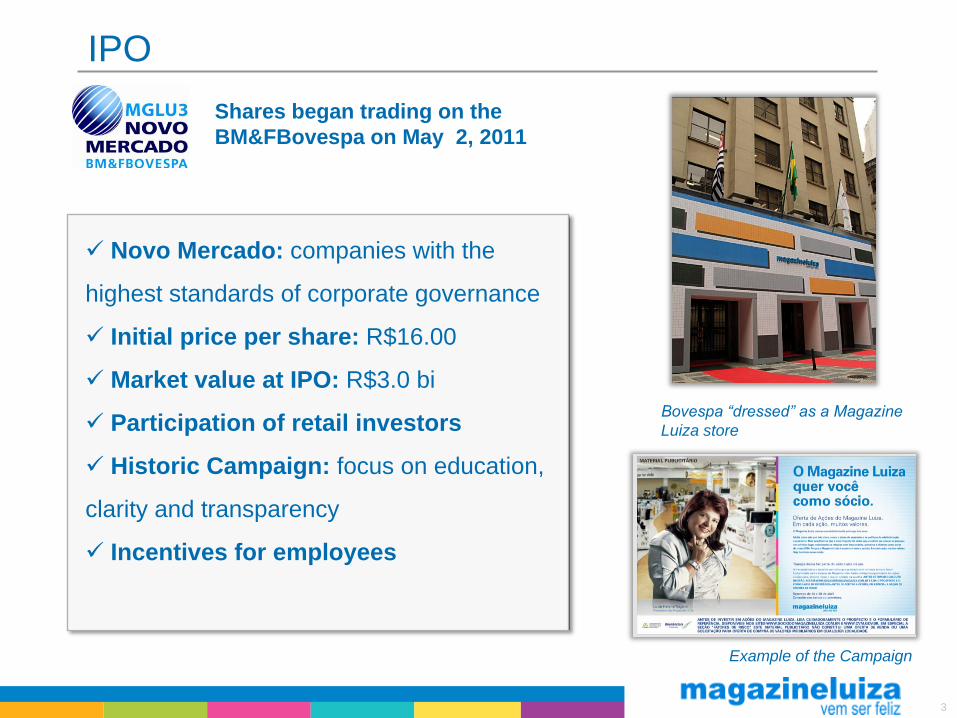
Corporate Structure
1 2
(1) JV with Itaú Unibanco
(2) JV with Cardif
100%50%40.55%100%
9.45%
6
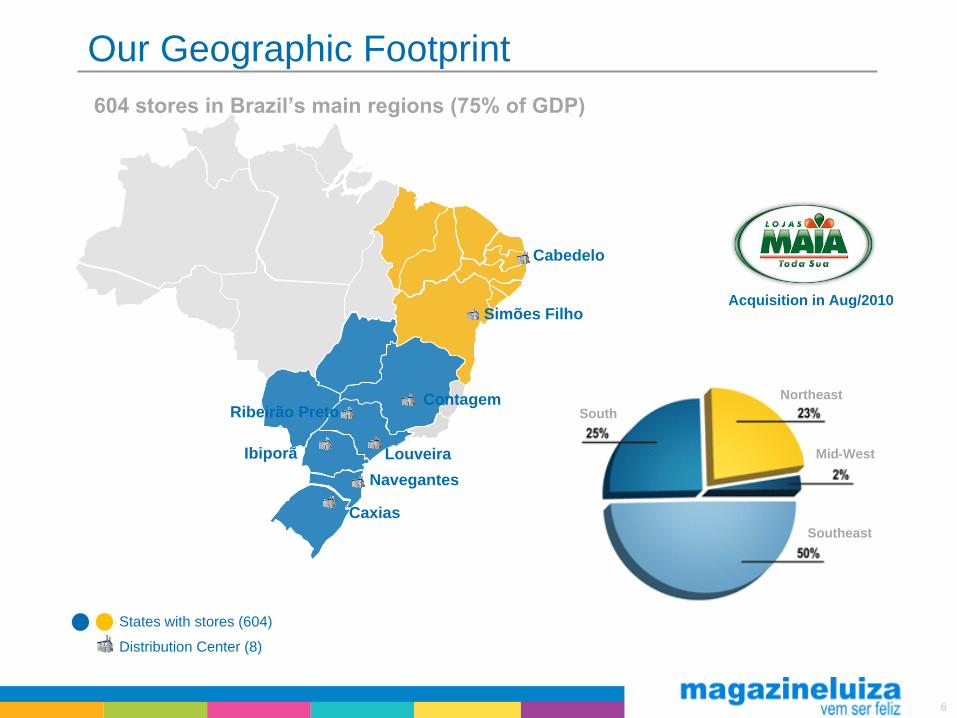
Our Geographic Footprint
Distribution Center (8)
States with stores (604)
Cabedelo
Simões Filho
ContagemRibeirão Preto
LouveiraIbiporã
Navegantes
Caxias
604 stores in Brazil’s main regions (75% of GDP)
Acquisition in Aug/2010
South
Northeast
Mid-West
Southeast

7
History of proven growth with strong organic growth and
successful acquisitions
Continuous growth in adverse economic conditions
0.5 0.6 0.70.9
1.4
1.92.2
2.6
3.2
3.8
5.3
2000 2001 2002 2003 2004 2005 2006 2007 2008 2009 2010
604
96111
127
174
253
351 346
391
455
444
Gross Operating Revenue - Retail (R$ billion) Total Number of Stores
CAGR of Gross Retail Revenue 2000-2010: 25.8%

8
Magazine Luiza Service
SOURCE: Exame Magazine, May 4, 2011
Magazine Luiza
was elected 5th
best service in
an Exame/IBRC
study
(May/2011)
9
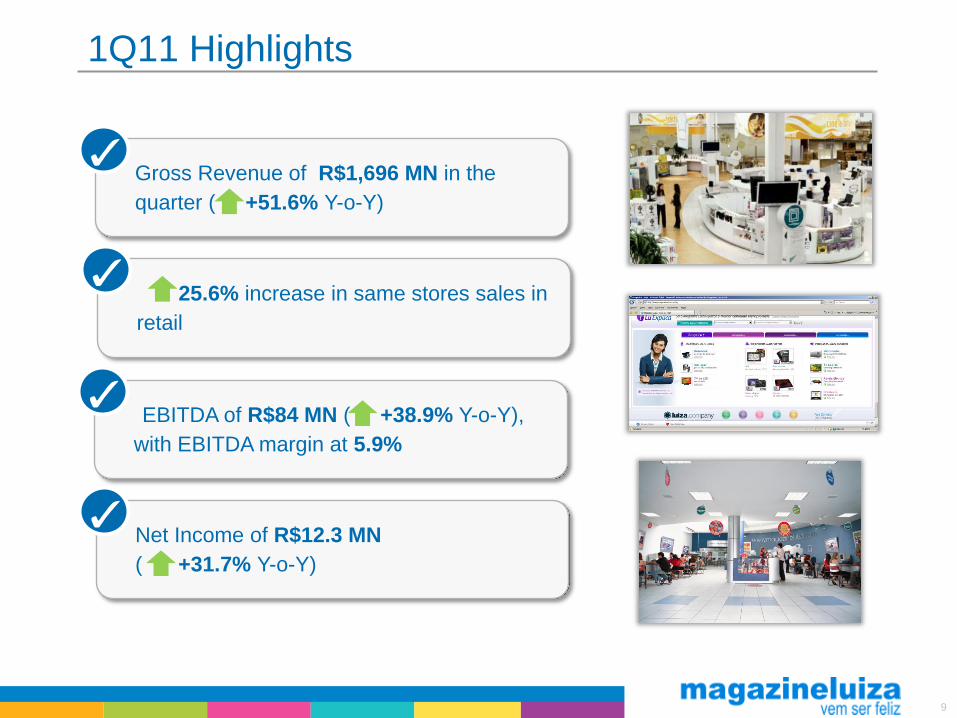
1Q11 Highlights
Gross Revenue of R$1,696 MN in the
quarter ( +51.6% Y-o-Y)
25.6% increase in same stores sales in
retail
EBITDA of R$84 MN ( +38.9% Y-o-Y),
with EBITDA margin at 5.9%
Net Income of R$12.3 MN
( +31.7% Y-o-Y)
10
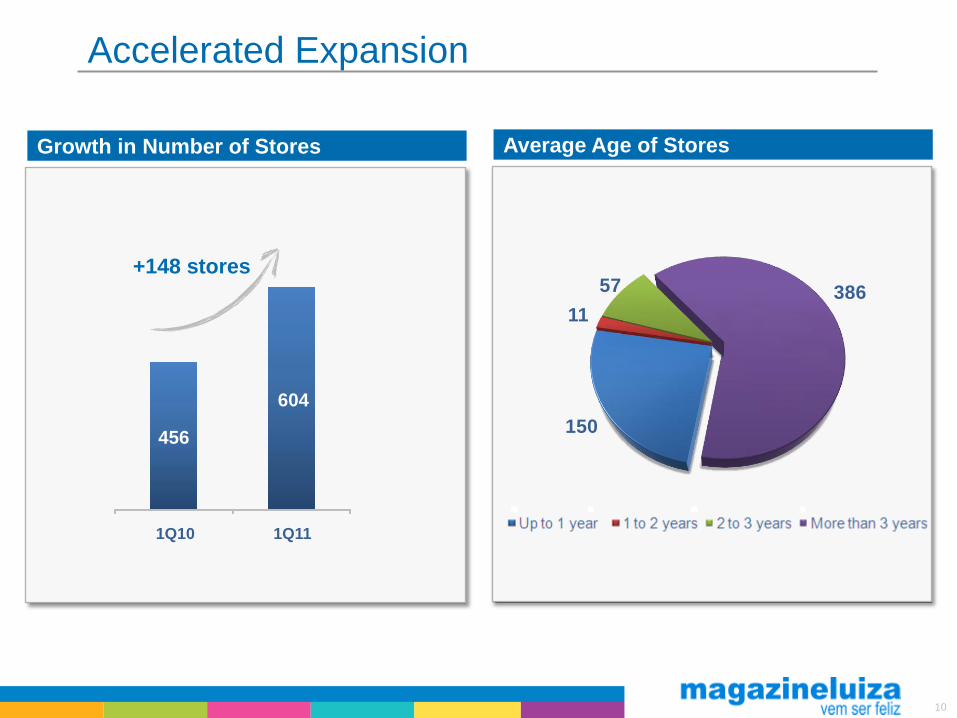
Accelerated Expansion
Growth in Number of Stores
+148 stores
Average Age of Stores
456
604
1Q10 1Q11
150
11
57 386
até 1 ano de 1 a 2 anos de 2 a 3 anos acima de 3 anos
11
High Growth Rates
Same Store Sales Growth (in %)
+58.2%
Internet Revenues (R$ MM)
28.7%21.7%
33.0%25.6%
1Q10 1Q11
Same Physical Stores Sales Growth Same Store Sales Growth
110
174
1Q10 1Q11
12
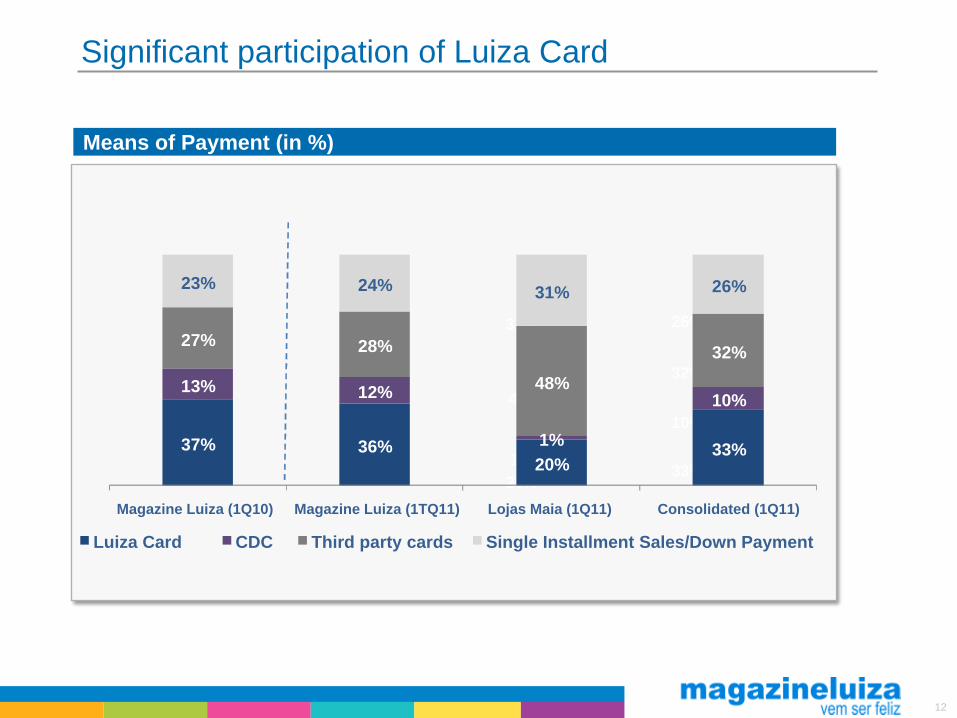
Significant participation of Luiza Card
Means of Payment (in %)
36%
12%
28%
24%
20%
1%
48%
31%
33%
10%
32%
26%
37% 36%20%
33%
13% 12%
1%
10%
27% 28%
48%
32%
23% 24% 31% 26%
Magazine Luiza (1Q10) Magazine Luiza (1TQ11) Lojas Maia (1Q11) Consolidated (1Q11)
Luiza Card CDC Third party cards Single Installment Sales/Down Payment
13
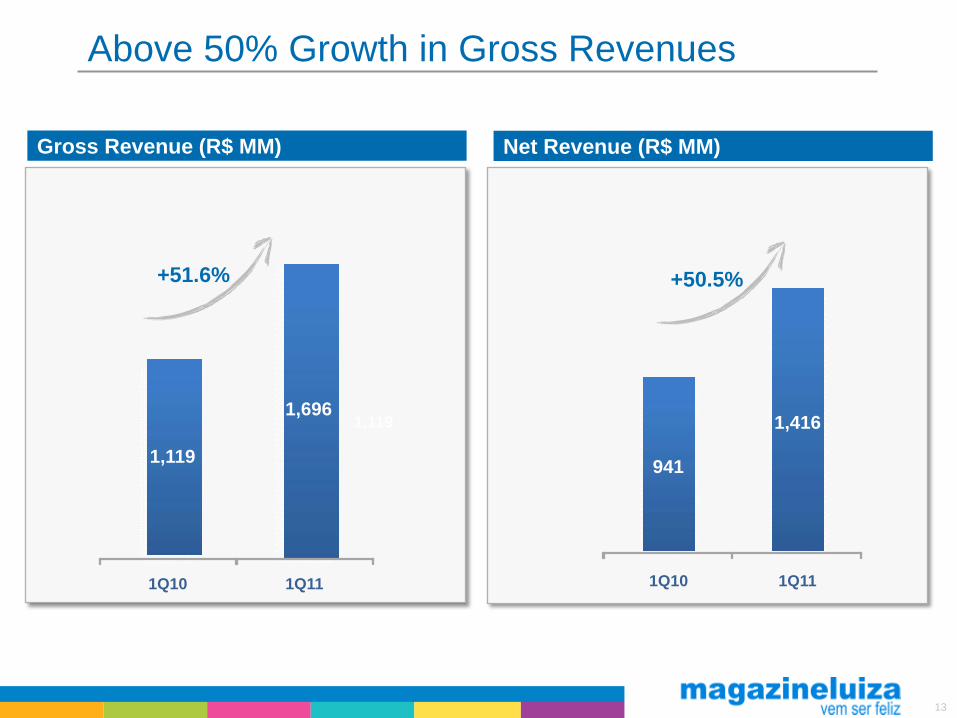
Above 50% Growth in Gross Revenues
Gross Revenue (R$ MM)
+51.6%
Net Revenue (R$ MM)
+50.5%
1,119 1,696
1Q10 1Q11
1,119941
1,416
1Q10 1Q11
14
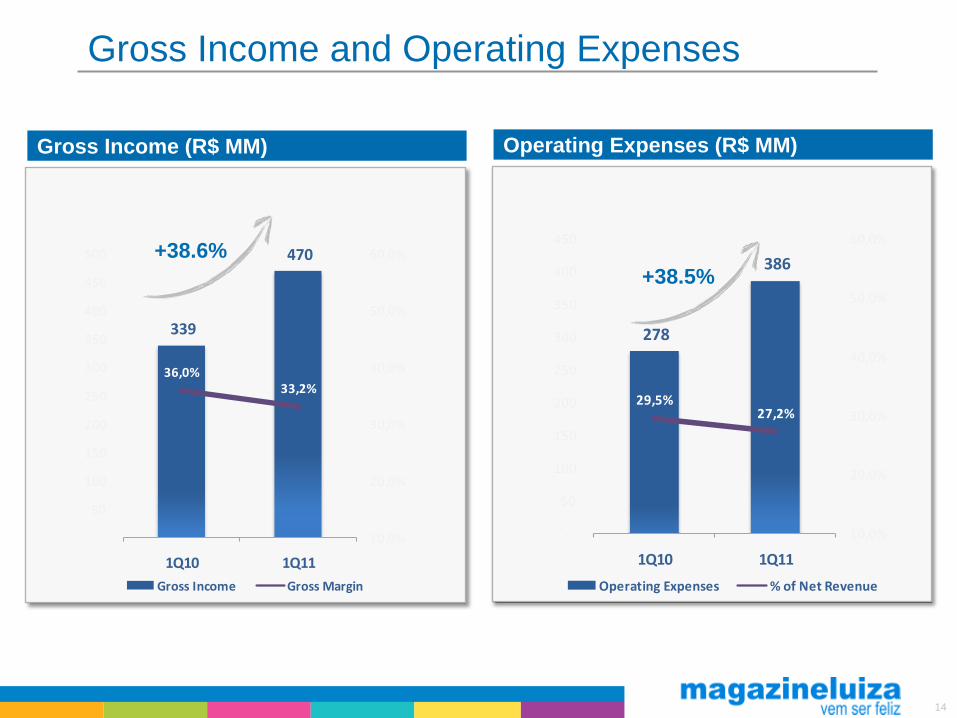
Gross Income and Operating Expenses
Gross Income (R$ MM)
+38.6%
Operating Expenses (R$ MM)
+38.5%
339
470
36,0%33,2%
10,0%
20,0%
30,0%
40,0%
50,0%
60,0%
-
50
100
150
200
250
300
350
400
450
500
1Q10 1Q11
Gross Income Gross Margin
278
386
29,5%27,2%
10,0%
20,0%
30,0%
40,0%
50,0%
60,0%
-
50
100
150
200
250
300
350
400
450
1Q10 1Q11
Operating Expenses % of Net Revenue
15
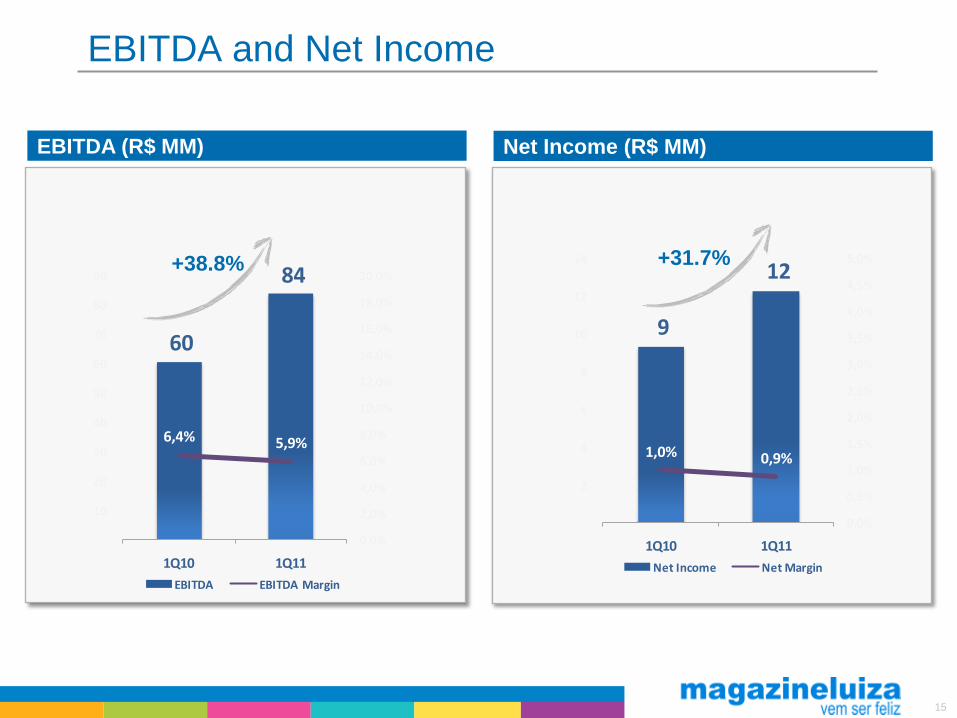
EBITDA and Net Income
EBITDA (R$ MM)
+38.8%
Net Income (R$ MM)
+31.7%
60
84
6,4% 5,9%
0,0%
2,0%
4,0%
6,0%
8,0%
10,0%
12,0%
14,0%
16,0%
18,0%
20,0%
-
10
20
30
40
50
60
70
80
90
1Q10 1Q11
EBITDA EBITDA Margin
9
12
1,0% 0,9%
0,0%
0,5%
1,0%
1,5%
2,0%
2,5%
3,0%
3,5%
4,0%
4,5%
5,0%
-
2
4
6
8
10
12
14
1Q10 1Q11
Net Income Net Margin
16
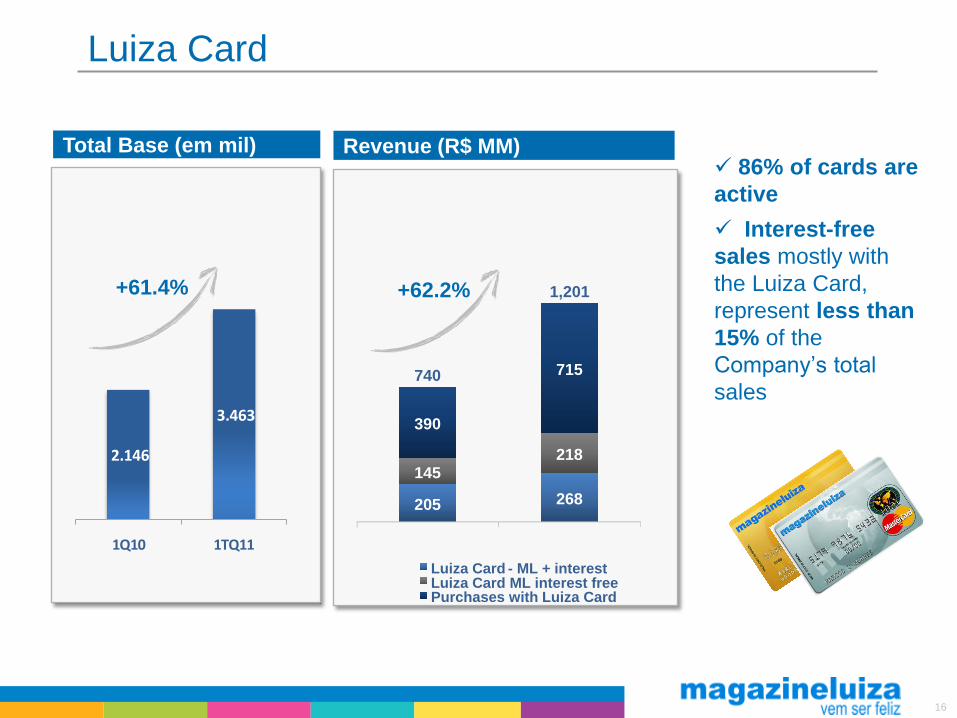
Luiza Card
Total Base (em mil)
+61.4%
86% of cards are
active
Interest-free
sales mostly with
the Luiza Card,
represent less than
15% of the
Company’s total
sales
+62.2%
Revenue (R$ MM)
2.146
3.463
1Q10 1TQ11
205 268
145218
390
715740
1,201
Luiza Card - ML + interestLuiza Card ML interest freePurchases with Luiza Card
17
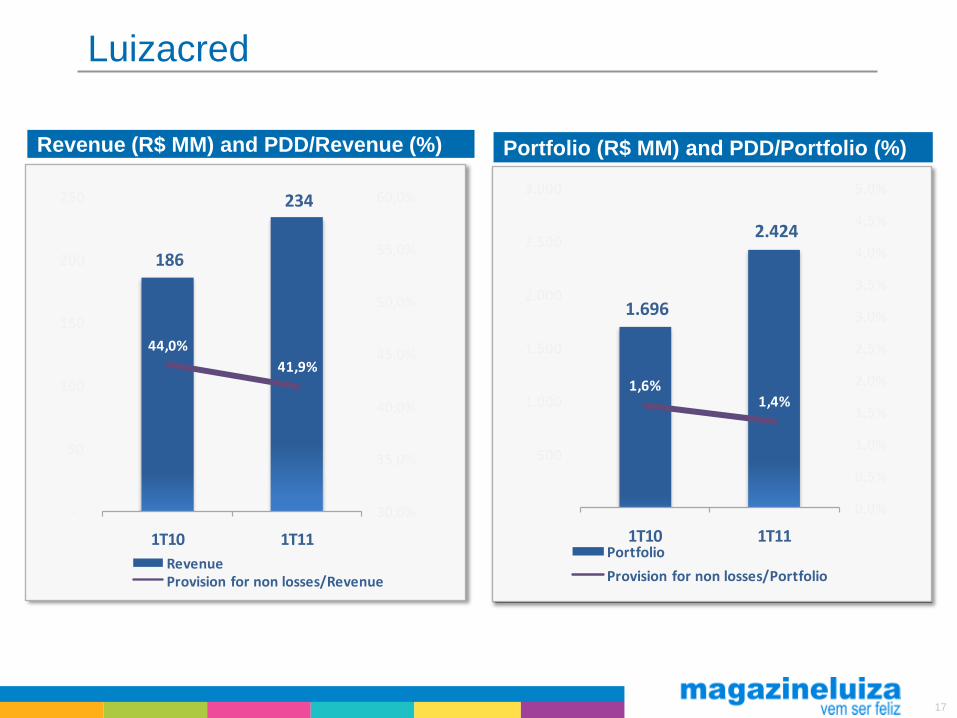
Luizacred
Revenue (R$ MM) and PDD/Revenue (%) Portfolio (R$ MM) and PDD/Portfolio (%)
186
234
44,0%
41,9%
30,0%
35,0%
40,0%
45,0%
50,0%
55,0%
60,0%
-
50
100
150
200
250
1T10 1T11
RevenueProvision for non losses/Revenue
1.696
2.424
1,6%1,4%
0,0%
0,5%
1,0%
1,5%
2,0%
2,5%
3,0%
3,5%
4,0%
4,5%
5,0%
-
500
1.000
1.500
2.000
2.500
3.000
1T10 1T11Portfolio
Provision for non losses/Portfolio

18
Contact
Roberto Bellissimo Rodrigues
Chief Financial and Investor Relations Officer
Anderson Rezende
Investor Relations Analyst
Contact
Phone: +55 (11) 3504-2727
E-mail: [email protected]
Website: www.magazineluiza.com.br/ri