Embed Size (px)
Citation preview

1 PPIC PPIC
Population Growth and Housing in CaliforniaPopulation Growth and Housing in California
Hans JohnsonHans JohnsonPublic Policy Institute of CaliforniaPublic Policy Institute of California
[email protected]@ppic.org

2 PPIC PPIC
OutlineOutline
Demographic determinants of housing Demographic determinants of housing demanddemand
Population changes for key groupsPopulation changes for key groups
Regional patternsRegional patterns
Public opinionPublic opinion

3 PPIC PPIC
Average Annual Population Change and Average Annual Population Change and New Housing Units by DecadeNew Housing Units by Decade
0
100
200
300
400
500
600
1960s 1970s 1980s 1990s 2000s
0.0
0.7
1.3
2.0
2.7
3.3
4.0
Population change (thousands)New housing units (thousands)Ratio of population change to new housing units

4 PPIC PPIC
Average Annual Population Change and Average Annual Population Change and New Housing Units by DecadeNew Housing Units by Decade
0
100
200
300
400
500
600
1960s 1970s 1980s 1990s 2000s
0.0
0.7
1.3
2.0
2.7
3.3
4.0
Population change (thousands)New housing units (thousands)Ratio of population change to new housing units

5 PPIC PPIC
Average Annual Population Change and Average Annual Population Change and New Housing Units by DecadeNew Housing Units by Decade
2.01.7
2.9
3.9
3.3
0
100
200
300
400
500
600
1960s 1970s 1980s 1990s 2000s
0.0
0.7
1.3
2.0
2.7
3.3
4.0
Population changeNew housing unitsRatio of population change to new housing units

6 PPIC PPIC
Why the mismatch between population Why the mismatch between population growth and housing?growth and housing?
Insufficient supply of new housingInsufficient supply of new housing
Not all population growth is equal with Not all population growth is equal with respect to generating housing demand:respect to generating housing demand:
– Children do not form their own Children do not form their own householdshouseholds
– Young adults have low household Young adults have low household formation ratesformation rates
– Immigrants and Latinos tend to have Immigrants and Latinos tend to have higher family and household sizeshigher family and household sizes
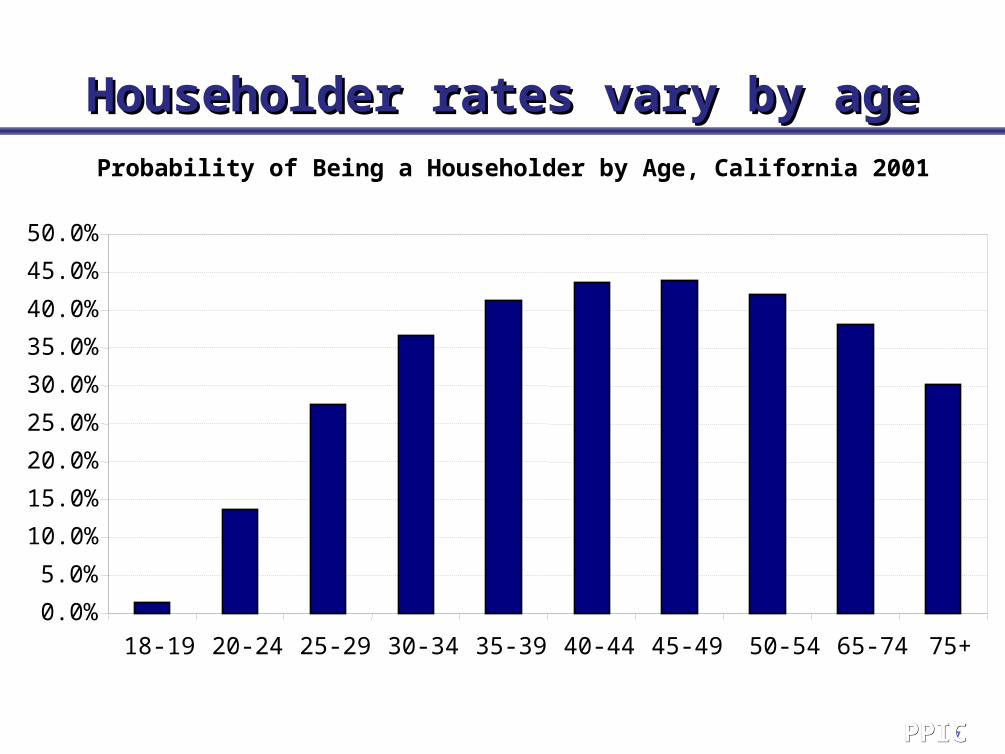
7 PPIC PPIC
Householder rates vary by ageHouseholder rates vary by ageProbability of Being a Householder by Age, California 2001
0.0%
5.0%
10.0%
15.0%
20.0%
25.0%
30.0%
35.0%
40.0%
45.0%
50.0%
18-19 20-24 25-29 30-34 35-39 40-44 45-49 50-54 65-74 75+

8 PPIC PPIC
Householder rates vary Householder rates vary by nativity and ethnicityby nativity and ethnicity
30% 35% 40% 45% 50% 55%
Total
U.S. bornForeign born
White U.S. bornWhite foreign born
Latino U.S. bornLatino foreign born
API U.S. bornAPI foreign born
African American
Age standardized householder rates among adults in 2000
9 PPIC PPIC
OutlineOutline
Demographic determinants of housing Demographic determinants of housing demanddemand
Population changes for key groupsPopulation changes for key groups
Regional patternsRegional patterns
Public opinionPublic opinion
10 PPIC PPIC
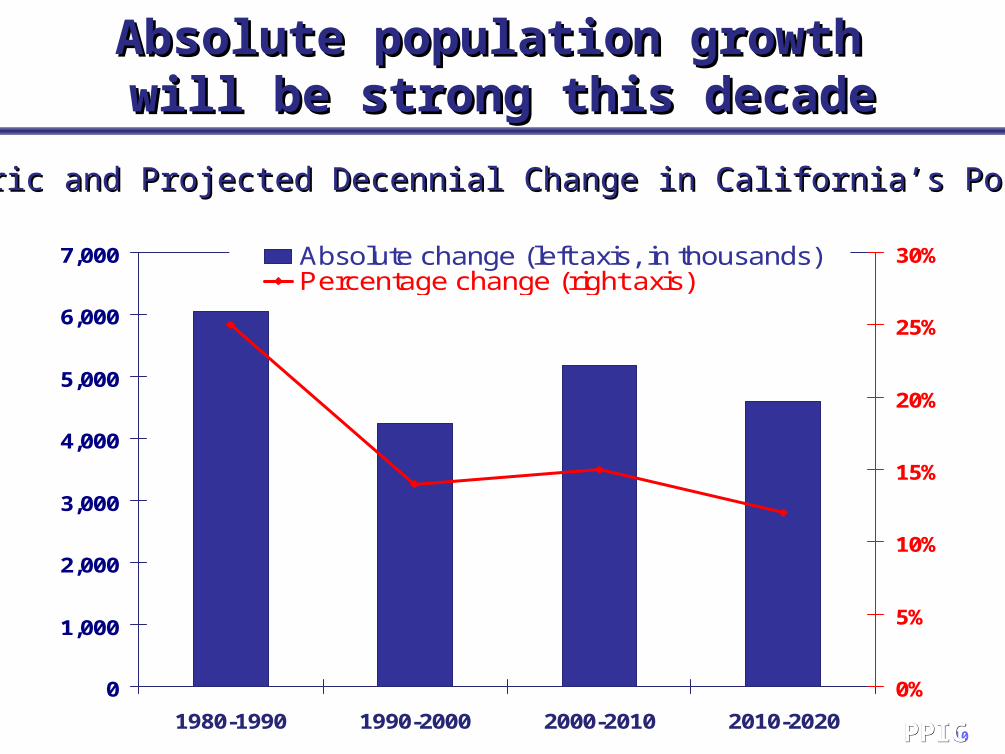
Absolute population growth Absolute population growth will be strong this decadewill be strong this decade
0
1,000
2,000
3,000
4,000
5,000
6,000
7,000
1980-1990 1990-2000 2000-2010 2010-2020
0%
5%
10%
15%
20%
25%
30%Absolute change (left axis, in thousands)Percentage change (right axis)
Historic and Projected Decennial Change in California’s PopulationHistoric and Projected Decennial Change in California’s Population

11 PPIC PPIC
Increase in adult population was much Increase in adult population was much lower in the 1990s than in the 1980s, but…lower in the 1990s than in the 1980s, but…
1,362
4,731
1,494
2,621
0
500
1,000
1,500
2,000
2,500
3,000
3,500
4,000
4,500
5,000
Children Adults
1980 to 1990
1990 to 2000

12 PPIC PPIC
……projections show strong growth in adult projections show strong growth in adult populations in the next two decadespopulations in the next two decades
0
500
1,000
1,500
2,000
2,500
3,000
3,500
4,000
4,500
5,000
Children Adults
1980 to 1990
1990 to 2000
2000 to 2010
2010 to 2020

13 PPIC PPIC
Growth in U.S.-born population alsoGrowth in U.S.-born population alsoslowed substantially, but…slowed substantially, but…
Population Growth in California: Change in Foreign Born and U.S. Born Populations (in thousands)
2,868
3,224
2,405
1,706
-
500
1,000
1,500
2,000
2,500
3,000
3,500
Foreign born U.S. born
1980 to 19901990 to 2000

14 PPIC PPIC
……second generation will reach prime second generation will reach prime household formation ageshousehold formation ages
-
200,000
400,000
600,000
800,000
1,000,000
1,200,000
1,400,000
1,600,000
1,800,0000-
4
5-9
10-
14
15-1
9
20-2
4
25-2
9
30-3
4
35-3
9
40-4
4
45-4
9
50-5
4
55-5
9
60-6
4
65-6
9
70-7
4
75-7
9
80+
Age
First
Second
Third+
Population by immigrant generation, 2000Population by immigrant generation, 2000

15 PPIC PPIC
OutlineOutline
Demographic determinants of housing Demographic determinants of housing demanddemand
Population changes for key groupsPopulation changes for key groups
Regional patternsRegional patterns
Public opinionPublic opinion

16 PPIC PPIC
Highest populationHighest populationgrowth rates in inland regionsgrowth rates in inland regions
1
35% or more20% to 35%Less than 20%

17 PPIC PPIC
Median Rents in Counties with Median Rents in Counties with High Rent BurdensHigh Rent Burdens
0 200 400 600 800 1000
California
Santa Cruz Santa Barbara
San Luis Obispo Los Angeles
Yolo Riverside
San Bernardino San Joaquin
Tuolumne Stanislaus
Lake Butte
Shasta Madera
Humboldt Fresno
Del Norte Kern
Imperial Yuba
Trinity Siskiyou
Source: PPIC tabulations of 2000 census; includes counties with at least 37 percent of renters paying at least 35 percent of income on rent

18 PPIC PPIC
California’s Most Crowded PlacesCalifornia’s Most Crowded PlacesPersons per household
Lost Hills CDP 5.60 Pajaro CDP 5.28 Las Lomas CDP 5.26 Chualar CDP 5.18 South San Jose Hills CDP 5.07 Mecca CDP 5.04 East Compton CDP 5.01 Cutler CDP 4.94 Richgrove CDP 4.85 Greenfield city 4.75 Coachella city 4.72 Lynwood city 4.70 London CDP 4.69 Castroville CDP 4.69 Kettleman City CDP 4.68 West Puente Valley CDP 4.67 San Joaquin city 4.66

19 PPIC PPIC
OutlineOutline
Demographic determinants of housing Demographic determinants of housing demanddemand
Population changes for key groupsPopulation changes for key groups
Regional patternsRegional patterns
Public opinionPublic opinion

20 PPIC PPIC
Percent who say issue is Percent who say issue is a “big problem” nowa “big problem” now
6763
44 4239
0
10
20
30
40
50
60
70
80
Affordablehousing
Traffic Schools Jobs Air pollution

21 PPIC PPIC
Confidence in state government’sConfidence in state government’sability to plan for future growth is lowability to plan for future growth is low
a great deal12%
only some46%
very little31%
none at all9%
don't know2%
How much confidence do you have in the state government’sAbility to plan for the state’s future and growth?

22 PPIC PPIC
Percent who say the following problems Percent who say the following problems will get worse by 2025will get worse by 2025
8178
69
47 46
0
10
20
30
40
50
60
70
80
90
Traffic Housing Air pollution Jobs Schools

23 PPIC PPIC

24 PPIC PPIC
New Housing Units Authorized, 1963-2004New Housing Units Authorized, 1963-2004
0
50
100
150
200
250
300
350
1963 1968 1973 1978 1983 1988 1993 1998 2003
100
200
300
400
500
600
700
800
Units (thousands)Population change (thousands)

25 PPIC PPIC
Ratio of Population Change to Ratio of Population Change to New Housing Units Authorized, 1963-2004New Housing Units Authorized, 1963-2004
0.0
1.0
2.0
3.0
4.0
5.0
6.0
7.0
1963 1968 1973 1978 1983 1988 1993 1998 2003

26 PPIC PPIC
Population Change and Population Change and New Housing Units Authorized, 1963-2004New Housing Units Authorized, 1963-2004
0
50
100
150
200
250
300
350
1963 1968 1973 1978 1983 1988 1993 1998 2003
100
200
300
400
500
600
700
800
Units (thousands)Population change (thousands)