Embed Size (px)
Citation preview

California
Hospital Outcomes Project
Gray DavisGovernor
State of California
Grantland JohnsonSecretary
California Health and Human Services Agency
David M. Carlisle, M.D., Ph.D.Director
Office of Statewide Health Planning and Development
Volume 3: Detailed Statistical Results
2002
Heart Attack Outcomes1996 -1998
"Equitable Healthcare Accessibility for California"
OFFICE OF STATEWIDE HEALTH PLANNING AND DEVELOPMENT

This page left blank intentionally

California Office of Statewide Health Planning and Development Page i
Report on Heart Attack Outcomes in California, 1996-1998
Office of Statewide Health Planning and Development
California Hospital Outcomes Project
Loel Solomon, Ph.D.Deputy Director
Andra Zach, R.H.I.A., M.P.A.Outcomes Project Director
Steven Lubeck, Ph.D.Research Scientist
Victor SimonStatistical Methods Analyst
Yuan Qing (Cliff) Li, M.P.H.Biostatistician
Mary MacDonaldResearch Analyst
Louise HandOffice Technician
Page ii California office of Statewide Health Planning and Development
Acknowledgments
This volume represents the Office of Statewide Health Planning and Development's firsthospital outcomes report produced by an in-house team. It draws upon the expertise offour new staff members--Steven Lubeck, Ph.D., Victor Simon, Yuan Qing (Cliff) Li,M.P.H., and Louise Hand--and benefits from Andra Zach's and Mary MacDonald's priorcollaboration with university-based researchers on earlier reports.
The Office owes a substantial debt to Harold Luft, Ph.D., and Patrick Romano, M.D.,M.P.H., who developed the original risk-adjustment models described in this report. Weare also indebted to the programming staffs at U.C. San Francisco, U.C. Davis andU.C.L.A. who developed the computer programs used in earlier AMI reports. Thisvolume profited from the considerable prior efforts of previous project teams.
Suggested Citation
Healthcare Quality and Analysis Division, Report on Heart AttackOutcomes in California 1996-1998, Volume 3: Detailed StatisticalResults, Sacramento, CA: California Office of Statewide HealthPlanning and Development, February 2002.

California Office of Statewide Health Planning and Development Page iii
California Health Policy and Data Advisory CommissionClark E. Kerr, Chair
Representing Business Health Coalitions
Maurice J. Alfaro, M.D.Representing Group Prepayment Health Plans
Marjorie B. Fine, M.D., FACSGeneral Member
M. Bishop BastienRepresenting Health Insurance Companies
A. Peter Kezirian, Jr., Esq.General Member
Marvin Karno, M.D.Representing Physicians and Surgeons
Thomas McCafferyRepresenting Disproportionate Share Hospitals
Vito J. GennaRepresenting Long-Term Care Facilities
Hugo MorrisRepresenting Labor Health Coalitions
Janet GreenfieldRepresenting Ambulatory Surgery Centers
Jerry Royer, M.D., M.B.A.Representing Acute Care Hospitals
Howard L. Harris, Ph.D.General Member
Corinne Sanchez, Esq.General Member
Jacquelyn PaigeExecutive Director
California Health Policy and Data Advisory CommissionTechnical Advisory Committee
Jerry Royer, M.D., M.B.A., ChairRepresenting California Healthcare Association
Douglas BagleyRepresenting California Healthcare Association
Maida Reavis Herbst, R.R.A.Representing Health Information Association
Marilyn Chow, R.N., D.N.Sc.Representing California Nurses Association
Laura B. Gardner, M.D., M.P.H., Ph.D.Representing Research Community
Mark Hlatky, M.D.Representing Research Community
David E. Hayes-Bautista, Ph.D.Representing Research Community
Peter Juhn, M.D.Representing Group Practice Hospitals
Robert H. Brook, M.D.Representing Research Community
Laurie Sobel, Esq.Representing Consumers Union
VacantRepresenting Health Access California
Jeffrey Rideout, M.D.Representing California Medical Association
Nancy Donaldson, R.N., D.N.Sc.Representing California Nurses Association
William S. Weil, M.D.Representing California Medical Association

Page iv California office of Statewide Health Planning and Development
This page left blank intentionally

California Office of Statewide Health Planning and Development Page v
TABLE OF CONTENTS
Overview: Report on Heart Attack Outcomes in California:1996-1998........................................................................................... 1The California Hospital Outcomes ProjectContent of the Report on Heart Attack Outcomes
Section 1: Using this Volume................................................................... 3Relationship to Other Volumes of this ReportStatistical Significance and Hospital Classification
Section 2: Explanation of the Detailed Results...................................... 5The Table, an ExampleThe Charts, an Example
Section 3: How Not to Use These Results ............................................ 11Interpreting Death RatesWhy Ranking is Inappropriate
Section 4: How These Data Might Be Used .......................................... 15Examine Individual HospitalsExamine Groups of Hospitals
Section 5: Data File Record Layout....................................................... 17
Section 6: Hospital-Specific Tables and Graphs ................................. 19Alameda County............................................................................................................................. 21Amador County .............................................................................................................................. 33Butte County .................................................................................................................................. 35Calaveras County........................................................................................................................... 40Colusa County................................................................................................................................ 42Contra Costa County...................................................................................................................... 44Del Norte County............................................................................................................................ 54El Dorado County........................................................................................................................... 56Fresno County................................................................................................................................ 59Glenn County ................................................................................................................................. 70Humboldt County ........................................................................................................................... 72Imperial County .............................................................................................................................. 78Inyo County .................................................................................................................................... 81Kern County ................................................................................................................................... 84Kings County.................................................................................................................................. 94Lake County ................................................................................................................................... 97Lassen County ............................................................................................................................. 100Los Angeles County ..................................................................................................................... 102Madera County............................................................................................................................. 212Marin County................................................................................................................................ 215Mariposa County .......................................................................................................................... 219Mendocino County ....................................................................................................................... 221Merced County............................................................................................................................. 225Modoc County .............................................................................................................................. 230Mono County................................................................................................................................ 233

Page vi California office of Statewide Health Planning and Development
TABLE OF CONTENTS, continued
Monterey County.......................................................................................................................... 235Napa County ................................................................................................................................ 240Nevada County ............................................................................................................................ 244Orange County............................................................................................................................. 247Placer County............................................................................................................................... 280Plumas County............................................................................................................................. 283Riverside County.......................................................................................................................... 288Sacramento County ..................................................................................................................... 306San Benito County ....................................................................................................................... 317San Bernardino County................................................................................................................ 319San Diego County ........................................................................................................................ 337San Francisco County.................................................................................................................. 361San Joaquin County..................................................................................................................... 371San Luis Obispo County .............................................................................................................. 379San Mateo County ....................................................................................................................... 385Santa Barbara County.................................................................................................................. 392Santa Clara County...................................................................................................................... 400Santa Cruz County....................................................................................................................... 413Shasta County.............................................................................................................................. 416Siskiyou County ........................................................................................................................... 420Solano County.............................................................................................................................. 423Sonoma County ........................................................................................................................... 428Stanislaus County ........................................................................................................................ 438Sutter County ............................................................................................................................... 445Tehama County............................................................................................................................ 447Trinity County ............................................................................................................................... 449Tulare County............................................................................................................................... 451Tuolumne County......................................................................................................................... 458Ventura County ............................................................................................................................ 461Yolo County.................................................................................................................................. 470Yuba County ................................................................................................................................ 473

California Office of Statewide Health Planning and Development Page 1
The California Hospital Outcomes Project is an initiative mandated by the State ofCalifornia, and conducted by the Office of Statewide Health Planning and Development(OSHPD), to develop public reports comparing hospital outcomes for selected conditionstreated in hospitals throughout the state.
The Report on Heart Attack Outcomes is intended to encourage all California hospitalsto improve their care and give credit to the hospitals that are the leaders. It can alsohelp insurers, employers, and consumers to select hospitals based on quality of care.
Heart attacks (acute myocardial infarctions or AMI) were chosen as one ofthe first conditions to be reported upon by the California Hospital OutcomesProject because they are important, common, and deadly. Every yearapproximately 40,000 heart attack patients are admitted to 400 Californiahospitals. More than 5,000 of these persons die.
The mortality rates published in previous heart attack reports have been usedin many ways. Hospitals have used their results to evaluate and improvetheir quality of care. Payers have used the reports to contract with the besthospitals. Consumers have used the reports to make more informeddecisions.
The results published in this report are useful because:
• They have been risk-adjusted. Patient age, gender, type of heartattack, and chronic diseases were used to adjust for differences inpatient risk when calculating hospital mortality rates.
• They have been validated. A major validation study involving nearly1,000 heart attacks at 30 hospitals showed that variations in howhospitals report their data to OSHPD do not significantly affect theirrisk-adjusted death rates. In general, low-mortality hospitals treatheart attacks more aggressively than high-mortality hospitals.
This report is the most recent in a series that began in 1993. This reportincludes heart attack cases from 1996 through 1998. It incorporatesimprovements in the risk-adjustment methodology introduced in earlierreports, including:
The California Hospital Outcomes Project
Content of the Report on Heart Attack Outcomes
Overview Report on Heart Attack Outcomes inCalifornia: 1996 - 1998

Page 2 California office of Statewide Health Planning and Development
• Linking with Vital Statistics records to ascertain deaths occurringoutside the hospital,
• Refining certain patient risk factor definitions based on the findings ofthe validation study published 1996; and
• Using six months of pre-heart attack hospital records to morecompletely describe patient risk factors.
This report consists of four volumes:
The User's Guide (Volume 1) is intended for all those interested in hospitalperformance including hospital staff, employers, government agencies, healthplans, and insurance companies. This volume provides a brief description ofthe study background and methods. It also contains two tables that displaythe results for individual hospitals based on heart attacks that occurredbetween 1996 and 1998.
The Technical Guide (Volume 2) is intended for health services researchers,health care providers, and others interested in the statistical methods used tocalculate risk-adjusted death rates.
The Detailed Statistical Results (Volume 3) contains the numerical resultsfor individual hospitals upon which the classifications in the User's Guide arebased. In addition, there are tables that aggregate the results to the countylevel. It also contains a graphical representation of both individual hospitaland county-wide results, which can be used to examine annual trends.
The Hospital Comment Letters (Volume 4) is intended to give readers of theReport on Heart Attack an appreciation of its strengths and weaknesses fromthe hospitals' perspectives.
To obtain these volumes of the report contact:
Office of Statewide Health Planning and DevelopmentHealthcare Information Resource Center818 K Street, Room 500Sacramento, CA 95814(916) 326-3802
Documents excluding the Hospital Guide, are also available on theinternet at http:\\www.oshpd.state.ca.us
Hospitals were provided with a Hospital Guide several weeks before theReport on Heart Attack Outcomes was published. This documentaccompanied each hospital's patient-specific data. Hospitals used thisdocument to access and use their patient-specific data and to prepare theircomment letters, provided in Volume 4. More importantly, hospitals and theirphysicians can use this information to target areas where heart attack caremight be improved.

California Office of Statewide Health Planning and Development Page 3
This document describes the hospital-specific statistics developed by the CaliforniaHospital Outcomes Project and discusses appropriate ways to use these statistics. Thestatistics are available in two media: as part of this document, which contains one tablefor each hospital beginning on page 19, or in a file available on OSHPD's web page(www.oshpd.state.ca.us/hpp/chop) which contains one record for each hospital and onerecord for each county. The only difference between the two versions is that the printedversion presents numbers that are rounded off to have fewer digits.
Relationship to Other Volumes of this Report
The purpose of this volume of the Report on Heart Attack Outcomes is toprovide and explain the detailed statistics associated with heart attack (i.e.,acute myocardial infarction or AMI) mortality in California hospitals. It alsosuggests appropriate uses for these detailed data and explains why certainuses would be inappropriate.
The User's Guide (Volume 1) describes the data and summarizes themethods used in the analysis of risk-adjusted heart attack mortality.Statistical methods were used to determine whether each hospital's AMIdeath rate was significantly higher or lower than the general AMI death ratefor the State. The results, using aggregated 1994-1996 data, are presentedin two charts in the User's Guide. The first chart classifies each hospital intoone of four categories. The second chart displays these risk-adjusted deathrates graphically.
The Technical Guide (Volume 2) presents a detailed description of the dataand of the risk-adjustment methods. This detailed methodologicalpresentation is intended to allow users and researchers to review andcomment on the approaches taken and to encourage improvements in thefuture.
As required by law, each hospital and its chief of medical staff were sentsummaries of their own results and draft copies of the report. All hospitalcomments submitted in response to the draft report are included in HospitalComment Letters (Volume 4). These responses should be reviewed carefullyif the reader is interested in the results for particular hospitals.
Statistical Significance and Hospital Classification
The threshold of statistical significance used in this report of the CaliforniaHospital Outcomes Project is p<0.01. This means that a hospital's risk-adjusted mortality rate was considered to be significantly lower or higher than
Using this VolumeSection
1
Page 4 California office of Statewide Health Planning and Development
the general AMI death rate for the State if it was more extreme than whatwould be expected to occur by chance 1% of the time. Even if every hospitalprovided the same quality of care, chance variation in outcomes would meanthat some hospitals would appear to be high outliers and some low outliers.With roughly 400 hospitals in the analysis, 1% or four would have higher thanexpected mortality due just to chance variation. Another four (1%) wouldhave lower than expected mortality by chance. If about eight of the 400hospitals were actually identified as outliers, one might conclude that nonehad quality of care problems, since this many outliers would be likely to occurjust by chance.
In fact, 62 hospitals were identified as outliers for AMI mortality using Model Aand 48 were identified as outliers using Model B. This distribution isinconsistent with the premise that all hospitals have equal quality. Withoutadditional information from medical records, however, it is impossible to tellwhich of the outliers provided unusually good or poor quality care and whichwere outliers just due to chance.
A hospital is unlikely to be an outlier several years in a row just by chance. Ifthis occurs, it probably reflects some consistent factors. Outcomes for AMIpatients are based on cases admitted between January 1, 1996 andDecember 1, 1998. Overall mortality is reported as well as mortality for eachof the three years separately. AMI outcomes for each year are calculated byapplying the overall mortality model (which adjusts for the year of admission)to a single year's cases. Very few hospitals shift from being extreme lowoutliers in one year to extreme high outliers in the next. However, somehospitals with initially high mortality do improve over time, possibly becauseof improvements in quality of care. Similarly, some hospitals with initially lowmortality appear to deteriorate over time. The graphs presented in thisvolume display these temporal trends, but the statistical significance of thesetrends at individual hospitals has not been assessed.

California Office of Statewide Health Planning and Development Page 5
Hospital specific results are displayed in two ways. The detailed tables give thestatistics upon which the summary results shown in the User's Guide are based. Thecharts present those results graphically.
TABLE 1: Detailed Statistical Results for Acute Myocardial Infarction Mortality at a Hypothetical Hospital
Healthy County: General Hospital
StatewideDeath Rate
Number ofCases
Number ofObserved
Number ofExpected
StandardDeviation ofObserved
ObservedDeath Rate
ExpectedDeath Rate
Risk-Adjusted
Death Rate
Risk- AdjustedDeath Rate:95%
Confidence Bounds
ProbabilityThis RateOccurred
(%) Included Deaths Deaths Deaths (%) (%) (%) Lower Upper by Chance
Model A All Years 12.1 750 108 98.5 8.8 14.4 13.1 13.3 11.1 15.4 0.152
1996 12.2 260 36 33.7 5.2 13.8 13.0 13.0 9.3 16.6 0.361
1997 12.0 247 38 32.0 5.0 15.4 12.9 14.3 10.6 18.0 0.137
1998 12.1 243 34 32.7 5.0 14.0 13.5 12.5 8.9 16.2 0.432
Model B All Years 12.1 747 108 99.5 8.1 14.5 13.3 13.1 11.2 15.1 0.164
1996 12.2 258 36 34.0 4.8 14.0 13.2 12.9 9.5 16.3 0.370
1997 12.0 246 38 31.6 4.6 15.4 12.9 14.5 11.0 17.9 0.104
1998 12.1 243 34 33.9 4.6 14.0 14.0 12.1 8.9 15.4 0.530
Table 1 summarizes the results for a hypothetical hospital. The first columnon the left identifies the specific analytic model and the second columnidentifies the year(s) of data included in the results. The AMI outcome wasdeath within 30 days of admission for the index AMI. Hospitals with no AMIpatients in 1996-1998 are not included in this report. Because of specificdata limitations described in Section 5 of the Technical Guide, 24 hospitalswith AMI patients were excluded from the analysis in one or more of the threestudy years. An "Excluded" notation indicates that the data from a hospital inthis year were excluded.
AMI results based on both Models A and B are presented for each hospital.These models are explained in general terms in the User's Guide and indetail in the Technical Guide. Sometimes slightly fewer patients wereanalyzed under Model B Than Model A. This is because some risk factorsunique to Model B (e.g., race/ethnicity, insurance status) were unknown forsome patients. When this occurred, that patient was omitted from the Model
The Tables, an Example
Explanation of the Detailed ResultsSection
2
Page 6 California office of Statewide Health Planning and Development
B analysis. The omission of some cases from Model B causes a slightdifference between the two models in the overall death rate.
The results are displayed year-by-year as well as for all years combined. Forexample, the results in a row labeled “1996" include only eligible patientsdischarged from the hospital for AMI in 1996. The row labeled “All Years”includes all eligible patients in 1996, 1997, and 1998 combined. Somehospitals do not have any AMI patients in a particular year, but do havepatients in other years. In this case, the row corresponding to the year inwhich the hospital had no cases would be blank.
General Hospital in Healthy County, shown in Table 1, is used as an examplefor the following explanation of hospital-level summary statistics. The county-level tables in this volume include the same variables as the hospital-leveltables described.
The Statewide Death Rate (%) is the total number of patients included in thisreport who died within 30 days of admission, divided by the total number ofpatients included in this report, multiplied by 100. As Table 1 shows, theoverall Statewide Death Rate for AMI during 1996-1998 was 12.1%.
The column indicating Number of Cases Included tells how many cases fromthis hospital were included in the models. A general description of patientinclusion and exclusion criteria is in the User’s Guide. A detailed descriptionis in the Technical Guide, Section 2. Cases with missing data for one ormore demographic variables included in Model B (such as race or source ofpayment) are not included in Model B. The overall number of AMI cases atGeneral Hospital was 750 under Model A and 747 under Model B.
The Number of Observed Deaths is the number of patients at a facility whodied within 30 days of admission for AMI. The death may have occurred atthe index hospital, a transfer hospital, or outside the hospital setting. The fulldescription of the outcome variable is given in Section 4 of the TechnicalGuide. At General Hospital, the overall Number of Deaths in the AMIanalysis was 108 under both Model A and Model B.
The Number of Expected Deaths among patients included in the analysis ispresented in the next column. The influence of patient characteristics on therisk of death was estimated from the statistical models described in theTechnical Guide, Section 7. The predicted probability of death was computedfor each patient. Summing these probabilities over all patients treated at ahospital gives the predicted number of deaths among those patients. AtGeneral Hospital, the Number of Expected Deaths was 98.5 using Model Aand 99.5 using Model B.
The Standard Deviation of the Observed Deaths is the square root of thesum, over all of the included patients, of each patient's probability of death(pi) times the probability of survival (1-pi), i.e., SQRT(∑
ipi(1-pi)). At General
Hospital, the Standard Deviation of Observed Deaths was 8.8 for Model A (all

California Office of Statewide Health Planning and Development Page 7
years) and 8.1 for Model B (all years). Although the standard deviation ofexpected death was calculated, it did not affect the classification of hospitalmortality and was therefore not used in the final analysis.
The Observed Death Rate (%) is the number of patients at this hospital whodied, divided by the number of patients at this hospital included in theanalysis, multiplied by 100. For example, under both Model A at GeneralHospital, the overall Observed Death Rate for AMI was (108/750) x 100, or14.4%.
The Expected Death Rate (%) is the expected number of patients at thishospital who died, divided by the number of patients at this hospital includedin the analysis, multiplied by 100. General Hospital had 750 AMI patientsincluded in Model A. With 98.5 patients expected to die, General Hospitalhas an Expected Death Rate under Model A of 13.1%.
The Risk-Adjusted Death Rate (%) is derived using a technique known asindirect standardization. It adjusts the observed death rate at the hospital toreflect what the rate would be if the patients were about as ill as "average"patients in the state. The Risk-Adjusted Death Rate (%) is calculated as thestatewide rate, multiplied by the ratio of the number of observed deaths to thenumber of expected deaths at this hospital. This adjusted death rate can beused to compare the performance of different hospitals.
For example, the Risk-Adjusted Death Rate using Model A patients is thestatewide rate (12.2%) times the observed number of deaths, divided by theexpected number of deaths. At General Hospital under Model A, 108patients died whereas 98.5 were expected to die. For General Hospital, therisk-adjusted death rate is 12.2% x (108/98.5) = 13.7%. Adjusting for itspatient mix, General Hospital's risk-adjusted death rate is lower than itsobserved rate of 14.4%.
Note that the expected death rate (13.1%) is higher than the statewide rate(12.2%). This difference reflects the fact that patients at General Hospitalhad higher risk, on average, than the statewide population of patients. Therisk-adjusted figure of 13.3% is an estimate of what the death rate would beat General Hospital if its patients matched the state average in terms of risk.
The Risk-Adjusted 95% Confidence Bounds reflect the level of confidence inthe hospital's risk-adjusted death rate. Assuming that the risk model iscorrect, there is a 95% chance that the hospital's true risk-adjusted AMI deathrate under Model A falls between the Lower 95% Confidence Bound of 11.1%and the Upper 95% Confidence Bound of 15.4%. Please note that this 95%confidence interval differs from the 98% confidence interval shown in theUser’s Guide. A narrower interval, providing 95% confidence rather than98% confidence, is used in these tables for the benefit of individual hospitalsand physician groups that are interested in evaluating their own performance.Wider confidence intervals are used to identify hospital outliers in the User’sGuide, because of the large number of hospitals evaluated in the study.

Page 8 California office of Statewide Health Planning and Development
The Probability This Rate Occurred by Chance is a measure of the likelihoodthat this many (or more) deaths occurred by chance, given the expectednumber of deaths from the risk-adjustment model. If the observed number ofdeaths is less than or equal to the expected number, a lower p-value iscomputed. If the observed number of deaths is more than the expectednumber, an upper p-value is computed.
The lower p-value is the probability of the observed number of deaths orfewer. The lower p-value represents a "test" of whether this hospital hassystematically better outcomes than expected based on its patients' riskcharacteristics. A lower p-value of less than 0.05 indicates that there wouldbe less than a 1 in 20 chance of this hospital having this few or fewer deaths,given its mix of patients, if quality of care were average.
The upper p-value is the probability of the observed number of deaths ormore. The upper p-value represents a "test" of whether this hospital hassystematically worse outcomes than expected based on its patients' riskcharacteristics. An upper p-value of less than 0.05 indicates that there wouldbe less than a 1 in 20 chance of this hospital having this many or moredeaths, given its mix of patients, if quality of care were average.
Because General Hospital had fewer deaths than expected in Model A, thelower p-value of 0.152 was used. Thus, in this hospital with 750 patients (and13.3 expected deaths, based on Model A risk factors), the probability ofobserving 108 or fewer deaths due to chance alone is about 1 in 9 — afinding that tends to be consistent with chance variability. Such a findingprovides little evidence that General Hospital's outcomes differ systematicallyfrom the statewide average.
The classification of hospitals into one of four categories, based on all threeyears of data, (as shown in the User’s Guide) is based on a p-value of 0.01.Hospitals classified as significantly better than expected had fewer deathsthan expected and a lower p-value of less than 0.01. Hospitals classified assignificantly worse than expected had more deaths than expected and anupper p-value of less than 0.01.
Summarizing the contents of Table 1, General Hospital has an overall risk-adjusted death rate of 13.3% from Model A and 13.1% from Model B. Theserates are higher than the overall statewide death rates but are not statisticallysignificant. In the first table in the User’s Guide, General Hospital would havebeen represented by a simple box ( ) for both Model A and Model B in theresults columns.

California Office of Statewide Health Planning and Development Page 9
Table 1 gave the detailed statistics for the fictional General Hospital inHealthy County. Figure 1 below displays General Hospital’s yearly risk-adjusted death rates and the 95% confidence bounds around those rates.
FIGURE 1: Healthy County: General Hospital
Yearly Risk Adjusted Death Rates (%)with 95% Confidence Bounds
Model A
0
10
20
30
40
50
60
70
80
90
100
1996 1997 1998
Statewide
Yearly Risk Adjusted Death Rates (%)with 95% Confidence Bounds
Model B
0
10
20
30
40
50
60
70
80
90
100
1996 1997 1998
Statewide
Each table for a specific hospital or county is followed by two charts whichgraphically display the hospital’s or county’s risk-adjusted death rates fromModel A and Model B, by year. The risk-adjusted death rates and 95%confidence bounds displayed in these charts are identical to those shown inthe table on the same page.
The Charts, an Example

Page 10 California office of Statewide Health Planning and Development
The User’s Guide includes a very similar display of hospitals' risk-adjusteddeath rates. However, the charts show overall results for 1996-1998 andfeature 98% rather than 95% confidence bounds.
In the charts in this volume, annual risk-adjusted death rates for AMI patientsare denoted by asterisks. As described above, the risk-adjusted death raterepresents a measure of hospital performance adjusted for differences inpatients' severity of illness across hospitals. Each risk-adjusted death rate issurrounded by 95% confidence bounds, which are denoted by thick dashesabove and below each asterisk. There is a 95% chance that a hospital's truerisk-adjusted death rate lies within the indicated range.1
The statewide death rate is denoted by a horizontal dotted line. Note that thestatewide death rate dropped from 12.3% in 1996 to 12.1% in 1997 and1998. If the horizontal dotted line is below the hospital's lower confidencebound, then that hospital had a significantly higher than average risk-adjusteddeath rate, and significantly more deaths than were expected, in that year. Ifthe statewide death rate lies above a hospital's upper confidence bound, thenthat hospital had a significantly lower than average risk-adjusted death rate,and significantly fewer deaths than were expected, in that year. For mosthospitals, the statewide rate lies within the confidence bounds, indicating thatthe hospital's performance was within the expected range. This expectedrange is substantially wider when individual years are shown separately thanwhen all three years are aggregated, as in the chart in the User’s Guide.
Because two separate risk-adjustment models were developed to estimatethe probability of death, the risk-adjusted death rate and confidence boundsfrom Model B are displayed next to the comparable data from Model A. If aspecific hospital appears to have no point on the chart for one or more years,then that hospital either had no eligible cases or was excluded because ofdata limitations during that year or set of years. Volume 2, Technical Guide,Section 5 explains which hospitals were excluded because of data limitations.If a hospital had no eligible cases across all three years (1996-1998), then itis not listed in this volume.
1. The confidence bounds shown in these charts are based on a widely used method called the normal approximation (seethe 1997 Technical Guide, Section 11). For most hospitals, this procedure generated confidence bounds nearly identical tothose implied by the exact method that was used to calculate p-values in the detailed statistical tables and to identify mortalityoutliers in the User’s Guide. However, a few hospitals have 95% confidence bounds that do not include the statewideaverage, despite the fact that their exact p-value exceeds 0.025. The exact p-value is a more precise measure of theprobability that a hospital's true risk-adjusted death rate equals the statewide average.
California Office of Statewide Health Planning and Development Page 11
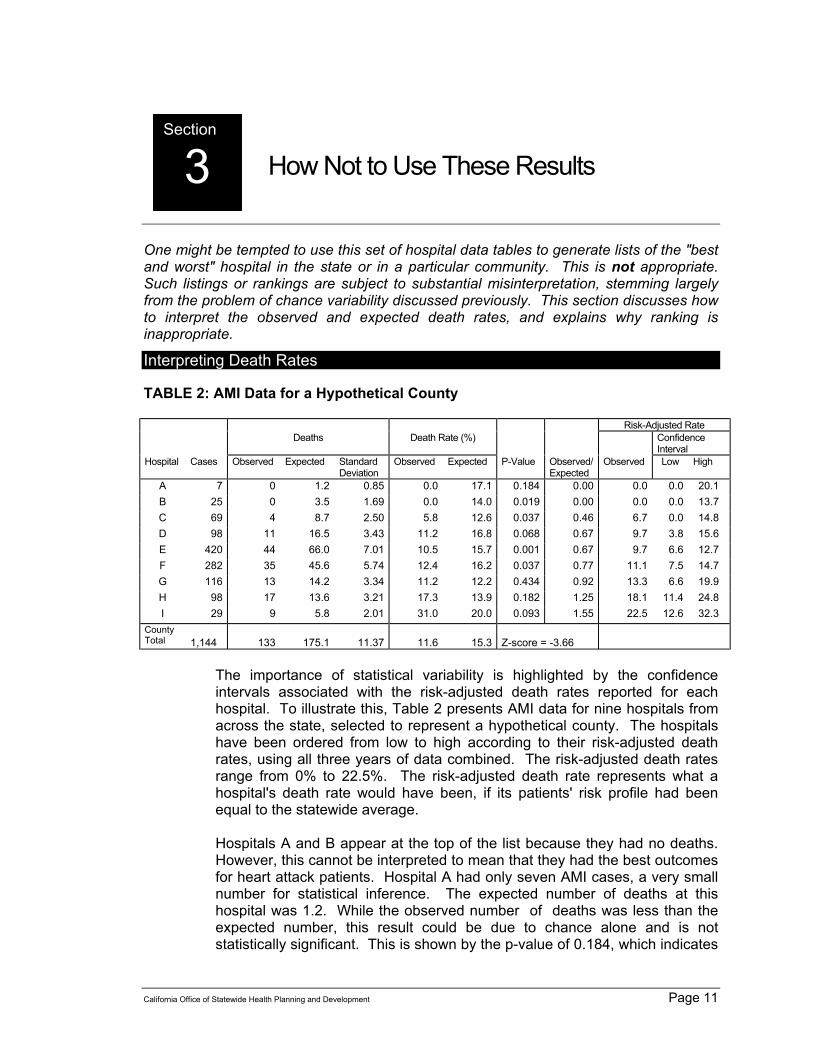
One might be tempted to use this set of hospital data tables to generate lists of the "bestand worst" hospital in the state or in a particular community. This is not appropriate.Such listings or rankings are subject to substantial misinterpretation, stemming largelyfrom the problem of chance variability discussed previously. This section discusses howto interpret the observed and expected death rates, and explains why ranking isinappropriate.
TABLE 2: AMI Data for a Hypothetical County
Risk-Adjusted RateDeaths Death Rate (%) Confidence
IntervalHospital Cases Observed Expected Standard
DeviationObserved Expected P-Value Observed/
ExpectedObserved Low High
A 7 0 1.2 0.85 0.0 17.1 0.184 0.00 0.0 0.0 20.1B 25 0 3.5 1.69 0.0 14.0 0.019 0.00 0.0 0.0 13.7C 69 4 8.7 2.50 5.8 12.6 0.037 0.46 6.7 0.0 14.8D 98 11 16.5 3.43 11.2 16.8 0.068 0.67 9.7 3.8 15.6E 420 44 66.0 7.01 10.5 15.7 0.001 0.67 9.7 6.6 12.7F 282 35 45.6 5.74 12.4 16.2 0.037 0.77 11.1 7.5 14.7G 116 13 14.2 3.34 11.2 12.2 0.434 0.92 13.3 6.6 19.9H 98 17 13.6 3.21 17.3 13.9 0.182 1.25 18.1 11.4 24.8I 29 9 5.8 2.01 31.0 20.0 0.093 1.55 22.5 12.6 32.3
CountyTotal 1,144 133 175.1 11.37 11.6 15.3 Z-score = -3.66
The importance of statistical variability is highlighted by the confidenceintervals associated with the risk-adjusted death rates reported for eachhospital. To illustrate this, Table 2 presents AMI data for nine hospitals fromacross the state, selected to represent a hypothetical county. The hospitalshave been ordered from low to high according to their risk-adjusted deathrates, using all three years of data combined. The risk-adjusted death ratesrange from 0% to 22.5%. The risk-adjusted death rate represents what ahospital's death rate would have been, if its patients' risk profile had beenequal to the statewide average.
Hospitals A and B appear at the top of the list because they had no deaths.However, this cannot be interpreted to mean that they had the best outcomesfor heart attack patients. Hospital A had only seven AMI cases, a very smallnumber for statistical inference. The expected number of deaths at thishospital was 1.2. While the observed number of deaths was less than theexpected number, this result could be due to chance alone and is notstatistically significant. This is shown by the p-value of 0.184, which indicates
Interpreting Death Rates
Section
3 How Not to Use These Results

Page 12 California office of Statewide Health Planning and Development
that with such a small number of cases, one would expect to observe zerodeaths 18.4% of the time just by chance.
The absence of any deaths among the 25 patients at Hospital B is moreunusual. The expected number of deaths was 3.5, and the p-value indicatesthat one would expect to observe zero deaths only 1.9% of the time, if therewere many identical hospitals. With 402 hospitals in the state included in theheart attack analysis, chance alone would account for eight hospitals (1.9%times 402 = 7.6) having such extreme values just by chance.
In the User’s Guide, both Hospital A and Hospital B would be labeled with acheck mark in a box ( ). Neither hospital was significantly different thanexpected at a p-value of 0.01, but neither had any deaths.
Note that Hospital E, which ranks fifth in this county in terms of risk-adjustedrates, is the only one that would be labeled with a star ( ) in the User’sGuide, as indicated by its lower p-value of 0.001. This illustrates theimportance of sample size in determining statistical significance. Hospitalswith relatively few patients cannot be identified as having significantly betterthan expected results, even with very few (or no) deaths, because suchresults may be due to chance.
At the other extreme of the table are Hospitals H and I with risk-adjusteddeath rates of 18.1% and 22.5% respectively. The very high death rate atHospital I was based on nine deaths among 29 patients, almost the oppositesituation as Hospital B. The observed rate was more than 50% higher thanthe expected rate (31.0% vs. 20.0%). Even so, a result this extreme or worseis likely to occur just by chance about nine times out of a hundred, asindicated by the p-value of 0.093. Even using the standard cut-off for a p-value of 0.05 or less, this is not a statistically significant result.
The dangers of ranking hospitals are illustrated by the lower and upperconfidence bounds around each hospital's risk-adjusted death rate. Theserepresent the bounds within which the true risk-adjusted rate would beexpected to lie, given the role of chance and the observed rate. For example,Hospital B's true risk-adjusted rate might have been as high as 13.7% despitehaving zero deaths. If this were the case, Hospital B would rank seventh outof the nine hospitals in this county, instead of first or second. Even ifeverything remained the same in terms of the quality of care, numbers ofpatients, and average risk among these hospitals, a change in ranking thislarge could be observed just due to chance variation. Likewise, Hospital I,with the highest risk-adjusted death rate, could have a rate as low as 12.6%,which would rank it seventh in this county. Potential problems in usingrankings are exacerbated if one considers rankings based on the entire state.For the purposes of illustration, the nine hospitals in Table 2 were selectedlargely from the extremes of the death rate distribution. In fact, the vastmajority of hospitals are in the middle of that distribution. For example,Hospital A is among dozens that would rank "first in the state" because it had
Why Ranking is Inappropriate

California Office of Statewide Health Planning and Development Page 13
no deaths, yet Hospital G, which is near the middle in the overall list, mightrank just as highly based on the lower confidence bound for its risk-adjustedrate. At the other extreme, the lower bound on the confidence interval forHospital I, 12.6%, would rank it in the top quarter of hospitals in the state. Infact, because there are so many hospitals in the state and the confidenceintervals are so wide, the range of possible ranks for many hospitals, due tochance alone, exceeds 100.
This example is meant to caution potential users of the data about the basicstatistical issues involved in using such information. It is important to notethat unusual events do happen by chance, so that a single set of resultsprovides little information. However, if "unusual" results occur repeatedly,they may bear further investigation. Thus, hospitals with "extreme" resultsthree years in a row are likely to have some consistent factors producingthose results.

Page 14 California office of Statewide Health Planning and Development
This page left blank intentionally

California Office of Statewide Health Planning and Development Page 15
It is important to recall that most statistical problems in interpreting these data arisewhen one focuses on death rates, because deaths are relatively unusual occurrences.Analyses of more frequent outcomes would be less susceptible to chance variation andpotentially more informative.
For example, one may ask whether special circumstances accounted forthe very small number of AMI patients at Hospital A. With roughly oneadmission every other month, staff may not be ready for such emergencyadmissions. If Hospital A is in a very isolated area and is the only localprovider, this low volume may be quite appropriate. The high expecteddeath rates in Hospital A suggest that Hospital A's patients may be toohigh-risk to transfer elsewhere.
Another suggestion would be to examine hospitals with unusually low orhigh expected death rates. A hospital's expected death rate is a measureof the average severity-of-illness of its patients, compared with patients atother hospitals and statewide. Hospitals with low expected death ratesmay be referring high-risk patients from their emergency departments toother hospitals with more specialized facilities. In most areas, that wouldrepresent an appropriate referral practice. Alternatively, they may befailing to report some of their patient's risk factors. Hospitals with highexpected death rates may be located near a retirement community or otherhigh-risk population, may accept especially high-risk patients from otherhospitals, or may over-report risk factors relative to other hospitals.
Examine Groups of Hospitals
One might also combine results for hospitals grouped in various ways.Grouping adds to the sample size and thus reduces the role of chancevariation in explaining unusual outcomes. However, the grouping shouldbe related to important underlying characteristics, such as the size of ahospital or its location. Hospitals also might be grouped according tohealth plan affiliations in a managed care environment. For readers'convenience, this volume includes a summary table for each county, whichgroups all of the hospitals in that county.
To illustrate grouping, consider the bottom part of Table 2, where theoutcomes for all nine hospitals in a hypothetical county are aggregated.
Examine Individual Hospital
How These Data Might Be UsedSection
4

Page 16 California office of Statewide Health Planning and Development
There were a total of 133 deaths among the 1,144 patients, while 175.1were expected given their risk factors. This results in an overall death rateof 11.6%, compared to an expected rate of 15.3%. If the number ofexpected deaths is five or more, one can use the following formula todetermine whether there is a statistically significant difference:
Z = I * (ABS(NDEAD - NEXP) - 0.5) / STDDEVwhere I = (NDEAD - NEXP) / ABS (NDEAD - NEXP)
where NDEAD is the number of patients who died, NEXP is the number ofpatients expected to die, and STDDEV is the standard deviation aroundthe observed number of deaths for the group of interest, in this case ahypothetical county. The detailed statistical tables list this standarddeviation for each model and each hospital. To calculate the standarddeviation for a group of hospitals, square the standard deviation for eachhospital in the group (using either Model A or Model B). Then add theresulting variances. Finally, take the square root of the sum of thevariances to obtain the standard deviation of the observed number ofdeaths for the entire group of hospitals.
The resulting figure, or Z-score, can be converted to a probability with theassistance of standard statistical tables for the normal distribution. Roughlyspeaking, Z-Score values greater than 1.96 or less than -1.96 indicate thata result is statistically significant at the 0.05 level. This means theseresults are likely to occur by chance less than one time out of 20. Theresulting Z-score for this set of nine hospitals is -3.66, with a negativevalue indicating that the death rate was lower than expected. Standardstatistical tables for the normal distribution indicate that a Z-score of -3.66is associated with a probability of less than 0.001. This result is likely tooccur by chance less than one out of a thousand times. Thus, overalloutcomes in this county were significantly better than expected, eventhough the hospitals in this group had worse than expected outcomes.

California Office of Statewide Health Planning and Development Page 17
There are four data files, one for each individual year 1996-1998, and one for all threeyears combined. The layout of each file is the same. These files are available onOSHPD's web page at www.oshpd.state.ca.us/hpp/chop.
COLUMN COLUMNHEADING
DESCRIPTION
A OSHPDID Hospital's OSHPD ID NumberB HOSPNAME Hospital's NameC STAPER_A Statewide Mortality Rate, Model AD STAPER_B Statewide Mortality Rate, Model BE NUMCAS_A Number of Cases Included, Model AF NUMCAS_B Number of Cases Included, Model BG NUMMOR_A Number of Observed Deaths, Model AH NUMMOR-B Number of Observed Deaths, Model BI NUMEXP_A Number of Expected Deaths, Model AJ NUMEXP_B Number of Expected Deaths, Model BK SDMOR_A Standard Deviation of Observed deaths, Model AL SDMOR_B Standard Deviation of Observed deaths, Model BM PERMOR_A Observed Mortality Rate, Model AN PERMOR_B Observed Mortality Rate, Model BO PEREXP_A Expected Mortality Rate, Model AP PEREXP_B Expected Mortality Rate, Model BQ RAMOR_A Risk-Adjusted Mortality Rate, Model AR RAMOR_B Risk-Adjusted Mortality Rate, Model BS LCI_A Lower Bound of 95% Confidence Interval, Model AT LCI_B Lower Bound of 95% Confidence Interval, Model BU UCI_A Upper Bound of 95% Confidence Interval, Model AV UCI_B Upper Bound of 95% Confidence Interval, Model BW ULPVAL_A Upper/lower P-Value, Model AX ULPVAL_B Upper/lower P-Value, Model B
Section
5 Data File Record Layout

Page 18 California office of Statewide Health Planning and Development
This page left blank intentionally

California Office of Statewide Health Planning and Development Page 19
The remainder of this volume consists of tables and graphs showing results for eachindividual hospital included in the study. Each hospital is on a separate page, listed inalphabetical order within counties. The first page of each county is a summary of theresults from all hospitals in that county.
Hospital-Specific Tables and GraphsSection
6

Page 20 California office of Statewide Health Planning and Development
This page left blank intentionally

Detailed Statistical Resultsfor Acute Myocardial Infarction Mortality
Statewide Death Rate
(%)
Number of Observed
Deaths
Number of Expected Deaths Lower Upper
Expected Death Rate
(%)
Observed Death Rate
(%)
Risk Adjusted Death Rate 95% Confidence Bounds
Number of Cases
Included
Standard Deviation of Observed
Deaths
Risk-Adjusted
Death Rate (%)
Alameda County Summary
Number of Hospitals Included
5,488 620 686.3 10.1 11.712.511.3 10.923.0All YearsModel A 12.1 11
1,829 207 226.9 9.7 12.512.411.3 11.113.21996 12.2 11
1,872 219 238.3 9.7 12.412.711.7 11.113.51997 12.0 11
1,787 194 221.1 9.2 12.012.410.9 10.613.01998 12.1 11
5,426 615 659.4 10.5 12.012.211.3 11.321.0All YearsModel B 12.1 11
1,802 204 224.2 9.8 12.412.411.3 11.112.21996 12.2 11
1,853 217 226.5 10.2 12.812.211.7 11.512.31997 12.0 11
1,771 194 208.7 9.9 12.611.811.0 11.211.91998 12.1 11
Yearly Risk Adjusted Death Rates (%)with 95% Confidence Bounds
Model A
0
10
20
30
40
50
60
1996 1997 1998
Statewide
Yearly Risk Adjusted Death Rates (%)with 95% Confidence Bounds
Model B
0
10
20
30
40
50
60
1996 1997 1998
Statewide
Office of Statewide Health Planning and DevelopmentCalifornia Hospital Outcomes Project

Detailed Statistical Resultsfor Acute Myocardial Infarction Mortality
Statewide Death Rate
(%)
Number of Observed
Deaths
Number of Expected Deaths Lower Upper
Expected Death Rate
(%)
Observed Death Rate
(%)
Risk Adjusted Death Rate 95% Confidence Bounds
Number of Cases
Included
Standard Deviation of Observed
Deaths
Risk-Adjusted
Death Rate (%)
Probability This Rate
Occurred by Chance
Alameda County: Alameda County Medical Center
302 40 36.9 9.7 16.512.213.2 0.30713.15.3All YearsModel A 12.08912
101 12 11.4 6.5 19.011.311.9 0.47912.83.01996 12.17742
119 19 15.7 9.4 19.713.216.0 0.20114.63.41997 12.02517
82 9 9.8 4.6 17.612.011.0 0.46911.12.71998 12.06405
297 40 51.1 7.0 11.917.213.5 0.0209.55.2All YearsModel B 12.10683
96 12 18.7 3.9 11.719.512.5 0.0187.83.01996 12.18490
119 19 21.4 6.9 14.418.016.0 0.29310.73.41997 12.03332
82 9 11.0 4.3 15.513.411.0 0.2869.92.61998 12.10273
Yearly Risk Adjusted Death Rates (%)with 95% Confidence Bounds
Model A
0
10
20
30
40
50
60
70
80
90
100
1996 1997 1998
Statewide
Yearly Risk Adjusted Death Rates (%)with 95% Confidence Bounds
Model B
0
10
20
30
40
50
60
70
80
90
100
1996 1997 1998
Statewide
‡ Hospital sent comment letter Office of Statewide Health Planning and DevelopmentCalifornia Hospital Outcomes Project
Page 22

Detailed Statistical Resultsfor Acute Myocardial Infarction Mortality
Statewide Death Rate
(%)
Number of Observed
Deaths
Number of Expected Deaths Lower Upper
Expected Death Rate
(%)
Observed Death Rate
(%)
Risk Adjusted Death Rate 95% Confidence Bounds
Number of Cases
Included
Standard Deviation of Observed
Deaths
Risk-Adjusted
Death Rate (%)
Probability This Rate
Occurred by Chance
Alameda County: Alameda Hospital
296 39 39.4 8.6 15.313.313.2 0.51112.05.6All YearsModel A 12.08912
98 14 12.9 7.3 19.113.114.3 0.41213.23.21996 12.17742
102 5 13.8 0.0 10.013.54.9 0.0034.43.31997 12.02517
96 20 12.8 13.0 24.813.320.8 0.02118.93.21998 12.06405
290 39 32.9 10.8 17.911.313.4 0.12914.44.9All YearsModel B 12.10683
95 14 11.5 8.8 20.912.114.7 0.23814.92.91996 12.18490
101 5 9.9 0.0 12.89.85.0 0.0526.12.81997 12.03332
94 20 11.5 15.2 26.912.221.3 0.00421.12.81998 12.10273
Yearly Risk Adjusted Death Rates (%)with 95% Confidence Bounds
Model A
0
10
20
30
40
50
60
70
80
90
100
1996 1997 1998
Statewide
Yearly Risk Adjusted Death Rates (%)with 95% Confidence Bounds
Model B
0
10
20
30
40
50
60
70
80
90
100
1996 1997 1998
Statewide
‡ Hospital sent comment letter Office of Statewide Health Planning and DevelopmentCalifornia Hospital Outcomes Project
Page 23

Detailed Statistical Resultsfor Acute Myocardial Infarction Mortality
Statewide Death Rate
(%)
Number of Observed
Deaths
Number of Expected Deaths Lower Upper
Expected Death Rate
(%)
Observed Death Rate
(%)
Risk Adjusted Death Rate 95% Confidence Bounds
Number of Cases
Included
Standard Deviation of Observed
Deaths
Risk-Adjusted
Death Rate (%)
Probability This Rate
Occurred by Chance
Alameda County: Alta Bates Medical Center - Ashby Campus
512 71 84.2 8.0 12.416.413.9 0.05110.27.9All YearsModel A 12.08912
133 15 23.2 3.7 12.117.411.3 0.0257.94.11996 12.17742
207 30 34.3 7.1 14.016.614.5 0.23010.55.11997 12.02517
172 26 26.7 7.8 15.715.515.1 0.49211.84.41998 12.06405
501 71 78.4 8.8 13.115.714.2 0.16911.07.2All YearsModel B 12.10683
130 15 21.4 4.3 12.716.511.5 0.0538.53.81996 12.18490
204 30 31.5 8.0 14.915.514.7 0.41911.54.61997 12.03332
167 26 25.5 8.6 16.115.215.6 0.48912.44.11998 12.10273
Yearly Risk Adjusted Death Rates (%)with 95% Confidence Bounds
Model A
0
10
20
30
40
50
60
70
80
90
100
1996 1997 1998
Statewide
Yearly Risk Adjusted Death Rates (%)with 95% Confidence Bounds
Model B
0
10
20
30
40
50
60
70
80
90
100
1996 1997 1998
Statewide
‡ Hospital sent comment letter Office of Statewide Health Planning and DevelopmentCalifornia Hospital Outcomes Project
Page 24

Detailed Statistical Resultsfor Acute Myocardial Infarction Mortality
Statewide Death Rate
(%)
Number of Observed
Deaths
Number of Expected Deaths Lower Upper
Expected Death Rate
(%)
Observed Death Rate
(%)
Risk Adjusted Death Rate 95% Confidence Bounds
Number of Cases
Included
Standard Deviation of Observed
Deaths
Risk-Adjusted
Death Rate (%)
Probability This Rate
Occurred by Chance
Alameda County: Alta Bates Summit Medical Center - Summit Campus
750 108 98.5 11.1 15.413.114.4 0.15213.38.8All YearsModel A 12.08912
260 36 33.7 9.3 16.613.013.8 0.36113.05.21996 12.17742
247 38 32.0 10.6 18.012.915.4 0.13714.35.01997 12.02517
243 34 32.7 8.9 16.213.514.0 0.43212.55.01998 12.06405
747 108 99.5 11.2 15.113.314.5 0.16413.18.1All YearsModel B 12.10683
258 36 34.0 9.5 16.313.214.0 0.37012.94.81996 12.18490
246 38 31.6 11.0 17.912.915.4 0.10414.54.61997 12.03332
243 34 33.9 8.9 15.414.014.0 0.53012.14.61998 12.10273
Yearly Risk Adjusted Death Rates (%)with 95% Confidence Bounds
Model A
0
10
20
30
40
50
60
70
80
90
100
1996 1997 1998
Statewide
Yearly Risk Adjusted Death Rates (%)with 95% Confidence Bounds
Model B
0
10
20
30
40
50
60
70
80
90
100
1996 1997 1998
Statewide
‡ Hospital sent comment letter Office of Statewide Health Planning and DevelopmentCalifornia Hospital Outcomes Project
Page 25

Detailed Statistical Resultsfor Acute Myocardial Infarction Mortality
Statewide Death Rate
(%)
Number of Observed
Deaths
Number of Expected Deaths Lower Upper
Expected Death Rate
(%)
Observed Death Rate
(%)
Risk Adjusted Death Rate 95% Confidence Bounds
Number of Cases
Included
Standard Deviation of Observed
Deaths
Risk-Adjusted
Death Rate (%)
Probability This Rate
Occurred by Chance
Alameda County: Eden Medical Center
314 43 40.3 9.6 16.212.813.7 0.33912.95.6All YearsModel A 12.08912
124 14 17.5 4.8 14.714.111.3 0.2079.73.61996 12.17742
105 16 13.1 8.9 20.512.515.2 0.22214.73.21997 12.02517
85 13 9.7 9.4 23.011.415.3 0.15716.22.81998 12.06405
314 43 34.6 11.6 18.511.013.7 0.06115.05.0All YearsModel B 12.10683
124 14 15.8 5.9 15.712.811.3 0.34910.83.31996 12.18490
105 16 11.2 11.1 23.310.715.2 0.07217.22.91997 12.03332
85 13 7.6 12.9 28.58.915.3 0.03120.72.51998 12.10273
Yearly Risk Adjusted Death Rates (%)with 95% Confidence Bounds
Model A
0
10
20
30
40
50
60
70
80
90
100
1996 1997 1998
Statewide
Yearly Risk Adjusted Death Rates (%)with 95% Confidence Bounds
Model B
0
10
20
30
40
50
60
70
80
90
100
1996 1997 1998
Statewide
‡ Hospital sent comment letter Office of Statewide Health Planning and DevelopmentCalifornia Hospital Outcomes Project
Page 26

Detailed Statistical Resultsfor Acute Myocardial Infarction Mortality
Statewide Death Rate
(%)
Number of Observed
Deaths
Number of Expected Deaths Lower Upper
Expected Death Rate
(%)
Observed Death Rate
(%)
Risk Adjusted Death Rate 95% Confidence Bounds
Number of Cases
Included
Standard Deviation of Observed
Deaths
Risk-Adjusted
Death Rate (%)
Probability This Rate
Occurred by Chance
Alameda County: Kaiser Foundation Hospital - Hayward
984 73 114.8 5.8 9.611.77.4 0.0007.79.3All YearsModel A 12.08912
305 20 33.4 3.6 10.910.96.6 0.0047.35.11996 12.17742
348 29 42.2 5.1 11.412.18.3 0.0098.35.61997 12.02517
331 24 39.2 4.1 10.711.87.3 0.0027.45.41998 12.06405
964 72 105.8 6.3 10.111.07.5 0.0008.28.5All YearsModel B 12.10683
298 20 31.7 4.1 11.210.66.7 0.0067.74.71996 12.18490
338 28 36.9 6.0 12.310.98.3 0.0439.15.01997 12.03332
328 24 37.2 4.6 11.011.47.3 0.0047.85.11998 12.10273
Yearly Risk Adjusted Death Rates (%)with 95% Confidence Bounds
Model A
0
10
20
30
40
50
60
70
80
90
100
1996 1997 1998
Statewide
Yearly Risk Adjusted Death Rates (%)with 95% Confidence Bounds
Model B
0
10
20
30
40
50
60
70
80
90
100
1996 1997 1998
Statewide
‡ Hospital sent comment letter Office of Statewide Health Planning and DevelopmentCalifornia Hospital Outcomes Project
Page 27

Detailed Statistical Resultsfor Acute Myocardial Infarction Mortality
Statewide Death Rate
(%)
Number of Observed
Deaths
Number of Expected Deaths Lower Upper
Expected Death Rate
(%)
Observed Death Rate
(%)
Risk Adjusted Death Rate 95% Confidence Bounds
Number of Cases
Included
Standard Deviation of Observed
Deaths
Risk-Adjusted
Death Rate (%)
Probability This Rate
Occurred by Chance
Alameda County: Kaiser Foundation Hospital - Oakland (East Bay Medical Center)
575 39 70.4 4.2 9.212.36.8 0.0006.77.3All YearsModel A 12.08912
206 11 22.5 1.5 10.410.95.3 0.0035.94.21996 12.17742
161 15 20.9 4.2 13.113.09.3 0.0818.64.01997 12.02517
208 13 27.0 1.9 9.813.06.3 0.0015.84.51998 12.06405
575 39 57.4 5.6 10.910.06.8 0.0028.26.4All YearsModel B 12.10683
206 11 19.4 2.5 11.39.45.3 0.0106.93.61996 12.18490
161 15 16.5 5.9 15.910.39.3 0.39410.93.51997 12.03332
208 13 21.5 2.9 11.710.36.3 0.0187.34.01998 12.10273
Yearly Risk Adjusted Death Rates (%)with 95% Confidence Bounds
Model A
0
10
20
30
40
50
60
70
80
90
100
1996 1997 1998
Statewide
Yearly Risk Adjusted Death Rates (%)with 95% Confidence Bounds
Model B
0
10
20
30
40
50
60
70
80
90
100
1996 1997 1998
Statewide
‡ Hospital sent comment letter Office of Statewide Health Planning and DevelopmentCalifornia Hospital Outcomes Project
Page 28

Detailed Statistical Resultsfor Acute Myocardial Infarction Mortality
Statewide Death Rate
(%)
Number of Observed
Deaths
Number of Expected Deaths Lower Upper
Expected Death Rate
(%)
Observed Death Rate
(%)
Risk Adjusted Death Rate 95% Confidence Bounds
Number of Cases
Included
Standard Deviation of Observed
Deaths
Risk-Adjusted
Death Rate (%)
Probability This Rate
Occurred by Chance
Alameda County: San Leandro Hospital‡
337 66 48.7 13.4 19.314.419.6 0.00416.46.1All YearsModel A 12.08912
109 20 14.5 11.3 22.213.318.3 0.07116.83.31996 12.17742
128 28 20.4 12.0 21.015.921.9 0.03816.53.91997 12.02517
100 18 13.8 10.2 21.313.818.0 0.12615.83.21998 12.06405
335 66 54.8 12.1 17.016.419.7 0.03314.65.7All YearsModel B 12.10683
107 20 16.5 10.2 19.315.418.7 0.17014.73.11996 12.18490
128 28 24.0 10.4 17.718.721.9 0.17114.03.71997 12.03332
100 18 14.3 10.2 20.214.318.0 0.14415.23.01998 12.10273
Yearly Risk Adjusted Death Rates (%)with 95% Confidence Bounds
Model A
0
10
20
30
40
50
60
70
80
90
100
1996 1997 1998
Statewide
Yearly Risk Adjusted Death Rates (%)with 95% Confidence Bounds
Model B
0
10
20
30
40
50
60
70
80
90
100
1996 1997 1998
Statewide
‡ Hospital sent comment letter Office of Statewide Health Planning and DevelopmentCalifornia Hospital Outcomes Project
Page 29

Detailed Statistical Resultsfor Acute Myocardial Infarction Mortality
Statewide Death Rate
(%)
Number of Observed
Deaths
Number of Expected Deaths Lower Upper
Expected Death Rate
(%)
Observed Death Rate
(%)
Risk Adjusted Death Rate 95% Confidence Bounds
Number of Cases
Included
Standard Deviation of Observed
Deaths
Risk-Adjusted
Death Rate (%)
Probability This Rate
Occurred by Chance
Alameda County: St. Rose Hospital
263 24 32.2 5.3 12.712.39.1 0.0579.05.0All YearsModel A 12.08912
94 9 12.8 2.8 14.413.69.6 0.1438.63.11996 12.17742
89 7 9.3 2.1 16.110.47.9 0.2679.12.71997 12.02517
80 8 10.2 2.9 16.012.810.0 0.2829.52.81998 12.06405
262 24 30.3 6.0 13.211.69.2 0.1009.64.6All YearsModel B 12.10683
94 9 11.9 3.6 14.812.79.6 0.1929.22.81996 12.18490
88 7 8.7 2.8 16.59.98.0 0.3229.62.51997 12.03332
80 8 9.6 3.7 16.512.010.0 0.34410.12.61998 12.10273
Yearly Risk Adjusted Death Rates (%)with 95% Confidence Bounds
Model A
0
10
20
30
40
50
60
70
80
90
100
1996 1997 1998
Statewide
Yearly Risk Adjusted Death Rates (%)with 95% Confidence Bounds
Model B
0
10
20
30
40
50
60
70
80
90
100
1996 1997 1998
Statewide
‡ Hospital sent comment letter Office of Statewide Health Planning and DevelopmentCalifornia Hospital Outcomes Project
Page 30

Detailed Statistical Resultsfor Acute Myocardial Infarction Mortality
Statewide Death Rate
(%)
Number of Observed
Deaths
Number of Expected Deaths Lower Upper
Expected Death Rate
(%)
Observed Death Rate
(%)
Risk Adjusted Death Rate 95% Confidence Bounds
Number of Cases
Included
Standard Deviation of Observed
Deaths
Risk-Adjusted
Death Rate (%)
Probability This Rate
Occurred by Chance
Alameda County: Valley Memorial Hospital
498 53 49.3 10.0 16.09.910.6 0.30313.06.3All YearsModel A 12.08912
145 23 16.3 11.9 22.411.215.9 0.04617.23.61996 12.17742
158 13 13.9 5.5 17.08.88.2 0.46611.23.41997 12.02517
195 17 19.1 5.9 15.59.88.7 0.34610.73.91998 12.06405
487 49 45.0 10.2 16.29.210.1 0.26513.25.7All YearsModel B 12.10683
141 20 14.7 11.3 21.910.414.2 0.07216.63.21996 12.18490
155 12 12.6 5.7 17.28.17.7 0.49911.53.11997 12.03332
191 17 17.7 6.8 16.49.38.9 0.48911.63.61998 12.10273
Yearly Risk Adjusted Death Rates (%)with 95% Confidence Bounds
Model A
0
10
20
30
40
50
60
70
80
90
100
1996 1997 1998
Statewide
Yearly Risk Adjusted Death Rates (%)with 95% Confidence Bounds
Model B
0
10
20
30
40
50
60
70
80
90
100
1996 1997 1998
Statewide
‡ Hospital sent comment letter Office of Statewide Health Planning and DevelopmentCalifornia Hospital Outcomes Project
Page 31

Detailed Statistical Resultsfor Acute Myocardial Infarction Mortality
Statewide Death Rate
(%)
Number of Observed
Deaths
Number of Expected Deaths Lower Upper
Expected Death Rate
(%)
Observed Death Rate
(%)
Risk Adjusted Death Rate 95% Confidence Bounds
Number of Cases
Included
Standard Deviation of Observed
Deaths
Risk-Adjusted
Death Rate (%)
Probability This Rate
Occurred by Chance
Alameda County: Washington Hospital Health Care System
657 64 71.6 8.3 13.310.99.7 0.17210.87.5All YearsModel A 12.08912
254 33 28.7 10.1 18.011.313.0 0.20614.04.71996 12.17742
208 19 22.8 5.6 14.411.09.1 0.22110.04.21997 12.02517
195 12 20.1 2.5 11.910.36.2 0.0237.24.01998 12.06405
654 64 69.6 8.8 13.510.69.8 0.23211.16.8All YearsModel B 12.10683
253 33 28.5 10.5 17.811.313.0 0.17714.14.41996 12.18490
208 19 22.2 6.3 14.310.79.1 0.24410.33.81997 12.03332
193 12 18.9 3.1 12.39.86.2 0.0357.73.71998 12.10273
Yearly Risk Adjusted Death Rates (%)with 95% Confidence Bounds
Model A
0
10
20
30
40
50
60
70
80
90
100
1996 1997 1998
Statewide
Yearly Risk Adjusted Death Rates (%)with 95% Confidence Bounds
Model B
0
10
20
30
40
50
60
70
80
90
100
1996 1997 1998
Statewide
‡ Hospital sent comment letter Office of Statewide Health Planning and DevelopmentCalifornia Hospital Outcomes Project
Page 32

Detailed Statistical Resultsfor Acute Myocardial Infarction Mortality
Statewide Death Rate
(%)
Number of Observed
Deaths
Number of Expected Deaths Lower Upper
Expected Death Rate
(%)
Observed Death Rate
(%)
Risk Adjusted Death Rate 95% Confidence Bounds
Number of Cases
Included
Standard Deviation of Observed
Deaths
Risk-Adjusted
Death Rate (%)
Amador County Summary
Number of Hospitals Included
203 28 24.0 9.8 18.411.813.8 14.14.4All YearsModel A 12.1 1
84 10 9.2 6.2 20.410.911.9 13.32.71996 12.2 1
60 11 7.2 10.6 26.212.018.3 18.42.41997 12.0 1
59 7 7.7 3.5 18.613.011.9 11.02.41998 12.1 1
202 28 26.0 9.2 16.812.913.9 13.04.2All YearsModel B 12.1 1
84 10 11.0 5.3 16.813.111.9 11.02.71996 12.2 1
59 11 7.8 10.1 23.813.218.6 17.02.31997 12.0 1
59 7 7.2 4.3 19.312.211.9 11.82.31998 12.1 1
Yearly Risk Adjusted Death Rates (%)with 95% Confidence Bounds
Model A
0
10
20
30
40
50
60
1996 1997 1998
Statewide
Yearly Risk Adjusted Death Rates (%)with 95% Confidence Bounds
Model B
0
10
20
30
40
50
60
1996 1997 1998
Statewide
Office of Statewide Health Planning and DevelopmentCalifornia Hospital Outcomes Project

Detailed Statistical Resultsfor Acute Myocardial Infarction Mortality
Statewide Death Rate
(%)
Number of Observed
Deaths
Number of Expected Deaths Lower Upper
Expected Death Rate
(%)
Observed Death Rate
(%)
Risk Adjusted Death Rate 95% Confidence Bounds
Number of Cases
Included
Standard Deviation of Observed
Deaths
Risk-Adjusted
Death Rate (%)
Probability This Rate
Occurred by Chance
Amador County: Sutter Amador Hospital
203 28 24.0 9.8 18.411.813.8 0.21014.14.4All YearsModel A 12.08912
84 10 9.2 6.2 20.410.911.9 0.43613.32.71996 12.17742
60 11 7.2 10.6 26.212.018.3 0.08818.42.41997 12.02517
59 7 7.7 3.5 18.613.011.9 0.49211.02.41998 12.06405
202 28 26.0 9.2 16.812.913.9 0.35613.04.2All YearsModel B 12.10683
84 10 11.0 5.3 16.813.111.9 0.43011.02.71996 12.18490
59 11 7.8 10.1 23.813.218.6 0.11917.02.31997 12.03332
59 7 7.2 4.3 19.312.211.9 0.57111.82.31998 12.10273
Yearly Risk Adjusted Death Rates (%)with 95% Confidence Bounds
Model A
0
10
20
30
40
50
60
70
80
90
100
1996 1997 1998
Statewide
Yearly Risk Adjusted Death Rates (%)with 95% Confidence Bounds
Model B
0
10
20
30
40
50
60
70
80
90
100
1996 1997 1998
Statewide
‡ Hospital sent comment letter Office of Statewide Health Planning and DevelopmentCalifornia Hospital Outcomes Project
Page 34

Detailed Statistical Resultsfor Acute Myocardial Infarction Mortality
Statewide Death Rate
(%)
Number of Observed
Deaths
Number of Expected Deaths Lower Upper
Expected Death Rate
(%)
Observed Death Rate
(%)
Risk Adjusted Death Rate 95% Confidence Bounds
Number of Cases
Included
Standard Deviation of Observed
Deaths
Risk-Adjusted
Death Rate (%)
Butte County Summary
Number of Hospitals Included
1,583 201 204.8 10.4 13.312.912.7 11.912.6All YearsModel A 12.1 4
474 53 58.8 8.2 13.712.411.2 11.06.81996 12.2 4
532 60 70.3 7.8 12.713.211.3 10.37.31997 12.0 4
577 88 75.7 11.6 16.413.115.3 14.07.61998 12.1 4
1,580 201 194.2 11.1 13.912.312.7 12.511.5All YearsModel B 12.1 4
474 53 56.5 8.8 14.111.911.2 11.46.21996 12.2 4
532 60 63.0 9.0 13.911.811.3 11.56.61997 12.0 4
574 88 74.7 12.0 16.513.015.3 14.37.01998 12.1 4
Yearly Risk Adjusted Death Rates (%)with 95% Confidence Bounds
Model A
0
10
20
30
40
50
60
1996 1997 1998
Statewide
Yearly Risk Adjusted Death Rates (%)with 95% Confidence Bounds
Model B
0
10
20
30
40
50
60
1996 1997 1998
Statewide
Office of Statewide Health Planning and DevelopmentCalifornia Hospital Outcomes Project

Detailed Statistical Resultsfor Acute Myocardial Infarction Mortality
Statewide Death Rate
(%)
Number of Observed
Deaths
Number of Expected Deaths Lower Upper
Expected Death Rate
(%)
Observed Death Rate
(%)
Risk Adjusted Death Rate 95% Confidence Bounds
Number of Cases
Included
Standard Deviation of Observed
Deaths
Risk-Adjusted
Death Rate (%)
Probability This Rate
Occurred by Chance
Butte County: Biggs Gridley Memorial Hospital
27 3 5.3 0.0 15.519.811.1 0.1756.82.0All YearsModel A 12.08912
13 1 2.5 0.0 17.519.27.7 0.2334.91.31996 12.17742
14 2 2.8 0.0 20.520.314.3 0.4298.41.51997 12.02517
1998 Excluded
27 3 4.3 0.0 18.415.811.1 0.3498.51.8All YearsModel B 12.10683
13 1 1.9 0.0 21.214.87.7 0.3896.31.21996 12.18490
14 2 2.3 0.0 23.616.714.3 0.57510.31.31997 12.03332
1998 Excluded
Yearly Risk Adjusted Death Rates (%)with 95% Confidence Bounds
Model A
0
10
20
30
40
50
60
70
80
90
100
1996 1997 1998
Statewide
Yearly Risk Adjusted Death Rates (%)with 95% Confidence Bounds
Model B
0
10
20
30
40
50
60
70
80
90
100
1996 1997 1998
Statewide
‡ Hospital sent comment letter Office of Statewide Health Planning and DevelopmentCalifornia Hospital Outcomes Project
Page 36

Detailed Statistical Resultsfor Acute Myocardial Infarction Mortality
Statewide Death Rate
(%)
Number of Observed
Deaths
Number of Expected Deaths Lower Upper
Expected Death Rate
(%)
Observed Death Rate
(%)
Risk Adjusted Death Rate 95% Confidence Bounds
Number of Cases
Included
Standard Deviation of Observed
Deaths
Risk-Adjusted
Death Rate (%)
Probability This Rate
Occurred by Chance
Butte County: Enloe Medical Center - Esplanade
818 96 103.8 9.1 13.212.711.7 0.20911.28.9All YearsModel A 12.08912
232 21 26.6 5.5 13.811.59.1 0.1339.64.61996 12.17742
258 28 33.9 6.4 13.513.110.9 0.1449.95.11997 12.02517
328 47 43.3 9.9 16.213.214.3 0.28713.15.81998 12.06405
816 96 97.8 9.9 13.912.011.8 0.44311.98.2All YearsModel B 12.10683
232 21 26.9 5.7 13.311.69.1 0.0999.54.21996 12.18490
258 28 29.8 7.7 14.911.510.9 0.39611.34.61997 12.03332
326 47 41.0 10.8 16.912.614.4 0.14813.95.21998 12.10273
Yearly Risk Adjusted Death Rates (%)with 95% Confidence Bounds
Model A
0
10
20
30
40
50
60
70
80
90
100
1996 1997 1998
Statewide
Yearly Risk Adjusted Death Rates (%)with 95% Confidence Bounds
Model B
0
10
20
30
40
50
60
70
80
90
100
1996 1997 1998
Statewide
‡ Hospital sent comment letter Office of Statewide Health Planning and DevelopmentCalifornia Hospital Outcomes Project
Page 37

Detailed Statistical Resultsfor Acute Myocardial Infarction Mortality
Statewide Death Rate
(%)
Number of Observed
Deaths
Number of Expected Deaths Lower Upper
Expected Death Rate
(%)
Observed Death Rate
(%)
Risk Adjusted Death Rate 95% Confidence Bounds
Number of Cases
Included
Standard Deviation of Observed
Deaths
Risk-Adjusted
Death Rate (%)
Probability This Rate
Occurred by Chance
Butte County: Feather River Hospital
302 36 42.3 7.1 13.514.011.9 0.15610.35.7All YearsModel A 12.08912
89 13 11.3 7.7 20.312.714.6 0.33214.03.01996 12.17742
109 9 15.2 1.8 12.414.08.3 0.0427.13.41997 12.02517
104 14 15.8 5.5 15.915.213.5 0.36710.73.51998 12.06405
301 36 38.6 8.1 14.512.812.0 0.35011.35.2All YearsModel B 12.10683
89 13 9.9 9.6 22.311.214.6 0.16316.02.61996 12.18490
109 9 13.0 2.7 14.011.98.3 0.1288.33.11997 12.03332
103 14 15.7 6.0 15.715.213.6 0.36610.83.21998 12.10273
Yearly Risk Adjusted Death Rates (%)with 95% Confidence Bounds
Model A
0
10
20
30
40
50
60
70
80
90
100
1996 1997 1998
Statewide
Yearly Risk Adjusted Death Rates (%)with 95% Confidence Bounds
Model B
0
10
20
30
40
50
60
70
80
90
100
1996 1997 1998
Statewide
‡ Hospital sent comment letter Office of Statewide Health Planning and DevelopmentCalifornia Hospital Outcomes Project
Page 38

Detailed Statistical Resultsfor Acute Myocardial Infarction Mortality
Statewide Death Rate
(%)
Number of Observed
Deaths
Number of Expected Deaths Lower Upper
Expected Death Rate
(%)
Observed Death Rate
(%)
Risk Adjusted Death Rate 95% Confidence Bounds
Number of Cases
Included
Standard Deviation of Observed
Deaths
Risk-Adjusted
Death Rate (%)
Probability This Rate
Occurred by Chance
Butte County: Oroville Hospital
436 66 53.4 12.1 17.812.315.1 0.03214.96.4All YearsModel A 12.08912
140 18 18.5 7.0 16.813.212.9 0.51211.93.81996 12.17742
151 21 18.3 9.0 18.612.113.9 0.27613.83.71997 12.02517
145 27 16.6 14.5 24.811.418.6 0.00519.63.61998 12.06405
436 66 53.6 12.3 17.612.315.1 0.02514.96.0All YearsModel B 12.10683
140 18 17.7 7.6 17.112.712.9 0.51512.43.51996 12.18490
151 21 17.8 9.7 18.611.813.9 0.21014.23.41997 12.03332
145 27 18.0 13.6 22.712.418.6 0.00918.13.51998 12.10273
Yearly Risk Adjusted Death Rates (%)with 95% Confidence Bounds
Model A
0
10
20
30
40
50
60
70
80
90
100
1996 1997 1998
Statewide
Yearly Risk Adjusted Death Rates (%)with 95% Confidence Bounds
Model B
0
10
20
30
40
50
60
70
80
90
100
1996 1997 1998
Statewide
‡ Hospital sent comment letter Office of Statewide Health Planning and DevelopmentCalifornia Hospital Outcomes Project
Page 39

Detailed Statistical Resultsfor Acute Myocardial Infarction Mortality
Statewide Death Rate
(%)
Number of Observed
Deaths
Number of Expected Deaths Lower Upper
Expected Death Rate
(%)
Observed Death Rate
(%)
Risk Adjusted Death Rate 95% Confidence Bounds
Number of Cases
Included
Standard Deviation of Observed
Deaths
Risk-Adjusted
Death Rate (%)
Calaveras County Summary
Number of Hospitals Included
136 11 15.8 3.1 13.711.68.1 8.43.5All YearsModel A 12.1 1
31 3 3.7 0.0 21.011.99.7 9.91.71996 12.2 1
39 4 4.7 0.7 19.911.910.3 10.31.91997 12.0 1
66 4 7.5 0.0 14.211.36.1 6.52.41998 12.1 1
135 11 12.1 5.0 17.18.98.1 11.13.1All YearsModel B 12.1 1
31 3 2.5 0.7 28.18.29.7 14.41.51996 12.2 1
39 4 3.4 2.7 25.78.710.3 14.21.71997 12.0 1
65 4 6.1 0.0 16.39.46.2 7.92.21998 12.1 1
Yearly Risk Adjusted Death Rates (%)with 95% Confidence Bounds
Model A
0
10
20
30
40
50
60
1996 1997 1998
Statewide
Yearly Risk Adjusted Death Rates (%)with 95% Confidence Bounds
Model B
0
10
20
30
40
50
60
1996 1997 1998
Statewide
Office of Statewide Health Planning and DevelopmentCalifornia Hospital Outcomes Project

Detailed Statistical Resultsfor Acute Myocardial Infarction Mortality
Statewide Death Rate
(%)
Number of Observed
Deaths
Number of Expected Deaths Lower Upper
Expected Death Rate
(%)
Observed Death Rate
(%)
Risk Adjusted Death Rate 95% Confidence Bounds
Number of Cases
Included
Standard Deviation of Observed
Deaths
Risk-Adjusted
Death Rate (%)
Probability This Rate
Occurred by Chance
Calaveras County: Mark Twain St. Joseph's Hospital
136 11 15.8 3.1 13.711.68.1 0.1088.43.5All YearsModel A 12.08912
31 3 3.7 0.0 21.011.99.7 0.4789.91.71996 12.17742
39 4 4.7 0.7 19.911.910.3 0.48910.31.91997 12.02517
66 4 7.5 0.0 14.211.36.1 0.1076.52.41998 12.06405
135 11 12.1 5.0 17.18.98.1 0.44311.13.1All YearsModel B 12.10683
31 3 2.5 0.7 28.18.29.7 0.47714.41.51996 12.18490
39 4 3.4 2.7 25.78.710.3 0.44914.21.71997 12.03332
65 4 6.1 0.0 16.39.46.2 0.2347.92.21998 12.10273
Yearly Risk Adjusted Death Rates (%)with 95% Confidence Bounds
Model A
0
10
20
30
40
50
60
70
80
90
100
1996 1997 1998
Statewide
Yearly Risk Adjusted Death Rates (%)with 95% Confidence Bounds
Model B
0
10
20
30
40
50
60
70
80
90
100
1996 1997 1998
Statewide
‡ Hospital sent comment letter Office of Statewide Health Planning and DevelopmentCalifornia Hospital Outcomes Project

Detailed Statistical Resultsfor Acute Myocardial Infarction Mortality
Statewide Death Rate
(%)
Number of Observed
Deaths
Number of Expected Deaths Lower Upper
Expected Death Rate
(%)
Observed Death Rate
(%)
Risk Adjusted Death Rate 95% Confidence Bounds
Number of Cases
Included
Standard Deviation of Observed
Deaths
Risk-Adjusted
Death Rate (%)
Colusa County Summary
Number of Hospitals Included
32 2 3.7 0.0 17.811.56.3 6.61.7All YearsModel A 12.1 1
1996 12.2 0
9 1 1.0 0.0 34.710.711.1 12.50.91997 12.0 1
23 1 2.7 0.0 17.411.84.3 4.51.51998 12.1 1
32 2 2.5 0.0 23.87.86.3 9.71.5All YearsModel B 12.1 1
1996 12.2 0
9 1 0.6 0.0 46.67.111.1 18.80.81997 12.0 1
23 1 1.8 0.0 22.88.04.3 6.51.31998 12.1 1
Yearly Risk Adjusted Death Rates (%)with 95% Confidence Bounds
Model A
0
10
20
30
40
50
60
1996 1997 1998
Statewide
Yearly Risk Adjusted Death Rates (%)with 95% Confidence Bounds
Model B
0
10
20
30
40
50
60
1996 1997 1998
Statewide
Office of Statewide Health Planning and DevelopmentCalifornia Hospital Outcomes Project

Detailed Statistical Resultsfor Acute Myocardial Infarction Mortality
Statewide Death Rate
(%)
Number of Observed
Deaths
Number of Expected Deaths Lower Upper
Expected Death Rate
(%)
Observed Death Rate
(%)
Risk Adjusted Death Rate 95% Confidence Bounds
Number of Cases
Included
Standard Deviation of Observed
Deaths
Risk-Adjusted
Death Rate (%)
Probability This Rate
Occurred by Chance
Colusa County: Colusa Community Hospital
32 2 3.7 0.0 17.811.56.3 0.2646.61.7All YearsModel A 12.08912
1996 Excluded
9 1 1.0 0.0 34.710.711.1 0.64712.50.91997 12.02517
23 1 2.7 0.0 17.411.84.3 0.2164.51.51998 12.06405
32 2 2.5 0.0 23.87.86.3 0.5399.71.5All YearsModel B 12.10683
1996 Excluded
9 1 0.6 0.0 46.67.111.1 0.49318.80.81997 12.03332
23 1 1.8 0.0 22.88.04.3 0.4316.51.31998 12.10273
Yearly Risk Adjusted Death Rates (%)with 95% Confidence Bounds
Model A
0
10
20
30
40
50
60
70
80
90
100
1996 1997 1998
Statewide
Yearly Risk Adjusted Death Rates (%)with 95% Confidence Bounds
Model B
0
10
20
30
40
50
60
70
80
90
100
1996 1997 1998
Statewide
‡ Hospital sent comment letter Office of Statewide Health Planning and DevelopmentCalifornia Hospital Outcomes Project
Page 43

Detailed Statistical Resultsfor Acute Myocardial Infarction Mortality
Statewide Death Rate
(%)
Number of Observed
Deaths
Number of Expected Deaths Lower Upper
Expected Death Rate
(%)
Observed Death Rate
(%)
Risk Adjusted Death Rate 95% Confidence Bounds
Number of Cases
Included
Standard Deviation of Observed
Deaths
Risk-Adjusted
Death Rate (%)
Contra Costa County Summary
Number of Hospitals Included
3,862 428 410.5 11.6 13.610.611.1 12.618.1All YearsModel A 12.1 9
1,295 152 142.0 11.3 14.811.011.7 13.010.61996 12.2 9
1,306 134 130.9 10.5 14.210.010.3 12.310.31997 12.0 9
1,261 142 137.6 10.7 14.210.911.3 12.510.51998 12.1 9
3,834 428 395.7 12.1 14.110.311.2 13.116.4All YearsModel B 12.1 9
1,286 152 133.9 12.1 15.510.411.8 13.89.51996 12.2 9
1,291 134 131.6 10.6 13.910.210.4 12.39.41997 12.0 9
1,257 142 130.2 11.5 14.910.411.3 13.29.61998 12.1 9
Yearly Risk Adjusted Death Rates (%)with 95% Confidence Bounds
Model A
0
10
20
30
40
50
60
1996 1997 1998
Statewide
Yearly Risk Adjusted Death Rates (%)with 95% Confidence Bounds
Model B
0
10
20
30
40
50
60
1996 1997 1998
Statewide
Office of Statewide Health Planning and DevelopmentCalifornia Hospital Outcomes Project

Detailed Statistical Resultsfor Acute Myocardial Infarction Mortality
Statewide Death Rate
(%)
Number of Observed
Deaths
Number of Expected Deaths Lower Upper
Expected Death Rate
(%)
Observed Death Rate
(%)
Risk Adjusted Death Rate 95% Confidence Bounds
Number of Cases
Included
Standard Deviation of Observed
Deaths
Risk-Adjusted
Death Rate (%)
Probability This Rate
Occurred by Chance
Contra Costa County: Contra Costa Regional Medical Center
109 20 11.7 14.6 26.910.718.3 0.00720.73.0All YearsModel A 12.08912
38 5 3.6 6.0 28.19.413.2 0.27517.01.71996 12.17742
50 11 5.7 14.4 32.011.422.0 0.01723.22.11997 12.02517
21 4 2.4 6.4 33.911.419.0 0.20520.11.41998 12.06405
109 20 14.3 12.1 21.613.218.3 0.03916.92.9All YearsModel B 12.10683
38 5 2.8 9.3 33.97.413.2 0.12621.61.51996 12.18490
50 11 8.2 10.1 22.016.522.0 0.13716.12.11997 12.03332
21 4 3.3 5.0 24.615.619.0 0.41314.81.31998 12.10273
Yearly Risk Adjusted Death Rates (%)with 95% Confidence Bounds
Model A
0
10
20
30
40
50
60
70
80
90
100
1996 1997 1998
Statewide
Yearly Risk Adjusted Death Rates (%)with 95% Confidence Bounds
Model B
0
10
20
30
40
50
60
70
80
90
100
1996 1997 1998
Statewide
‡ Hospital sent comment letter Office of Statewide Health Planning and DevelopmentCalifornia Hospital Outcomes Project

Detailed Statistical Resultsfor Acute Myocardial Infarction Mortality
Statewide Death Rate
(%)
Number of Observed
Deaths
Number of Expected Deaths Lower Upper
Expected Death Rate
(%)
Observed Death Rate
(%)
Risk Adjusted Death Rate 95% Confidence Bounds
Number of Cases
Included
Standard Deviation of Observed
Deaths
Risk-Adjusted
Death Rate (%)
Probability This Rate
Occurred by Chance
Contra Costa County: Doctors Medical Center, Pinole Campus
276 31 29.2 8.9 16.810.611.2 0.38512.84.9All YearsModel A 12.08912
111 12 11.8 6.1 18.610.610.8 0.52612.43.11996 12.17742
83 9 8.7 5.2 19.610.510.8 0.51612.42.71997 12.02517
82 10 8.6 6.7 21.310.512.2 0.35914.02.71998 12.06405
267 31 25.2 10.9 18.99.411.6 0.10814.94.3All YearsModel B 12.10683
109 12 10.6 7.7 19.99.711.0 0.35613.82.71996 12.18490
79 9 8.0 6.8 20.410.111.4 0.39513.62.31997 12.03332
79 10 6.6 9.9 26.58.412.7 0.11218.22.31998 12.10273
Yearly Risk Adjusted Death Rates (%)with 95% Confidence Bounds
Model A
0
10
20
30
40
50
60
70
80
90
100
1996 1997 1998
Statewide
Yearly Risk Adjusted Death Rates (%)with 95% Confidence Bounds
Model B
0
10
20
30
40
50
60
70
80
90
100
1996 1997 1998
Statewide
‡ Hospital sent comment letter Office of Statewide Health Planning and DevelopmentCalifornia Hospital Outcomes Project
Page 46

Detailed Statistical Resultsfor Acute Myocardial Infarction Mortality
Statewide Death Rate
(%)
Number of Observed
Deaths
Number of Expected Deaths Lower Upper
Expected Death Rate
(%)
Observed Death Rate
(%)
Risk Adjusted Death Rate 95% Confidence Bounds
Number of Cases
Included
Standard Deviation of Observed
Deaths
Risk-Adjusted
Death Rate (%)
Probability This Rate
Occurred by Chance
Contra Costa County: Doctors Medical Center, San Pablo Campus
531 50 62.7 7.0 12.311.89.4 0.0389.67.0All YearsModel A 12.08912
190 22 23.1 7.2 15.912.211.6 0.45011.64.21996 12.17742
153 12 18.2 3.0 12.911.97.8 0.0617.93.81997 12.02517
188 16 21.4 4.5 13.611.48.5 0.1169.04.11998 12.06405
528 50 55.6 8.2 13.510.59.5 0.20710.96.2All YearsModel B 12.10683
190 22 20.3 8.8 17.610.711.6 0.37013.23.81996 12.18490
150 12 16.4 3.9 13.611.08.0 0.1198.83.41997 12.03332
188 16 18.8 5.7 14.910.08.5 0.26510.33.61998 12.10273
Yearly Risk Adjusted Death Rates (%)with 95% Confidence Bounds
Model A
0
10
20
30
40
50
60
70
80
90
100
1996 1997 1998
Statewide
Yearly Risk Adjusted Death Rates (%)with 95% Confidence Bounds
Model B
0
10
20
30
40
50
60
70
80
90
100
1996 1997 1998
Statewide
‡ Hospital sent comment letter Office of Statewide Health Planning and DevelopmentCalifornia Hospital Outcomes Project

Detailed Statistical Resultsfor Acute Myocardial Infarction Mortality
Statewide Death Rate
(%)
Number of Observed
Deaths
Number of Expected Deaths Lower Upper
Expected Death Rate
(%)
Observed Death Rate
(%)
Risk Adjusted Death Rate 95% Confidence Bounds
Number of Cases
Included
Standard Deviation of Observed
Deaths
Risk-Adjusted
Death Rate (%)
Probability This Rate
Occurred by Chance
Contra Costa County: John Muir Medical Center
655 90 87.1 10.3 14.713.313.7 0.38212.58.1All YearsModel A 12.08912
220 28 29.5 7.7 15.413.412.7 0.42411.64.71996 12.17742
232 33 31.6 8.9 16.213.614.2 0.41712.64.91997 12.02517
203 29 26.1 9.4 17.512.814.3 0.28913.44.51998 12.06405
654 90 88.2 10.3 14.413.513.8 0.43012.37.6All YearsModel B 12.10683
220 28 27.8 8.6 15.912.612.7 0.52112.34.31996 12.18490
231 33 35.3 8.1 14.415.314.3 0.35811.34.71997 12.03332
203 29 25.2 10.0 17.812.414.3 0.20813.94.11998 12.10273
Yearly Risk Adjusted Death Rates (%)with 95% Confidence Bounds
Model A
0
10
20
30
40
50
60
70
80
90
100
1996 1997 1998
Statewide
Yearly Risk Adjusted Death Rates (%)with 95% Confidence Bounds
Model B
0
10
20
30
40
50
60
70
80
90
100
1996 1997 1998
Statewide
‡ Hospital sent comment letter Office of Statewide Health Planning and DevelopmentCalifornia Hospital Outcomes Project
Page 48

Detailed Statistical Resultsfor Acute Myocardial Infarction Mortality
Statewide Death Rate
(%)
Number of Observed
Deaths
Number of Expected Deaths Lower Upper
Expected Death Rate
(%)
Observed Death Rate
(%)
Risk Adjusted Death Rate 95% Confidence Bounds
Number of Cases
Included
Standard Deviation of Observed
Deaths
Risk-Adjusted
Death Rate (%)
Probability This Rate
Occurred by Chance
Contra Costa County: Kaiser Foundation Hospital - Richmond
2 0 0.5 0.0 30.922.80.0 0.5970.00.6All YearsModel A 12.08912
1 0 0.2 0.0 43.822.90.0 0.7710.00.41996 12.17742
1 0 0.2 0.0 43.622.60.0 0.7740.00.41997 12.02517
01998 12.06405
2 0 0.3 0.0 40.214.80.0 0.7250.00.5All YearsModel B 12.10683
1 0 0.1 0.0 59.713.80.0 0.8620.00.31996 12.18490
1 0 0.2 0.0 54.315.80.0 0.8420.00.41997 12.03332
01998 12.10273
Yearly Risk Adjusted Death Rates (%)with 95% Confidence Bounds
Model A
0
10
20
30
40
50
60
70
80
90
100
1996 1997 1998
Statewide
Yearly Risk Adjusted Death Rates (%)with 95% Confidence Bounds
Model B
0
10
20
30
40
50
60
70
80
90
100
1996 1997 1998
Statewide
‡ Hospital sent comment letter Office of Statewide Health Planning and DevelopmentCalifornia Hospital Outcomes Project

Detailed Statistical Resultsfor Acute Myocardial Infarction Mortality
Statewide Death Rate
(%)
Number of Observed
Deaths
Number of Expected Deaths Lower Upper
Expected Death Rate
(%)
Observed Death Rate
(%)
Risk Adjusted Death Rate 95% Confidence Bounds
Number of Cases
Included
Standard Deviation of Observed
Deaths
Risk-Adjusted
Death Rate (%)
Probability This Rate
Occurred by Chance
Contra Costa County: Kaiser Foundation Hospital - Walnut Creek
918 63 90.3 6.2 10.79.86.9 0.0018.48.6All YearsModel A 12.08912
366 33 36.9 7.3 14.410.19.0 0.27210.95.51996 12.17742
324 17 29.3 3.0 10.99.05.2 0.0067.04.91997 12.02517
228 13 24.2 2.2 10.810.65.7 0.0056.54.41998 12.06405
917 63 83.7 6.9 11.39.16.9 0.0039.17.7All YearsModel B 12.10683
366 33 33.6 8.5 15.49.29.0 0.50012.04.91996 12.18490
323 17 25.8 3.9 11.98.05.3 0.0237.94.41997 12.03332
228 13 24.2 2.5 10.510.65.7 0.0036.54.11998 12.10273
Yearly Risk Adjusted Death Rates (%)with 95% Confidence Bounds
Model A
0
10
20
30
40
50
60
70
80
90
100
1996 1997 1998
Statewide
Yearly Risk Adjusted Death Rates (%)with 95% Confidence Bounds
Model B
0
10
20
30
40
50
60
70
80
90
100
1996 1997 1998
Statewide
‡ Hospital sent comment letter Office of Statewide Health Planning and DevelopmentCalifornia Hospital Outcomes Project
Page 50

Detailed Statistical Resultsfor Acute Myocardial Infarction Mortality
Statewide Death Rate
(%)
Number of Observed
Deaths
Number of Expected Deaths Lower Upper
Expected Death Rate
(%)
Observed Death Rate
(%)
Risk Adjusted Death Rate 95% Confidence Bounds
Number of Cases
Included
Standard Deviation of Observed
Deaths
Risk-Adjusted
Death Rate (%)
Probability This Rate
Occurred by Chance
Contra Costa County: Mt. Diablo Medical Center‡
682 83 64.5 12.9 18.29.512.2 0.00815.67.2All YearsModel A 12.08912
161 18 16.1 8.3 18.810.011.2 0.34313.63.61996 12.17742
227 29 17.9 14.4 24.67.912.8 0.00519.53.91997 12.02517
294 36 30.5 10.4 18.110.412.2 0.15514.24.91998 12.06405
679 83 65.1 13.0 17.99.612.2 0.00515.46.7All YearsModel B 12.10683
160 18 14.8 9.6 20.09.311.3 0.20014.83.21996 12.18490
226 29 19.3 13.6 22.58.512.8 0.00818.13.61997 12.03332
293 36 31.0 10.6 17.610.612.3 0.15914.14.61998 12.10273
Yearly Risk Adjusted Death Rates (%)with 95% Confidence Bounds
Model A
0
10
20
30
40
50
60
70
80
90
100
1996 1997 1998
Statewide
Yearly Risk Adjusted Death Rates (%)with 95% Confidence Bounds
Model B
0
10
20
30
40
50
60
70
80
90
100
1996 1997 1998
Statewide
‡ Hospital sent comment letter Office of Statewide Health Planning and DevelopmentCalifornia Hospital Outcomes Project

Detailed Statistical Resultsfor Acute Myocardial Infarction Mortality
Statewide Death Rate
(%)
Number of Observed
Deaths
Number of Expected Deaths Lower Upper
Expected Death Rate
(%)
Observed Death Rate
(%)
Risk Adjusted Death Rate 95% Confidence Bounds
Number of Cases
Included
Standard Deviation of Observed
Deaths
Risk-Adjusted
Death Rate (%)
Probability This Rate
Occurred by Chance
Contra Costa County: San Ramon Regional Medical Center
181 19 15.1 9.6 20.78.410.5 0.17015.23.5All YearsModel A 12.08912
60 4 5.2 0.0 19.08.66.7 0.3929.42.11996 12.17742
56 5 4.4 3.4 23.97.98.9 0.45713.61.91997 12.02517
65 10 5.5 12.7 30.88.515.4 0.03921.82.11998 12.06405
180 19 14.3 10.7 21.57.910.6 0.10116.13.3All YearsModel B 12.10683
60 4 5.7 0.2 17.09.46.7 0.2928.62.01996 12.18490
55 5 3.5 5.8 28.56.49.1 0.26417.11.71997 12.03332
65 10 5.1 14.6 32.77.915.4 0.01823.62.01998 12.10273
Yearly Risk Adjusted Death Rates (%)with 95% Confidence Bounds
Model A
0
10
20
30
40
50
60
70
80
90
100
1996 1997 1998
Statewide
Yearly Risk Adjusted Death Rates (%)with 95% Confidence Bounds
Model B
0
10
20
30
40
50
60
70
80
90
100
1996 1997 1998
Statewide
‡ Hospital sent comment letter Office of Statewide Health Planning and DevelopmentCalifornia Hospital Outcomes Project
Page 52

Detailed Statistical Resultsfor Acute Myocardial Infarction Mortality
Statewide Death Rate
(%)
Number of Observed
Deaths
Number of Expected Deaths Lower Upper
Expected Death Rate
(%)
Observed Death Rate
(%)
Risk Adjusted Death Rate 95% Confidence Bounds
Number of Cases
Included
Standard Deviation of Observed
Deaths
Risk-Adjusted
Death Rate (%)
Probability This Rate
Occurred by Chance
Contra Costa County: Sutter Delta Medical Center
508 72 49.3 14.6 20.79.714.2 0.00017.66.3All YearsModel A 12.08912
148 30 15.5 18.2 28.910.520.3 0.00023.53.51996 12.17742
180 18 14.9 9.0 20.18.310.0 0.22614.53.51997 12.02517
180 24 18.9 10.5 20.210.513.3 0.12015.33.91998 12.06405
498 72 48.9 15.0 20.69.814.5 0.00017.85.8All YearsModel B 12.10683
142 30 18.1 15.9 24.412.821.1 0.00020.13.31996 12.18490
176 18 14.8 9.5 19.78.410.2 0.20114.63.21997 12.03332
180 24 16.0 13.0 23.48.913.3 0.02018.23.51998 12.10273
Yearly Risk Adjusted Death Rates (%)with 95% Confidence Bounds
Model A
0
10
20
30
40
50
60
70
80
90
100
1996 1997 1998
Statewide
Yearly Risk Adjusted Death Rates (%)with 95% Confidence Bounds
Model B
0
10
20
30
40
50
60
70
80
90
100
1996 1997 1998
Statewide
‡ Hospital sent comment letter Office of Statewide Health Planning and DevelopmentCalifornia Hospital Outcomes Project

Detailed Statistical Resultsfor Acute Myocardial Infarction Mortality
Statewide Death Rate
(%)
Number of Observed
Deaths
Number of Expected Deaths Lower Upper
Expected Death Rate
(%)
Observed Death Rate
(%)
Risk Adjusted Death Rate 95% Confidence Bounds
Number of Cases
Included
Standard Deviation of Observed
Deaths
Risk-Adjusted
Death Rate (%)
Del Norte County Summary
Number of Hospitals Included
272 30 36.9 6.4 13.313.611.0 9.85.3All YearsModel A 12.1 1
87 11 11.2 5.6 18.212.912.6 11.93.01996 12.2 1
105 16 16.5 6.7 16.715.715.2 11.73.51997 12.0 1
80 3 9.2 0.0 10.811.53.8 3.92.71998 12.1 1
271 29 32.7 7.3 14.112.110.7 10.74.7All YearsModel B 12.1 1
87 11 10.1 7.0 19.611.612.6 13.32.61996 12.2 1
104 15 14.1 7.6 17.913.614.4 12.83.11997 12.0 1
80 3 8.5 0.0 10.710.63.8 4.32.31998 12.1 1
Yearly Risk Adjusted Death Rates (%)with 95% Confidence Bounds
Model A
0
10
20
30
40
50
60
1996 1997 1998
Statewide
Yearly Risk Adjusted Death Rates (%)with 95% Confidence Bounds
Model B
0
10
20
30
40
50
60
1996 1997 1998
Statewide
Office of Statewide Health Planning and DevelopmentCalifornia Hospital Outcomes Project

Detailed Statistical Resultsfor Acute Myocardial Infarction Mortality
Statewide Death Rate
(%)
Number of Observed
Deaths
Number of Expected Deaths Lower Upper
Expected Death Rate
(%)
Observed Death Rate
(%)
Risk Adjusted Death Rate 95% Confidence Bounds
Number of Cases
Included
Standard Deviation of Observed
Deaths
Risk-Adjusted
Death Rate (%)
Probability This Rate
Occurred by Chance
Del Norte County: Sutter Coast Hospital
272 30 36.9 6.4 13.313.611.0 0.1149.85.3All YearsModel A 12.08912
87 11 11.2 5.6 18.212.912.6 0.54911.93.01996 12.17742
105 16 16.5 6.7 16.715.715.2 0.51511.73.51997 12.02517
80 3 9.2 0.0 10.811.53.8 0.0103.92.71998 12.06405
271 29 32.7 7.3 14.112.110.7 0.25010.74.7All YearsModel B 12.10683
87 11 10.1 7.0 19.611.612.6 0.42113.32.61996 12.18490
104 15 14.1 7.6 17.913.614.4 0.44112.83.11997 12.03332
80 3 8.5 0.0 10.710.63.8 0.0094.32.31998 12.10273
Yearly Risk Adjusted Death Rates (%)with 95% Confidence Bounds
Model A
0
10
20
30
40
50
60
70
80
90
100
1996 1997 1998
Statewide
Yearly Risk Adjusted Death Rates (%)with 95% Confidence Bounds
Model B
0
10
20
30
40
50
60
70
80
90
100
1996 1997 1998
Statewide
‡ Hospital sent comment letter Office of Statewide Health Planning and DevelopmentCalifornia Hospital Outcomes Project
Page 55

Detailed Statistical Resultsfor Acute Myocardial Infarction Mortality
Statewide Death Rate
(%)
Number of Observed
Deaths
Number of Expected Deaths Lower Upper
Expected Death Rate
(%)
Observed Death Rate
(%)
Risk Adjusted Death Rate 95% Confidence Bounds
Number of Cases
Included
Standard Deviation of Observed
Deaths
Risk-Adjusted
Death Rate (%)
El Dorado County Summary
Number of Hospitals Included
563 46 59.1 6.7 12.210.58.2 9.46.9All YearsModel A 12.1 2
182 14 20.5 3.7 13.011.37.7 8.34.01996 12.2 2
207 14 20.8 3.4 12.710.16.8 8.14.11997 12.0 2
174 18 17.7 7.1 17.310.210.3 12.23.81998 12.1 2
559 46 54.0 7.6 13.09.78.2 10.36.2All YearsModel B 12.1 2
180 14 16.7 5.1 15.39.37.8 10.23.51996 12.2 2
207 14 19.7 4.1 12.99.56.8 8.53.71997 12.0 2
172 18 17.5 7.7 17.110.210.5 12.43.51998 12.1 2
Yearly Risk Adjusted Death Rates (%)with 95% Confidence Bounds
Model A
0
10
20
30
40
50
60
1996 1997 1998
Statewide
Yearly Risk Adjusted Death Rates (%)with 95% Confidence Bounds
Model B
0
10
20
30
40
50
60
1996 1997 1998
Statewide
Office of Statewide Health Planning and DevelopmentCalifornia Hospital Outcomes Project

Detailed Statistical Resultsfor Acute Myocardial Infarction Mortality
Statewide Death Rate
(%)
Number of Observed
Deaths
Number of Expected Deaths Lower Upper
Expected Death Rate
(%)
Observed Death Rate
(%)
Risk Adjusted Death Rate 95% Confidence Bounds
Number of Cases
Included
Standard Deviation of Observed
Deaths
Risk-Adjusted
Death Rate (%)
Probability This Rate
Occurred by Chance
El Dorado County: Barton Memorial Hospital
220 16 21.9 4.2 13.410.07.3 0.0978.84.3All YearsModel A 12.08912
67 5 7.2 0.4 16.510.77.5 0.2518.52.41996 12.17742
87 5 8.9 0.0 13.910.25.7 0.1006.82.71997 12.02517
66 6 5.9 3.3 21.38.99.1 0.54712.32.21998 12.06405
220 16 18.9 5.6 14.98.67.3 0.26610.33.7All YearsModel B 12.10683
67 5 5.4 2.2 20.58.07.5 0.54611.32.11996 12.18490
87 5 8.4 0.5 13.89.75.7 0.1027.12.41997 12.03332
66 6 5.1 5.0 23.67.79.1 0.39514.32.01998 12.10273
Yearly Risk Adjusted Death Rates (%)with 95% Confidence Bounds
Model A
0
10
20
30
40
50
60
70
80
90
100
1996 1997 1998
Statewide
Yearly Risk Adjusted Death Rates (%)with 95% Confidence Bounds
Model B
0
10
20
30
40
50
60
70
80
90
100
1996 1997 1998
Statewide
‡ Hospital sent comment letter Office of Statewide Health Planning and DevelopmentCalifornia Hospital Outcomes Project

Detailed Statistical Resultsfor Acute Myocardial Infarction Mortality
Statewide Death Rate
(%)
Number of Observed
Deaths
Number of Expected Deaths Lower Upper
Expected Death Rate
(%)
Observed Death Rate
(%)
Risk Adjusted Death Rate 95% Confidence Bounds
Number of Cases
Included
Standard Deviation of Observed
Deaths
Risk-Adjusted
Death Rate (%)
Probability This Rate
Occurred by Chance
El Dorado County: Marshall Hospital
343 30 37.1 6.3 13.210.88.7 0.1099.85.4All YearsModel A 12.08912
115 9 13.3 2.5 13.911.67.8 0.1128.23.21996 12.17742
120 9 11.9 3.0 15.110.07.5 0.2179.13.11997 12.02517
108 12 11.9 6.0 18.411.011.1 0.53112.23.11998 12.06405
339 30 35.1 7.0 13.710.48.8 0.17510.35.0All YearsModel B 12.10683
113 9 11.3 3.6 15.710.08.0 0.2679.72.91996 12.18490
120 9 11.3 3.7 15.49.47.5 0.2669.62.81997 12.03332
106 12 12.5 6.2 17.111.811.3 0.51611.62.91998 12.10273
Yearly Risk Adjusted Death Rates (%)with 95% Confidence Bounds
Model A
0
10
20
30
40
50
60
70
80
90
100
1996 1997 1998
Statewide
Yearly Risk Adjusted Death Rates (%)with 95% Confidence Bounds
Model B
0
10
20
30
40
50
60
70
80
90
100
1996 1997 1998
Statewide
‡ Hospital sent comment letter Office of Statewide Health Planning and DevelopmentCalifornia Hospital Outcomes Project
Page 58

Detailed Statistical Resultsfor Acute Myocardial Infarction Mortality
Statewide Death Rate
(%)
Number of Observed
Deaths
Number of Expected Deaths Lower Upper
Expected Death Rate
(%)
Observed Death Rate
(%)
Risk Adjusted Death Rate 95% Confidence Bounds
Number of Cases
Included
Standard Deviation of Observed
Deaths
Risk-Adjusted
Death Rate (%)
Fresno County Summary
Number of Hospitals Included
3,735 455 461.7 10.9 12.912.412.2 11.918.9All YearsModel A 12.1 10
1,147 139 134.8 10.7 14.411.812.1 12.610.31996 12.2 10
1,247 139 152.9 9.3 12.612.311.1 10.910.91997 12.0 10
1,341 177 174.1 10.7 13.813.013.2 12.311.61998 12.1 10
3,686 449 434.5 11.6 13.511.812.2 12.517.3All YearsModel B 12.1 10
1,133 136 126.0 11.4 14.911.112.0 13.29.41996 12.2 10
1,225 137 140.8 10.1 13.411.511.2 11.79.91997 12.0 10
1,328 176 167.8 11.2 14.212.613.3 12.710.71998 12.1 10
Yearly Risk Adjusted Death Rates (%)with 95% Confidence Bounds
Model A
0
10
20
30
40
50
60
1996 1997 1998
Statewide
Yearly Risk Adjusted Death Rates (%)with 95% Confidence Bounds
Model B
0
10
20
30
40
50
60
1996 1997 1998
Statewide
Office of Statewide Health Planning and DevelopmentCalifornia Hospital Outcomes Project

Detailed Statistical Resultsfor Acute Myocardial Infarction Mortality
Statewide Death Rate
(%)
Number of Observed
Deaths
Number of Expected Deaths Lower Upper
Expected Death Rate
(%)
Observed Death Rate
(%)
Risk Adjusted Death Rate 95% Confidence Bounds
Number of Cases
Included
Standard Deviation of Observed
Deaths
Risk-Adjusted
Death Rate (%)
Probability This Rate
Occurred by Chance
Fresno County: Coalinga Regional Medical Center
9 1 1.0 0.0 33.610.811.1 0.67012.40.9All YearsModel A 12.08912
1996 Excluded
1997 Excluded
9 1 1.0 0.0 33.610.811.1 0.67012.40.91998 12.06405
9 1 0.9 0.0 37.39.511.1 0.61214.10.8All YearsModel B 12.10683
1996 Excluded
1997 Excluded
9 1 0.9 0.0 37.39.511.1 0.61214.10.81998 12.10273
Yearly Risk Adjusted Death Rates (%)with 95% Confidence Bounds
Model A
0
10
20
30
40
50
60
70
80
90
100
1996 1997 1998
Statewide
Yearly Risk Adjusted Death Rates (%)with 95% Confidence Bounds
Model B
0
10
20
30
40
50
60
70
80
90
100
1996 1997 1998
Statewide
‡ Hospital sent comment letter Office of Statewide Health Planning and DevelopmentCalifornia Hospital Outcomes Project
Page 60

Detailed Statistical Resultsfor Acute Myocardial Infarction Mortality
Statewide Death Rate
(%)
Number of Observed
Deaths
Number of Expected Deaths Lower Upper
Expected Death Rate
(%)
Observed Death Rate
(%)
Risk Adjusted Death Rate 95% Confidence Bounds
Number of Cases
Included
Standard Deviation of Observed
Deaths
Risk-Adjusted
Death Rate (%)
Probability This Rate
Occurred by Chance
Fresno County: Community Medical Center of Clovis‡
187 33 22.6 13.3 22.012.117.6 0.01117.64.1All YearsModel A 12.08912
56 7 6.5 4.9 21.311.612.5 0.48213.12.21996 12.17742
49 8 4.8 10.4 29.69.816.3 0.08920.02.01997 12.02517
82 18 11.3 13.2 25.313.822.0 0.02019.22.91998 12.06405
186 32 21.5 13.9 22.211.517.2 0.00518.13.8All YearsModel B 12.10683
55 6 5.6 4.6 21.410.210.9 0.50513.02.01996 12.18490
49 8 4.1 13.6 33.08.416.3 0.03123.31.71997 12.03332
82 18 11.7 13.1 24.214.322.0 0.02118.62.71998 12.10273
Yearly Risk Adjusted Death Rates (%)with 95% Confidence Bounds
Model A
0
10
20
30
40
50
60
70
80
90
100
1996 1997 1998
Statewide
Yearly Risk Adjusted Death Rates (%)with 95% Confidence Bounds
Model B
0
10
20
30
40
50
60
70
80
90
100
1996 1997 1998
Statewide
‡ Hospital sent comment letter Office of Statewide Health Planning and DevelopmentCalifornia Hospital Outcomes Project
Page 61
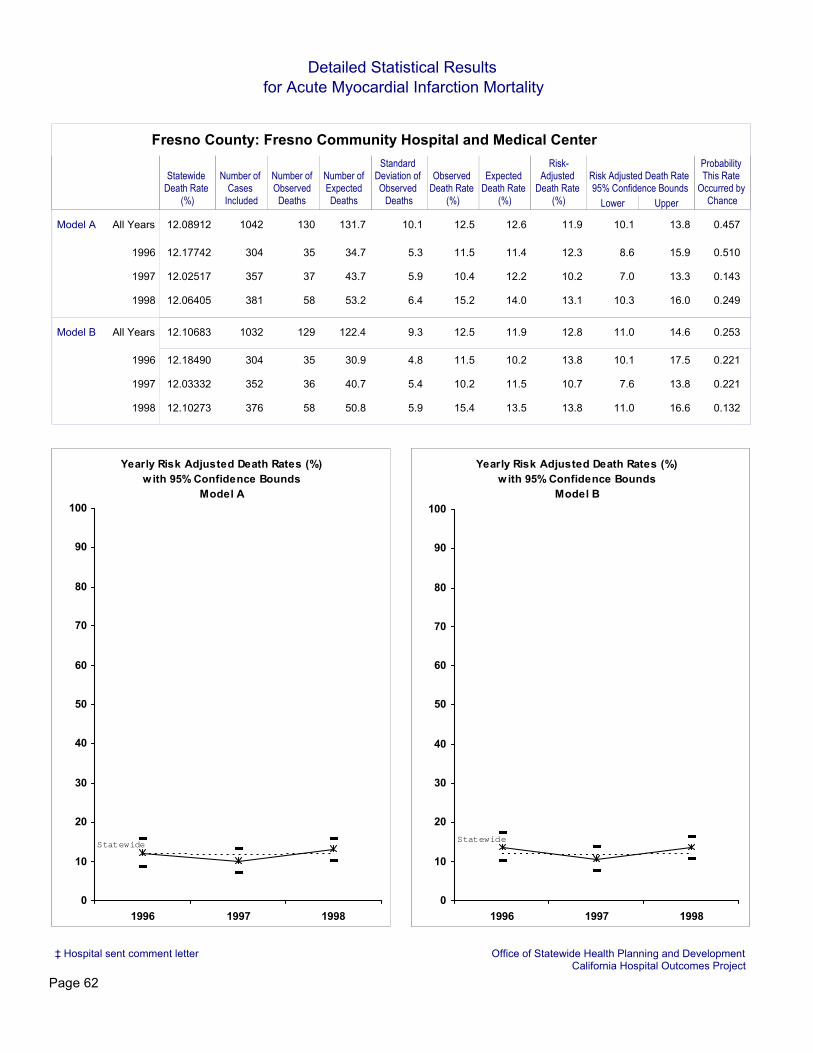
Detailed Statistical Resultsfor Acute Myocardial Infarction Mortality
Statewide Death Rate
(%)
Number of Observed
Deaths
Number of Expected Deaths Lower Upper
Expected Death Rate
(%)
Observed Death Rate
(%)
Risk Adjusted Death Rate 95% Confidence Bounds
Number of Cases
Included
Standard Deviation of Observed
Deaths
Risk-Adjusted
Death Rate (%)
Probability This Rate
Occurred by Chance
Fresno County: Fresno Community Hospital and Medical Center
1042 130 131.7 10.1 13.812.612.5 0.45711.910.1All YearsModel A 12.08912
304 35 34.7 8.6 15.911.411.5 0.51012.35.31996 12.17742
357 37 43.7 7.0 13.312.210.4 0.14310.25.91997 12.02517
381 58 53.2 10.3 16.014.015.2 0.24913.16.41998 12.06405
1032 129 122.4 11.0 14.611.912.5 0.25312.89.3All YearsModel B 12.10683
304 35 30.9 10.1 17.510.211.5 0.22113.84.81996 12.18490
352 36 40.7 7.6 13.811.510.2 0.22110.75.41997 12.03332
376 58 50.8 11.0 16.613.515.4 0.13213.85.91998 12.10273
Yearly Risk Adjusted Death Rates (%)with 95% Confidence Bounds
Model A
0
10
20
30
40
50
60
70
80
90
100
1996 1997 1998
Statewide
Yearly Risk Adjusted Death Rates (%)with 95% Confidence Bounds
Model B
0
10
20
30
40
50
60
70
80
90
100
1996 1997 1998
Statewide
‡ Hospital sent comment letter Office of Statewide Health Planning and DevelopmentCalifornia Hospital Outcomes Project
Page 62

Detailed Statistical Resultsfor Acute Myocardial Infarction Mortality
Statewide Death Rate
(%)
Number of Observed
Deaths
Number of Expected Deaths Lower Upper
Expected Death Rate
(%)
Observed Death Rate
(%)
Risk Adjusted Death Rate 95% Confidence Bounds
Number of Cases
Included
Standard Deviation of Observed
Deaths
Risk-Adjusted
Death Rate (%)
Probability This Rate
Occurred by Chance
Fresno County: Kaiser Foundation Hospital - Fresno
543 32 57.3 3.9 9.610.65.9 0.0006.76.8All YearsModel A 12.08912
141 10 11.9 3.9 16.58.57.1 0.33410.23.21996 12.17742
190 10 22.6 0.9 9.711.95.3 0.0015.34.21997 12.02517
212 12 22.8 1.9 10.810.85.7 0.0056.34.31998 12.06405
527 31 45.7 5.2 11.38.75.9 0.0068.25.9All YearsModel B 12.10683
136 9 9.7 4.6 18.07.16.6 0.48911.32.71996 12.18490
182 10 18.8 1.9 11.010.35.5 0.0086.43.61997 12.03332
209 12 17.2 3.3 13.58.25.7 0.0978.43.71998 12.10273
Yearly Risk Adjusted Death Rates (%)with 95% Confidence Bounds
Model A
0
10
20
30
40
50
60
70
80
90
100
1996 1997 1998
Statewide
Yearly Risk Adjusted Death Rates (%)with 95% Confidence Bounds
Model B
0
10
20
30
40
50
60
70
80
90
100
1996 1997 1998
Statewide
‡ Hospital sent comment letter Office of Statewide Health Planning and DevelopmentCalifornia Hospital Outcomes Project
Page 63

Detailed Statistical Resultsfor Acute Myocardial Infarction Mortality
Statewide Death Rate
(%)
Number of Observed
Deaths
Number of Expected Deaths Lower Upper
Expected Death Rate
(%)
Observed Death Rate
(%)
Risk Adjusted Death Rate 95% Confidence Bounds
Number of Cases
Included
Standard Deviation of Observed
Deaths
Risk-Adjusted
Death Rate (%)
Probability This Rate
Occurred by Chance
Fresno County: Kingsburg District Hospital
1 0 0.0 0.0 100.02.80.0 0.9720.00.2All YearsModel A 12.08912
01996 12.17742
01997 12.02517
1 0 0.0 0.0 100.02.80.0 0.9720.00.21998 12.06405
0 0.0All YearsModel B 12.10683
01996 12.18490
01997 12.03332
0 0.01998 12.10273
Yearly Risk Adjusted Death Rates (%)with 95% Confidence Bounds
Model A
0
10
20
30
40
50
60
70
80
90
100
1996 1997 1998
Statewide
Yearly Risk Adjusted Death Rates (%)with 95% Confidence Bounds
Model B
0
10
20
30
40
50
60
70
80
90
100
1996 1997 1998
Statewide
‡ Hospital sent comment letter Office of Statewide Health Planning and DevelopmentCalifornia Hospital Outcomes Project
Page 64

Detailed Statistical Resultsfor Acute Myocardial Infarction Mortality
Statewide Death Rate
(%)
Number of Observed
Deaths
Number of Expected Deaths Lower Upper
Expected Death Rate
(%)
Observed Death Rate
(%)
Risk Adjusted Death Rate 95% Confidence Bounds
Number of Cases
Included
Standard Deviation of Observed
Deaths
Risk-Adjusted
Death Rate (%)
Probability This Rate
Occurred by Chance
Fresno County: Sanger General Hospital
3 1 0.7 0.0 42.622.633.3 0.54617.90.7All YearsModel A 12.08912
2 0 0.5 0.0 30.022.70.0 0.5840.00.61996 12.17742
01997 12.02517
1 1 0.2 10.0 98.322.3100.0 0.22354.10.41998 12.06405
3 1 0.5 0.0 55.916.133.3 0.41425.00.6All YearsModel B 12.10683
2 0 0.3 0.0 37.216.60.0 0.6910.00.51996 12.18490
01997 12.03332
1 1 0.2 23.6 100.015.2100.0 0.15279.60.41998 12.10273
Yearly Risk Adjusted Death Rates (%)with 95% Confidence Bounds
Model A
0
10
20
30
40
50
60
70
80
90
100
1996 1997 1998
Statewide
Yearly Risk Adjusted Death Rates (%)with 95% Confidence Bounds
Model B
0
10
20
30
40
50
60
70
80
90
100
1996 1997 1998
Statewide
‡ Hospital sent comment letter Office of Statewide Health Planning and DevelopmentCalifornia Hospital Outcomes Project
Page 65

Detailed Statistical Resultsfor Acute Myocardial Infarction Mortality
Statewide Death Rate
(%)
Number of Observed
Deaths
Number of Expected Deaths Lower Upper
Expected Death Rate
(%)
Observed Death Rate
(%)
Risk Adjusted Death Rate 95% Confidence Bounds
Number of Cases
Included
Standard Deviation of Observed
Deaths
Risk-Adjusted
Death Rate (%)
Probability This Rate
Occurred by Chance
Fresno County: Selma District Hospital
43 5 8.2 0.4 14.419.011.6 0.1337.42.4All YearsModel A 12.08912
1996 Excluded
26 3 5.2 0.0 15.720.111.5 0.1916.91.91997 12.02517
17 2 3.0 0.0 19.817.411.8 0.3978.21.41998 12.06405
43 5 6.3 1.4 17.914.611.6 0.3749.62.2All YearsModel B 12.10683
1996 Excluded
26 3 4.1 0.0 18.715.911.5 0.3758.71.81997 12.03332
17 2 2.1 0.0 25.612.611.8 0.63511.31.31998 12.10273
Yearly Risk Adjusted Death Rates (%)with 95% Confidence Bounds
Model A
0
10
20
30
40
50
60
70
80
90
100
1996 1997 1998
Statewide
Yearly Risk Adjusted Death Rates (%)with 95% Confidence Bounds
Model B
0
10
20
30
40
50
60
70
80
90
100
1996 1997 1998
Statewide
‡ Hospital sent comment letter Office of Statewide Health Planning and DevelopmentCalifornia Hospital Outcomes Project
Page 66

Detailed Statistical Resultsfor Acute Myocardial Infarction Mortality
Statewide Death Rate
(%)
Number of Observed
Deaths
Number of Expected Deaths Lower Upper
Expected Death Rate
(%)
Observed Death Rate
(%)
Risk Adjusted Death Rate 95% Confidence Bounds
Number of Cases
Included
Standard Deviation of Observed
Deaths
Risk-Adjusted
Death Rate (%)
Probability This Rate
Occurred by Chance
Fresno County: Sierra Kings District Hospital
17 3 4.9 0.0 15.928.717.6 0.2197.41.8All YearsModel A 12.08912
9 2 2.3 0.0 23.125.722.2 0.57910.51.21996 12.17742
6 1 2.0 0.0 18.733.516.7 0.3326.01.11997 12.02517
2 0 0.6 0.0 26.728.00.0 0.5170.00.61998 12.06405
17 3 3.4 0.0 21.719.917.6 0.54910.71.6All YearsModel B 12.10683
9 2 1.5 0.0 32.517.122.2 0.47915.91.11996 12.18490
6 1 1.5 0.0 24.624.216.7 0.5488.31.01997 12.03332
2 0 0.4 0.0 33.320.00.0 0.6380.00.61998 12.10273
Yearly Risk Adjusted Death Rates (%)with 95% Confidence Bounds
Model A
0
10
20
30
40
50
60
70
80
90
100
1996 1997 1998
Statewide
Yearly Risk Adjusted Death Rates (%)with 95% Confidence Bounds
Model B
0
10
20
30
40
50
60
70
80
90
100
1996 1997 1998
Statewide
‡ Hospital sent comment letter Office of Statewide Health Planning and DevelopmentCalifornia Hospital Outcomes Project
Page 67

Detailed Statistical Resultsfor Acute Myocardial Infarction Mortality
Statewide Death Rate
(%)
Number of Observed
Deaths
Number of Expected Deaths Lower Upper
Expected Death Rate
(%)
Observed Death Rate
(%)
Risk Adjusted Death Rate 95% Confidence Bounds
Number of Cases
Included
Standard Deviation of Observed
Deaths
Risk-Adjusted
Death Rate (%)
Probability This Rate
Occurred by Chance
Fresno County: St. Agnes Medical Center‡
1601 203 201.5 10.7 13.712.612.7 0.46412.212.5All YearsModel A 12.08912
535 72 68.3 10.3 15.412.813.5 0.32712.87.31996 12.17742
533 64 65.3 9.2 14.412.212.0 0.46211.87.11997 12.02517
533 67 67.9 9.4 14.412.712.6 0.48511.97.21998 12.06405
1582 201 202.6 10.7 13.412.812.7 0.46512.011.6All YearsModel B 12.10683
527 71 67.9 10.4 15.112.913.5 0.34312.76.71996 12.18490
525 63 64.3 9.4 14.212.212.0 0.45611.86.61997 12.03332
530 67 70.4 9.2 13.813.312.6 0.33611.56.71998 12.10273
Yearly Risk Adjusted Death Rates (%)with 95% Confidence Bounds
Model A
0
10
20
30
40
50
60
70
80
90
100
1996 1997 1998
Statewide
Yearly Risk Adjusted Death Rates (%)with 95% Confidence Bounds
Model B
0
10
20
30
40
50
60
70
80
90
100
1996 1997 1998
Statewide
‡ Hospital sent comment letter Office of Statewide Health Planning and DevelopmentCalifornia Hospital Outcomes Project
Page 68

Detailed Statistical Resultsfor Acute Myocardial Infarction Mortality
Statewide Death Rate
(%)
Number of Observed
Deaths
Number of Expected Deaths Lower Upper
Expected Death Rate
(%)
Observed Death Rate
(%)
Risk Adjusted Death Rate 95% Confidence Bounds
Number of Cases
Included
Standard Deviation of Observed
Deaths
Risk-Adjusted
Death Rate (%)
Probability This Rate
Occurred by Chance
Fresno County: University Medical Center - Fresno‡
289 47 33.9 13.2 20.311.716.3 0.00916.85.1All YearsModel A 12.08912
100 13 10.5 8.4 21.610.513.0 0.24315.02.91996 12.17742
86 16 9.3 13.9 27.610.818.6 0.01420.82.71997 12.02517
103 18 14.1 9.9 20.913.717.5 0.15015.43.31998 12.06405
287 46 31.4 14.1 21.311.016.0 0.00217.74.8All YearsModel B 12.10683
100 13 10.1 9.3 22.210.113.0 0.18315.72.71996 12.18490
85 16 7.3 18.6 34.08.618.8 0.00126.32.41997 12.03332
102 17 14.1 9.4 19.813.816.7 0.21014.63.11998 12.10273
Yearly Risk Adjusted Death Rates (%)with 95% Confidence Bounds
Model A
0
10
20
30
40
50
60
70
80
90
100
1996 1997 1998
Statewide
Yearly Risk Adjusted Death Rates (%)with 95% Confidence Bounds
Model B
0
10
20
30
40
50
60
70
80
90
100
1996 1997 1998
Statewide
‡ Hospital sent comment letter Office of Statewide Health Planning and DevelopmentCalifornia Hospital Outcomes Project
Page 69
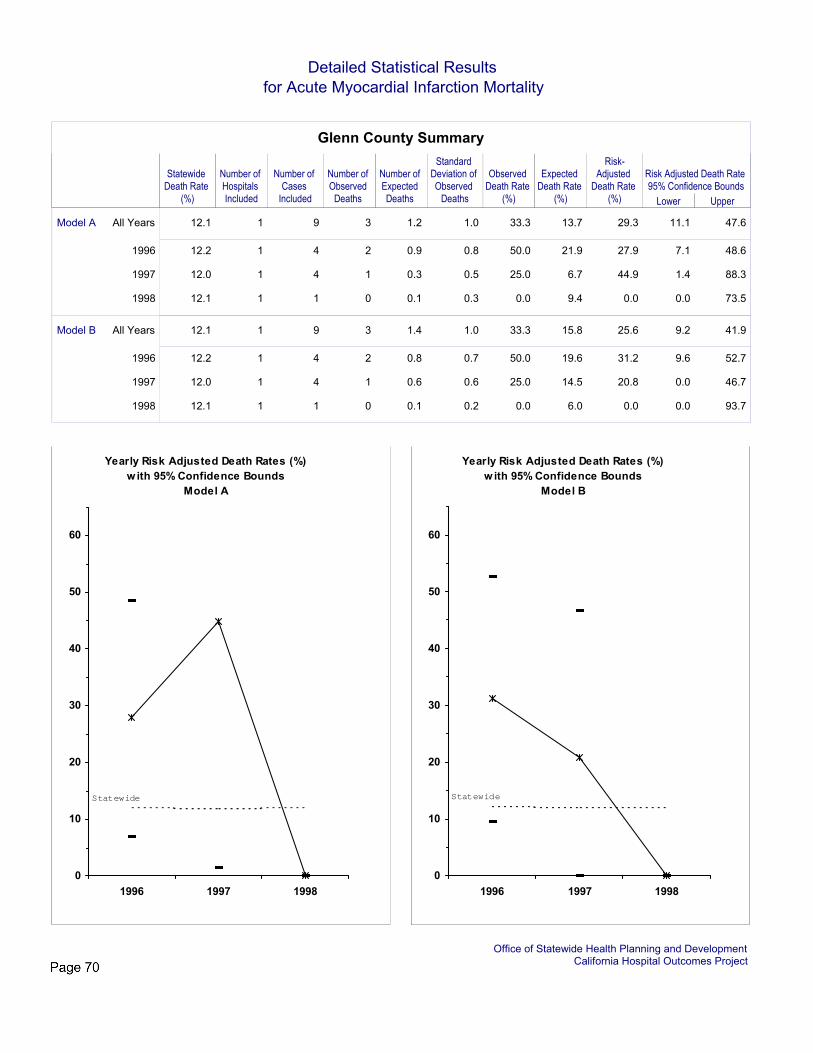
Detailed Statistical Resultsfor Acute Myocardial Infarction Mortality
Statewide Death Rate
(%)
Number of Observed
Deaths
Number of Expected Deaths Lower Upper
Expected Death Rate
(%)
Observed Death Rate
(%)
Risk Adjusted Death Rate 95% Confidence Bounds
Number of Cases
Included
Standard Deviation of Observed
Deaths
Risk-Adjusted
Death Rate (%)
Glenn County Summary
Number of Hospitals Included
9 3 1.2 11.1 47.613.733.3 29.31.0All YearsModel A 12.1 1
4 2 0.9 7.1 48.621.950.0 27.90.81996 12.2 1
4 1 0.3 1.4 88.36.725.0 44.90.51997 12.0 1
1 0 0.1 0.0 73.59.40.0 0.00.31998 12.1 1
9 3 1.4 9.2 41.915.833.3 25.61.0All YearsModel B 12.1 1
4 2 0.8 9.6 52.719.650.0 31.20.71996 12.2 1
4 1 0.6 0.0 46.714.525.0 20.80.61997 12.0 1
1 0 0.1 0.0 93.76.00.0 0.00.21998 12.1 1
Yearly Risk Adjusted Death Rates (%)with 95% Confidence Bounds
Model A
0
10
20
30
40
50
60
1996 1997 1998
Statewide
Yearly Risk Adjusted Death Rates (%)with 95% Confidence Bounds
Model B
0
10
20
30
40
50
60
1996 1997 1998
Statewide
Office of Statewide Health Planning and DevelopmentCalifornia Hospital Outcomes Project

Detailed Statistical Resultsfor Acute Myocardial Infarction Mortality
Statewide Death Rate
(%)
Number of Observed
Deaths
Number of Expected Deaths Lower Upper
Expected Death Rate
(%)
Observed Death Rate
(%)
Risk Adjusted Death Rate 95% Confidence Bounds
Number of Cases
Included
Standard Deviation of Observed
Deaths
Risk-Adjusted
Death Rate (%)
Probability This Rate
Occurred by Chance
Glenn County: Glenn Medical Center
9 3 1.2 11.1 47.613.733.3 0.09629.31.0All YearsModel A 12.08912
4 2 0.9 7.1 48.621.950.0 0.19827.90.81996 12.17742
4 1 0.3 1.4 88.36.725.0 0.24544.90.51997 12.02517
1 0 0.1 0.0 73.59.40.0 0.9060.00.31998 12.06405
9 3 1.4 9.2 41.915.833.3 0.13325.61.0All YearsModel B 12.10683
4 2 0.8 9.6 52.719.650.0 0.14931.20.71996 12.18490
4 1 0.6 0.0 46.714.525.0 0.50120.80.61997 12.03332
1 0 0.1 0.0 93.76.00.0 0.9400.00.21998 12.10273
Yearly Risk Adjusted Death Rates (%)with 95% Confidence Bounds
Model A
0
10
20
30
40
50
60
70
80
90
100
1996 1997 1998
Statewide
Yearly Risk Adjusted Death Rates (%)with 95% Confidence Bounds
Model B
0
10
20
30
40
50
60
70
80
90
100
1996 1997 1998
Statewide
‡ Hospital sent comment letter Office of Statewide Health Planning and DevelopmentCalifornia Hospital Outcomes Project

Detailed Statistical Resultsfor Acute Myocardial Infarction Mortality
Statewide Death Rate
(%)
Number of Observed
Deaths
Number of Expected Deaths Lower Upper
Expected Death Rate
(%)
Observed Death Rate
(%)
Risk Adjusted Death Rate 95% Confidence Bounds
Number of Cases
Included
Standard Deviation of Observed
Deaths
Risk-Adjusted
Death Rate (%)
Humboldt County Summary
Number of Hospitals Included
489 69 65.0 10.3 15.413.314.1 12.87.0All YearsModel A 12.1 5
187 28 23.7 10.1 18.712.715.0 14.44.31996 12.2 5
168 23 23.4 7.6 16.013.913.7 11.84.21997 12.0 5
134 18 17.9 7.3 16.913.413.4 12.13.71998 12.1 5
485 68 59.5 11.3 16.412.314.0 13.86.4All YearsModel B 12.1 5
185 27 22.3 10.5 19.012.114.6 14.74.01996 12.2 5
168 23 22.4 8.3 16.413.313.7 12.43.81997 12.0 5
132 18 14.8 9.5 19.911.213.6 14.73.21998 12.1 5
Yearly Risk Adjusted Death Rates (%)with 95% Confidence Bounds
Model A
0
10
20
30
40
50
60
1996 1997 1998
Statewide
Yearly Risk Adjusted Death Rates (%)with 95% Confidence Bounds
Model B
0
10
20
30
40
50
60
1996 1997 1998
Statewide
Office of Statewide Health Planning and DevelopmentCalifornia Hospital Outcomes Project
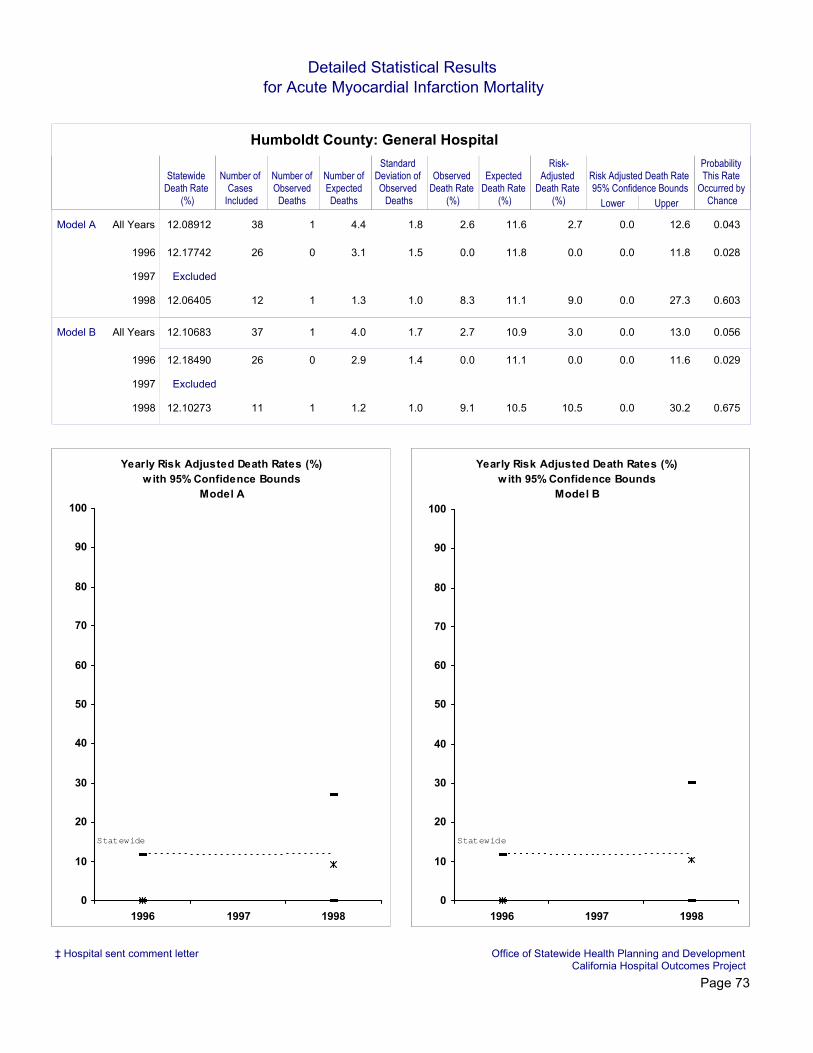
Detailed Statistical Resultsfor Acute Myocardial Infarction Mortality
Statewide Death Rate
(%)
Number of Observed
Deaths
Number of Expected Deaths Lower Upper
Expected Death Rate
(%)
Observed Death Rate
(%)
Risk Adjusted Death Rate 95% Confidence Bounds
Number of Cases
Included
Standard Deviation of Observed
Deaths
Risk-Adjusted
Death Rate (%)
Probability This Rate
Occurred by Chance
Humboldt County: General Hospital
38 1 4.4 0.0 12.611.62.6 0.0432.71.8All YearsModel A 12.08912
26 0 3.1 0.0 11.811.80.0 0.0280.01.51996 12.17742
1997 Excluded
12 1 1.3 0.0 27.311.18.3 0.6039.01.01998 12.06405
37 1 4.0 0.0 13.010.92.7 0.0563.01.7All YearsModel B 12.10683
26 0 2.9 0.0 11.611.10.0 0.0290.01.41996 12.18490
1997 Excluded
11 1 1.2 0.0 30.210.59.1 0.67510.51.01998 12.10273
Yearly Risk Adjusted Death Rates (%)with 95% Confidence Bounds
Model A
0
10
20
30
40
50
60
70
80
90
100
1996 1997 1998
Statewide
Yearly Risk Adjusted Death Rates (%)with 95% Confidence Bounds
Model B
0
10
20
30
40
50
60
70
80
90
100
1996 1997 1998
Statewide
‡ Hospital sent comment letter Office of Statewide Health Planning and DevelopmentCalifornia Hospital Outcomes Project
Page 73

Detailed Statistical Resultsfor Acute Myocardial Infarction Mortality
Statewide Death Rate
(%)
Number of Observed
Deaths
Number of Expected Deaths Lower Upper
Expected Death Rate
(%)
Observed Death Rate
(%)
Risk Adjusted Death Rate 95% Confidence Bounds
Number of Cases
Included
Standard Deviation of Observed
Deaths
Risk-Adjusted
Death Rate (%)
Probability This Rate
Occurred by Chance
Humboldt County: Gerold Phelps Community Hospital
21 3 2.5 1.4 28.111.714.3 0.45714.81.4All YearsModel A 12.08912
12 3 1.5 7.8 42.312.225.0 0.15825.01.11996 12.17742
8 0 0.9 0.0 22.211.00.0 0.3670.00.81997 12.02517
1 0 0.1 0.0 66.511.20.0 0.8880.00.31998 12.06405
21 3 1.6 5.6 40.47.514.3 0.20023.01.2All YearsModel B 12.10683
12 3 1.0 15.9 60.48.025.0 0.05438.20.91996 12.18490
8 0 0.6 0.0 29.37.00.0 0.5480.00.71997 12.03332
1 0 0.1 0.0 90.26.50.0 0.9350.00.21998 12.10273
Yearly Risk Adjusted Death Rates (%)with 95% Confidence Bounds
Model A
0
10
20
30
40
50
60
70
80
90
100
1996 1997 1998
Statewide
Yearly Risk Adjusted Death Rates (%)with 95% Confidence Bounds
Model B
0
10
20
30
40
50
60
70
80
90
100
1996 1997 1998
Statewide
‡ Hospital sent comment letter Office of Statewide Health Planning and DevelopmentCalifornia Hospital Outcomes Project
Page 74

Detailed Statistical Resultsfor Acute Myocardial Infarction Mortality
Statewide Death Rate
(%)
Number of Observed
Deaths
Number of Expected Deaths Lower Upper
Expected Death Rate
(%)
Observed Death Rate
(%)
Risk Adjusted Death Rate 95% Confidence Bounds
Number of Cases
Included
Standard Deviation of Observed
Deaths
Risk-Adjusted
Death Rate (%)
Probability This Rate
Occurred by Chance
Humboldt County: Mad River Community Hospital
141 19 20.2 6.8 16.014.313.5 0.44111.43.9All YearsModel A 12.08912
63 11 9.1 7.8 21.714.417.5 0.28714.72.61996 12.17742
45 6 5.9 3.7 20.613.213.3 0.56512.12.11997 12.02517
33 2 5.1 0.0 13.615.66.1 0.0774.71.91998 12.06405
141 19 16.9 8.7 18.512.013.5 0.31913.63.5All YearsModel B 12.10683
63 11 7.9 9.9 24.012.517.5 0.13417.02.31996 12.18490
45 6 5.3 4.9 22.511.713.3 0.43613.72.01997 12.03332
33 2 3.8 0.0 17.011.46.1 0.2346.41.71998 12.10273
Yearly Risk Adjusted Death Rates (%)with 95% Confidence Bounds
Model A
0
10
20
30
40
50
60
70
80
90
100
1996 1997 1998
Statewide
Yearly Risk Adjusted Death Rates (%)with 95% Confidence Bounds
Model B
0
10
20
30
40
50
60
70
80
90
100
1996 1997 1998
Statewide
‡ Hospital sent comment letter Office of Statewide Health Planning and DevelopmentCalifornia Hospital Outcomes Project
Page 75
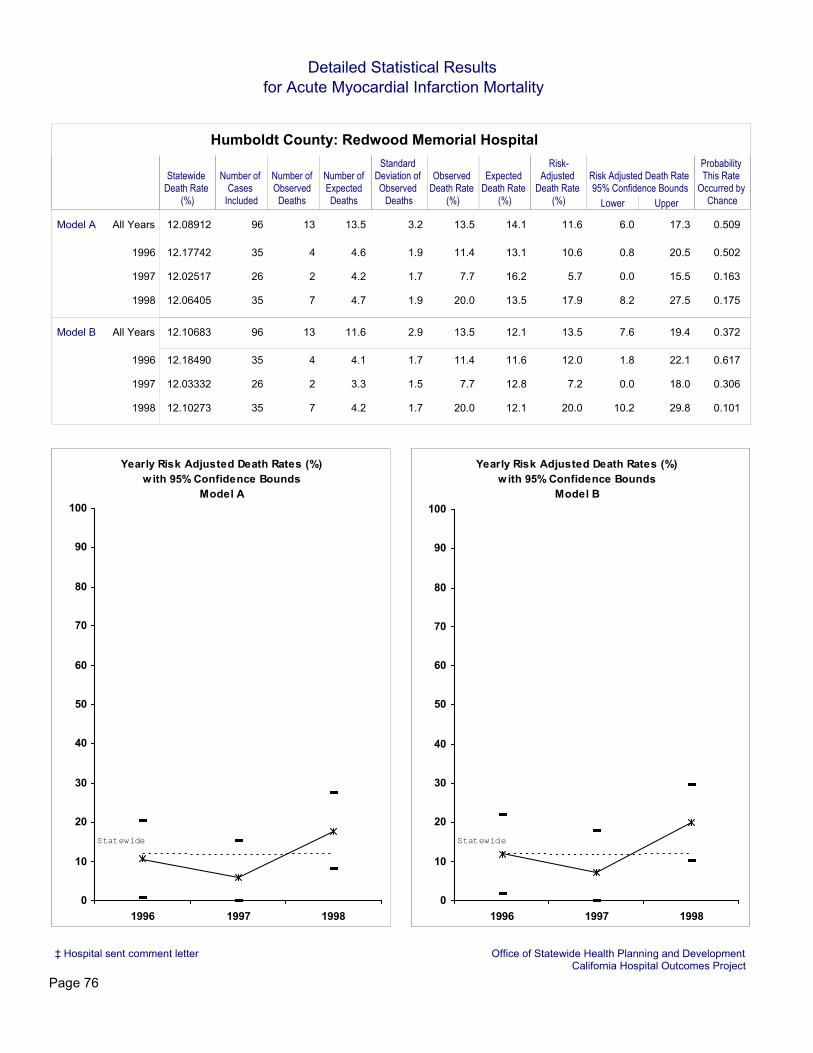
Detailed Statistical Resultsfor Acute Myocardial Infarction Mortality
Statewide Death Rate
(%)
Number of Observed
Deaths
Number of Expected Deaths Lower Upper
Expected Death Rate
(%)
Observed Death Rate
(%)
Risk Adjusted Death Rate 95% Confidence Bounds
Number of Cases
Included
Standard Deviation of Observed
Deaths
Risk-Adjusted
Death Rate (%)
Probability This Rate
Occurred by Chance
Humboldt County: Redwood Memorial Hospital
96 13 13.5 6.0 17.314.113.5 0.50911.63.2All YearsModel A 12.08912
35 4 4.6 0.8 20.513.111.4 0.50210.61.91996 12.17742
26 2 4.2 0.0 15.516.27.7 0.1635.71.71997 12.02517
35 7 4.7 8.2 27.513.520.0 0.17517.91.91998 12.06405
96 13 11.6 7.6 19.412.113.5 0.37213.52.9All YearsModel B 12.10683
35 4 4.1 1.8 22.111.611.4 0.61712.01.71996 12.18490
26 2 3.3 0.0 18.012.87.7 0.3067.21.51997 12.03332
35 7 4.2 10.2 29.812.120.0 0.10120.01.71998 12.10273
Yearly Risk Adjusted Death Rates (%)with 95% Confidence Bounds
Model A
0
10
20
30
40
50
60
70
80
90
100
1996 1997 1998
Statewide
Yearly Risk Adjusted Death Rates (%)with 95% Confidence Bounds
Model B
0
10
20
30
40
50
60
70
80
90
100
1996 1997 1998
Statewide
‡ Hospital sent comment letter Office of Statewide Health Planning and DevelopmentCalifornia Hospital Outcomes Project
Page 76

Detailed Statistical Resultsfor Acute Myocardial Infarction Mortality
Statewide Death Rate
(%)
Number of Observed
Deaths
Number of Expected Deaths Lower Upper
Expected Death Rate
(%)
Observed Death Rate
(%)
Risk Adjusted Death Rate 95% Confidence Bounds
Number of Cases
Included
Standard Deviation of Observed
Deaths
Risk-Adjusted
Death Rate (%)
Probability This Rate
Occurred by Chance
Humboldt County: St. Joseph Hospital - Eureka
193 33 24.5 12.2 20.412.717.1 0.03416.34.3All YearsModel A 12.08912
51 10 5.5 13.1 31.410.719.6 0.03522.22.11996 12.17742
89 15 12.4 8.8 20.313.916.9 0.23514.63.01997 12.02517
53 8 6.6 6.7 22.412.515.1 0.33214.62.21998 12.06405
190 32 25.3 11.6 19.013.316.8 0.06315.34.0All YearsModel B 12.10683
49 9 6.5 9.2 24.513.318.4 0.16916.82.11996 12.18490
89 15 13.2 8.6 18.714.916.9 0.31713.72.81997 12.03332
52 8 5.6 9.3 25.410.715.4 0.15417.31.91998 12.10273
Yearly Risk Adjusted Death Rates (%)with 95% Confidence Bounds
Model A
0
10
20
30
40
50
60
70
80
90
100
1996 1997 1998
Statewide
Yearly Risk Adjusted Death Rates (%)with 95% Confidence Bounds
Model B
0
10
20
30
40
50
60
70
80
90
100
1996 1997 1998
Statewide
‡ Hospital sent comment letter Office of Statewide Health Planning and DevelopmentCalifornia Hospital Outcomes Project
Page 77

Detailed Statistical Resultsfor Acute Myocardial Infarction Mortality
Statewide Death Rate
(%)
Number of Observed
Deaths
Number of Expected Deaths Lower Upper
Expected Death Rate
(%)
Observed Death Rate
(%)
Risk Adjusted Death Rate 95% Confidence Bounds
Number of Cases
Included
Standard Deviation of Observed
Deaths
Risk-Adjusted
Death Rate (%)
Imperial County Summary
Number of Hospitals Included
348 58 44.6 12.6 18.812.816.7 15.75.8All YearsModel A 12.1 2
145 31 18.8 15.3 24.813.021.4 20.03.71996 12.2 2
86 13 11.0 8.0 20.412.815.1 14.22.91997 12.0 2
117 14 14.8 6.1 16.812.612.0 11.43.41998 12.1 2
348 58 54.3 10.5 15.415.616.7 12.95.5All YearsModel B 12.1 2
145 31 24.8 11.8 18.617.121.4 15.23.61996 12.2 2
86 13 12.1 7.5 18.314.115.1 12.92.81997 12.0 2
117 14 17.3 5.4 14.214.812.0 9.83.21998 12.1 2
Yearly Risk Adjusted Death Rates (%)with 95% Confidence Bounds
Model A
0
10
20
30
40
50
60
1996 1997 1998
Statewide
Yearly Risk Adjusted Death Rates (%)with 95% Confidence Bounds
Model B
0
10
20
30
40
50
60
1996 1997 1998
Statewide
Office of Statewide Health Planning and DevelopmentCalifornia Hospital Outcomes Project

Detailed Statistical Resultsfor Acute Myocardial Infarction Mortality
Statewide Death Rate
(%)
Number of Observed
Deaths
Number of Expected Deaths Lower Upper
Expected Death Rate
(%)
Observed Death Rate
(%)
Risk Adjusted Death Rate 95% Confidence Bounds
Number of Cases
Included
Standard Deviation of Observed
Deaths
Risk-Adjusted
Death Rate (%)
Probability This Rate
Occurred by Chance
Imperial County: El Centro Regional Medical Center
252 41 31.3 12.1 19.512.416.3 0.03415.84.9All YearsModel A 12.08912
91 19 10.9 14.9 27.711.920.9 0.00621.32.91996 12.17742
86 13 11.0 8.0 20.412.815.1 0.29314.22.91997 12.02517
75 9 9.5 4.7 18.212.612.0 0.51911.52.71998 12.06405
252 41 38.9 9.9 15.615.416.3 0.36112.84.7All YearsModel B 12.10683
91 19 15.2 10.9 19.616.720.9 0.11615.32.81996 12.18490
86 13 12.1 7.5 18.314.115.1 0.43812.92.81997 12.03332
75 9 11.6 4.1 14.815.412.0 0.2169.42.61998 12.10273
Yearly Risk Adjusted Death Rates (%)with 95% Confidence Bounds
Model A
0
10
20
30
40
50
60
70
80
90
100
1996 1997 1998
Statewide
Yearly Risk Adjusted Death Rates (%)with 95% Confidence Bounds
Model B
0
10
20
30
40
50
60
70
80
90
100
1996 1997 1998
Statewide
‡ Hospital sent comment letter Office of Statewide Health Planning and DevelopmentCalifornia Hospital Outcomes Project

Detailed Statistical Resultsfor Acute Myocardial Infarction Mortality
Statewide Death Rate
(%)
Number of Observed
Deaths
Number of Expected Deaths Lower Upper
Expected Death Rate
(%)
Observed Death Rate
(%)
Risk Adjusted Death Rate 95% Confidence Bounds
Number of Cases
Included
Standard Deviation of Observed
Deaths
Risk-Adjusted
Death Rate (%)
Probability This Rate
Occurred by Chance
Imperial County: Pioneers Memorial Healthcare District
96 17 13.3 10.0 21.013.817.7 0.14815.53.1All YearsModel A 12.08912
54 12 8.0 11.2 25.414.822.2 0.07218.32.41996 12.17742
1997 Excluded
42 5 5.3 2.5 20.312.611.9 0.56011.42.01998 12.06405
96 17 15.4 8.8 17.916.117.7 0.34913.32.9All YearsModel B 12.10683
54 12 9.7 9.5 20.717.922.2 0.20515.12.31996 12.18490
1997 Excluded
42 5 5.7 2.8 18.313.711.9 0.46310.51.91998 12.10273
Yearly Risk Adjusted Death Rates (%)with 95% Confidence Bounds
Model A
0
10
20
30
40
50
60
70
80
90
100
1996 1997 1998
Statewide
Yearly Risk Adjusted Death Rates (%)with 95% Confidence Bounds
Model B
0
10
20
30
40
50
60
70
80
90
100
1996 1997 1998
Statewide
‡ Hospital sent comment letter Office of Statewide Health Planning and DevelopmentCalifornia Hospital Outcomes Project
Page 80

Detailed Statistical Resultsfor Acute Myocardial Infarction Mortality
Statewide Death Rate
(%)
Number of Observed
Deaths
Number of Expected Deaths Lower Upper
Expected Death Rate
(%)
Observed Death Rate
(%)
Risk Adjusted Death Rate 95% Confidence Bounds
Number of Cases
Included
Standard Deviation of Observed
Deaths
Risk-Adjusted
Death Rate (%)
Inyo County Summary
Number of Hospitals Included
78 6 9.1 1.0 15.011.67.7 8.02.7All YearsModel A 12.1 2
33 0 3.5 0.0 11.410.60.0 0.01.71996 12.2 2
25 4 3.4 2.8 25.313.716.0 14.01.61997 12.0 2
20 2 2.2 0.0 25.810.810.0 11.21.31998 12.1 2
78 6 6.8 2.6 19.08.77.7 10.82.3All YearsModel B 12.1 2
33 0 2.3 0.0 14.76.90.0 0.01.41996 12.2 2
25 4 2.9 4.6 28.611.616.0 16.61.51997 12.0 2
20 2 1.6 0.0 32.47.910.0 15.31.11998 12.1 2
Yearly Risk Adjusted Death Rates (%)with 95% Confidence Bounds
Model A
0
10
20
30
40
50
60
1996 1997 1998
Statewide
Yearly Risk Adjusted Death Rates (%)with 95% Confidence Bounds
Model B
0
10
20
30
40
50
60
1996 1997 1998
Statewide
Office of Statewide Health Planning and DevelopmentCalifornia Hospital Outcomes Project

Detailed Statistical Resultsfor Acute Myocardial Infarction Mortality
Statewide Death Rate
(%)
Number of Observed
Deaths
Number of Expected Deaths Lower Upper
Expected Death Rate
(%)
Observed Death Rate
(%)
Risk Adjusted Death Rate 95% Confidence Bounds
Number of Cases
Included
Standard Deviation of Observed
Deaths
Risk-Adjusted
Death Rate (%)
Probability This Rate
Occurred by Chance
Inyo County: Northern Inyo Hospital
76 6 8.8 1.1 15.311.67.9 0.1938.22.6All YearsModel A 12.08912
32 0 3.4 0.0 11.510.70.0 0.0210.01.71996 12.17742
25 4 3.4 2.8 25.313.716.0 0.45814.01.61997 12.02517
19 2 2.0 0.0 27.410.410.5 0.61412.21.31998 12.06405
76 6 6.6 2.7 19.38.77.9 0.50311.02.3All YearsModel B 12.10683
32 0 2.2 0.0 14.97.00.0 0.0910.01.41996 12.18490
25 4 2.9 4.6 28.611.616.0 0.32216.61.51997 12.03332
19 2 1.5 0.0 34.17.710.5 0.44616.51.11998 12.10273
Yearly Risk Adjusted Death Rates (%)with 95% Confidence Bounds
Model A
0
10
20
30
40
50
60
70
80
90
100
1996 1997 1998
Statewide
Yearly Risk Adjusted Death Rates (%)with 95% Confidence Bounds
Model B
0
10
20
30
40
50
60
70
80
90
100
1996 1997 1998
Statewide
‡ Hospital sent comment letter Office of Statewide Health Planning and DevelopmentCalifornia Hospital Outcomes Project
Page 82

Detailed Statistical Resultsfor Acute Myocardial Infarction Mortality
Statewide Death Rate
(%)
Number of Observed
Deaths
Number of Expected Deaths Lower Upper
Expected Death Rate
(%)
Observed Death Rate
(%)
Risk Adjusted Death Rate 95% Confidence Bounds
Number of Cases
Included
Standard Deviation of Observed
Deaths
Risk-Adjusted
Death Rate (%)
Probability This Rate
Occurred by Chance
Inyo County: Southern Inyo Hospital
2 0 0.3 0.0 42.913.00.0 0.7540.00.5All YearsModel A 12.08912
1 0 0.1 0.0 78.18.50.0 0.9150.00.31996 12.17742
01997 12.02517
1 0 0.2 0.0 51.317.50.0 0.8250.00.41998 12.06405
2 0 0.2 0.0 56.08.20.0 0.8430.00.4All YearsModel B 12.10683
1 0 0.1 0.0 98.35.60.0 0.9440.00.21996 12.18490
01997 12.03332
1 0 0.1 0.0 68.410.70.0 0.8930.00.31998 12.10273
Yearly Risk Adjusted Death Rates (%)with 95% Confidence Bounds
Model A
0
10
20
30
40
50
60
70
80
90
100
1996 1997 1998
Statewide
Yearly Risk Adjusted Death Rates (%)with 95% Confidence Bounds
Model B
0
10
20
30
40
50
60
70
80
90
100
1996 1997 1998
Statewide
‡ Hospital sent comment letter Office of Statewide Health Planning and DevelopmentCalifornia Hospital Outcomes Project
Page 83

Detailed Statistical Resultsfor Acute Myocardial Infarction Mortality
Statewide Death Rate
(%)
Number of Observed
Deaths
Number of Expected Deaths Lower Upper
Expected Death Rate
(%)
Observed Death Rate
(%)
Risk Adjusted Death Rate 95% Confidence Bounds
Number of Cases
Included
Standard Deviation of Observed
Deaths
Risk-Adjusted
Death Rate (%)
Kern County Summary
Number of Hospitals Included
2,430 304 278.2 11.9 14.511.412.5 13.214.8All YearsModel A 12.1 9
865 114 97.0 12.2 16.511.213.2 14.38.81996 12.2 9
802 99 94.0 10.5 14.811.712.3 12.78.61997 12.0 9
763 91 87.2 10.3 14.811.411.9 12.68.31998 12.1 9
2,424 304 284.2 11.8 14.111.712.5 12.913.7All YearsModel B 12.1 9
862 114 97.6 12.3 16.211.313.2 14.28.11996 12.2 9
800 99 97.0 10.4 14.212.112.4 12.37.91997 12.0 9
762 91 89.6 10.2 14.311.811.9 12.37.71998 12.1 9
Yearly Risk Adjusted Death Rates (%)with 95% Confidence Bounds
Model A
0
10
20
30
40
50
60
1996 1997 1998
Statewide
Yearly Risk Adjusted Death Rates (%)with 95% Confidence Bounds
Model B
0
10
20
30
40
50
60
1996 1997 1998
Statewide
Office of Statewide Health Planning and DevelopmentCalifornia Hospital Outcomes Project

Detailed Statistical Resultsfor Acute Myocardial Infarction Mortality
Statewide Death Rate
(%)
Number of Observed
Deaths
Number of Expected Deaths Lower Upper
Expected Death Rate
(%)
Observed Death Rate
(%)
Risk Adjusted Death Rate 95% Confidence Bounds
Number of Cases
Included
Standard Deviation of Observed
Deaths
Risk-Adjusted
Death Rate (%)
Probability This Rate
Occurred by Chance
Kern County: Bakersfield Memorial Hospital
845 79 83.8 9.1 13.79.99.3 0.30611.48.3All YearsModel A 12.08912
302 34 30.0 9.9 17.89.911.3 0.23513.85.01996 12.17742
256 23 28.3 5.8 13.811.09.0 0.1589.84.81997 12.02517
287 22 25.5 6.1 14.78.97.7 0.26110.44.61998 12.06405
845 79 85.7 9.0 13.310.19.3 0.20811.27.6All YearsModel B 12.10683
302 34 31.5 9.7 16.610.411.3 0.32813.14.61996 12.18490
256 23 28.8 6.0 13.211.29.0 0.1119.64.41997 12.03332
287 22 25.4 6.5 14.58.97.7 0.24910.54.31998 12.10273
Yearly Risk Adjusted Death Rates (%)with 95% Confidence Bounds
Model A
0
10
20
30
40
50
60
70
80
90
100
1996 1997 1998
Statewide
Yearly Risk Adjusted Death Rates (%)with 95% Confidence Bounds
Model B
0
10
20
30
40
50
60
70
80
90
100
1996 1997 1998
Statewide
‡ Hospital sent comment letter Office of Statewide Health Planning and DevelopmentCalifornia Hospital Outcomes Project

Detailed Statistical Resultsfor Acute Myocardial Infarction Mortality
Statewide Death Rate
(%)
Number of Observed
Deaths
Number of Expected Deaths Lower Upper
Expected Death Rate
(%)
Observed Death Rate
(%)
Risk Adjusted Death Rate 95% Confidence Bounds
Number of Cases
Included
Standard Deviation of Observed
Deaths
Risk-Adjusted
Death Rate (%)
Probability This Rate
Occurred by Chance
Kern County: Delano Regional Medical Center
120 15 16.2 6.0 16.413.512.5 0.42711.23.6All YearsModel A 12.08912
40 9 6.1 9.5 26.615.222.5 0.13318.02.21996 12.17742
35 3 5.1 0.0 16.314.58.6 0.2197.12.01997 12.02517
45 3 5.1 0.0 16.511.46.7 0.2197.12.01998 12.06405
119 15 15.4 6.8 16.812.912.6 0.52611.83.2All YearsModel B 12.10683
39 9 5.2 12.1 30.013.323.1 0.05121.11.91996 12.18490
35 3 5.4 0.0 14.415.58.6 0.1366.71.81997 12.03332
45 3 4.8 0.0 16.810.66.7 0.2557.61.91998 12.10273
Yearly Risk Adjusted Death Rates (%)with 95% Confidence Bounds
Model A
0
10
20
30
40
50
60
70
80
90
100
1996 1997 1998
Statewide
Yearly Risk Adjusted Death Rates (%)with 95% Confidence Bounds
Model B
0
10
20
30
40
50
60
70
80
90
100
1996 1997 1998
Statewide
‡ Hospital sent comment letter Office of Statewide Health Planning and DevelopmentCalifornia Hospital Outcomes Project
Page 86

Detailed Statistical Resultsfor Acute Myocardial Infarction Mortality
Statewide Death Rate
(%)
Number of Observed
Deaths
Number of Expected Deaths Lower Upper
Expected Death Rate
(%)
Observed Death Rate
(%)
Risk Adjusted Death Rate 95% Confidence Bounds
Number of Cases
Included
Standard Deviation of Observed
Deaths
Risk-Adjusted
Death Rate (%)
Probability This Rate
Occurred by Chance
Kern County: Good Samaritan Hospital - Bakersfield
2 0 0.6 0.0 24.131.40.0 0.4600.00.6All YearsModel A 12.08912
2 0 0.6 0.0 24.331.40.0 0.4600.00.61996 12.17742
1997 Excluded
1998 Excluded
2 0 0.4 0.0 31.221.60.0 0.6060.00.6All YearsModel B 12.10683
2 0 0.4 0.0 31.421.60.0 0.6060.00.61996 12.18490
1997 Excluded
1998 Excluded
Yearly Risk Adjusted Death Rates (%)with 95% Confidence Bounds
Model A
0
10
20
30
40
50
60
70
80
90
100
1996 1997 1998
Statewide
Yearly Risk Adjusted Death Rates (%)with 95% Confidence Bounds
Model B
0
10
20
30
40
50
60
70
80
90
100
1996 1997 1998
Statewide
‡ Hospital sent comment letter Office of Statewide Health Planning and DevelopmentCalifornia Hospital Outcomes Project

Detailed Statistical Resultsfor Acute Myocardial Infarction Mortality
Statewide Death Rate
(%)
Number of Observed
Deaths
Number of Expected Deaths Lower Upper
Expected Death Rate
(%)
Observed Death Rate
(%)
Risk Adjusted Death Rate 95% Confidence Bounds
Number of Cases
Included
Standard Deviation of Observed
Deaths
Risk-Adjusted
Death Rate (%)
Probability This Rate
Occurred by Chance
Kern County: Kern Medical Center
246 40 27.7 13.5 21.411.316.3 0.00717.54.7All YearsModel A 12.08912
97 16 9.0 14.4 28.79.316.5 0.01221.52.71996 12.17742
80 19 9.4 17.5 31.011.823.8 0.00124.32.71997 12.02517
69 5 9.2 0.0 13.413.47.2 0.0746.52.71998 12.06405
245 40 31.0 12.3 19.012.616.3 0.02915.64.4All YearsModel B 12.10683
97 16 9.2 14.7 27.69.516.5 0.00821.12.51996 12.18490
79 19 12.7 13.0 22.916.124.1 0.01717.92.71997 12.03332
69 5 9.0 0.1 13.313.17.2 0.0736.72.51998 12.10273
Yearly Risk Adjusted Death Rates (%)with 95% Confidence Bounds
Model A
0
10
20
30
40
50
60
70
80
90
100
1996 1997 1998
Statewide
Yearly Risk Adjusted Death Rates (%)with 95% Confidence Bounds
Model B
0
10
20
30
40
50
60
70
80
90
100
1996 1997 1998
Statewide
‡ Hospital sent comment letter Office of Statewide Health Planning and DevelopmentCalifornia Hospital Outcomes Project
Page 88
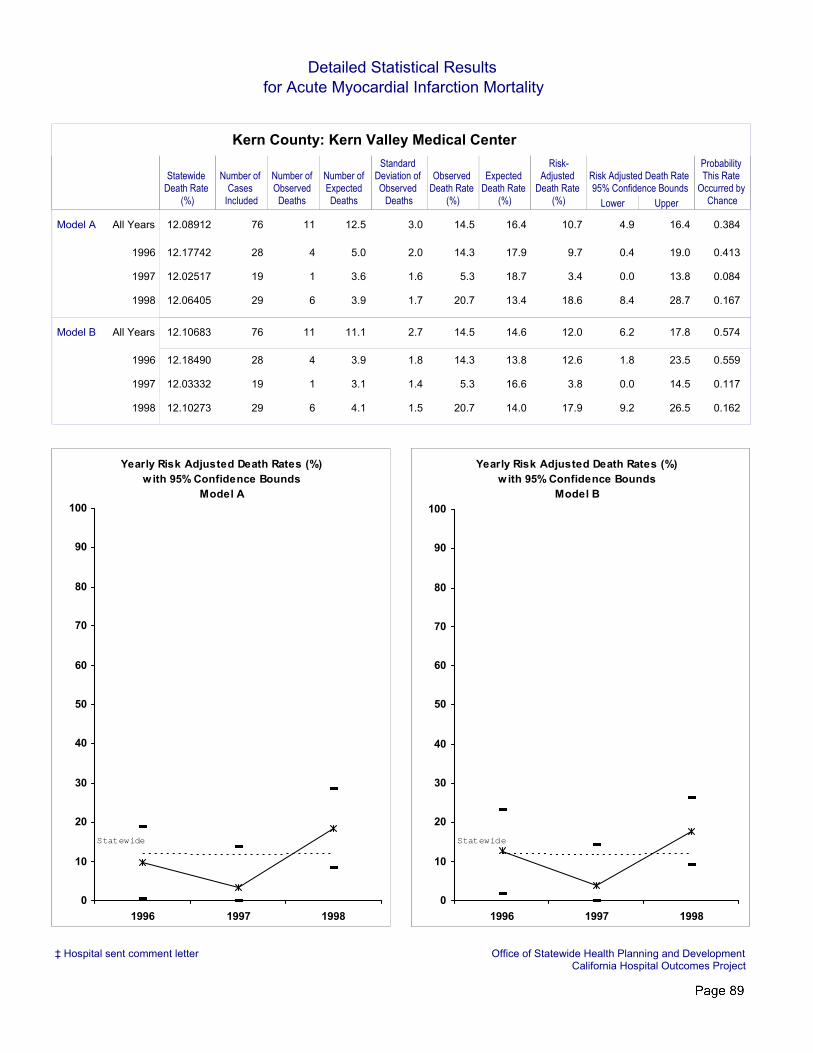
Detailed Statistical Resultsfor Acute Myocardial Infarction Mortality
Statewide Death Rate
(%)
Number of Observed
Deaths
Number of Expected Deaths Lower Upper
Expected Death Rate
(%)
Observed Death Rate
(%)
Risk Adjusted Death Rate 95% Confidence Bounds
Number of Cases
Included
Standard Deviation of Observed
Deaths
Risk-Adjusted
Death Rate (%)
Probability This Rate
Occurred by Chance
Kern County: Kern Valley Medical Center
76 11 12.5 4.9 16.416.414.5 0.38410.73.0All YearsModel A 12.08912
28 4 5.0 0.4 19.017.914.3 0.4139.72.01996 12.17742
19 1 3.6 0.0 13.818.75.3 0.0843.41.61997 12.02517
29 6 3.9 8.4 28.713.420.7 0.16718.61.71998 12.06405
76 11 11.1 6.2 17.814.614.5 0.57412.02.7All YearsModel B 12.10683
28 4 3.9 1.8 23.513.814.3 0.55912.61.81996 12.18490
19 1 3.1 0.0 14.516.65.3 0.1173.81.41997 12.03332
29 6 4.1 9.2 26.514.020.7 0.16217.91.51998 12.10273
Yearly Risk Adjusted Death Rates (%)with 95% Confidence Bounds
Model A
0
10
20
30
40
50
60
70
80
90
100
1996 1997 1998
Statewide
Yearly Risk Adjusted Death Rates (%)with 95% Confidence Bounds
Model B
0
10
20
30
40
50
60
70
80
90
100
1996 1997 1998
Statewide
‡ Hospital sent comment letter Office of Statewide Health Planning and DevelopmentCalifornia Hospital Outcomes Project
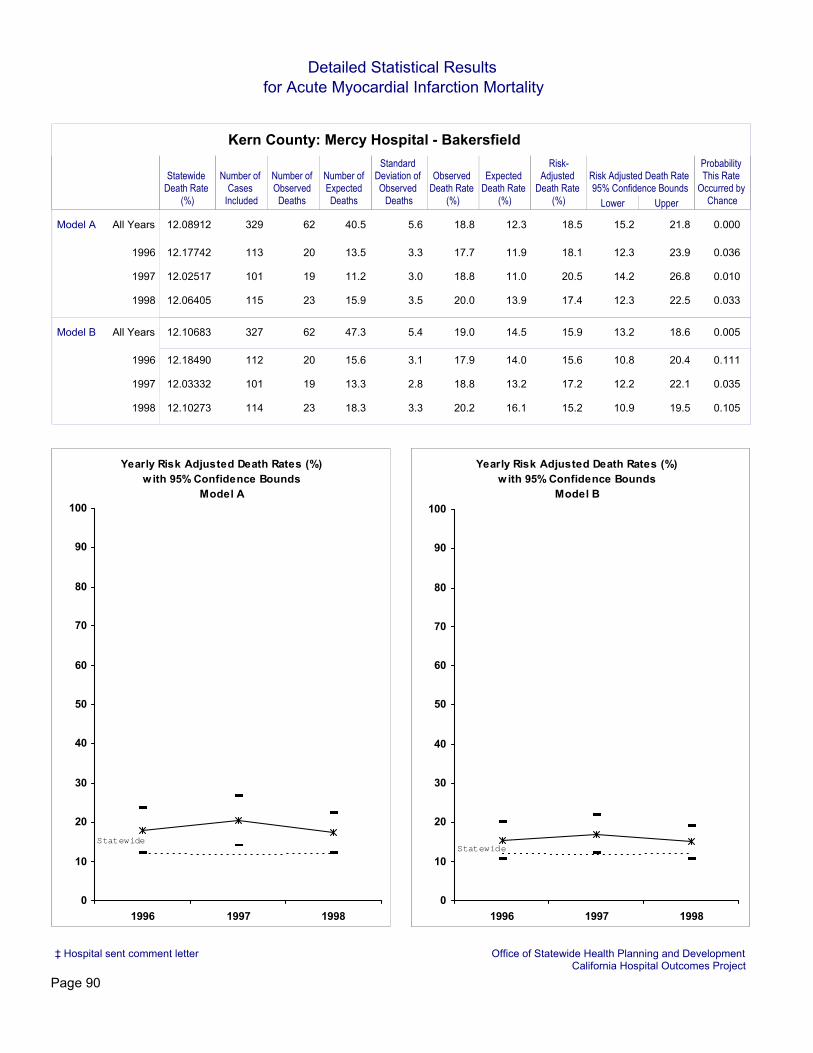
Detailed Statistical Resultsfor Acute Myocardial Infarction Mortality
Statewide Death Rate
(%)
Number of Observed
Deaths
Number of Expected Deaths Lower Upper
Expected Death Rate
(%)
Observed Death Rate
(%)
Risk Adjusted Death Rate 95% Confidence Bounds
Number of Cases
Included
Standard Deviation of Observed
Deaths
Risk-Adjusted
Death Rate (%)
Probability This Rate
Occurred by Chance
Kern County: Mercy Hospital - Bakersfield
329 62 40.5 15.2 21.812.318.8 0.00018.55.6All YearsModel A 12.08912
113 20 13.5 12.3 23.911.917.7 0.03618.13.31996 12.17742
101 19 11.2 14.2 26.811.018.8 0.01020.53.01997 12.02517
115 23 15.9 12.3 22.513.920.0 0.03317.43.51998 12.06405
327 62 47.3 13.2 18.614.519.0 0.00515.95.4All YearsModel B 12.10683
112 20 15.6 10.8 20.414.017.9 0.11115.63.11996 12.18490
101 19 13.3 12.2 22.113.218.8 0.03517.22.81997 12.03332
114 23 18.3 10.9 19.516.120.2 0.10515.23.31998 12.10273
Yearly Risk Adjusted Death Rates (%)with 95% Confidence Bounds
Model A
0
10
20
30
40
50
60
70
80
90
100
1996 1997 1998
Statewide
Yearly Risk Adjusted Death Rates (%)with 95% Confidence Bounds
Model B
0
10
20
30
40
50
60
70
80
90
100
1996 1997 1998
Statewide
‡ Hospital sent comment letter Office of Statewide Health Planning and DevelopmentCalifornia Hospital Outcomes Project
Page 90

Detailed Statistical Resultsfor Acute Myocardial Infarction Mortality
Statewide Death Rate
(%)
Number of Observed
Deaths
Number of Expected Deaths Lower Upper
Expected Death Rate
(%)
Observed Death Rate
(%)
Risk Adjusted Death Rate 95% Confidence Bounds
Number of Cases
Included
Standard Deviation of Observed
Deaths
Risk-Adjusted
Death Rate (%)
Probability This Rate
Occurred by Chance
Kern County: Mercy Westside Hospital
4 2 1.0 5.6 42.025.450.0 0.25823.80.8All YearsModel A 12.08912
1 0 0.0 0.0 100.02.80.0 0.9720.00.21996 12.17742
2 1 0.9 0.0 32.144.450.0 0.69313.50.71997 12.02517
1 1 0.1 50.6 100.09.9100.0 0.099100.00.31998 12.06405
4 2 1.1 3.8 38.728.550.0 0.32121.30.8All YearsModel B 12.10683
1 0 0.0 0.0 100.01.40.0 0.9860.00.11996 12.18490
2 1 0.7 0.0 42.432.650.0 0.54618.50.71997 12.03332
1 1 0.5 0.5 50.547.4100.0 0.47425.50.51998 12.10273
Yearly Risk Adjusted Death Rates (%)with 95% Confidence Bounds
Model A
0
10
20
30
40
50
60
70
80
90
100
1996 1997 1998
Statewide
Yearly Risk Adjusted Death Rates (%)with 95% Confidence Bounds
Model B
0
10
20
30
40
50
60
70
80
90
100
1996 1997 1998
Statewide
‡ Hospital sent comment letter Office of Statewide Health Planning and DevelopmentCalifornia Hospital Outcomes Project

Detailed Statistical Resultsfor Acute Myocardial Infarction Mortality
Statewide Death Rate
(%)
Number of Observed
Deaths
Number of Expected Deaths Lower Upper
Expected Death Rate
(%)
Observed Death Rate
(%)
Risk Adjusted Death Rate 95% Confidence Bounds
Number of Cases
Included
Standard Deviation of Observed
Deaths
Risk-Adjusted
Death Rate (%)
Probability This Rate
Occurred by Chance
Kern County: Ridgecrest Regional Hospital
84 8 9.1 3.6 17.610.89.5 0.42510.62.7All YearsModel A 12.08912
42 4 4.4 0.8 21.110.69.5 0.53811.01.91996 12.17742
42 4 4.7 0.7 19.911.19.5 0.48510.31.91997 12.02517
1998 Excluded
84 8 8.5 4.7 18.110.19.5 0.51511.42.4All YearsModel B 12.10683
42 4 4.4 1.7 20.510.59.5 0.54511.11.71996 12.18490
42 4 4.1 2.1 21.49.89.5 0.61611.71.71997 12.03332
1998 Excluded
Yearly Risk Adjusted Death Rates (%)with 95% Confidence Bounds
Model A
0
10
20
30
40
50
60
70
80
90
100
1996 1997 1998
Statewide
Yearly Risk Adjusted Death Rates (%)with 95% Confidence Bounds
Model B
0
10
20
30
40
50
60
70
80
90
100
1996 1997 1998
Statewide
‡ Hospital sent comment letter Office of Statewide Health Planning and DevelopmentCalifornia Hospital Outcomes Project
Page 92

Detailed Statistical Resultsfor Acute Myocardial Infarction Mortality
Statewide Death Rate
(%)
Number of Observed
Deaths
Number of Expected Deaths Lower Upper
Expected Death Rate
(%)
Observed Death Rate
(%)
Risk Adjusted Death Rate 95% Confidence Bounds
Number of Cases
Included
Standard Deviation of Observed
Deaths
Risk-Adjusted
Death Rate (%)
Probability This Rate
Occurred by Chance
Kern County: San Joaquin Community Hospital
724 87 86.7 9.9 14.412.012.0 0.50412.18.2All YearsModel A 12.08912
240 27 28.3 7.7 15.611.811.3 0.43811.64.71996 12.17742
267 29 30.9 7.5 15.011.610.9 0.39311.35.01997 12.02517
217 31 27.4 9.7 17.612.614.3 0.24813.64.61998 12.06405
722 87 83.7 10.5 14.711.612.0 0.35012.67.5All YearsModel B 12.10683
239 27 27.3 8.3 15.811.411.3 0.52812.14.31996 12.18490
266 29 28.9 8.4 15.810.810.9 0.52312.14.51997 12.03332
217 31 27.5 10.0 17.312.714.3 0.24013.64.21998 12.10273
Yearly Risk Adjusted Death Rates (%)with 95% Confidence Bounds
Model A
0
10
20
30
40
50
60
70
80
90
100
1996 1997 1998
Statewide
Yearly Risk Adjusted Death Rates (%)with 95% Confidence Bounds
Model B
0
10
20
30
40
50
60
70
80
90
100
1996 1997 1998
Statewide
‡ Hospital sent comment letter Office of Statewide Health Planning and DevelopmentCalifornia Hospital Outcomes Project

Detailed Statistical Resultsfor Acute Myocardial Infarction Mortality
Statewide Death Rate
(%)
Number of Observed
Deaths
Number of Expected Deaths Lower Upper
Expected Death Rate
(%)
Observed Death Rate
(%)
Risk Adjusted Death Rate 95% Confidence Bounds
Number of Cases
Included
Standard Deviation of Observed
Deaths
Risk-Adjusted
Death Rate (%)
Kings County Summary
Number of Hospitals Included
422 61 52.7 11.1 16.812.514.5 14.06.4All YearsModel A 12.1 2
127 15 15.4 6.5 17.212.111.8 11.83.51996 12.2 2
179 30 22.9 11.5 20.012.816.8 15.74.21997 12.0 2
116 16 14.4 8.0 18.912.413.8 13.43.31998 12.1 2
421 61 49.6 12.1 17.711.814.5 14.95.8All YearsModel B 12.1 2
127 15 14.7 7.3 17.611.511.8 12.53.11996 12.2 2
179 30 21.2 12.8 21.311.816.8 17.03.81997 12.0 2
115 16 13.8 8.7 19.312.013.9 14.03.11998 12.1 2
Yearly Risk Adjusted Death Rates (%)with 95% Confidence Bounds
Model A
0
10
20
30
40
50
60
1996 1997 1998
Statewide
Yearly Risk Adjusted Death Rates (%)with 95% Confidence Bounds
Model B
0
10
20
30
40
50
60
1996 1997 1998
Statewide
Office of Statewide Health Planning and DevelopmentCalifornia Hospital Outcomes Project

Detailed Statistical Resultsfor Acute Myocardial Infarction Mortality
Statewide Death Rate
(%)
Number of Observed
Deaths
Number of Expected Deaths Lower Upper
Expected Death Rate
(%)
Observed Death Rate
(%)
Risk Adjusted Death Rate 95% Confidence Bounds
Number of Cases
Included
Standard Deviation of Observed
Deaths
Risk-Adjusted
Death Rate (%)
Probability This Rate
Occurred by Chance
Kings County: Corcoran District Hospital
17 2 2.1 0.0 25.612.311.8 0.65611.61.2All YearsModel A 12.08912
7 1 0.5 0.0 53.17.614.3 0.43822.80.71996 12.17742
3 0 0.2 0.0 56.65.40.0 0.8450.00.41997 12.02517
7 1 1.4 0.0 24.919.914.3 0.5728.71.01998 12.06405
17 2 1.7 0.0 28.910.211.8 0.55614.01.1All YearsModel B 12.10683
7 1 0.7 0.0 37.810.514.3 0.62516.60.71996 12.18490
3 0 0.1 0.0 79.32.90.0 0.9170.00.31997 12.03332
7 1 0.9 0.0 34.713.014.3 0.65413.30.81998 12.10273
Yearly Risk Adjusted Death Rates (%)with 95% Confidence Bounds
Model A
0
10
20
30
40
50
60
70
80
90
100
1996 1997 1998
Statewide
Yearly Risk Adjusted Death Rates (%)with 95% Confidence Bounds
Model B
0
10
20
30
40
50
60
70
80
90
100
1996 1997 1998
Statewide
‡ Hospital sent comment letter Office of Statewide Health Planning and DevelopmentCalifornia Hospital Outcomes Project
Page 95

Detailed Statistical Resultsfor Acute Myocardial Infarction Mortality
Statewide Death Rate
(%)
Number of Observed
Deaths
Number of Expected Deaths Lower Upper
Expected Death Rate
(%)
Observed Death Rate
(%)
Risk Adjusted Death Rate 95% Confidence Bounds
Number of Cases
Included
Standard Deviation of Observed
Deaths
Risk-Adjusted
Death Rate (%)
Probability This Rate
Occurred by Chance
Kings County: Hanford Community Medical Center
405 59 50.6 11.2 17.012.514.6 0.10414.16.2All YearsModel A 12.08912
120 14 14.9 6.0 16.912.411.7 0.46511.43.41996 12.17742
176 30 22.7 11.6 20.112.917.0 0.05515.94.11997 12.02517
109 15 13.0 8.1 19.811.913.8 0.30714.03.21998 12.06405
404 59 47.9 12.1 17.711.914.6 0.03414.95.7All YearsModel B 12.10683
120 14 13.9 7.0 17.511.611.7 0.54412.23.11996 12.18490
176 30 21.1 12.9 21.312.017.0 0.01617.13.81997 12.03332
108 15 12.9 8.6 19.611.913.9 0.28614.13.01998 12.10273
Yearly Risk Adjusted Death Rates (%)with 95% Confidence Bounds
Model A
0
10
20
30
40
50
60
70
80
90
100
1996 1997 1998
Statewide
Yearly Risk Adjusted Death Rates (%)with 95% Confidence Bounds
Model B
0
10
20
30
40
50
60
70
80
90
100
1996 1997 1998
Statewide
‡ Hospital sent comment letter Office of Statewide Health Planning and DevelopmentCalifornia Hospital Outcomes Project
Page 96

Detailed Statistical Resultsfor Acute Myocardial Infarction Mortality
Statewide Death Rate
(%)
Number of Observed
Deaths
Number of Expected Deaths Lower Upper
Expected Death Rate
(%)
Observed Death Rate
(%)
Risk Adjusted Death Rate 95% Confidence Bounds
Number of Cases
Included
Standard Deviation of Observed
Deaths
Risk-Adjusted
Death Rate (%)
Lake County Summary
Number of Hospitals Included
179 21 24.6 6.2 14.413.711.7 10.34.2All YearsModel A 12.1 2
74 8 10.1 3.3 16.013.710.8 9.62.71996 12.2 2
56 9 7.4 7.1 22.213.216.1 14.62.41997 12.0 2
49 4 7.1 0.0 14.314.58.2 6.82.31998 12.1 2
178 21 23.4 6.8 14.913.211.8 10.94.0All YearsModel B 12.1 2
73 8 9.4 3.9 16.812.911.0 10.32.51996 12.2 2
56 9 8.0 6.8 20.414.216.1 13.62.31997 12.0 2
49 4 6.0 0.0 16.312.38.2 8.02.11998 12.1 2
Yearly Risk Adjusted Death Rates (%)with 95% Confidence Bounds
Model A
0
10
20
30
40
50
60
1996 1997 1998
Statewide
Yearly Risk Adjusted Death Rates (%)with 95% Confidence Bounds
Model B
0
10
20
30
40
50
60
1996 1997 1998
Statewide
Office of Statewide Health Planning and DevelopmentCalifornia Hospital Outcomes Project

Detailed Statistical Resultsfor Acute Myocardial Infarction Mortality
Statewide Death Rate
(%)
Number of Observed
Deaths
Number of Expected Deaths Lower Upper
Expected Death Rate
(%)
Observed Death Rate
(%)
Risk Adjusted Death Rate 95% Confidence Bounds
Number of Cases
Included
Standard Deviation of Observed
Deaths
Risk-Adjusted
Death Rate (%)
Probability This Rate
Occurred by Chance
Lake County: Adventist Health - Redbud Community Hospital
87 13 14.6 5.6 16.016.814.9 0.37510.83.2All YearsModel A 12.08912
42 5 7.0 1.2 16.216.711.9 0.2558.72.21996 12.17742
28 5 4.0 4.7 25.514.217.9 0.36515.11.81997 12.02517
17 3 3.6 0.0 20.021.317.6 0.48710.01.51998 12.06405
87 13 13.2 6.5 17.515.114.9 0.55412.03.1All YearsModel B 12.10683
42 5 6.1 1.8 18.214.511.9 0.40310.02.11996 12.18490
28 5 3.8 5.5 25.913.717.9 0.32815.71.71997 12.03332
17 3 3.2 0.3 22.119.017.6 0.58811.21.51998 12.10273
Yearly Risk Adjusted Death Rates (%)with 95% Confidence Bounds
Model A
0
10
20
30
40
50
60
70
80
90
100
1996 1997 1998
Statewide
Yearly Risk Adjusted Death Rates (%)with 95% Confidence Bounds
Model B
0
10
20
30
40
50
60
70
80
90
100
1996 1997 1998
Statewide
‡ Hospital sent comment letter Office of Statewide Health Planning and DevelopmentCalifornia Hospital Outcomes Project
Page 98

Detailed Statistical Resultsfor Acute Myocardial Infarction Mortality
Statewide Death Rate
(%)
Number of Observed
Deaths
Number of Expected Deaths Lower Upper
Expected Death Rate
(%)
Observed Death Rate
(%)
Risk Adjusted Death Rate 95% Confidence Bounds
Number of Cases
Included
Standard Deviation of Observed
Deaths
Risk-Adjusted
Death Rate (%)
Probability This Rate
Occurred by Chance
Lake County: Sutter Lakeside Hospital
92 8 10.0 3.1 16.310.88.7 0.3069.72.8All YearsModel A 12.08912
32 3 3.1 0.0 23.79.79.4 0.62511.81.61996 12.17742
28 4 3.4 3.1 25.212.214.3 0.45214.11.61997 12.02517
32 1 3.5 0.0 14.810.83.1 0.1083.51.71998 12.06405
91 8 10.3 3.4 15.511.38.8 0.2559.42.6All YearsModel B 12.10683
31 3 3.3 0.7 21.310.79.7 0.56811.01.41996 12.18490
28 4 4.1 2.6 20.714.714.3 0.60711.71.61997 12.03332
32 1 2.8 0.0 17.08.83.1 0.1974.31.51998 12.10273
Yearly Risk Adjusted Death Rates (%)with 95% Confidence Bounds
Model A
0
10
20
30
40
50
60
70
80
90
100
1996 1997 1998
Statewide
Yearly Risk Adjusted Death Rates (%)with 95% Confidence Bounds
Model B
0
10
20
30
40
50
60
70
80
90
100
1996 1997 1998
Statewide
‡ Hospital sent comment letter Office of Statewide Health Planning and DevelopmentCalifornia Hospital Outcomes Project

Detailed Statistical Resultsfor Acute Myocardial Infarction Mortality
Statewide Death Rate
(%)
Number of Observed
Deaths
Number of Expected Deaths Lower Upper
Expected Death Rate
(%)
Observed Death Rate
(%)
Risk Adjusted Death Rate 95% Confidence Bounds
Number of Cases
Included
Standard Deviation of Observed
Deaths
Risk-Adjusted
Death Rate (%)
Lassen County Summary
Number of Hospitals Included
7 1 1.5 0.0 23.721.514.3 8.11.0All YearsModel A 12.1 1
2 0 0.2 0.0 47.911.00.0 0.00.41996 12.2 1
4 1 0.8 0.0 35.120.925.0 14.40.71997 12.0 1
1 0 0.4 0.0 26.444.50.0 0.00.51998 12.1 1
7 1 1.0 0.0 33.014.114.3 12.30.9All YearsModel B 12.1 1
2 0 0.1 0.0 63.36.60.0 0.00.41996 12.2 1
4 1 0.6 0.0 45.415.225.0 19.80.71997 12.0 1
1 0 0.2 0.0 41.524.70.0 0.00.41998 12.1 1
Yearly Risk Adjusted Death Rates (%)with 95% Confidence Bounds
Model A
0
10
20
30
40
50
60
1996 1997 1998
Statewide
Yearly Risk Adjusted Death Rates (%)with 95% Confidence Bounds
Model B
0
10
20
30
40
50
60
1996 1997 1998
Statewide
Office of Statewide Health Planning and DevelopmentCalifornia Hospital Outcomes Project

Detailed Statistical Resultsfor Acute Myocardial Infarction Mortality
Statewide Death Rate
(%)
Number of Observed
Deaths
Number of Expected Deaths Lower Upper
Expected Death Rate
(%)
Observed Death Rate
(%)
Risk Adjusted Death Rate 95% Confidence Bounds
Number of Cases
Included
Standard Deviation of Observed
Deaths
Risk-Adjusted
Death Rate (%)
Probability This Rate
Occurred by Chance
Lassen County: Lassen Community Hospital
7 1 1.5 0.0 23.721.514.3 0.5268.11.0All YearsModel A 12.08912
2 0 0.2 0.0 47.911.00.0 0.7920.00.41996 12.17742
4 1 0.8 0.0 35.120.925.0 0.65114.40.71997 12.02517
1 0 0.4 0.0 26.444.50.0 0.5550.00.51998 12.06405
7 1 1.0 0.0 33.014.114.3 0.68112.30.9All YearsModel B 12.10683
2 0 0.1 0.0 63.36.60.0 0.8720.00.41996 12.18490
4 1 0.6 0.0 45.415.225.0 0.51519.80.71997 12.03332
1 0 0.2 0.0 41.524.70.0 0.7530.00.41998 12.10273
Yearly Risk Adjusted Death Rates (%)with 95% Confidence Bounds
Model A
0
10
20
30
40
50
60
70
80
90
100
1996 1997 1998
Statewide
Yearly Risk Adjusted Death Rates (%)with 95% Confidence Bounds
Model B
0
10
20
30
40
50
60
70
80
90
100
1996 1997 1998
Statewide
‡ Hospital sent comment letter Office of Statewide Health Planning and DevelopmentCalifornia Hospital Outcomes Project
Page 101

Detailed Statistical Resultsfor Acute Myocardial Infarction Mortality
Statewide Death Rate
(%)
Number of Observed
Deaths
Number of Expected Deaths Lower Upper
Expected Death Rate
(%)
Observed Death Rate
(%)
Risk Adjusted Death Rate 95% Confidence Bounds
Number of Cases
Included
Standard Deviation of Observed
Deaths
Risk-Adjusted
Death Rate (%)
Los Angeles County Summary
Number of Hospitals Included
32,318 3,882 3,945.9 11.6 12.212.212.0 11.955.4All YearsModel A 12.1 109
11,016 1,308 1,348.6 11.2 12.412.211.9 11.832.41996 12.2 109
10,934 1,330 1,327.8 11.5 12.612.112.2 12.032.11997 12.0 109
10,368 1,244 1,269.5 11.2 12.412.212.0 11.831.41998 12.1 109
31,929 3,836 4,040.6 11.2 11.812.712.0 11.551.1All YearsModel B 12.1 109
10,854 1,292 1,367.0 11.0 12.012.611.9 11.529.81996 12.2 109
10,854 1,318 1,368.3 11.1 12.112.612.1 11.629.71997 12.0 109
10,221 1,226 1,305.3 10.8 11.912.812.0 11.429.01998 12.1 109
Yearly Risk Adjusted Death Rates (%)with 95% Confidence Bounds
Model A
0
10
20
30
40
50
60
1996 1997 1998
Statewide
Yearly Risk Adjusted Death Rates (%)with 95% Confidence Bounds
Model B
0
10
20
30
40
50
60
1996 1997 1998
Statewide
Office of Statewide Health Planning and DevelopmentCalifornia Hospital Outcomes Project

Detailed Statistical Resultsfor Acute Myocardial Infarction Mortality
Statewide Death Rate
(%)
Number of Observed
Deaths
Number of Expected Deaths Lower Upper
Expected Death Rate
(%)
Observed Death Rate
(%)
Risk Adjusted Death Rate 95% Confidence Bounds
Number of Cases
Included
Standard Deviation of Observed
Deaths
Risk-Adjusted
Death Rate (%)
Probability This Rate
Occurred by Chance
Los Angeles County: Alhambra Hospital Medical Center
111 21 16.1 10.6 20.914.518.9 0.10915.73.5All YearsModel A 12.08912
47 11 5.7 14.7 32.412.123.4 0.01623.62.11996 12.17742
29 4 4.9 0.5 19.017.113.8 0.4279.71.91997 12.02517
35 6 5.5 4.4 22.015.717.1 0.47913.22.11998 12.06405
111 21 18.1 9.6 18.616.318.9 0.23314.13.4All YearsModel B 12.10683
47 11 6.5 13.1 28.413.723.4 0.03020.82.11996 12.18490
29 4 5.0 1.0 18.117.413.8 0.3979.51.81997 12.03332
35 6 6.6 3.8 18.418.717.1 0.50311.12.01998 12.10273
Yearly Risk Adjusted Death Rates (%)with 95% Confidence Bounds
Model A
0
10
20
30
40
50
60
70
80
90
100
1996 1997 1998
Statewide
Yearly Risk Adjusted Death Rates (%)with 95% Confidence Bounds
Model B
0
10
20
30
40
50
60
70
80
90
100
1996 1997 1998
Statewide
‡ Hospital sent comment letter Office of Statewide Health Planning and DevelopmentCalifornia Hospital Outcomes Project

Detailed Statistical Resultsfor Acute Myocardial Infarction Mortality
Statewide Death Rate
(%)
Number of Observed
Deaths
Number of Expected Deaths Lower Upper
Expected Death Rate
(%)
Observed Death Rate
(%)
Risk Adjusted Death Rate 95% Confidence Bounds
Number of Cases
Included
Standard Deviation of Observed
Deaths
Risk-Adjusted
Death Rate (%)
Probability This Rate
Occurred by Chance
Los Angeles County: Antelope Valley Hospital
581 59 51.9 10.8 16.78.910.2 0.15513.76.5All YearsModel A 12.08912
192 19 17.5 8.1 18.39.19.9 0.38913.23.81996 12.17742
191 24 18.6 10.6 20.59.712.6 0.10415.53.91997 12.02517
198 16 15.8 6.8 17.78.08.1 0.51812.23.61998 12.06405
581 59 61.4 9.2 14.110.610.2 0.38611.66.3All YearsModel B 12.10683
192 19 21.6 6.7 14.711.39.9 0.28510.73.61996 12.18490
191 24 24.4 8.1 15.612.812.6 0.51911.83.81997 12.03332
198 16 15.4 7.3 17.87.88.1 0.47712.63.41998 12.10273
Yearly Risk Adjusted Death Rates (%)with 95% Confidence Bounds
Model A
0
10
20
30
40
50
60
70
80
90
100
1996 1997 1998
Statewide
Yearly Risk Adjusted Death Rates (%)with 95% Confidence Bounds
Model B
0
10
20
30
40
50
60
70
80
90
100
1996 1997 1998
Statewide
‡ Hospital sent comment letter Office of Statewide Health Planning and DevelopmentCalifornia Hospital Outcomes Project
Page 104

Detailed Statistical Resultsfor Acute Myocardial Infarction Mortality
Statewide Death Rate
(%)
Number of Observed
Deaths
Number of Expected Deaths Lower Upper
Expected Death Rate
(%)
Observed Death Rate
(%)
Risk Adjusted Death Rate 95% Confidence Bounds
Number of Cases
Included
Standard Deviation of Observed
Deaths
Risk-Adjusted
Death Rate (%)
Probability This Rate
Occurred by Chance
Los Angeles County: Bay Harbor Hospital
151 25 19.1 11.0 20.712.616.6 0.08415.83.9All YearsModel A 12.08912
57 9 6.7 7.9 24.511.815.8 0.22116.22.31996 12.17742
46 9 5.8 10.2 27.212.619.6 0.10218.72.11997 12.02517
48 7 6.5 4.7 21.213.614.6 0.48612.92.31998 12.06405
151 25 16.9 13.0 22.811.216.6 0.01817.93.5All YearsModel B 12.10683
57 9 5.1 12.1 31.38.915.8 0.05321.72.01996 12.18490
46 9 5.0 12.6 30.510.919.6 0.04021.61.91997 12.03332
48 7 6.8 5.1 19.814.214.6 0.54512.42.11998 12.10273
Yearly Risk Adjusted Death Rates (%)with 95% Confidence Bounds
Model A
0
10
20
30
40
50
60
70
80
90
100
1996 1997 1998
Statewide
Yearly Risk Adjusted Death Rates (%)with 95% Confidence Bounds
Model B
0
10
20
30
40
50
60
70
80
90
100
1996 1997 1998
Statewide
‡ Hospital sent comment letter Office of Statewide Health Planning and DevelopmentCalifornia Hospital Outcomes Project

Detailed Statistical Resultsfor Acute Myocardial Infarction Mortality
Statewide Death Rate
(%)
Number of Observed
Deaths
Number of Expected Deaths Lower Upper
Expected Death Rate
(%)
Observed Death Rate
(%)
Risk Adjusted Death Rate 95% Confidence Bounds
Number of Cases
Included
Standard Deviation of Observed
Deaths
Risk-Adjusted
Death Rate (%)
Probability This Rate
Occurred by Chance
Los Angeles County: Bellflower Medical Center
82 12 12.5 5.8 17.415.214.6 0.51211.63.1All YearsModel A 12.08912
21 3 3.4 0.0 21.716.414.3 0.53610.61.61996 12.17742
32 3 4.8 0.0 16.715.19.4 0.2497.51.91997 12.02517
29 6 4.2 7.1 27.214.520.7 0.22917.21.81998 12.06405
82 12 13.1 6.0 16.216.014.6 0.42511.12.8All YearsModel B 12.10683
21 3 3.3 0.9 21.215.714.3 0.57711.11.41996 12.18490
32 3 4.6 0.0 16.814.59.4 0.2687.81.81997 12.03332
29 6 5.2 6.2 21.917.820.7 0.40714.11.71998 12.10273
Yearly Risk Adjusted Death Rates (%)with 95% Confidence Bounds
Model A
0
10
20
30
40
50
60
70
80
90
100
1996 1997 1998
Statewide
Yearly Risk Adjusted Death Rates (%)with 95% Confidence Bounds
Model B
0
10
20
30
40
50
60
70
80
90
100
1996 1997 1998
Statewide
‡ Hospital sent comment letter Office of Statewide Health Planning and DevelopmentCalifornia Hospital Outcomes Project
Page 106

Detailed Statistical Resultsfor Acute Myocardial Infarction Mortality
Statewide Death Rate
(%)
Number of Observed
Deaths
Number of Expected Deaths Lower Upper
Expected Death Rate
(%)
Observed Death Rate
(%)
Risk Adjusted Death Rate 95% Confidence Bounds
Number of Cases
Included
Standard Deviation of Observed
Deaths
Risk-Adjusted
Death Rate (%)
Probability This Rate
Occurred by Chance
Los Angeles County: Beverly Hospital
316 43 40.7 9.5 16.012.913.6 0.36712.85.6All YearsModel A 12.08912
106 13 11.5 7.4 20.110.912.3 0.36013.83.11996 12.17742
110 19 15.9 9.2 19.514.517.3 0.22714.33.51997 12.02517
100 11 13.2 4.4 15.613.211.0 0.29710.03.11998 12.06405
314 43 41.4 9.6 15.513.213.7 0.40612.65.1All YearsModel B 12.10683
105 13 10.4 9.0 21.49.912.4 0.21515.22.71996 12.18490
109 19 19.2 7.8 16.017.617.4 0.54411.93.31997 12.03332
100 11 11.7 5.6 17.111.711.0 0.47911.32.81998 12.10273
Yearly Risk Adjusted Death Rates (%)with 95% Confidence Bounds
Model A
0
10
20
30
40
50
60
70
80
90
100
1996 1997 1998
Statewide
Yearly Risk Adjusted Death Rates (%)with 95% Confidence Bounds
Model B
0
10
20
30
40
50
60
70
80
90
100
1996 1997 1998
Statewide
‡ Hospital sent comment letter Office of Statewide Health Planning and DevelopmentCalifornia Hospital Outcomes Project

Detailed Statistical Resultsfor Acute Myocardial Infarction Mortality
Statewide Death Rate
(%)
Number of Observed
Deaths
Number of Expected Deaths Lower Upper
Expected Death Rate
(%)
Observed Death Rate
(%)
Risk Adjusted Death Rate 95% Confidence Bounds
Number of Cases
Included
Standard Deviation of Observed
Deaths
Risk-Adjusted
Death Rate (%)
Probability This Rate
Occurred by Chance
Los Angeles County: Brotman Medical Center
352 62 48.9 12.4 18.313.917.6 0.02115.36.1All YearsModel A 12.08912
113 17 13.6 9.4 21.112.015.0 0.18415.33.31996 12.17742
115 18 15.3 8.9 19.513.315.7 0.25114.23.41997 12.02517
124 27 20.1 11.8 20.716.221.8 0.04816.23.81998 12.06405
351 62 57.5 10.6 15.516.417.7 0.24513.15.8All YearsModel B 12.10683
113 17 15.0 8.8 18.913.315.0 0.31113.83.21996 12.18490
115 18 17.3 8.1 16.815.115.7 0.47112.53.21997 12.03332
123 27 25.2 9.5 16.520.422.0 0.35413.03.71998 12.10273
Yearly Risk Adjusted Death Rates (%)with 95% Confidence Bounds
Model A
0
10
20
30
40
50
60
70
80
90
100
1996 1997 1998
Statewide
Yearly Risk Adjusted Death Rates (%)with 95% Confidence Bounds
Model B
0
10
20
30
40
50
60
70
80
90
100
1996 1997 1998
Statewide
‡ Hospital sent comment letter Office of Statewide Health Planning and DevelopmentCalifornia Hospital Outcomes Project
Page 108

Detailed Statistical Resultsfor Acute Myocardial Infarction Mortality
Statewide Death Rate
(%)
Number of Observed
Deaths
Number of Expected Deaths Lower Upper
Expected Death Rate
(%)
Observed Death Rate
(%)
Risk Adjusted Death Rate 95% Confidence Bounds
Number of Cases
Included
Standard Deviation of Observed
Deaths
Risk-Adjusted
Death Rate (%)
Probability This Rate
Occurred by Chance
Los Angeles County: California Hospital Medical Center - Los Angeles
287 45 36.5 11.5 18.312.715.7 0.06714.95.3All YearsModel A 12.08912
108 19 14.4 10.5 21.513.417.6 0.11216.03.31996 12.17742
88 17 10.9 12.6 25.012.419.3 0.03018.82.91997 12.02517
91 9 11.2 3.5 16.012.39.9 0.2949.73.01998 12.06405
284 44 47.4 8.8 13.716.715.5 0.28411.25.0All YearsModel B 12.10683
108 19 19.7 7.9 15.518.317.6 0.47511.73.11996 12.18490
85 16 15.3 8.4 16.818.018.8 0.46112.62.71997 12.03332
91 9 12.3 3.6 14.013.69.9 0.1448.82.71998 12.10273
Yearly Risk Adjusted Death Rates (%)with 95% Confidence Bounds
Model A
0
10
20
30
40
50
60
70
80
90
100
1996 1997 1998
Statewide
Yearly Risk Adjusted Death Rates (%)with 95% Confidence Bounds
Model B
0
10
20
30
40
50
60
70
80
90
100
1996 1997 1998
Statewide
‡ Hospital sent comment letter Office of Statewide Health Planning and DevelopmentCalifornia Hospital Outcomes Project

Detailed Statistical Resultsfor Acute Myocardial Infarction Mortality
Statewide Death Rate
(%)
Number of Observed
Deaths
Number of Expected Deaths Lower Upper
Expected Death Rate
(%)
Observed Death Rate
(%)
Risk Adjusted Death Rate 95% Confidence Bounds
Number of Cases
Included
Standard Deviation of Observed
Deaths
Risk-Adjusted
Death Rate (%)
Probability This Rate
Occurred by Chance
Los Angeles County: Cedars-Sinai Medical Center
1401 174 206.0 8.8 11.614.712.4 0.00510.212.5All YearsModel A 12.08912
439 42 61.8 5.6 10.914.19.6 0.0028.36.91996 12.17742
467 60 70.2 7.8 12.715.012.8 0.09110.37.31997 12.02517
495 72 74.1 9.3 14.115.014.5 0.42111.77.51998 12.06405
1375 171 199.7 9.0 11.714.512.4 0.00610.411.5All YearsModel B 12.10683
420 40 56.5 6.0 11.313.59.5 0.0048.66.21996 12.18490
462 60 67.7 8.3 13.014.613.0 0.14310.76.71997 12.03332
493 71 75.5 9.2 13.615.314.4 0.28411.46.91998 12.10273
Yearly Risk Adjusted Death Rates (%)with 95% Confidence Bounds
Model A
0
10
20
30
40
50
60
70
80
90
100
1996 1997 1998
Statewide
Yearly Risk Adjusted Death Rates (%)with 95% Confidence Bounds
Model B
0
10
20
30
40
50
60
70
80
90
100
1996 1997 1998
Statewide
‡ Hospital sent comment letter Office of Statewide Health Planning and DevelopmentCalifornia Hospital Outcomes Project
Page 110

Detailed Statistical Resultsfor Acute Myocardial Infarction Mortality
Statewide Death Rate
(%)
Number of Observed
Deaths
Number of Expected Deaths Lower Upper
Expected Death Rate
(%)
Observed Death Rate
(%)
Risk Adjusted Death Rate 95% Confidence Bounds
Number of Cases
Included
Standard Deviation of Observed
Deaths
Risk-Adjusted
Death Rate (%)
Probability This Rate
Occurred by Chance
Los Angeles County: Centinela Hospital Medical Center
363 52 40.4 12.2 18.911.114.3 0.02815.65.7All YearsModel A 12.08912
116 16 11.9 10.1 22.710.213.8 0.12416.43.11996 12.17742
128 16 12.4 9.4 21.69.712.5 0.16615.53.21997 12.02517
119 20 16.1 9.9 20.213.516.8 0.16315.03.51998 12.06405
359 52 37.8 13.6 19.710.514.5 0.00416.64.9All YearsModel B 12.10683
116 16 11.7 11.1 22.210.113.8 0.08616.62.71996 12.18490
124 16 10.0 12.7 25.68.112.9 0.02819.22.71997 12.03332
119 20 16.1 10.6 19.513.516.8 0.13115.03.01998 12.10273
Yearly Risk Adjusted Death Rates (%)with 95% Confidence Bounds
Model A
0
10
20
30
40
50
60
70
80
90
100
1996 1997 1998
Statewide
Yearly Risk Adjusted Death Rates (%)with 95% Confidence Bounds
Model B
0
10
20
30
40
50
60
70
80
90
100
1996 1997 1998
Statewide
‡ Hospital sent comment letter Office of Statewide Health Planning and DevelopmentCalifornia Hospital Outcomes Project

Detailed Statistical Resultsfor Acute Myocardial Infarction Mortality
Statewide Death Rate
(%)
Number of Observed
Deaths
Number of Expected Deaths Lower Upper
Expected Death Rate
(%)
Observed Death Rate
(%)
Risk Adjusted Death Rate 95% Confidence Bounds
Number of Cases
Included
Standard Deviation of Observed
Deaths
Risk-Adjusted
Death Rate (%)
Probability This Rate
Occurred by Chance
Los Angeles County: Century City Hospital
137 19 18.4 7.6 17.313.513.9 0.48212.53.7All YearsModel A 12.08912
60 8 7.5 5.2 20.712.513.3 0.48712.92.51996 12.17742
40 5 5.4 2.4 19.813.512.5 0.53611.12.01997 12.02517
37 6 5.5 4.6 21.814.816.2 0.48113.22.01998 12.06405
134 18 16.8 8.1 17.812.513.4 0.41013.03.4All YearsModel B 12.10683
58 7 5.9 5.7 23.010.312.1 0.38114.32.21996 12.18490
40 5 5.7 2.7 18.314.312.5 0.46910.51.91997 12.03332
36 6 5.1 5.4 22.814.316.7 0.40714.11.91998 12.10273
Yearly Risk Adjusted Death Rates (%)with 95% Confidence Bounds
Model A
0
10
20
30
40
50
60
70
80
90
100
1996 1997 1998
Statewide
Yearly Risk Adjusted Death Rates (%)with 95% Confidence Bounds
Model B
0
10
20
30
40
50
60
70
80
90
100
1996 1997 1998
Statewide
‡ Hospital sent comment letter Office of Statewide Health Planning and DevelopmentCalifornia Hospital Outcomes Project
Page 112

Detailed Statistical Resultsfor Acute Myocardial Infarction Mortality
Statewide Death Rate
(%)
Number of Observed
Deaths
Number of Expected Deaths Lower Upper
Expected Death Rate
(%)
Observed Death Rate
(%)
Risk Adjusted Death Rate 95% Confidence Bounds
Number of Cases
Included
Standard Deviation of Observed
Deaths
Risk-Adjusted
Death Rate (%)
Probability This Rate
Occurred by Chance
Los Angeles County: Citrus Valley Med Center - Queen of the Valley Campus
1027 114 109.9 10.5 14.610.711.1 0.34612.59.4All YearsModel A 12.08912
365 37 38.6 8.2 15.110.610.1 0.43311.75.61996 12.17742
343 42 38.5 9.7 16.511.212.2 0.28713.15.51997 12.02517
319 35 32.8 9.2 16.610.311.0 0.36712.95.11998 12.06405
1027 114 105.4 11.2 15.010.311.1 0.17013.18.5All YearsModel B 12.10683
365 37 40.2 8.1 14.311.010.1 0.30111.25.21996 12.18490
343 42 34.3 11.3 18.110.012.2 0.07714.75.01997 12.03332
319 35 30.8 10.2 17.49.711.0 0.21113.84.71998 12.10273
Yearly Risk Adjusted Death Rates (%)with 95% Confidence Bounds
Model A
0
10
20
30
40
50
60
70
80
90
100
1996 1997 1998
Statewide
Yearly Risk Adjusted Death Rates (%)with 95% Confidence Bounds
Model B
0
10
20
30
40
50
60
70
80
90
100
1996 1997 1998
Statewide
‡ Hospital sent comment letter Office of Statewide Health Planning and DevelopmentCalifornia Hospital Outcomes Project

Detailed Statistical Resultsfor Acute Myocardial Infarction Mortality
Statewide Death Rate
(%)
Number of Observed
Deaths
Number of Expected Deaths Lower Upper
Expected Death Rate
(%)
Observed Death Rate
(%)
Risk Adjusted Death Rate 95% Confidence Bounds
Number of Cases
Included
Standard Deviation of Observed
Deaths
Risk-Adjusted
Death Rate (%)
Probability This Rate
Occurred by Chance
Los Angeles County: City of Hope National Medical Center
6 0 0.7 0.0 27.011.10.0 0.4880.00.8All YearsModel A 12.08912
3 0 0.3 0.0 44.58.70.0 0.7600.00.51996 12.17742
2 0 0.2 0.0 49.59.90.0 0.8090.00.41997 12.02517
1 0 0.2 0.0 46.520.60.0 0.7940.00.41998 12.06405
6 0 0.5 0.0 31.48.40.0 0.5850.00.7All YearsModel B 12.10683
3 0 0.3 0.0 43.18.80.0 0.7520.00.51996 12.18490
2 0 0.1 0.0 67.35.70.0 0.8890.00.31997 12.03332
1 0 0.1 0.0 63.112.40.0 0.8760.00.31998 12.10273
Yearly Risk Adjusted Death Rates (%)with 95% Confidence Bounds
Model A
0
10
20
30
40
50
60
70
80
90
100
1996 1997 1998
Statewide
Yearly Risk Adjusted Death Rates (%)with 95% Confidence Bounds
Model B
0
10
20
30
40
50
60
70
80
90
100
1996 1997 1998
Statewide
‡ Hospital sent comment letter Office of Statewide Health Planning and DevelopmentCalifornia Hospital Outcomes Project
Page 114

Detailed Statistical Resultsfor Acute Myocardial Infarction Mortality
Statewide Death Rate
(%)
Number of Observed
Deaths
Number of Expected Deaths Lower Upper
Expected Death Rate
(%)
Observed Death Rate
(%)
Risk Adjusted Death Rate 95% Confidence Bounds
Number of Cases
Included
Standard Deviation of Observed
Deaths
Risk-Adjusted
Death Rate (%)
Probability This Rate
Occurred by Chance
Los Angeles County: Coast Plaza Doctors Hospital
70 14 9.4 11.5 24.413.520.0 0.06217.92.6All YearsModel A 12.08912
40 7 5.7 6.6 23.314.317.5 0.33214.92.01996 12.17742
30 7 3.7 12.3 32.712.523.3 0.05022.51.61997 12.02517
1998 Excluded
70 14 10.7 10.4 21.315.320.0 0.12615.92.4All YearsModel B 12.10683
40 7 7.1 5.6 18.417.817.5 0.58912.01.91996 12.18490
30 7 3.6 13.5 33.711.923.3 0.03323.61.51997 12.03332
1998 Excluded
Yearly Risk Adjusted Death Rates (%)with 95% Confidence Bounds
Model A
0
10
20
30
40
50
60
70
80
90
100
1996 1997 1998
Statewide
Yearly Risk Adjusted Death Rates (%)with 95% Confidence Bounds
Model B
0
10
20
30
40
50
60
70
80
90
100
1996 1997 1998
Statewide
‡ Hospital sent comment letter Office of Statewide Health Planning and DevelopmentCalifornia Hospital Outcomes Project

Detailed Statistical Resultsfor Acute Myocardial Infarction Mortality
Statewide Death Rate
(%)
Number of Observed
Deaths
Number of Expected Deaths Lower Upper
Expected Death Rate
(%)
Observed Death Rate
(%)
Risk Adjusted Death Rate 95% Confidence Bounds
Number of Cases
Included
Standard Deviation of Observed
Deaths
Risk-Adjusted
Death Rate (%)
Probability This Rate
Occurred by Chance
Los Angeles County: Community & Mission Hospitals - Huntington Park
57 4 6.9 0.0 15.112.07.0 0.1567.12.3All YearsModel A 12.08912
21 2 3.0 0.0 20.114.59.5 0.3858.01.61996 12.17742
26 2 2.4 0.0 23.79.47.7 0.5519.91.41997 12.02517
10 0 1.4 0.0 17.613.70.0 0.2030.01.01998 12.06405
57 4 8.2 0.0 12.314.47.0 0.0395.92.2All YearsModel B 12.10683
21 2 3.1 0.0 19.514.69.5 0.3718.01.51996 12.18490
26 2 3.3 0.0 17.212.57.7 0.2967.41.41997 12.03332
10 0 1.9 0.0 11.719.00.0 0.0530.00.91998 12.10273
Yearly Risk Adjusted Death Rates (%)with 95% Confidence Bounds
Model A
0
10
20
30
40
50
60
70
80
90
100
1996 1997 1998
Statewide
Yearly Risk Adjusted Death Rates (%)with 95% Confidence Bounds
Model B
0
10
20
30
40
50
60
70
80
90
100
1996 1997 1998
Statewide
‡ Hospital sent comment letter Office of Statewide Health Planning and DevelopmentCalifornia Hospital Outcomes Project
Page 116

Detailed Statistical Resultsfor Acute Myocardial Infarction Mortality
Statewide Death Rate
(%)
Number of Observed
Deaths
Number of Expected Deaths Lower Upper
Expected Death Rate
(%)
Observed Death Rate
(%)
Risk Adjusted Death Rate 95% Confidence Bounds
Number of Cases
Included
Standard Deviation of Observed
Deaths
Risk-Adjusted
Death Rate (%)
Probability This Rate
Occurred by Chance
Los Angeles County: Community and Mission Hospital
12 1 1.8 0.0 22.014.68.3 0.4406.91.1All YearsModel A 12.08912
10 0 1.7 0.0 15.317.10.0 0.1260.01.11996 12.17742
2 1 0.0 2.350.0 0.045100.00.21997 12.02517
01998 12.06405
12 1 1.7 0.0 21.014.28.3 0.4447.11.0All YearsModel B 12.10683
10 0 1.7 0.0 14.116.60.0 0.1010.01.01996 12.18490
2 1 0.0 2.150.0 0.043100.00.21997 12.03332
01998 12.10273
Yearly Risk Adjusted Death Rates (%)with 95% Confidence Bounds
Model A
0
10
20
30
40
50
60
70
80
90
100
1996 1997 1998
Statewide
Yearly Risk Adjusted Death Rates (%)with 95% Confidence Bounds
Model B
0
10
20
30
40
50
60
70
80
90
100
1996 1997 1998
Statewide
‡ Hospital sent comment letter Office of Statewide Health Planning and DevelopmentCalifornia Hospital Outcomes Project

Detailed Statistical Resultsfor Acute Myocardial Infarction Mortality
Statewide Death Rate
(%)
Number of Observed
Deaths
Number of Expected Deaths Lower Upper
Expected Death Rate
(%)
Observed Death Rate
(%)
Risk Adjusted Death Rate 95% Confidence Bounds
Number of Cases
Included
Standard Deviation of Observed
Deaths
Risk-Adjusted
Death Rate (%)
Probability This Rate
Occurred by Chance
Los Angeles County: Community Hospital of Gardena
13 1 1.5 0.0 25.711.47.7 0.5478.21.1All YearsModel A 12.08912
3 0 0.3 0.0 40.89.70.0 0.7290.00.51996 12.17742
7 1 0.8 0.0 38.511.414.3 0.59315.00.81997 12.02517
3 0 0.4 0.0 34.013.00.0 0.6480.00.61998 12.06405
13 1 2.6 0.0 13.920.37.7 0.1154.61.0All YearsModel B 12.10683
3 0 1.0 0.0 12.432.20.0 0.1430.00.51996 12.18490
7 1 1.2 0.0 23.516.914.3 0.72910.10.71997 12.03332
3 0 0.5 0.0 29.516.20.0 0.5710.00.61998 12.10273
Yearly Risk Adjusted Death Rates (%)with 95% Confidence Bounds
Model A
0
10
20
30
40
50
60
70
80
90
100
1996 1997 1998
Statewide
Yearly Risk Adjusted Death Rates (%)with 95% Confidence Bounds
Model B
0
10
20
30
40
50
60
70
80
90
100
1996 1997 1998
Statewide
‡ Hospital sent comment letter Office of Statewide Health Planning and DevelopmentCalifornia Hospital Outcomes Project
Page 118

Detailed Statistical Resultsfor Acute Myocardial Infarction Mortality
Statewide Death Rate
(%)
Number of Observed
Deaths
Number of Expected Deaths Lower Upper
Expected Death Rate
(%)
Observed Death Rate
(%)
Risk Adjusted Death Rate 95% Confidence Bounds
Number of Cases
Included
Standard Deviation of Observed
Deaths
Risk-Adjusted
Death Rate (%)
Probability This Rate
Occurred by Chance
Los Angeles County: Daniel Freeman Marina Hospital
299 48 42.0 10.6 17.014.016.1 0.16313.85.6All YearsModel A 12.08912
106 21 16.3 10.6 20.815.419.8 0.11315.73.51996 12.17742
99 12 12.0 5.9 18.112.112.1 0.57412.03.11997 12.02517
94 15 13.7 7.8 18.714.616.0 0.38913.23.21998 12.06405
299 48 46.4 9.8 15.215.516.1 0.41612.55.3All YearsModel B 12.10683
106 21 20.0 8.9 16.718.919.8 0.43612.83.31996 12.18490
99 12 12.2 6.4 17.412.312.1 0.55711.92.81997 12.03332
94 15 14.2 7.7 17.815.216.0 0.45812.73.01998 12.10273
Yearly Risk Adjusted Death Rates (%)with 95% Confidence Bounds
Model A
0
10
20
30
40
50
60
70
80
90
100
1996 1997 1998
Statewide
Yearly Risk Adjusted Death Rates (%)with 95% Confidence Bounds
Model B
0
10
20
30
40
50
60
70
80
90
100
1996 1997 1998
Statewide
‡ Hospital sent comment letter Office of Statewide Health Planning and DevelopmentCalifornia Hospital Outcomes Project

Detailed Statistical Resultsfor Acute Myocardial Infarction Mortality
Statewide Death Rate
(%)
Number of Observed
Deaths
Number of Expected Deaths Lower Upper
Expected Death Rate
(%)
Observed Death Rate
(%)
Risk Adjusted Death Rate 95% Confidence Bounds
Number of Cases
Included
Standard Deviation of Observed
Deaths
Risk-Adjusted
Death Rate (%)
Probability This Rate
Occurred by Chance
Los Angeles County: Daniel Freeman Memorial Hospital
476 53 61.3 7.8 13.112.911.1 0.12910.56.9All YearsModel A 12.08912
178 26 25.7 8.2 16.514.414.6 0.50512.34.41996 12.17742
150 15 18.7 4.8 14.512.510.0 0.2049.63.81997 12.02517
148 12 16.9 3.5 13.611.48.1 0.1088.63.61998 12.06405
476 53 52.2 9.5 15.111.011.1 0.47112.36.1All YearsModel B 12.10683
178 26 22.9 9.7 18.012.814.6 0.24913.94.01996 12.18490
150 15 15.6 6.5 16.610.410.0 0.49811.63.31997 12.03332
148 12 13.7 5.1 16.19.38.1 0.36310.63.21998 12.10273
Yearly Risk Adjusted Death Rates (%)with 95% Confidence Bounds
Model A
0
10
20
30
40
50
60
70
80
90
100
1996 1997 1998
Statewide
Yearly Risk Adjusted Death Rates (%)with 95% Confidence Bounds
Model B
0
10
20
30
40
50
60
70
80
90
100
1996 1997 1998
Statewide
‡ Hospital sent comment letter Office of Statewide Health Planning and DevelopmentCalifornia Hospital Outcomes Project
Page 120

Detailed Statistical Resultsfor Acute Myocardial Infarction Mortality
Statewide Death Rate
(%)
Number of Observed
Deaths
Number of Expected Deaths Lower Upper
Expected Death Rate
(%)
Observed Death Rate
(%)
Risk Adjusted Death Rate 95% Confidence Bounds
Number of Cases
Included
Standard Deviation of Observed
Deaths
Risk-Adjusted
Death Rate (%)
Probability This Rate
Occurred by Chance
Los Angeles County: Desert Palms Community Hospital
17 2 1.7 0.0 31.09.911.8 0.52114.31.2All YearsModel A 12.08912
17 2 1.7 0.0 31.39.911.8 0.52114.41.21996 12.17742
01997 12.02517
01998 12.06405
17 2 2.4 0.0 21.314.311.8 0.54210.01.2All YearsModel B 12.10683
17 2 2.4 0.0 21.414.311.8 0.54210.01.21996 12.18490
01997 12.03332
01998 12.10273
Yearly Risk Adjusted Death Rates (%)with 95% Confidence Bounds
Model A
0
10
20
30
40
50
60
70
80
90
100
1996 1997 1998
Statewide
Yearly Risk Adjusted Death Rates (%)with 95% Confidence Bounds
Model B
0
10
20
30
40
50
60
70
80
90
100
1996 1997 1998
Statewide
‡ Hospital sent comment letter Office of Statewide Health Planning and DevelopmentCalifornia Hospital Outcomes Project

Detailed Statistical Resultsfor Acute Myocardial Infarction Mortality
Statewide Death Rate
(%)
Number of Observed
Deaths
Number of Expected Deaths Lower Upper
Expected Death Rate
(%)
Observed Death Rate
(%)
Risk Adjusted Death Rate 95% Confidence Bounds
Number of Cases
Included
Standard Deviation of Observed
Deaths
Risk-Adjusted
Death Rate (%)
Probability This Rate
Occurred by Chance
Los Angeles County: Doctors Hospital of West Covina
4 0 0.7 0.0 25.416.60.0 0.4680.00.7All YearsModel A 12.08912
2 0 0.4 0.0 33.818.50.0 0.6510.00.51996 12.17742
1 0 0.2 0.0 41.824.20.0 0.7580.00.41997 12.02517
1 0 0.1 0.0 100.05.10.0 0.9490.00.21998 12.06405
4 0 0.6 0.0 27.214.10.0 0.5180.00.6All YearsModel B 12.10683
2 0 0.4 0.0 32.019.10.0 0.6310.00.51996 12.18490
1 0 0.2 0.0 54.415.80.0 0.8420.00.41997 12.03332
1 0 0.0 0.0 100.02.50.0 0.9750.00.21998 12.10273
Yearly Risk Adjusted Death Rates (%)with 95% Confidence Bounds
Model A
0
10
20
30
40
50
60
70
80
90
100
1996 1997 1998
Statewide
Yearly Risk Adjusted Death Rates (%)with 95% Confidence Bounds
Model B
0
10
20
30
40
50
60
70
80
90
100
1996 1997 1998
Statewide
‡ Hospital sent comment letter Office of Statewide Health Planning and DevelopmentCalifornia Hospital Outcomes Project
Page 122

Detailed Statistical Resultsfor Acute Myocardial Infarction Mortality
Statewide Death Rate
(%)
Number of Observed
Deaths
Number of Expected Deaths Lower Upper
Expected Death Rate
(%)
Observed Death Rate
(%)
Risk Adjusted Death Rate 95% Confidence Bounds
Number of Cases
Included
Standard Deviation of Observed
Deaths
Risk-Adjusted
Death Rate (%)
Probability This Rate
Occurred by Chance
Los Angeles County: Downey Community Hospital
529 78 67.5 11.4 16.512.814.7 0.08714.07.3All YearsModel A 12.08912
172 28 20.3 12.1 21.511.816.3 0.04116.84.01996 12.17742
183 24 22.4 8.5 17.312.213.1 0.38612.94.21997 12.02517
174 26 24.8 8.5 16.814.314.9 0.43012.64.41998 12.06405
459 71 64.1 11.1 15.714.015.5 0.15513.46.3All YearsModel B 12.10683
104 21 15.2 12.1 21.614.620.2 0.04216.93.01996 12.18490
183 24 24.1 8.2 15.713.213.1 0.54912.03.81997 12.03332
172 26 24.8 8.8 16.514.415.1 0.42812.74.01998 12.10273
Yearly Risk Adjusted Death Rates (%)with 95% Confidence Bounds
Model A
0
10
20
30
40
50
60
70
80
90
100
1996 1997 1998
Statewide
Yearly Risk Adjusted Death Rates (%)with 95% Confidence Bounds
Model B
0
10
20
30
40
50
60
70
80
90
100
1996 1997 1998
Statewide
‡ Hospital sent comment letter Office of Statewide Health Planning and DevelopmentCalifornia Hospital Outcomes Project

Detailed Statistical Resultsfor Acute Myocardial Infarction Mortality
Statewide Death Rate
(%)
Number of Observed
Deaths
Number of Expected Deaths Lower Upper
Expected Death Rate
(%)
Observed Death Rate
(%)
Risk Adjusted Death Rate 95% Confidence Bounds
Number of Cases
Included
Standard Deviation of Observed
Deaths
Risk-Adjusted
Death Rate (%)
Probability This Rate
Occurred by Chance
Los Angeles County: East Los Angeles Doctor's Hospital
64 8 6.6 6.3 23.110.312.5 0.33214.72.3All YearsModel A 12.08912
17 6 2.0 21.0 51.411.935.3 0.00836.21.31996 12.17742
26 0 2.6 0.0 13.49.80.0 0.0590.01.51997 12.02517
21 2 2.0 0.0 27.49.69.5 0.67612.01.31998 12.06405
64 8 6.6 7.0 22.410.312.5 0.32314.72.1All YearsModel B 12.10683
17 6 2.6 16.5 39.815.335.3 0.01428.21.31996 12.18490
26 0 2.0 0.0 14.77.70.0 0.1000.01.31997 12.03332
21 2 2.0 0.0 26.39.59.5 0.63412.21.21998 12.10273
Yearly Risk Adjusted Death Rates (%)with 95% Confidence Bounds
Model A
0
10
20
30
40
50
60
70
80
90
100
1996 1997 1998
Statewide
Yearly Risk Adjusted Death Rates (%)with 95% Confidence Bounds
Model B
0
10
20
30
40
50
60
70
80
90
100
1996 1997 1998
Statewide
‡ Hospital sent comment letter Office of Statewide Health Planning and DevelopmentCalifornia Hospital Outcomes Project
Page 124

Detailed Statistical Resultsfor Acute Myocardial Infarction Mortality
Statewide Death Rate
(%)
Number of Observed
Deaths
Number of Expected Deaths Lower Upper
Expected Death Rate
(%)
Observed Death Rate
(%)
Risk Adjusted Death Rate 95% Confidence Bounds
Number of Cases
Included
Standard Deviation of Observed
Deaths
Risk-Adjusted
Death Rate (%)
Probability This Rate
Occurred by Chance
Los Angeles County: Encino Tarzana Regional Med Center - Encino
93 19 15.9 9.3 19.617.120.4 0.22414.43.5All YearsModel A 12.08912
32 9 6.3 9.3 25.519.728.1 0.15017.42.11996 12.17742
26 7 3.6 12.5 34.413.826.9 0.04823.51.71997 12.02517
35 3 6.0 0.0 14.517.28.6 0.1186.02.21998 12.06405
93 19 14.9 10.4 20.616.020.4 0.13015.53.2All YearsModel B 12.10683
32 9 6.6 9.3 23.920.728.1 0.17316.62.01996 12.18490
26 7 2.9 17.2 41.411.126.9 0.01229.31.51997 12.03332
35 3 5.4 0.0 15.415.48.6 0.1696.72.01998 12.10273
Yearly Risk Adjusted Death Rates (%)with 95% Confidence Bounds
Model A
0
10
20
30
40
50
60
70
80
90
100
1996 1997 1998
Statewide
Yearly Risk Adjusted Death Rates (%)with 95% Confidence Bounds
Model B
0
10
20
30
40
50
60
70
80
90
100
1996 1997 1998
Statewide
‡ Hospital sent comment letter Office of Statewide Health Planning and DevelopmentCalifornia Hospital Outcomes Project

Detailed Statistical Resultsfor Acute Myocardial Infarction Mortality
Statewide Death Rate
(%)
Number of Observed
Deaths
Number of Expected Deaths Lower Upper
Expected Death Rate
(%)
Observed Death Rate
(%)
Risk Adjusted Death Rate 95% Confidence Bounds
Number of Cases
Included
Standard Deviation of Observed
Deaths
Risk-Adjusted
Death Rate (%)
Probability This Rate
Occurred by Chance
Los Angeles County: Encino Tarzana Regional Med Center - Tarzana
502 36 68.8 3.8 8.813.77.2 0.0006.37.3All YearsModel A 12.08912
163 8 23.0 0.0 8.614.14.9 0.0004.24.21996 12.17742
178 18 25.7 4.4 12.414.510.1 0.0458.44.41997 12.02517
161 10 20.1 1.3 10.712.56.2 0.0056.04.01998 12.06405
502 36 69.8 4.0 8.513.97.2 0.0006.26.7All YearsModel B 12.10683
163 8 23.5 0.2 8.114.44.9 0.0004.23.91996 12.18490
178 18 25.8 4.7 12.114.510.1 0.0318.44.01997 12.03332
161 10 20.5 1.7 10.112.76.2 0.0025.93.71998 12.10273
Yearly Risk Adjusted Death Rates (%)with 95% Confidence Bounds
Model A
0
10
20
30
40
50
60
70
80
90
100
1996 1997 1998
Statewide
Yearly Risk Adjusted Death Rates (%)with 95% Confidence Bounds
Model B
0
10
20
30
40
50
60
70
80
90
100
1996 1997 1998
Statewide
‡ Hospital sent comment letter Office of Statewide Health Planning and DevelopmentCalifornia Hospital Outcomes Project
Page 126

Detailed Statistical Resultsfor Acute Myocardial Infarction Mortality
Statewide Death Rate
(%)
Number of Observed
Deaths
Number of Expected Deaths Lower Upper
Expected Death Rate
(%)
Observed Death Rate
(%)
Risk Adjusted Death Rate 95% Confidence Bounds
Number of Cases
Included
Standard Deviation of Observed
Deaths
Risk-Adjusted
Death Rate (%)
Probability This Rate
Occurred by Chance
Los Angeles County: Foothill Presbyterian Hospital
307 44 40.2 10.0 16.513.114.3 0.27413.25.6All YearsModel A 12.08912
94 14 12.4 7.8 19.613.214.9 0.35213.73.11996 12.17742
106 10 13.1 3.4 15.012.49.4 0.2129.23.21997 12.02517
107 20 14.7 11.0 21.813.718.7 0.07816.43.31998 12.06405
303 43 35.9 11.2 17.811.814.2 0.09614.55.0All YearsModel B 12.10683
92 14 10.0 10.5 23.610.915.2 0.10417.02.71996 12.18490
104 9 12.2 3.2 14.511.78.7 0.1798.92.91997 12.03332
107 20 13.7 12.5 22.912.818.7 0.03017.73.01998 12.10273
Yearly Risk Adjusted Death Rates (%)with 95% Confidence Bounds
Model A
0
10
20
30
40
50
60
70
80
90
100
1996 1997 1998
Statewide
Yearly Risk Adjusted Death Rates (%)with 95% Confidence Bounds
Model B
0
10
20
30
40
50
60
70
80
90
100
1996 1997 1998
Statewide
‡ Hospital sent comment letter Office of Statewide Health Planning and DevelopmentCalifornia Hospital Outcomes Project

Detailed Statistical Resultsfor Acute Myocardial Infarction Mortality
Statewide Death Rate
(%)
Number of Observed
Deaths
Number of Expected Deaths Lower Upper
Expected Death Rate
(%)
Observed Death Rate
(%)
Risk Adjusted Death Rate 95% Confidence Bounds
Number of Cases
Included
Standard Deviation of Observed
Deaths
Risk-Adjusted
Death Rate (%)
Probability This Rate
Occurred by Chance
Los Angeles County: Garfield Medical Center
242 37 30.7 10.8 18.312.715.3 0.12214.54.9All YearsModel A 12.08912
59 9 7.3 7.1 23.012.315.3 0.29715.02.41996 12.17742
90 15 12.4 8.8 20.413.716.7 0.23314.63.01997 12.02517
93 13 11.1 7.7 20.511.914.0 0.31214.13.01998 12.06405
242 37 35.3 9.6 15.814.615.3 0.38912.74.6All YearsModel B 12.10683
59 9 7.7 7.2 21.213.115.3 0.35214.22.31996 12.18490
90 15 13.2 8.7 18.614.716.7 0.31313.72.81997 12.03332
93 13 14.3 6.0 15.915.414.0 0.40011.03.01998 12.10273
Yearly Risk Adjusted Death Rates (%)with 95% Confidence Bounds
Model A
0
10
20
30
40
50
60
70
80
90
100
1996 1997 1998
Statewide
Yearly Risk Adjusted Death Rates (%)with 95% Confidence Bounds
Model B
0
10
20
30
40
50
60
70
80
90
100
1996 1997 1998
Statewide
‡ Hospital sent comment letter Office of Statewide Health Planning and DevelopmentCalifornia Hospital Outcomes Project
Page 128

Detailed Statistical Resultsfor Acute Myocardial Infarction Mortality
Statewide Death Rate
(%)
Number of Observed
Deaths
Number of Expected Deaths Lower Upper
Expected Death Rate
(%)
Observed Death Rate
(%)
Risk Adjusted Death Rate 95% Confidence Bounds
Number of Cases
Included
Standard Deviation of Observed
Deaths
Risk-Adjusted
Death Rate (%)
Probability This Rate
Occurred by Chance
Los Angeles County: Glendale Adventist Medical Center
561 77 78.2 9.6 14.213.913.7 0.46811.97.7All YearsModel A 12.08912
192 26 27.9 7.5 15.314.513.5 0.38911.44.51996 12.17742
203 30 28.4 8.9 16.514.014.8 0.39812.74.61997 12.02517
166 21 21.9 7.1 16.013.212.7 0.46711.54.11998 12.06405
559 76 88.2 8.5 12.415.813.6 0.05010.47.2All YearsModel B 12.10683
191 25 29.0 7.0 14.015.213.1 0.20410.54.21996 12.18490
202 30 33.1 7.8 14.016.414.9 0.27510.94.41997 12.03332
166 21 26.1 6.2 13.315.712.7 0.1169.73.91998 12.10273
Yearly Risk Adjusted Death Rates (%)with 95% Confidence Bounds
Model A
0
10
20
30
40
50
60
70
80
90
100
1996 1997 1998
Statewide
Yearly Risk Adjusted Death Rates (%)with 95% Confidence Bounds
Model B
0
10
20
30
40
50
60
70
80
90
100
1996 1997 1998
Statewide
‡ Hospital sent comment letter Office of Statewide Health Planning and DevelopmentCalifornia Hospital Outcomes Project

Detailed Statistical Resultsfor Acute Myocardial Infarction Mortality
Statewide Death Rate
(%)
Number of Observed
Deaths
Number of Expected Deaths Lower Upper
Expected Death Rate
(%)
Observed Death Rate
(%)
Risk Adjusted Death Rate 95% Confidence Bounds
Number of Cases
Included
Standard Deviation of Observed
Deaths
Risk-Adjusted
Death Rate (%)
Probability This Rate
Occurred by Chance
Los Angeles County: Glendale Memorial Hospital and Health Center
524 68 75.0 8.6 13.314.313.0 0.19311.07.5All YearsModel A 12.08912
164 14 24.0 2.9 11.314.78.5 0.0097.14.31996 12.17742
178 25 24.1 8.3 16.613.514.0 0.45212.54.21997 12.02517
182 29 26.9 9.1 17.014.815.9 0.35313.04.51998 12.06405
520 68 92.6 7.1 10.717.813.1 0.0008.97.2All YearsModel B 12.10683
164 14 26.8 2.8 9.916.48.5 0.0016.44.01996 12.18490
176 25 31.1 6.6 12.717.714.2 0.0789.74.01997 12.03332
180 29 34.6 7.1 13.219.216.1 0.12210.14.41998 12.10273
Yearly Risk Adjusted Death Rates (%)with 95% Confidence Bounds
Model A
0
10
20
30
40
50
60
70
80
90
100
1996 1997 1998
Statewide
Yearly Risk Adjusted Death Rates (%)with 95% Confidence Bounds
Model B
0
10
20
30
40
50
60
70
80
90
100
1996 1997 1998
Statewide
‡ Hospital sent comment letter Office of Statewide Health Planning and DevelopmentCalifornia Hospital Outcomes Project
Page 130

Detailed Statistical Resultsfor Acute Myocardial Infarction Mortality
Statewide Death Rate
(%)
Number of Observed
Deaths
Number of Expected Deaths Lower Upper
Expected Death Rate
(%)
Observed Death Rate
(%)
Risk Adjusted Death Rate 95% Confidence Bounds
Number of Cases
Included
Standard Deviation of Observed
Deaths
Risk-Adjusted
Death Rate (%)
Probability This Rate
Occurred by Chance
Los Angeles County: Granada Hills Community Hospital‡
202 45 31.1 13.8 21.215.422.3 0.00417.54.8All YearsModel A 12.08912
69 18 10.5 14.5 27.415.226.1 0.00920.92.81996 12.17742
52 12 7.2 12.4 27.613.923.1 0.03820.02.31997 12.02517
81 15 13.4 7.9 19.016.618.5 0.35913.53.21998 12.06405
199 44 36.8 11.5 17.518.522.1 0.07714.54.7All YearsModel B 12.10683
69 18 11.3 13.8 25.116.426.1 0.01319.42.71996 12.18490
51 11 8.1 9.9 22.715.921.6 0.13816.32.21997 12.03332
79 15 17.4 6.1 14.722.019.0 0.27810.43.21998 12.10273
Yearly Risk Adjusted Death Rates (%)with 95% Confidence Bounds
Model A
0
10
20
30
40
50
60
70
80
90
100
1996 1997 1998
Statewide
Yearly Risk Adjusted Death Rates (%)with 95% Confidence Bounds
Model B
0
10
20
30
40
50
60
70
80
90
100
1996 1997 1998
Statewide
‡ Hospital sent comment letter Office of Statewide Health Planning and DevelopmentCalifornia Hospital Outcomes Project

Detailed Statistical Resultsfor Acute Myocardial Infarction Mortality
Statewide Death Rate
(%)
Number of Observed
Deaths
Number of Expected Deaths Lower Upper
Expected Death Rate
(%)
Observed Death Rate
(%)
Risk Adjusted Death Rate 95% Confidence Bounds
Number of Cases
Included
Standard Deviation of Observed
Deaths
Risk-Adjusted
Death Rate (%)
Probability This Rate
Occurred by Chance
Los Angeles County: Greater El Monte Community Hospital
113 15 13.4 7.8 19.311.813.3 0.35313.63.3All YearsModel A 12.08912
41 6 6.1 3.6 20.614.814.6 0.59812.12.21996 12.17742
38 6 4.0 7.4 28.810.515.8 0.19718.11.81997 12.02517
34 3 3.3 0.0 22.69.78.8 0.57210.91.61998 12.06405
113 15 14.4 7.7 17.512.713.3 0.47712.63.0All YearsModel B 12.10683
41 6 6.6 3.8 18.216.214.6 0.48911.02.01996 12.18490
38 6 5.7 5.3 20.015.015.8 0.53112.61.81997 12.03332
34 3 2.1 2.3 32.76.18.8 0.34317.51.31998 12.10273
Yearly Risk Adjusted Death Rates (%)with 95% Confidence Bounds
Model A
0
10
20
30
40
50
60
70
80
90
100
1996 1997 1998
Statewide
Yearly Risk Adjusted Death Rates (%)with 95% Confidence Bounds
Model B
0
10
20
30
40
50
60
70
80
90
100
1996 1997 1998
Statewide
‡ Hospital sent comment letter Office of Statewide Health Planning and DevelopmentCalifornia Hospital Outcomes Project
Page 132

Detailed Statistical Resultsfor Acute Myocardial Infarction Mortality
Statewide Death Rate
(%)
Number of Observed
Deaths
Number of Expected Deaths Lower Upper
Expected Death Rate
(%)
Observed Death Rate
(%)
Risk Adjusted Death Rate 95% Confidence Bounds
Number of Cases
Included
Standard Deviation of Observed
Deaths
Risk-Adjusted
Death Rate (%)
Probability This Rate
Occurred by Chance
Los Angeles County: Henry Mayo Newhall Memorial Hospital
390 37 39.0 8.1 14.910.09.5 0.39911.55.6All YearsModel A 12.08912
128 14 11.5 8.4 21.19.010.9 0.25514.83.11996 12.17742
137 15 15.0 6.6 17.411.010.9 0.56512.03.51997 12.02517
125 8 12.4 1.8 13.710.06.4 0.1007.83.11998 12.06405
387 37 37.2 8.8 15.39.69.6 0.52712.05.1All YearsModel B 12.10683
127 14 11.5 8.9 20.89.111.0 0.23714.82.91996 12.18490
136 15 14.8 7.1 17.310.911.0 0.53012.23.21997 12.03332
124 8 10.9 2.8 14.98.86.5 0.1948.92.81998 12.10273
Yearly Risk Adjusted Death Rates (%)with 95% Confidence Bounds
Model A
0
10
20
30
40
50
60
70
80
90
100
1996 1997 1998
Statewide
Yearly Risk Adjusted Death Rates (%)with 95% Confidence Bounds
Model B
0
10
20
30
40
50
60
70
80
90
100
1996 1997 1998
Statewide
‡ Hospital sent comment letter Office of Statewide Health Planning and DevelopmentCalifornia Hospital Outcomes Project

Detailed Statistical Resultsfor Acute Myocardial Infarction Mortality
Statewide Death Rate
(%)
Number of Observed
Deaths
Number of Expected Deaths Lower Upper
Expected Death Rate
(%)
Observed Death Rate
(%)
Risk Adjusted Death Rate 95% Confidence Bounds
Number of Cases
Included
Standard Deviation of Observed
Deaths
Risk-Adjusted
Death Rate (%)
Probability This Rate
Occurred by Chance
Los Angeles County: Hollywood Community Hospital
34 1 3.8 0.0 14.211.22.9 0.0853.21.8All YearsModel A 12.08912
16 1 1.3 0.0 28.58.46.3 0.6079.11.11996 12.17742
10 0 1.2 0.0 19.711.80.0 0.2710.01.01997 12.02517
8 0 1.3 0.0 18.316.00.0 0.2290.01.01998 12.06405
34 1 3.3 0.0 15.49.72.9 0.1303.71.6All YearsModel B 12.10683
16 1 1.2 0.0 31.07.36.3 0.67210.41.01996 12.18490
10 0 0.9 0.0 23.18.70.0 0.3850.00.91997 12.03332
8 0 1.3 0.0 18.015.70.0 0.2280.01.01998 12.10273
Yearly Risk Adjusted Death Rates (%)with 95% Confidence Bounds
Model A
0
10
20
30
40
50
60
70
80
90
100
1996 1997 1998
Statewide
Yearly Risk Adjusted Death Rates (%)with 95% Confidence Bounds
Model B
0
10
20
30
40
50
60
70
80
90
100
1996 1997 1998
Statewide
‡ Hospital sent comment letter Office of Statewide Health Planning and DevelopmentCalifornia Hospital Outcomes Project
Page 134

Detailed Statistical Resultsfor Acute Myocardial Infarction Mortality
Statewide Death Rate
(%)
Number of Observed
Deaths
Number of Expected Deaths Lower Upper
Expected Death Rate
(%)
Observed Death Rate
(%)
Risk Adjusted Death Rate 95% Confidence Bounds
Number of Cases
Included
Standard Deviation of Observed
Deaths
Risk-Adjusted
Death Rate (%)
Probability This Rate
Occurred by Chance
Los Angeles County: Huntington East Valley Hospital
78 16 10.8 11.7 24.013.920.5 0.05417.92.8All YearsModel A 12.08912
21 3 3.1 0.2 23.714.614.3 0.63711.91.51996 12.17742
17 7 2.9 17.1 41.217.041.2 0.01129.21.51997 12.02517
40 6 4.9 5.7 23.912.215.0 0.35814.81.91998 12.06405
78 16 10.9 12.0 23.713.920.5 0.04517.82.7All YearsModel B 12.10683
21 3 2.6 1.4 26.612.514.3 0.50714.01.41996 12.18490
17 7 2.6 19.8 44.815.341.2 0.00532.31.41997 12.03332
40 6 5.6 5.3 20.514.115.0 0.51712.91.81998 12.10273
Yearly Risk Adjusted Death Rates (%)with 95% Confidence Bounds
Model A
0
10
20
30
40
50
60
70
80
90
100
1996 1997 1998
Statewide
Yearly Risk Adjusted Death Rates (%)with 95% Confidence Bounds
Model B
0
10
20
30
40
50
60
70
80
90
100
1996 1997 1998
Statewide
‡ Hospital sent comment letter Office of Statewide Health Planning and DevelopmentCalifornia Hospital Outcomes Project
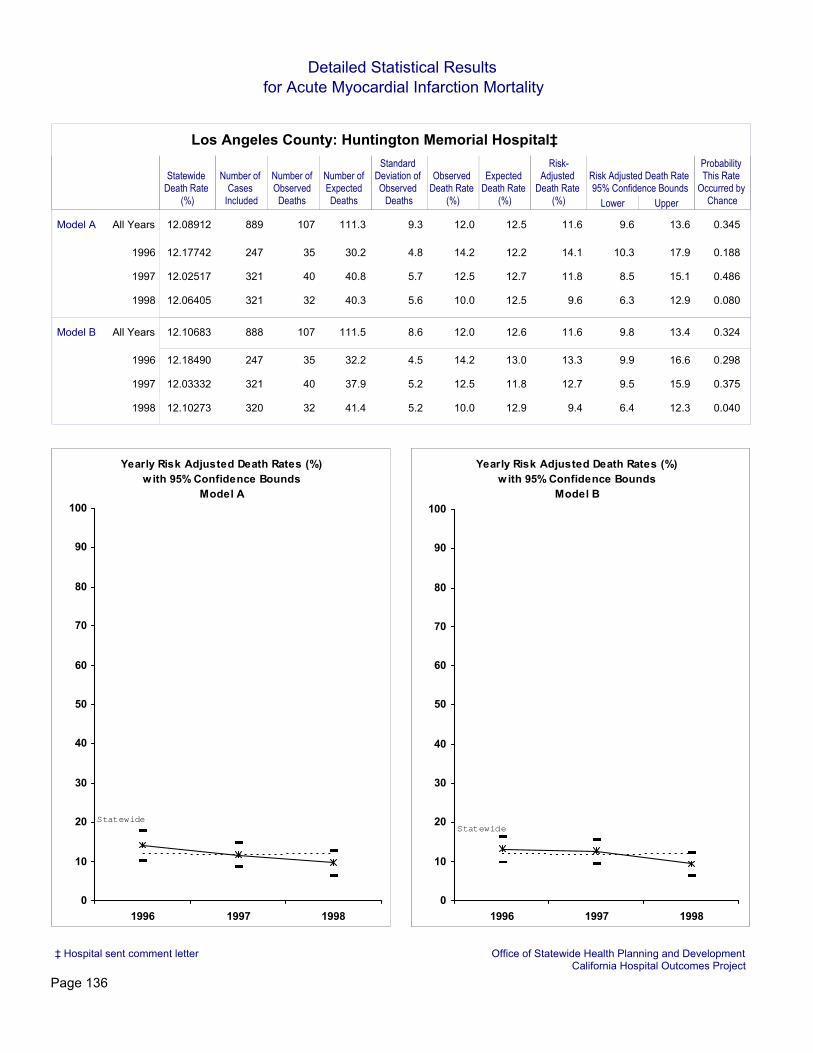
Detailed Statistical Resultsfor Acute Myocardial Infarction Mortality
Statewide Death Rate
(%)
Number of Observed
Deaths
Number of Expected Deaths Lower Upper
Expected Death Rate
(%)
Observed Death Rate
(%)
Risk Adjusted Death Rate 95% Confidence Bounds
Number of Cases
Included
Standard Deviation of Observed
Deaths
Risk-Adjusted
Death Rate (%)
Probability This Rate
Occurred by Chance
Los Angeles County: Huntington Memorial Hospital‡
889 107 111.3 9.6 13.612.512.0 0.34511.69.3All YearsModel A 12.08912
247 35 30.2 10.3 17.912.214.2 0.18814.14.81996 12.17742
321 40 40.8 8.5 15.112.712.5 0.48611.85.71997 12.02517
321 32 40.3 6.3 12.912.510.0 0.0809.65.61998 12.06405
888 107 111.5 9.8 13.412.612.0 0.32411.68.6All YearsModel B 12.10683
247 35 32.2 9.9 16.613.014.2 0.29813.34.51996 12.18490
321 40 37.9 9.5 15.911.812.5 0.37512.75.21997 12.03332
320 32 41.4 6.4 12.312.910.0 0.0409.45.21998 12.10273
Yearly Risk Adjusted Death Rates (%)with 95% Confidence Bounds
Model A
0
10
20
30
40
50
60
70
80
90
100
1996 1997 1998
Statewide
Yearly Risk Adjusted Death Rates (%)with 95% Confidence Bounds
Model B
0
10
20
30
40
50
60
70
80
90
100
1996 1997 1998
Statewide
‡ Hospital sent comment letter Office of Statewide Health Planning and DevelopmentCalifornia Hospital Outcomes Project
Page 136

Detailed Statistical Resultsfor Acute Myocardial Infarction Mortality
Statewide Death Rate
(%)
Number of Observed
Deaths
Number of Expected Deaths Lower Upper
Expected Death Rate
(%)
Observed Death Rate
(%)
Risk Adjusted Death Rate 95% Confidence Bounds
Number of Cases
Included
Standard Deviation of Observed
Deaths
Risk-Adjusted
Death Rate (%)
Probability This Rate
Occurred by Chance
Los Angeles County: Kaiser Foundation Hospital - Baldwin Park
29 2 2.9 0.0 20.710.16.9 0.4188.31.5All YearsModel A 12.08912
01996 12.17742
01997 12.02517
29 2 2.9 0.0 20.610.16.9 0.4188.21.51998 12.06405
29 2 2.4 0.0 24.18.26.9 0.56710.21.4All YearsModel B 12.10683
01996 12.18490
01997 12.03332
29 2 2.4 0.0 24.18.26.9 0.56710.21.41998 12.10273
Yearly Risk Adjusted Death Rates (%)with 95% Confidence Bounds
Model A
0
10
20
30
40
50
60
70
80
90
100
1996 1997 1998
Statewide
Yearly Risk Adjusted Death Rates (%)with 95% Confidence Bounds
Model B
0
10
20
30
40
50
60
70
80
90
100
1996 1997 1998
Statewide
‡ Hospital sent comment letter Office of Statewide Health Planning and DevelopmentCalifornia Hospital Outcomes Project

Detailed Statistical Resultsfor Acute Myocardial Infarction Mortality
Statewide Death Rate
(%)
Number of Observed
Deaths
Number of Expected Deaths Lower Upper
Expected Death Rate
(%)
Observed Death Rate
(%)
Risk Adjusted Death Rate 95% Confidence Bounds
Number of Cases
Included
Standard Deviation of Observed
Deaths
Risk-Adjusted
Death Rate (%)
Probability This Rate
Occurred by Chance
Los Angeles County: Kaiser Foundation Hospital - Bellflower
950 52 84.7 5.1 9.78.95.5 0.0007.48.3All YearsModel A 12.08912
301 12 28.5 1.1 9.29.54.0 0.0005.14.81996 12.17742
329 19 27.6 4.2 12.48.45.8 0.0418.34.81997 12.02517
320 21 28.6 4.9 12.89.06.6 0.0658.84.81998 12.06405
882 47 62.4 6.5 11.87.15.3 0.0149.17.0All YearsModel B 12.10683
296 12 21.3 2.3 11.47.24.1 0.0116.94.11996 12.18490
322 18 21.8 5.5 14.46.85.6 0.2149.94.11997 12.03332
264 17 19.3 5.8 15.57.36.4 0.32810.63.91998 12.10273
Yearly Risk Adjusted Death Rates (%)with 95% Confidence Bounds
Model A
0
10
20
30
40
50
60
70
80
90
100
1996 1997 1998
Statewide
Yearly Risk Adjusted Death Rates (%)with 95% Confidence Bounds
Model B
0
10
20
30
40
50
60
70
80
90
100
1996 1997 1998
Statewide
‡ Hospital sent comment letter Office of Statewide Health Planning and DevelopmentCalifornia Hospital Outcomes Project
Page 138

Detailed Statistical Resultsfor Acute Myocardial Infarction Mortality
Statewide Death Rate
(%)
Number of Observed
Deaths
Number of Expected Deaths Lower Upper
Expected Death Rate
(%)
Observed Death Rate
(%)
Risk Adjusted Death Rate 95% Confidence Bounds
Number of Cases
Included
Standard Deviation of Observed
Deaths
Risk-Adjusted
Death Rate (%)
Probability This Rate
Occurred by Chance
Los Angeles County: Kaiser Foundation Hospital - Harbor City
570 38 52.3 5.8 11.79.26.7 0.0148.86.5All YearsModel A 12.08912
152 13 16.1 4.6 15.110.68.6 0.2389.93.51996 12.17742
214 16 18.2 5.6 15.68.57.5 0.34310.63.91997 12.02517
204 9 18.1 0.9 11.18.94.4 0.0096.03.91998 12.06405
569 38 47.6 6.8 12.58.46.7 0.0529.75.7All YearsModel B 12.10683
152 13 15.9 5.3 14.610.48.6 0.22510.03.11996 12.18490
213 16 16.9 6.6 16.18.07.5 0.45911.43.41997 12.03332
204 9 14.8 1.9 12.87.34.4 0.0537.33.41998 12.10273
Yearly Risk Adjusted Death Rates (%)with 95% Confidence Bounds
Model A
0
10
20
30
40
50
60
70
80
90
100
1996 1997 1998
Statewide
Yearly Risk Adjusted Death Rates (%)with 95% Confidence Bounds
Model B
0
10
20
30
40
50
60
70
80
90
100
1996 1997 1998
Statewide
‡ Hospital sent comment letter Office of Statewide Health Planning and DevelopmentCalifornia Hospital Outcomes Project

Detailed Statistical Resultsfor Acute Myocardial Infarction Mortality
Statewide Death Rate
(%)
Number of Observed
Deaths
Number of Expected Deaths Lower Upper
Expected Death Rate
(%)
Observed Death Rate
(%)
Risk Adjusted Death Rate 95% Confidence Bounds
Number of Cases
Included
Standard Deviation of Observed
Deaths
Risk-Adjusted
Death Rate (%)
Probability This Rate
Occurred by Chance
Los Angeles County: Kaiser Foundation Hospital - Los Angeles
753 69 77.0 8.4 13.310.29.2 0.17110.87.9All YearsModel A 12.08912
260 19 24.4 5.1 13.99.47.3 0.1369.54.51996 12.17742
209 19 22.8 5.6 14.410.99.1 0.22010.04.21997 12.02517
284 31 29.8 8.7 16.410.510.9 0.43512.64.91998 12.06405
746 69 68.0 9.8 14.79.19.2 0.46812.37.0All YearsModel B 12.10683
259 19 19.8 7.0 16.47.67.3 0.48311.73.91996 12.18490
206 19 20.3 6.9 15.69.99.2 0.42311.33.81997 12.03332
281 31 27.9 9.6 17.29.911.0 0.27813.44.51998 12.10273
Yearly Risk Adjusted Death Rates (%)with 95% Confidence Bounds
Model A
0
10
20
30
40
50
60
70
80
90
100
1996 1997 1998
Statewide
Yearly Risk Adjusted Death Rates (%)with 95% Confidence Bounds
Model B
0
10
20
30
40
50
60
70
80
90
100
1996 1997 1998
Statewide
‡ Hospital sent comment letter Office of Statewide Health Planning and DevelopmentCalifornia Hospital Outcomes Project
Page 140

Detailed Statistical Resultsfor Acute Myocardial Infarction Mortality
Statewide Death Rate
(%)
Number of Observed
Deaths
Number of Expected Deaths Lower Upper
Expected Death Rate
(%)
Observed Death Rate
(%)
Risk Adjusted Death Rate 95% Confidence Bounds
Number of Cases
Included
Standard Deviation of Observed
Deaths
Risk-Adjusted
Death Rate (%)
Probability This Rate
Occurred by Chance
Los Angeles County: Kaiser Foundation Hospital - Panorama City
653 55 70.2 7.0 12.010.88.4 0.0219.57.4All YearsModel A 12.08912
243 26 27.0 7.7 15.811.110.7 0.46711.74.61996 12.17742
209 12 21.2 2.2 11.410.15.7 0.0136.84.11997 12.02517
201 17 22.1 4.8 13.811.08.5 0.1379.34.21998 12.06405
642 54 60.6 8.2 13.39.48.4 0.17510.86.5All YearsModel B 12.10683
241 26 22.5 9.9 18.39.410.8 0.22414.14.01996 12.18490
206 12 17.4 3.5 13.18.45.8 0.0808.33.51997 12.03332
195 16 20.7 5.0 13.710.68.2 0.1319.43.81998 12.10273
Yearly Risk Adjusted Death Rates (%)with 95% Confidence Bounds
Model A
0
10
20
30
40
50
60
70
80
90
100
1996 1997 1998
Statewide
Yearly Risk Adjusted Death Rates (%)with 95% Confidence Bounds
Model B
0
10
20
30
40
50
60
70
80
90
100
1996 1997 1998
Statewide
‡ Hospital sent comment letter Office of Statewide Health Planning and DevelopmentCalifornia Hospital Outcomes Project

Detailed Statistical Resultsfor Acute Myocardial Infarction Mortality
Statewide Death Rate
(%)
Number of Observed
Deaths
Number of Expected Deaths Lower Upper
Expected Death Rate
(%)
Observed Death Rate
(%)
Risk Adjusted Death Rate 95% Confidence Bounds
Number of Cases
Included
Standard Deviation of Observed
Deaths
Risk-Adjusted
Death Rate (%)
Probability This Rate
Occurred by Chance
Los Angeles County: Kaiser Foundation Hospital - West Los Angeles
655 51 76.3 5.7 10.511.67.8 0.0008.17.7All YearsModel A 12.08912
214 21 26.8 5.5 13.512.59.8 0.1179.54.51996 12.17742
228 14 25.4 2.5 10.711.16.1 0.0056.64.41997 12.02517
213 16 24.0 3.7 12.311.37.5 0.0378.04.41998 12.06405
643 50 61.3 7.4 12.49.57.8 0.0469.96.5All YearsModel B 12.10683
213 20 23.2 6.5 14.510.99.4 0.24810.53.91996 12.18490
225 14 20.1 4.0 12.88.96.2 0.0648.43.81997 12.03332
205 16 18.0 6.1 15.58.87.8 0.34810.83.61998 12.10273
Yearly Risk Adjusted Death Rates (%)with 95% Confidence Bounds
Model A
0
10
20
30
40
50
60
70
80
90
100
1996 1997 1998
Statewide
Yearly Risk Adjusted Death Rates (%)with 95% Confidence Bounds
Model B
0
10
20
30
40
50
60
70
80
90
100
1996 1997 1998
Statewide
‡ Hospital sent comment letter Office of Statewide Health Planning and DevelopmentCalifornia Hospital Outcomes Project
Page 142

Detailed Statistical Resultsfor Acute Myocardial Infarction Mortality
Statewide Death Rate
(%)
Number of Observed
Deaths
Number of Expected Deaths Lower Upper
Expected Death Rate
(%)
Observed Death Rate
(%)
Risk Adjusted Death Rate 95% Confidence Bounds
Number of Cases
Included
Standard Deviation of Observed
Deaths
Risk-Adjusted
Death Rate (%)
Probability This Rate
Occurred by Chance
Los Angeles County: Kaiser Foundation Hospital - Woodland Hills
727 59 74.0 7.2 12.110.28.1 0.0279.67.7All YearsModel A 12.08912
244 24 23.6 8.0 16.89.79.8 0.50012.44.31996 12.17742
247 22 25.9 6.1 14.410.58.9 0.23010.24.61997 12.02517
236 13 24.4 2.2 10.610.45.5 0.0046.44.41998 12.06405
724 59 65.0 8.5 13.59.08.1 0.20911.06.8All YearsModel B 12.10683
244 24 20.8 9.6 18.58.59.8 0.24014.03.91996 12.18490
245 22 22.8 7.4 15.89.39.0 0.47711.64.01997 12.03332
235 13 21.4 3.1 11.69.15.5 0.0167.43.81998 12.10273
Yearly Risk Adjusted Death Rates (%)with 95% Confidence Bounds
Model A
0
10
20
30
40
50
60
70
80
90
100
1996 1997 1998
Statewide
Yearly Risk Adjusted Death Rates (%)with 95% Confidence Bounds
Model B
0
10
20
30
40
50
60
70
80
90
100
1996 1997 1998
Statewide
‡ Hospital sent comment letter Office of Statewide Health Planning and DevelopmentCalifornia Hospital Outcomes Project

Detailed Statistical Resultsfor Acute Myocardial Infarction Mortality
Statewide Death Rate
(%)
Number of Observed
Deaths
Number of Expected Deaths Lower Upper
Expected Death Rate
(%)
Observed Death Rate
(%)
Risk Adjusted Death Rate 95% Confidence Bounds
Number of Cases
Included
Standard Deviation of Observed
Deaths
Risk-Adjusted
Death Rate (%)
Probability This Rate
Occurred by Chance
Los Angeles County: L.A. Co/Olive View-UCLA Medical Center
146 11 11.7 5.0 17.88.07.5 0.49511.43.1All YearsModel A 12.08912
47 4 3.5 2.2 25.67.58.5 0.47413.91.71996 12.17742
50 4 5.0 0.1 19.39.98.0 0.4319.72.01997 12.02517
49 3 3.2 0.0 23.76.56.1 0.60411.41.71998 12.06405
146 11 11.6 5.5 17.57.97.5 0.50211.52.9All YearsModel B 12.10683
47 4 2.7 4.6 30.95.88.5 0.28917.71.51996 12.18490
50 4 4.7 0.7 19.69.58.0 0.47010.21.91997 12.03332
49 3 4.1 0.0 18.58.46.1 0.3778.91.71998 12.10273
Yearly Risk Adjusted Death Rates (%)with 95% Confidence Bounds
Model A
0
10
20
30
40
50
60
70
80
90
100
1996 1997 1998
Statewide
Yearly Risk Adjusted Death Rates (%)with 95% Confidence Bounds
Model B
0
10
20
30
40
50
60
70
80
90
100
1996 1997 1998
Statewide
‡ Hospital sent comment letter Office of Statewide Health Planning and DevelopmentCalifornia Hospital Outcomes Project
Page 144

Detailed Statistical Resultsfor Acute Myocardial Infarction Mortality
Statewide Death Rate
(%)
Number of Observed
Deaths
Number of Expected Deaths Lower Upper
Expected Death Rate
(%)
Observed Death Rate
(%)
Risk Adjusted Death Rate 95% Confidence Bounds
Number of Cases
Included
Standard Deviation of Observed
Deaths
Risk-Adjusted
Death Rate (%)
Probability This Rate
Occurred by Chance
Los Angeles County: L.A. Co/Rancho Los Amigos National Rehab Ctr
6 1 1.3 0.0 25.621.616.7 0.6289.30.9All YearsModel A 12.08912
01996 12.17742
1 0 0.1 0.0 61.113.00.0 0.8700.00.31997 12.02517
5 1 1.2 0.0 27.023.320.0 0.69110.40.81998 12.06405
6 1 1.5 0.0 22.024.616.7 0.5408.20.9All YearsModel B 12.10683
01996 12.18490
1 0 0.1 0.0 94.15.90.0 0.9410.00.21997 12.03332
5 1 1.4 0.0 22.328.320.0 0.5678.60.81998 12.10273
Yearly Risk Adjusted Death Rates (%)with 95% Confidence Bounds
Model A
0
10
20
30
40
50
60
70
80
90
100
1996 1997 1998
Statewide
Yearly Risk Adjusted Death Rates (%)with 95% Confidence Bounds
Model B
0
10
20
30
40
50
60
70
80
90
100
1996 1997 1998
Statewide
‡ Hospital sent comment letter Office of Statewide Health Planning and DevelopmentCalifornia Hospital Outcomes Project

Detailed Statistical Resultsfor Acute Myocardial Infarction Mortality
Statewide Death Rate
(%)
Number of Observed
Deaths
Number of Expected Deaths Lower Upper
Expected Death Rate
(%)
Observed Death Rate
(%)
Risk Adjusted Death Rate 95% Confidence Bounds
Number of Cases
Included
Standard Deviation of Observed
Deaths
Risk-Adjusted
Death Rate (%)
Probability This Rate
Occurred by Chance
Los Angeles County: L.A. Co/USC Medical Center
500 63 42.7 14.5 21.18.512.6 0.00117.85.9All YearsModel A 12.08912
173 17 14.1 8.9 20.58.19.8 0.23514.73.41996 12.17742
144 22 13.1 14.4 26.19.115.3 0.00720.23.31997 12.02517
183 24 15.6 13.1 24.08.513.1 0.01818.63.61998 12.06405
497 61 49.3 12.3 17.69.912.3 0.02415.05.5All YearsModel B 12.10683
172 17 15.5 8.5 18.29.09.9 0.36713.43.21996 12.18490
142 20 17.0 9.7 18.512.014.1 0.21514.13.21997 12.03332
183 24 16.8 12.7 21.99.213.1 0.02317.33.21998 12.10273
Yearly Risk Adjusted Death Rates (%)with 95% Confidence Bounds
Model A
0
10
20
30
40
50
60
70
80
90
100
1996 1997 1998
Statewide
Yearly Risk Adjusted Death Rates (%)with 95% Confidence Bounds
Model B
0
10
20
30
40
50
60
70
80
90
100
1996 1997 1998
Statewide
‡ Hospital sent comment letter Office of Statewide Health Planning and DevelopmentCalifornia Hospital Outcomes Project
Page 146

Detailed Statistical Resultsfor Acute Myocardial Infarction Mortality
Statewide Death Rate
(%)
Number of Observed
Deaths
Number of Expected Deaths Lower Upper
Expected Death Rate
(%)
Observed Death Rate
(%)
Risk Adjusted Death Rate 95% Confidence Bounds
Number of Cases
Included
Standard Deviation of Observed
Deaths
Risk-Adjusted
Death Rate (%)
Probability This Rate
Occurred by Chance
Los Angeles County: LAC/Harbor - UCLA Medical Center
395 38 31.5 10.7 18.48.09.6 0.12314.65.1All YearsModel A 12.08912
134 10 10.2 5.1 18.87.67.5 0.55411.92.91996 12.17742
119 14 8.9 11.7 26.17.511.8 0.05218.92.71997 12.02517
142 14 12.4 7.5 19.88.79.9 0.35313.63.21998 12.06405
393 38 40.1 8.5 14.410.29.7 0.37711.55.0All YearsModel B 12.10683
132 10 11.4 5.0 16.48.67.6 0.38810.72.71996 12.18490
119 14 11.6 9.0 20.09.811.8 0.24014.52.71997 12.03332
142 14 17.2 5.4 14.412.19.9 0.2079.93.21998 12.10273
Yearly Risk Adjusted Death Rates (%)with 95% Confidence Bounds
Model A
0
10
20
30
40
50
60
70
80
90
100
1996 1997 1998
Statewide
Yearly Risk Adjusted Death Rates (%)with 95% Confidence Bounds
Model B
0
10
20
30
40
50
60
70
80
90
100
1996 1997 1998
Statewide
‡ Hospital sent comment letter Office of Statewide Health Planning and DevelopmentCalifornia Hospital Outcomes Project

Detailed Statistical Resultsfor Acute Myocardial Infarction Mortality
Statewide Death Rate
(%)
Number of Observed
Deaths
Number of Expected Deaths Lower Upper
Expected Death Rate
(%)
Observed Death Rate
(%)
Risk Adjusted Death Rate 95% Confidence Bounds
Number of Cases
Included
Standard Deviation of Observed
Deaths
Risk-Adjusted
Death Rate (%)
Probability This Rate
Occurred by Chance
Los Angeles County: LAC/High Desert Hospital
11 0 0.4 0.0 37.43.30.0 0.6810.00.6All YearsModel A 12.08912
1 0 0.0 0.0 100.01.60.0 0.9840.00.11996 12.17742
4 0 0.1 0.0 66.82.90.0 0.8860.00.31997 12.02517
6 0 0.2 0.0 46.23.80.0 0.7820.00.51998 12.06405
9 0 0.2 0.0 58.71.70.0 0.8530.00.4All YearsModel B 12.10683
0 0.01996 12.18490
4 0 0.0 0.0 100.01.20.0 0.9520.00.21997 12.03332
5 0 0.1 0.0 70.42.10.0 0.8960.00.31998 12.10273
Yearly Risk Adjusted Death Rates (%)with 95% Confidence Bounds
Model A
0
10
20
30
40
50
60
70
80
90
100
1996 1997 1998
Statewide
Yearly Risk Adjusted Death Rates (%)with 95% Confidence Bounds
Model B
0
10
20
30
40
50
60
70
80
90
100
1996 1997 1998
Statewide
‡ Hospital sent comment letter Office of Statewide Health Planning and DevelopmentCalifornia Hospital Outcomes Project
Page 148

Detailed Statistical Resultsfor Acute Myocardial Infarction Mortality
Statewide Death Rate
(%)
Number of Observed
Deaths
Number of Expected Deaths Lower Upper
Expected Death Rate
(%)
Observed Death Rate
(%)
Risk Adjusted Death Rate 95% Confidence Bounds
Number of Cases
Included
Standard Deviation of Observed
Deaths
Risk-Adjusted
Death Rate (%)
Probability This Rate
Occurred by Chance
Los Angeles County: Lakewood Regional Medical Center
453 48 63.2 6.6 11.813.910.6 0.0159.26.9All YearsModel A 12.08912
130 15 19.5 4.7 14.115.011.5 0.1509.43.81996 12.17742
141 15 21.0 4.2 13.014.910.6 0.0778.63.91997 12.02517
182 18 22.7 5.2 13.912.59.9 0.1589.64.21998 12.06405
452 48 58.4 7.4 12.512.910.6 0.05310.06.2All YearsModel B 12.10683
130 15 17.8 5.6 14.913.711.5 0.25710.33.51996 12.18490
140 15 20.0 4.8 13.314.310.7 0.1029.03.61997 12.03332
182 18 20.6 6.3 14.911.39.9 0.29210.63.71998 12.10273
Yearly Risk Adjusted Death Rates (%)with 95% Confidence Bounds
Model A
0
10
20
30
40
50
60
70
80
90
100
1996 1997 1998
Statewide
Yearly Risk Adjusted Death Rates (%)with 95% Confidence Bounds
Model B
0
10
20
30
40
50
60
70
80
90
100
1996 1997 1998
Statewide
‡ Hospital sent comment letter Office of Statewide Health Planning and DevelopmentCalifornia Hospital Outcomes Project

Detailed Statistical Resultsfor Acute Myocardial Infarction Mortality
Statewide Death Rate
(%)
Number of Observed
Deaths
Number of Expected Deaths Lower Upper
Expected Death Rate
(%)
Observed Death Rate
(%)
Risk Adjusted Death Rate 95% Confidence Bounds
Number of Cases
Included
Standard Deviation of Observed
Deaths
Risk-Adjusted
Death Rate (%)
Probability This Rate
Occurred by Chance
Los Angeles County: Lancaster Community Hospital
443 56 48.0 11.0 17.210.812.6 0.11514.16.2All YearsModel A 12.08912
142 13 16.3 4.4 15.011.59.2 0.2239.73.61996 12.17742
172 30 19.3 13.9 23.511.217.4 0.00718.73.91997 12.02517
129 13 12.3 6.6 18.89.610.1 0.46612.73.21998 12.06405
443 56 46.5 11.7 17.410.512.6 0.05814.65.6All YearsModel B 12.10683
142 13 14.1 5.9 16.69.99.2 0.43911.33.11996 12.18490
172 30 19.3 14.3 23.011.217.4 0.00318.73.61997 12.03332
129 13 13.1 6.5 17.510.210.1 0.56112.03.01998 12.10273
Yearly Risk Adjusted Death Rates (%)with 95% Confidence Bounds
Model A
0
10
20
30
40
50
60
70
80
90
100
1996 1997 1998
Statewide
Yearly Risk Adjusted Death Rates (%)with 95% Confidence Bounds
Model B
0
10
20
30
40
50
60
70
80
90
100
1996 1997 1998
Statewide
‡ Hospital sent comment letter Office of Statewide Health Planning and DevelopmentCalifornia Hospital Outcomes Project
Page 150

Detailed Statistical Resultsfor Acute Myocardial Infarction Mortality
Statewide Death Rate
(%)
Number of Observed
Deaths
Number of Expected Deaths Lower Upper
Expected Death Rate
(%)
Observed Death Rate
(%)
Risk Adjusted Death Rate 95% Confidence Bounds
Number of Cases
Included
Standard Deviation of Observed
Deaths
Risk-Adjusted
Death Rate (%)
Probability This Rate
Occurred by Chance
Los Angeles County: Lincoln Hospital Medical Center
1 0 0.1 0.0 100.05.10.0 0.9490.00.2All YearsModel A 12.08912
01996 12.17742
1 0 0.1 0.0 100.05.10.0 0.9490.00.21997 12.02517
01998 12.06405
1 0 0.0 0.0 100.02.70.0 0.9730.00.2All YearsModel B 12.10683
01996 12.18490
1 0 0.0 0.0 100.02.70.0 0.9730.00.21997 12.03332
01998 12.10273
Yearly Risk Adjusted Death Rates (%)with 95% Confidence Bounds
Model A
0
10
20
30
40
50
60
70
80
90
100
1996 1997 1998
Statewide
Yearly Risk Adjusted Death Rates (%)with 95% Confidence Bounds
Model B
0
10
20
30
40
50
60
70
80
90
100
1996 1997 1998
Statewide
‡ Hospital sent comment letter Office of Statewide Health Planning and DevelopmentCalifornia Hospital Outcomes Project

Detailed Statistical Resultsfor Acute Myocardial Infarction Mortality
Statewide Death Rate
(%)
Number of Observed
Deaths
Number of Expected Deaths Lower Upper
Expected Death Rate
(%)
Observed Death Rate
(%)
Risk Adjusted Death Rate 95% Confidence Bounds
Number of Cases
Included
Standard Deviation of Observed
Deaths
Risk-Adjusted
Death Rate (%)
Probability This Rate
Occurred by Chance
Los Angeles County: Little Company of Mary Hospital
594 66 67.7 9.2 14.311.411.1 0.44011.87.3All YearsModel A 12.08912
195 25 23.0 8.8 17.611.812.8 0.35413.24.21996 12.17742
224 24 26.3 6.9 15.111.710.7 0.35511.04.61997 12.02517
175 17 18.4 6.2 16.110.59.7 0.41511.13.81998 12.06405
591 65 66.5 9.4 14.211.311.0 0.44611.86.7All YearsModel B 12.10683
193 24 21.4 9.4 17.911.112.4 0.28613.73.81996 12.18490
224 24 26.2 7.2 14.811.710.7 0.34611.04.21997 12.03332
174 17 18.8 6.5 15.410.89.8 0.36210.93.61998 12.10273
Yearly Risk Adjusted Death Rates (%)with 95% Confidence Bounds
Model A
0
10
20
30
40
50
60
70
80
90
100
1996 1997 1998
Statewide
Yearly Risk Adjusted Death Rates (%)with 95% Confidence Bounds
Model B
0
10
20
30
40
50
60
70
80
90
100
1996 1997 1998
Statewide
‡ Hospital sent comment letter Office of Statewide Health Planning and DevelopmentCalifornia Hospital Outcomes Project
Page 152
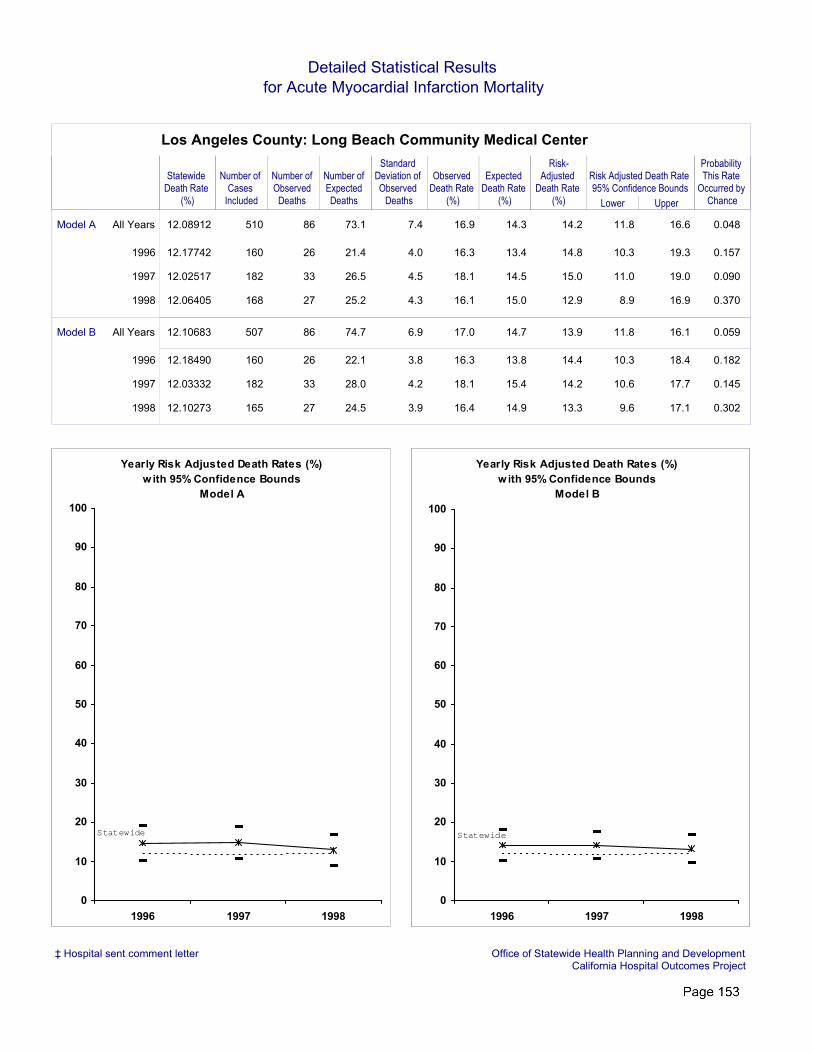
Detailed Statistical Resultsfor Acute Myocardial Infarction Mortality
Statewide Death Rate
(%)
Number of Observed
Deaths
Number of Expected Deaths Lower Upper
Expected Death Rate
(%)
Observed Death Rate
(%)
Risk Adjusted Death Rate 95% Confidence Bounds
Number of Cases
Included
Standard Deviation of Observed
Deaths
Risk-Adjusted
Death Rate (%)
Probability This Rate
Occurred by Chance
Los Angeles County: Long Beach Community Medical Center
510 86 73.1 11.8 16.614.316.9 0.04814.27.4All YearsModel A 12.08912
160 26 21.4 10.3 19.313.416.3 0.15714.84.01996 12.17742
182 33 26.5 11.0 19.014.518.1 0.09015.04.51997 12.02517
168 27 25.2 8.9 16.915.016.1 0.37012.94.31998 12.06405
507 86 74.7 11.8 16.114.717.0 0.05913.96.9All YearsModel B 12.10683
160 26 22.1 10.3 18.413.816.3 0.18214.43.81996 12.18490
182 33 28.0 10.6 17.715.418.1 0.14514.24.21997 12.03332
165 27 24.5 9.6 17.114.916.4 0.30213.33.91998 12.10273
Yearly Risk Adjusted Death Rates (%)with 95% Confidence Bounds
Model A
0
10
20
30
40
50
60
70
80
90
100
1996 1997 1998
Statewide
Yearly Risk Adjusted Death Rates (%)with 95% Confidence Bounds
Model B
0
10
20
30
40
50
60
70
80
90
100
1996 1997 1998
Statewide
‡ Hospital sent comment letter Office of Statewide Health Planning and DevelopmentCalifornia Hospital Outcomes Project

Detailed Statistical Resultsfor Acute Myocardial Infarction Mortality
Statewide Death Rate
(%)
Number of Observed
Deaths
Number of Expected Deaths Lower Upper
Expected Death Rate
(%)
Observed Death Rate
(%)
Risk Adjusted Death Rate 95% Confidence Bounds
Number of Cases
Included
Standard Deviation of Observed
Deaths
Risk-Adjusted
Death Rate (%)
Probability This Rate
Occurred by Chance
Los Angeles County: Long Beach Doctor's Hospital
4 1 0.8 0.0 36.819.525.0 0.62915.50.7All YearsModel A 12.08912
4 1 0.8 0.0 37.119.525.0 0.62915.60.71996 12.17742
01997 12.02517
01998 12.06405
4 1 1.2 0.0 24.529.725.0 0.67810.20.7All YearsModel B 12.10683
4 1 1.2 0.0 24.629.725.0 0.67810.30.71996 12.18490
01997 12.03332
01998 12.10273
Yearly Risk Adjusted Death Rates (%)with 95% Confidence Bounds
Model A
0
10
20
30
40
50
60
70
80
90
100
1996 1997 1998
Statewide
Yearly Risk Adjusted Death Rates (%)with 95% Confidence Bounds
Model B
0
10
20
30
40
50
60
70
80
90
100
1996 1997 1998
Statewide
‡ Hospital sent comment letter Office of Statewide Health Planning and DevelopmentCalifornia Hospital Outcomes Project
Page 154

Detailed Statistical Resultsfor Acute Myocardial Infarction Mortality
Statewide Death Rate
(%)
Number of Observed
Deaths
Number of Expected Deaths Lower Upper
Expected Death Rate
(%)
Observed Death Rate
(%)
Risk Adjusted Death Rate 95% Confidence Bounds
Number of Cases
Included
Standard Deviation of Observed
Deaths
Risk-Adjusted
Death Rate (%)
Probability This Rate
Occurred by Chance
Los Angeles County: Long Beach Memorial Medical Center
760 91 115.7 7.6 11.415.212.0 0.0049.59.3All YearsModel A 12.08912
253 25 38.3 4.6 11.315.19.9 0.0078.05.41996 12.17742
284 41 46.4 7.7 13.516.314.4 0.19810.65.81997 12.02517
223 25 31.0 6.0 13.413.911.2 0.1269.74.91998 12.06405
758 90 107.7 8.2 12.014.211.9 0.01910.18.5All YearsModel B 12.10683
253 25 37.6 4.9 11.314.99.9 0.0068.15.01996 12.18490
283 40 42.0 8.5 14.414.814.1 0.39511.55.31997 12.03332
222 25 28.2 7.0 14.412.711.3 0.27410.74.41998 12.10273
Yearly Risk Adjusted Death Rates (%)with 95% Confidence Bounds
Model A
0
10
20
30
40
50
60
70
80
90
100
1996 1997 1998
Statewide
Yearly Risk Adjusted Death Rates (%)with 95% Confidence Bounds
Model B
0
10
20
30
40
50
60
70
80
90
100
1996 1997 1998
Statewide
‡ Hospital sent comment letter Office of Statewide Health Planning and DevelopmentCalifornia Hospital Outcomes Project

Detailed Statistical Resultsfor Acute Myocardial Infarction Mortality
Statewide Death Rate
(%)
Number of Observed
Deaths
Number of Expected Deaths Lower Upper
Expected Death Rate
(%)
Observed Death Rate
(%)
Risk Adjusted Death Rate 95% Confidence Bounds
Number of Cases
Included
Standard Deviation of Observed
Deaths
Risk-Adjusted
Death Rate (%)
Probability This Rate
Occurred by Chance
Los Angeles County: Los Angeles Community Hospital
23 2 2.6 0.0 22.811.18.7 0.5169.51.4All YearsModel A 12.08912
13 2 1.0 1.5 45.28.015.4 0.28023.41.01996 12.17742
5 0 0.6 0.0 27.012.60.0 0.5010.00.71997 12.02517
5 0 0.9 0.0 21.117.70.0 0.3460.00.81998 12.06405
23 2 3.0 0.0 18.913.28.7 0.3688.01.4All YearsModel B 12.10683
13 2 1.6 1.3 29.612.115.4 0.51715.40.91996 12.18490
5 0 0.9 0.0 21.617.10.0 0.3620.00.81997 12.03332
5 0 0.6 0.0 26.911.90.0 0.5040.00.71998 12.10273
Yearly Risk Adjusted Death Rates (%)with 95% Confidence Bounds
Model A
0
10
20
30
40
50
60
70
80
90
100
1996 1997 1998
Statewide
Yearly Risk Adjusted Death Rates (%)with 95% Confidence Bounds
Model B
0
10
20
30
40
50
60
70
80
90
100
1996 1997 1998
Statewide
‡ Hospital sent comment letter Office of Statewide Health Planning and DevelopmentCalifornia Hospital Outcomes Project
Page 156