Embed Size (px)
Citation preview
1
Policies for Rural Areas(2007 – 2013)
Lutz Ribbe (European Nature Heritage Fund - EURONATUR)
2
Two Approaches for the Development of Agriculture
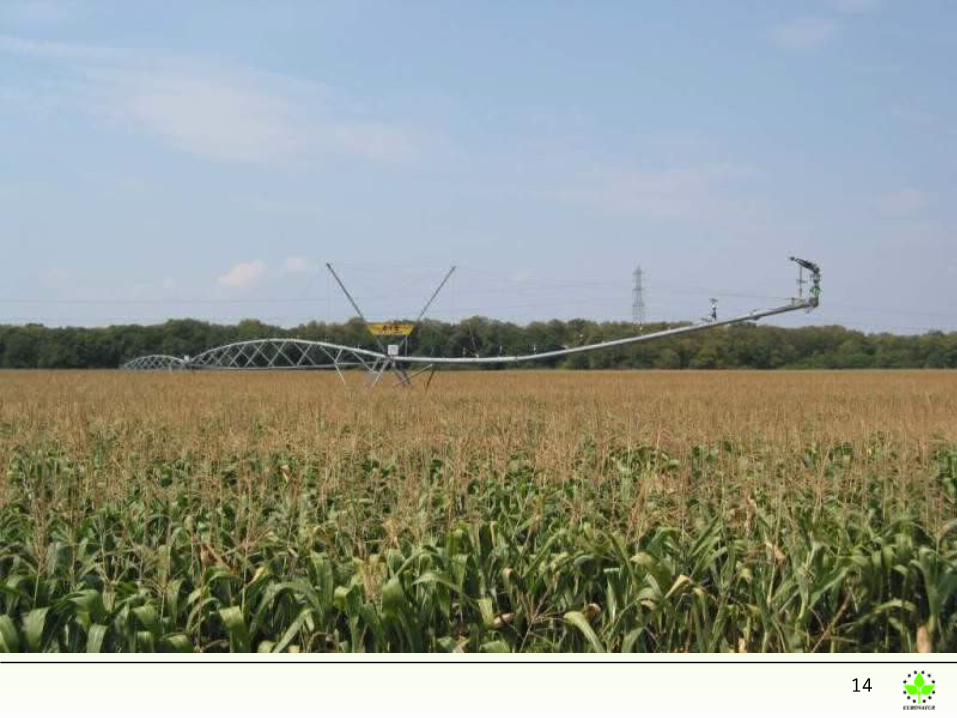
Approach # 1 (= main approach of CAP)
Towards „cost leadership“:– produce in the cheapest way, mainly raw materials for
the food industry (and more and more: for the mineral oil sector)
– become more productive – rationalize and intensify– squeeze the maximum out of soil, plants and animals
…– … and the farmers (“grow or die”)
3
the consequence
- high input of energy, fertilizers, pesticides, (GMO`s)
- “cheap” mass production
- concentration of farms
- concentration in regions
- swift to agro industry
- Where does this ends?
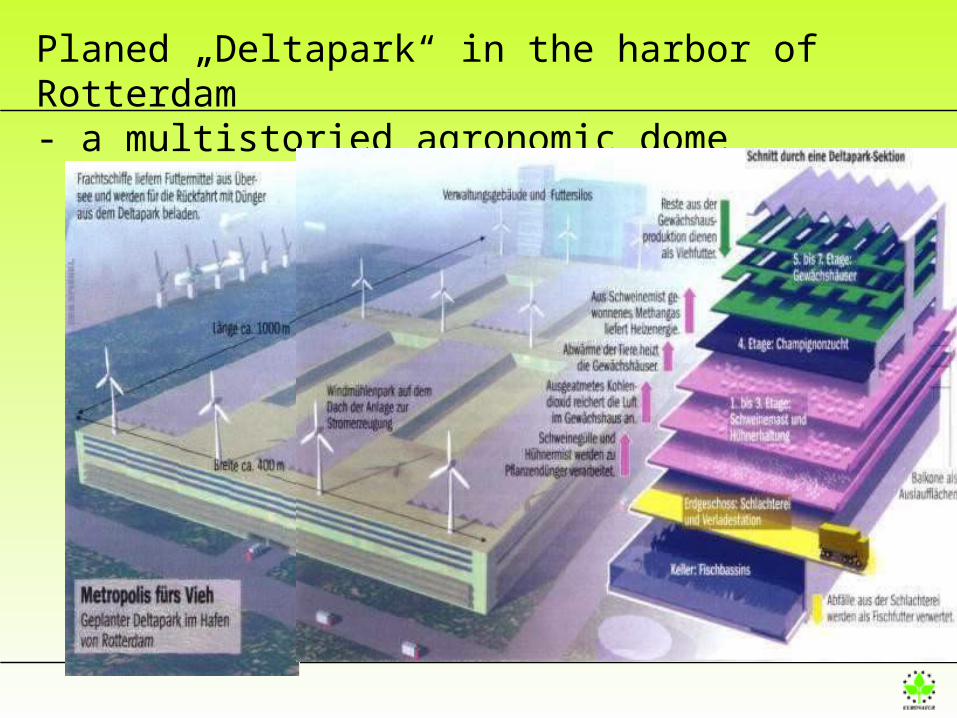
Grafik: Der Spiegel (2000)
Planed „Deltapark“ in the harbor of Rotterdam- a multistoried agronomic dome
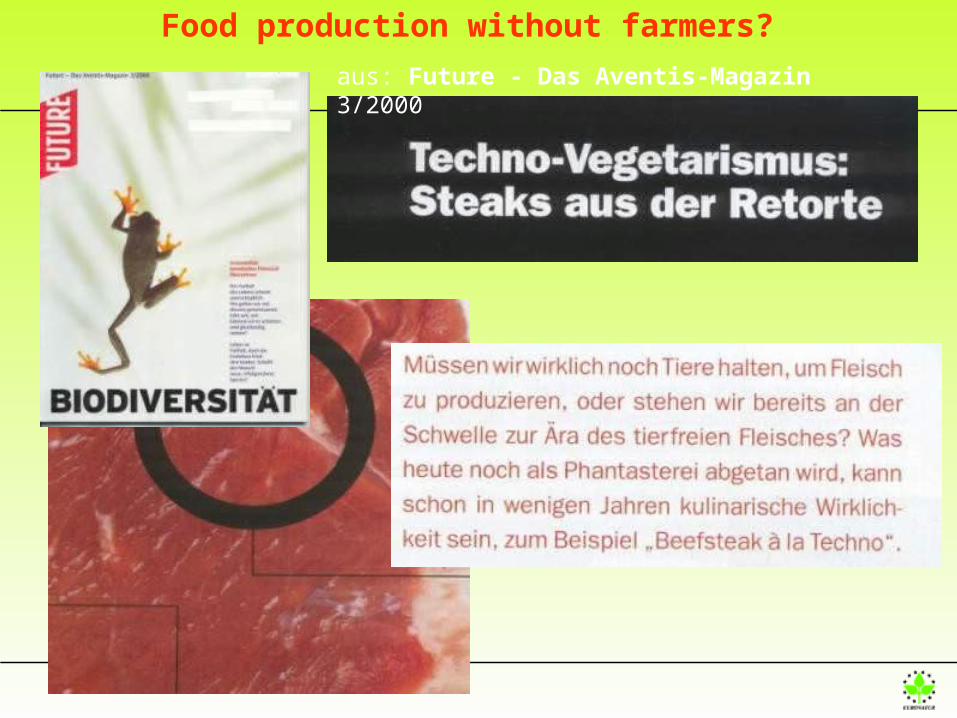
aus: Future - Das Aventis-Magazin 3/2000
Food production without farmers?
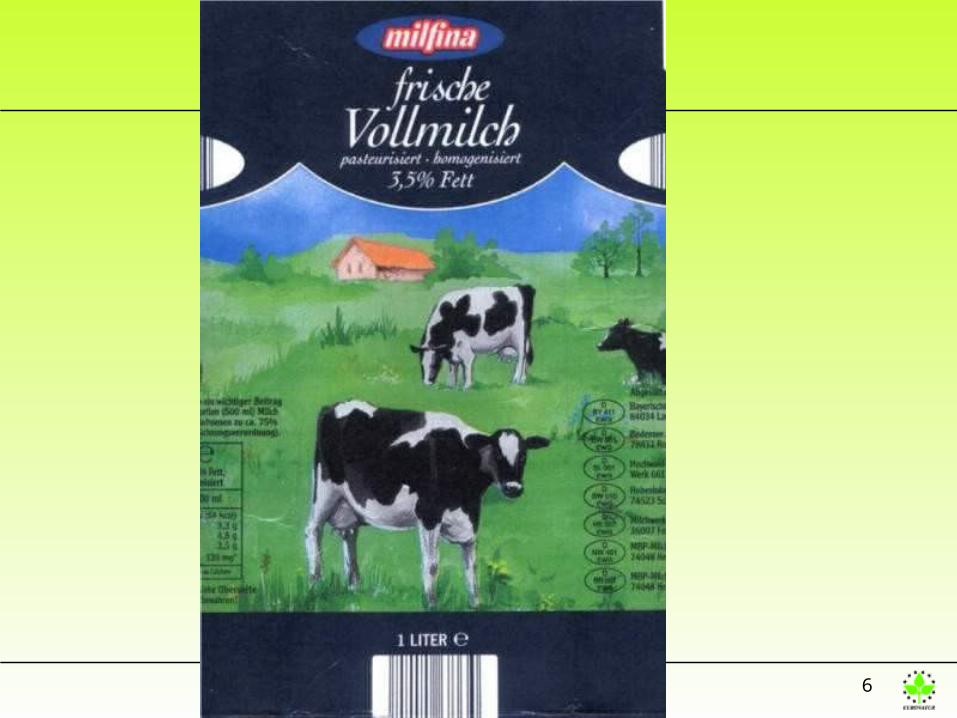
6
7
8
9
10
11
12
13
14
15
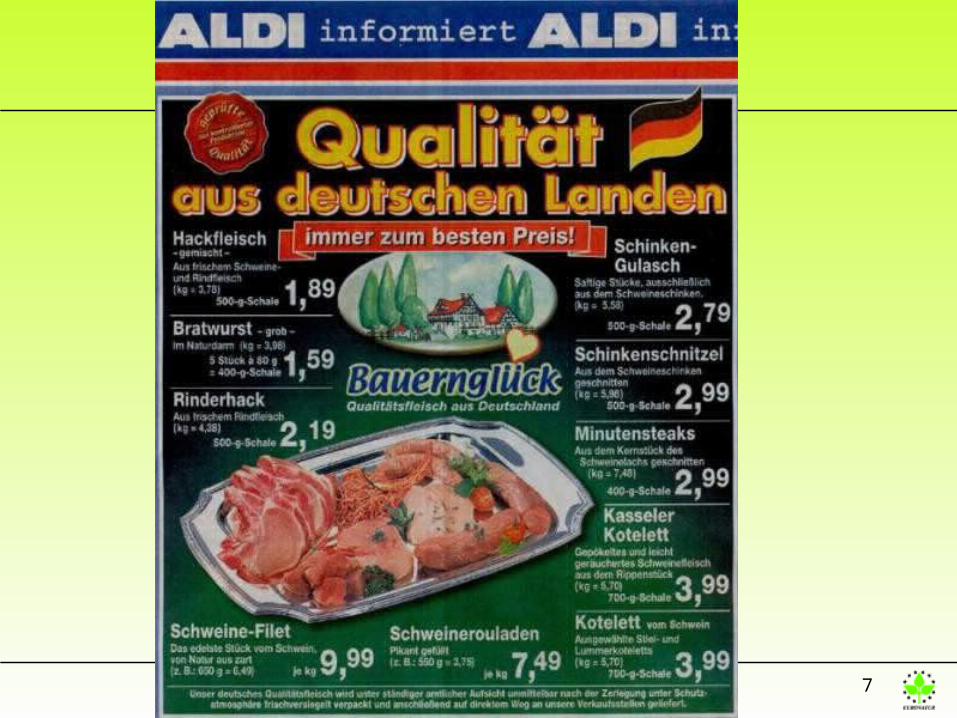
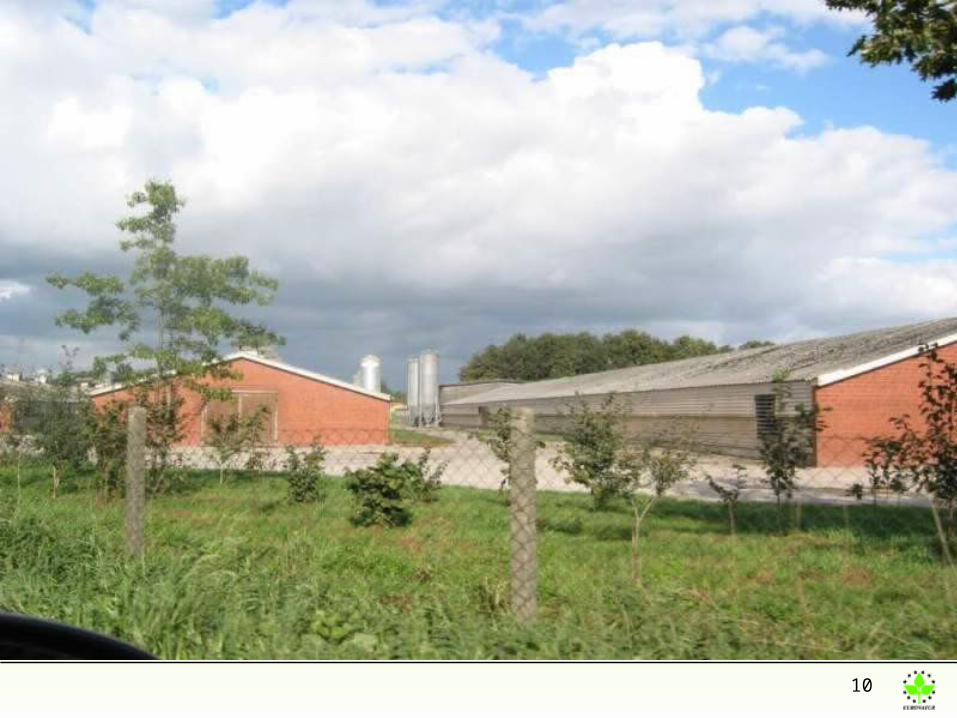
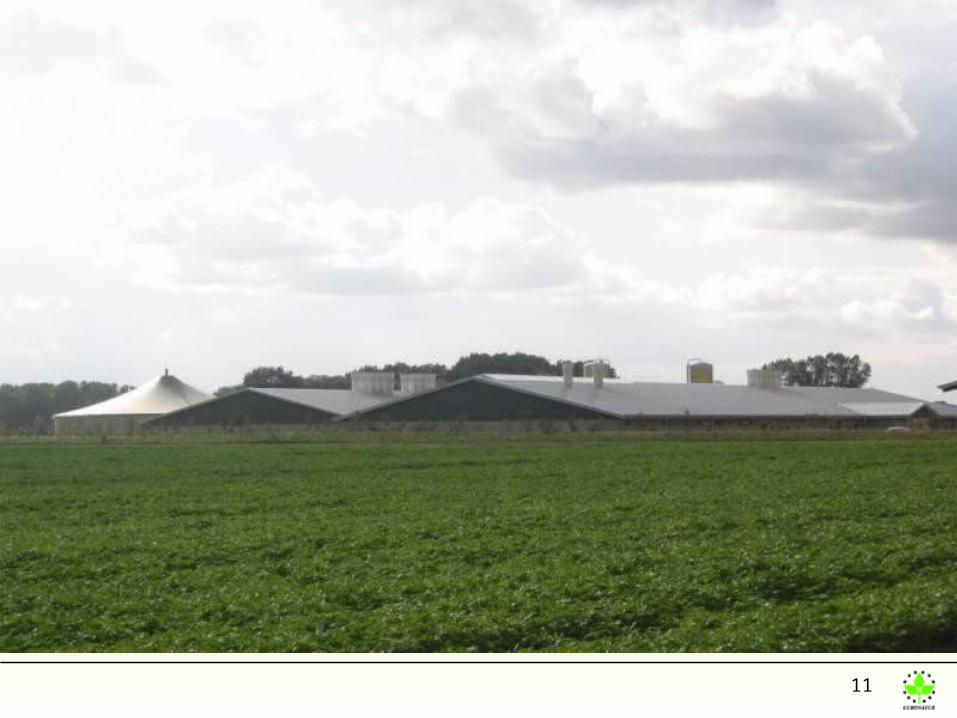
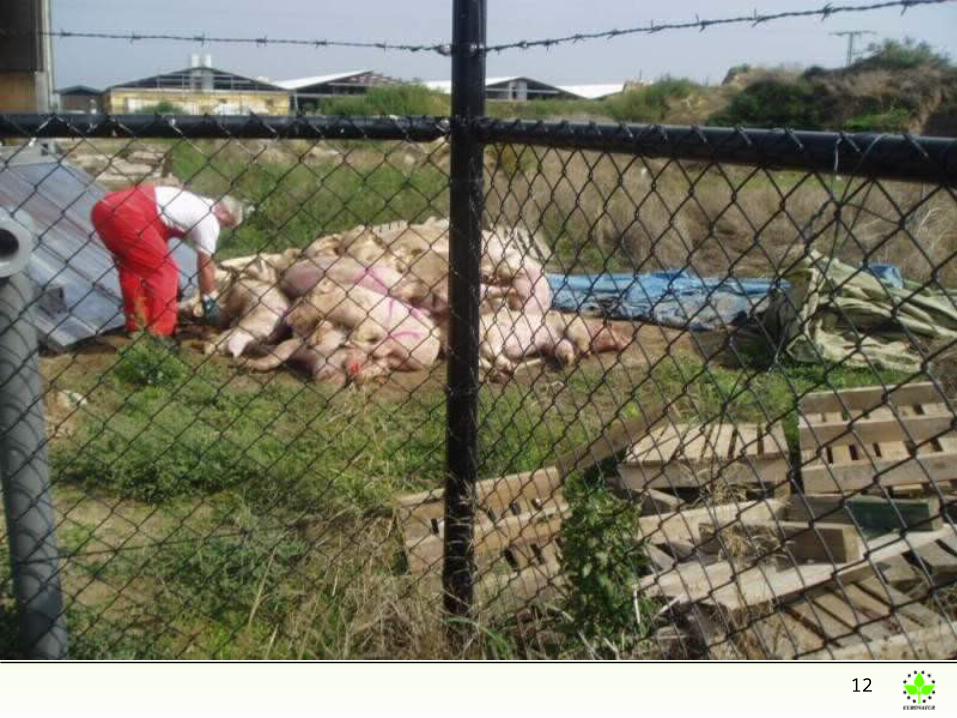
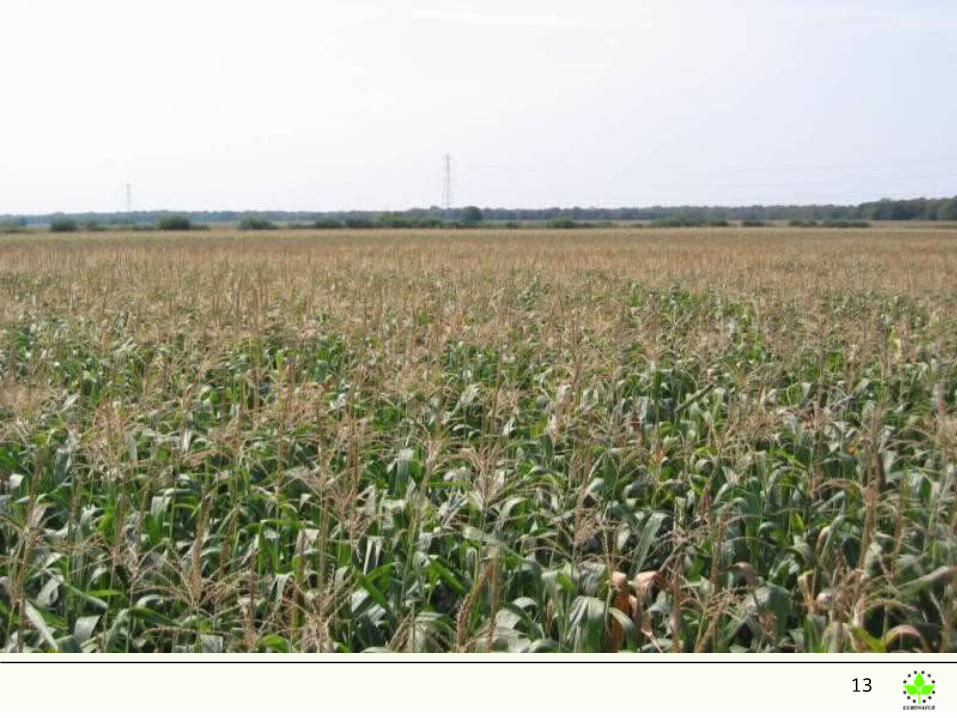
Effects of Approach # 1
It is indisputable that an agriculture trying to achieve competitiveness by cost leadership – massively destroys jobs
– pollutes environment, loss of biodiversity
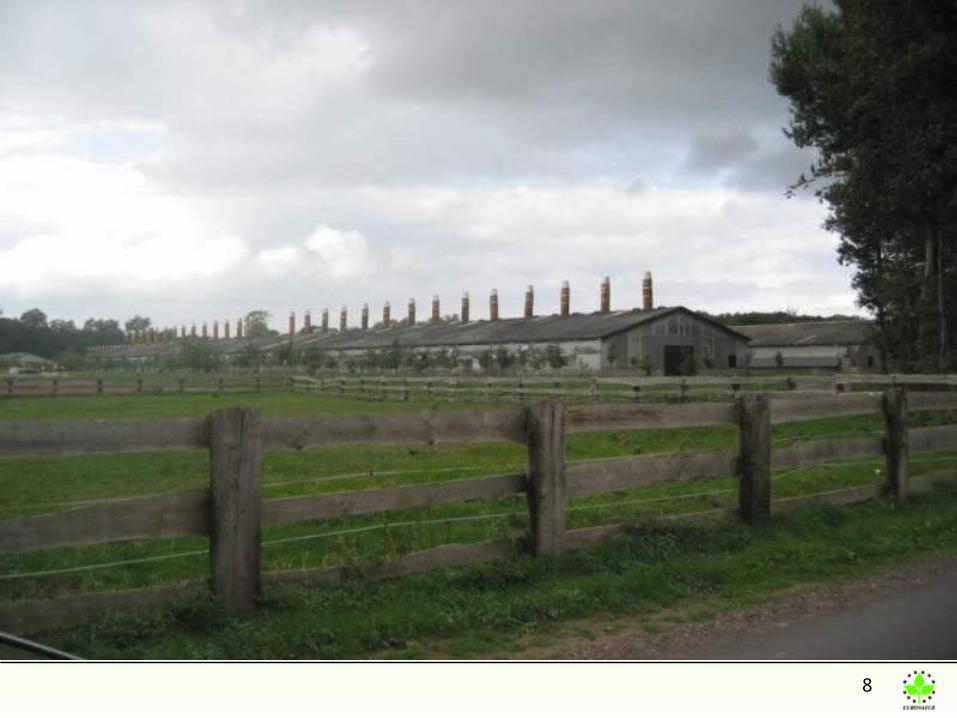
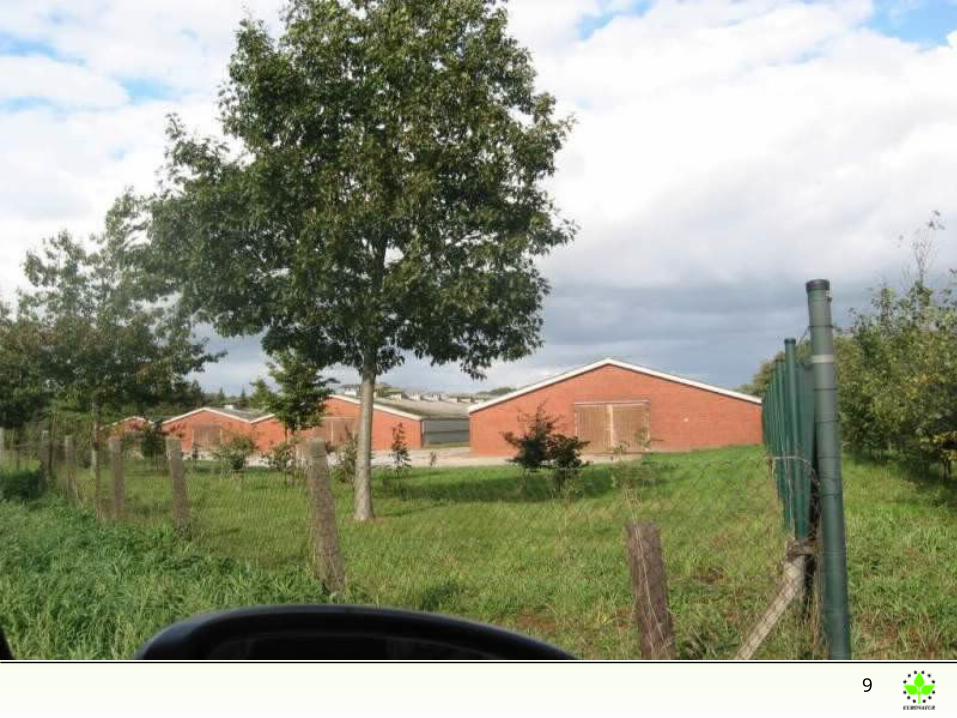
– provokes intensive mass animal farming
– centralizes production, processing and marketing
– provokes the migration from rural areas
– drives farmers into dependency
– leads to a uniform choice of products
16
Two Approaches for the Development of agriculture
Approach # 2: Multifunctional
Create competitiveness through:
– Diversification (more than raw materials)
– More ecological sound agriculture
– High quality or/ and regional products
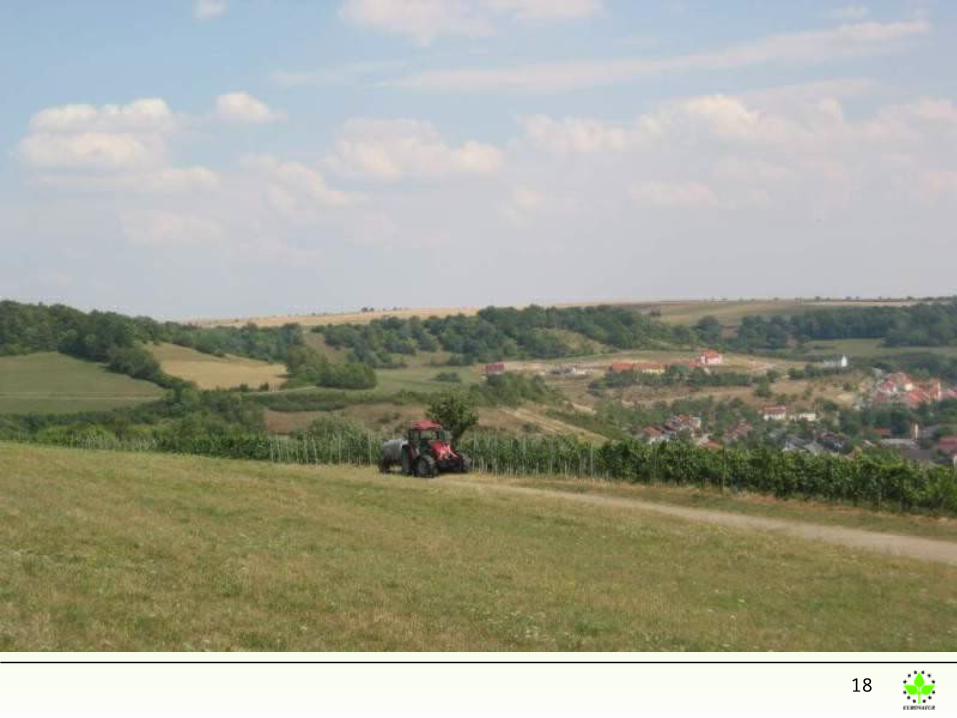
17
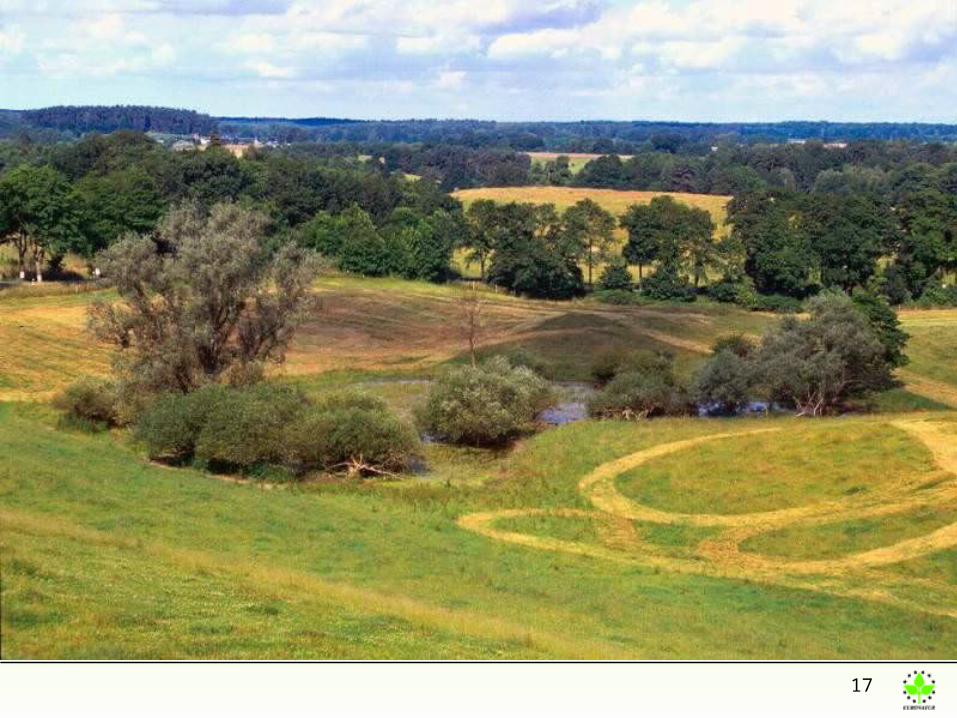
Brandenburg
18
Hohenlohe, Baden-Württemberg
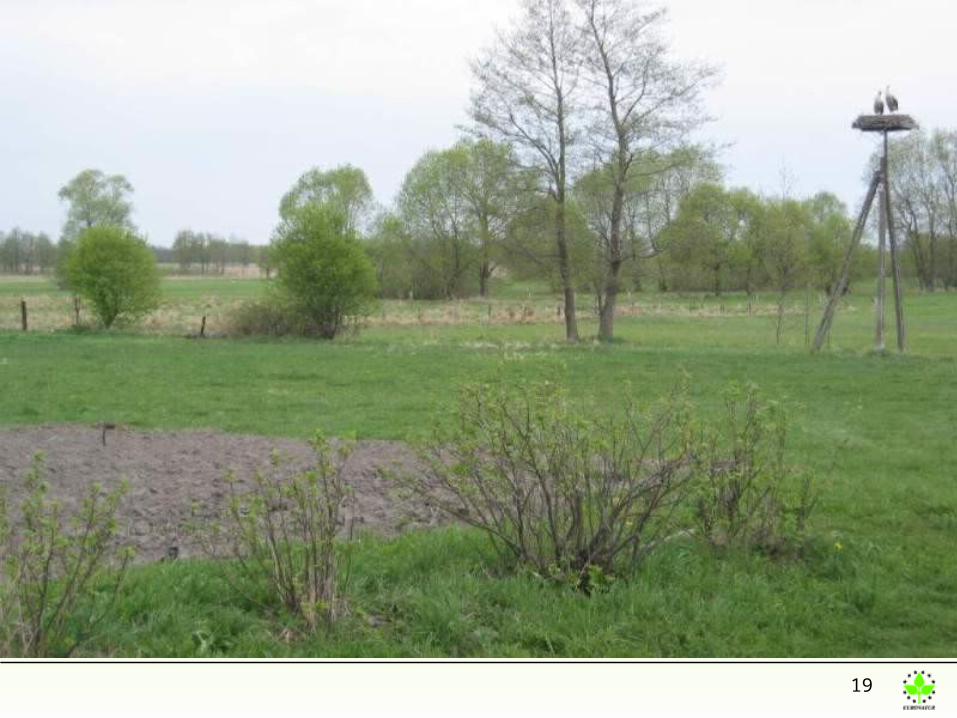
19
Podlassien, Polen
20
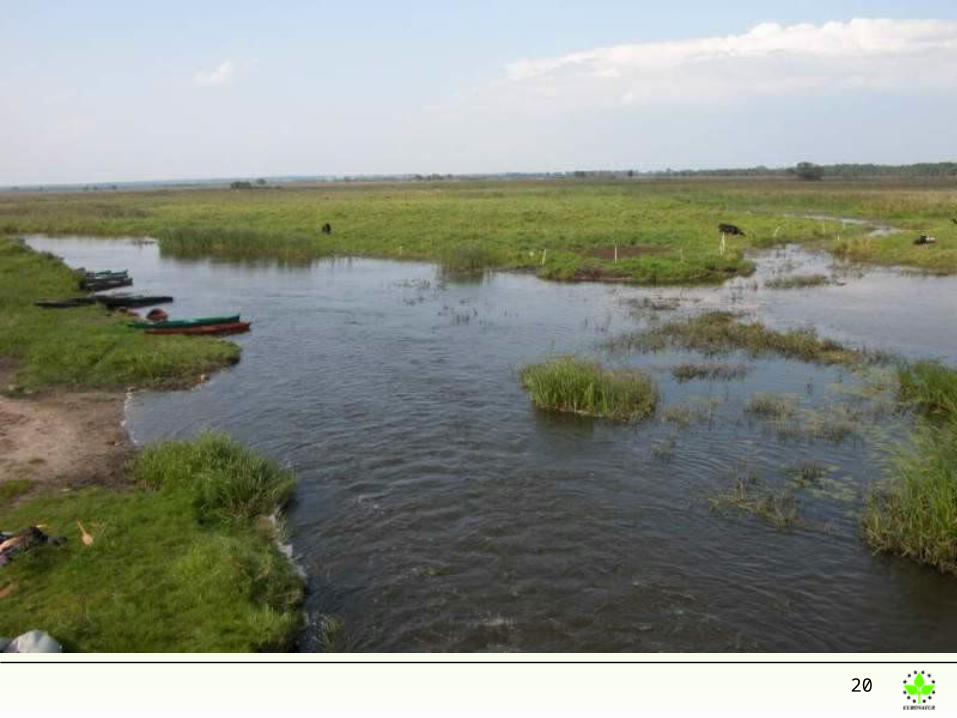
21
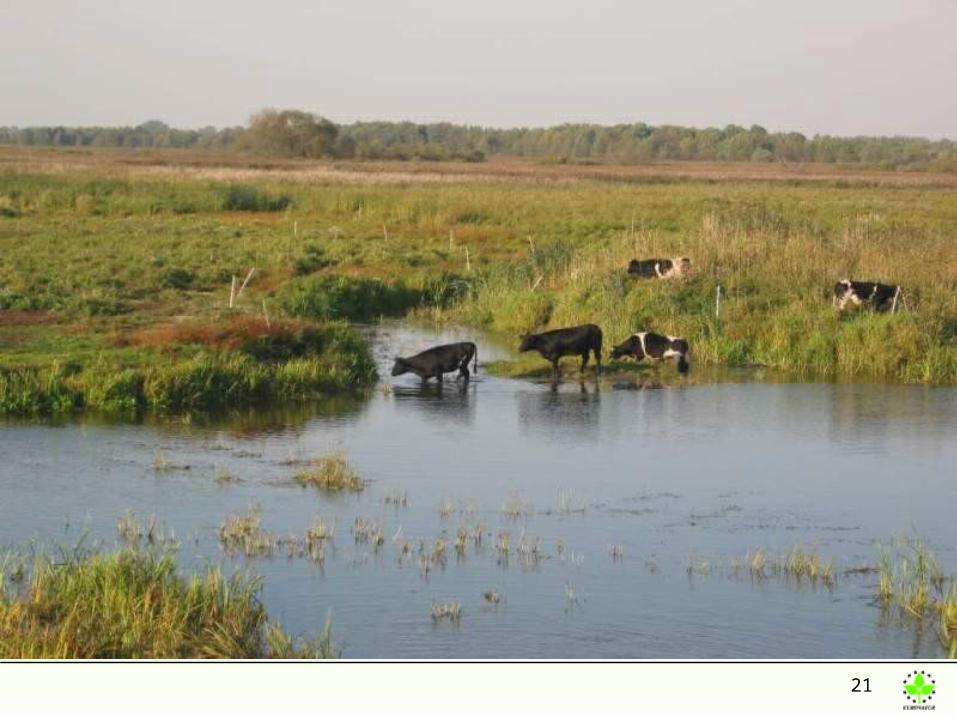
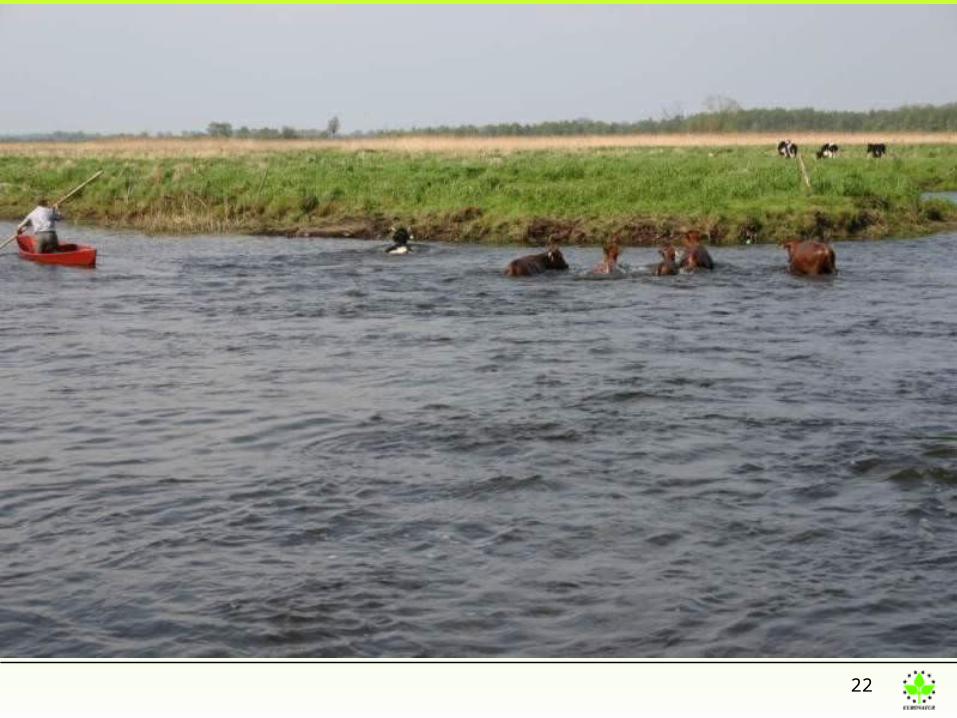
Narew, Polen
22
23
24
25
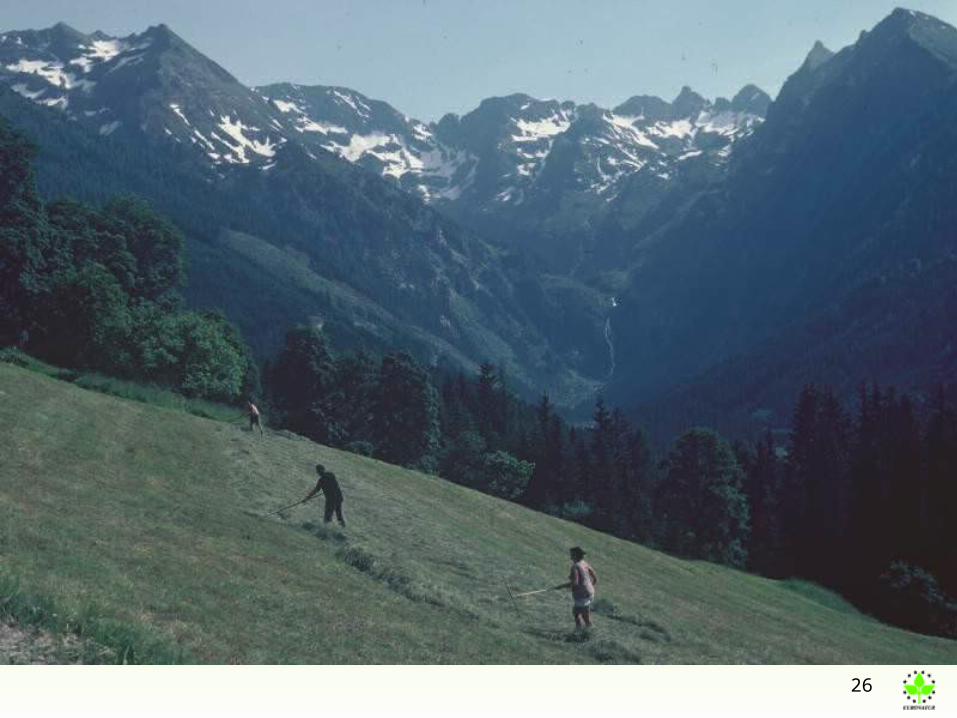
26
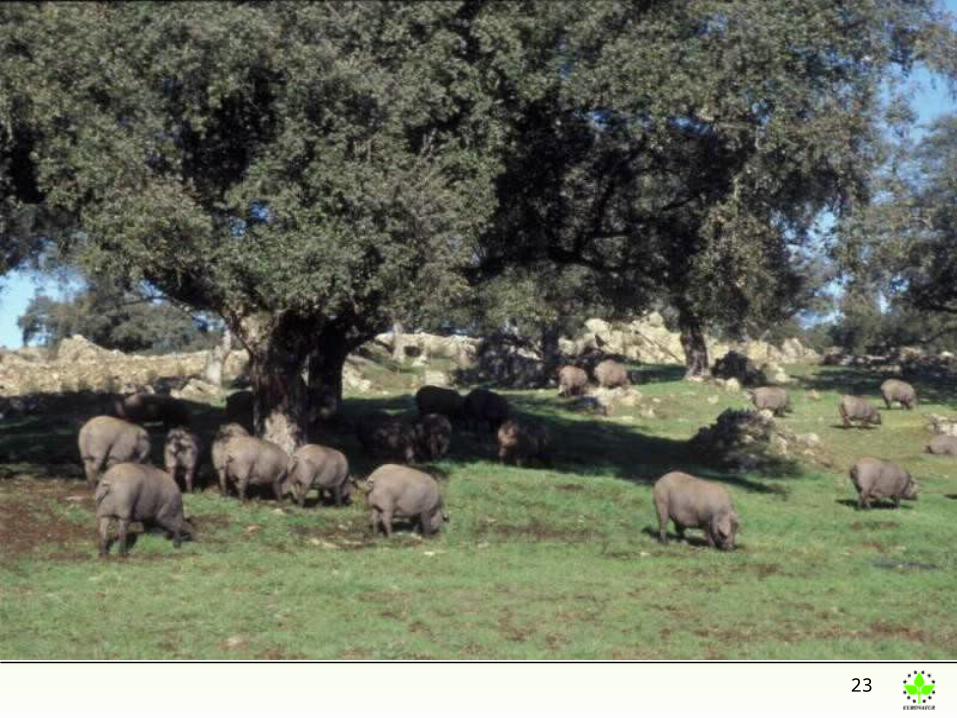
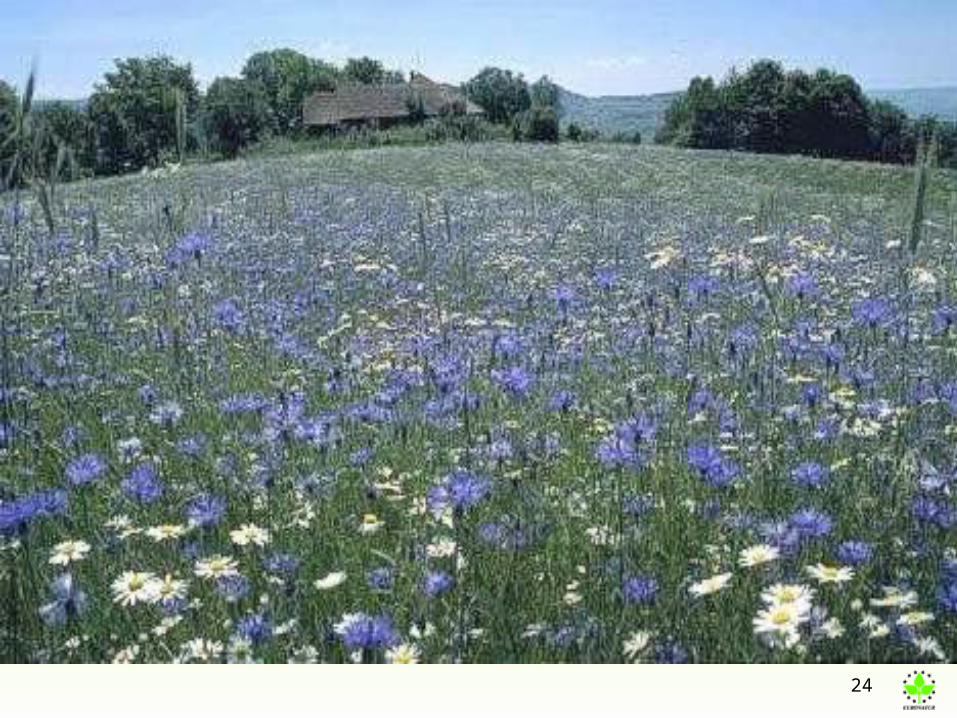
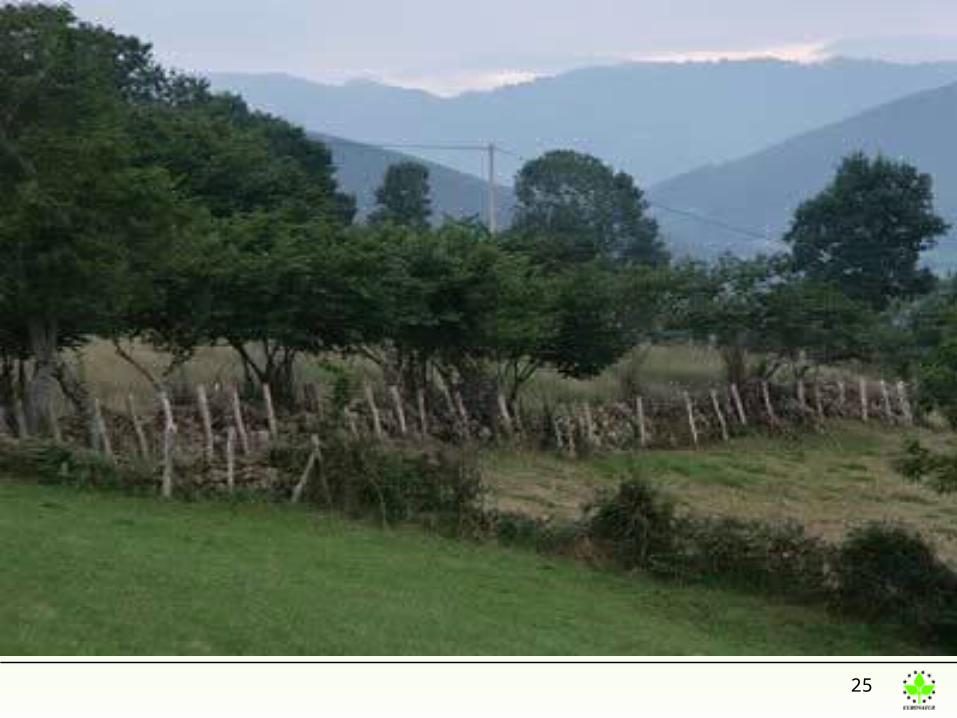
Europe's diverse Agriculture
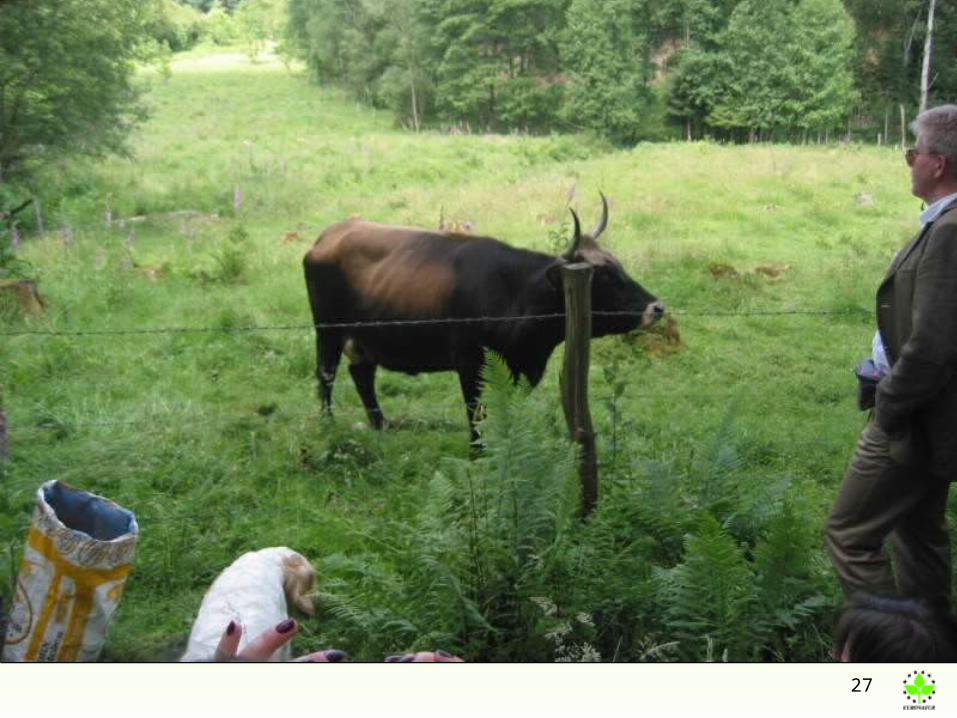
27
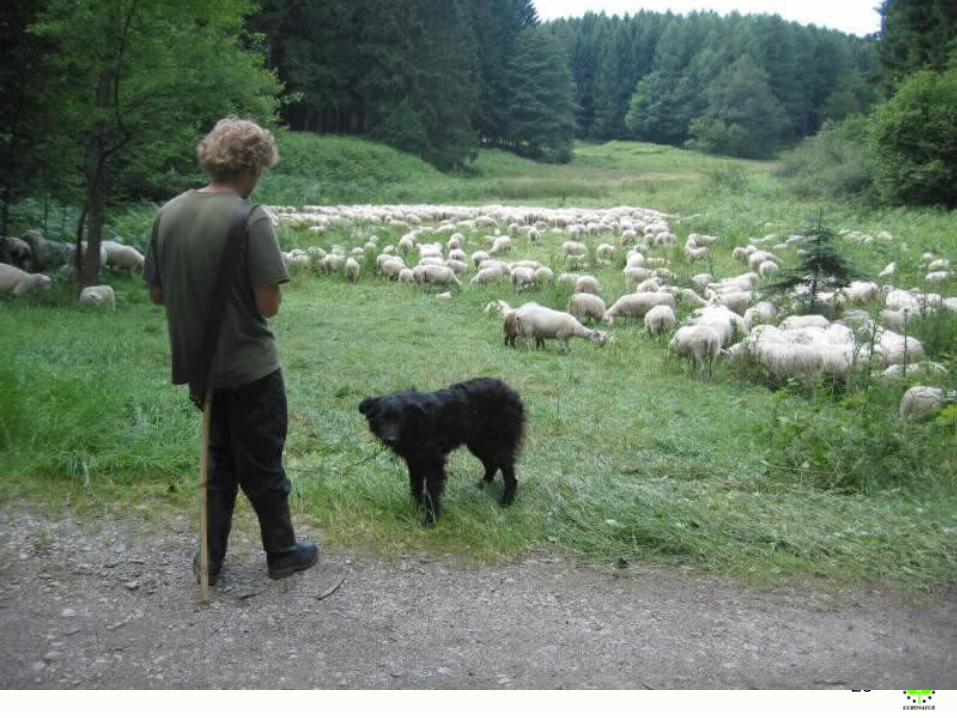
28
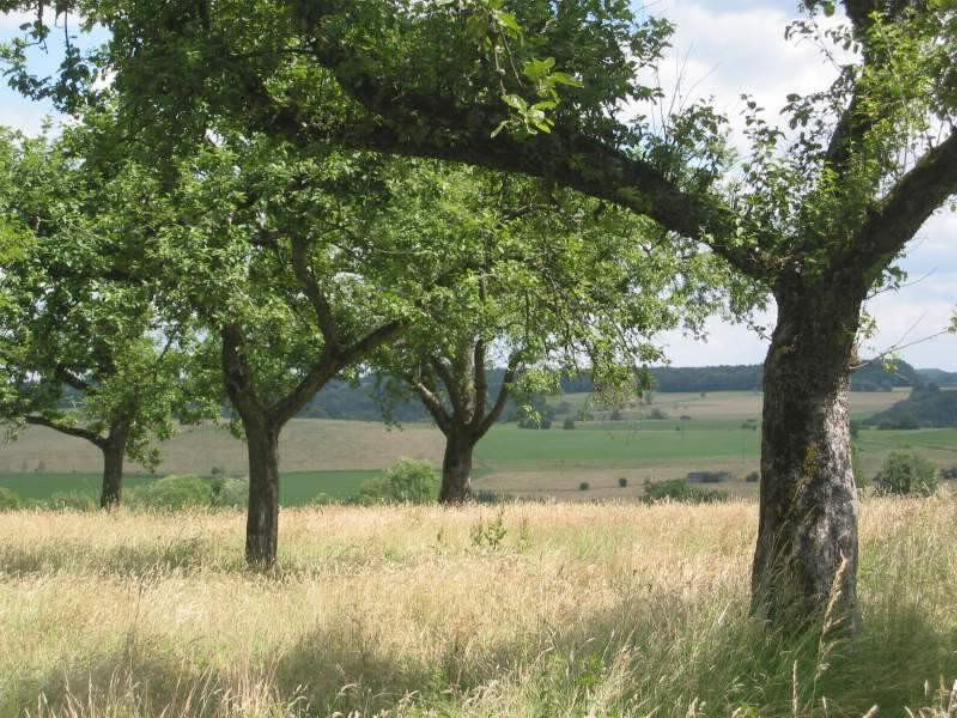
29
30
Effects of Approach # 2
Multifunctional agriculture (supported by Rural Development Programs)– conserves or creates jobs
– protects nature and environment
– tolerates animal welfare
– stops migration from rural areas
– conserves decentralized processing and marketing
– leads to a huge variety of products
31
Main objectives of Rural Development
- Agro environmental programmes
- Nature protection (NATURA 2000?)
- Diversification of regional processing and marketing
- Improve life in rural areas
- Strengthen local groups (Leader as a bottom up approach)
- cares for those farmers, productions and regions without a chance on the world market
- money is paid only for clearly described „services“, accepted by society
We are aware of the in
coherence of many RD programmes!
32
Advantages of Rural Development
Important source of income for farms in marginal areas
Diversification in rural areas
High degree of acceptance within society
Farmers deliver real services to society (services instead of subsidies!!!)
Accepted by WTO
33
The RD essential for…
… those farmers getting no or too little benefit out of the 1st pillar.
… less favored areas (compensatory payments)
… agri-environmental schemes.
… nature protection by contract
… financing NATURA 2000 (new!)
34
RD essential for…
… conservation of mosaic landscape, as a basis of tourism
… investments in farms, new income & jobs
… LEADER + (so far paid by Structural Funds)
… forestall-environmental schemes (new!)
… realization of the Water framework-directive (new!)
35
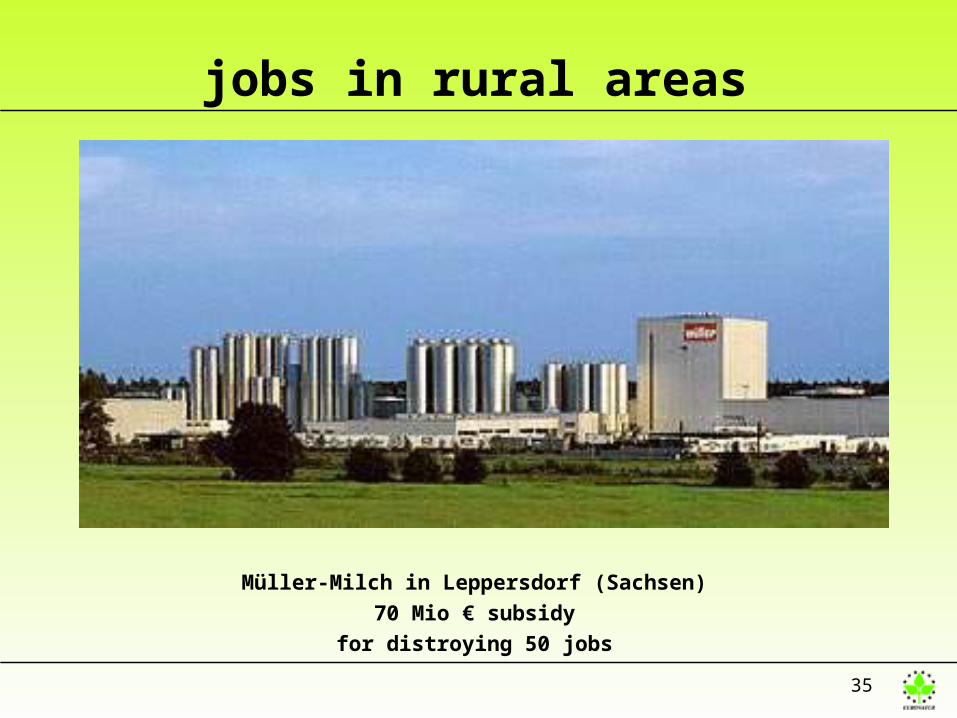
jobs in rural areas
Müller-Milch in Leppersdorf (Sachsen)
70 Mio € subsidy
for distroying 50 jobs
36
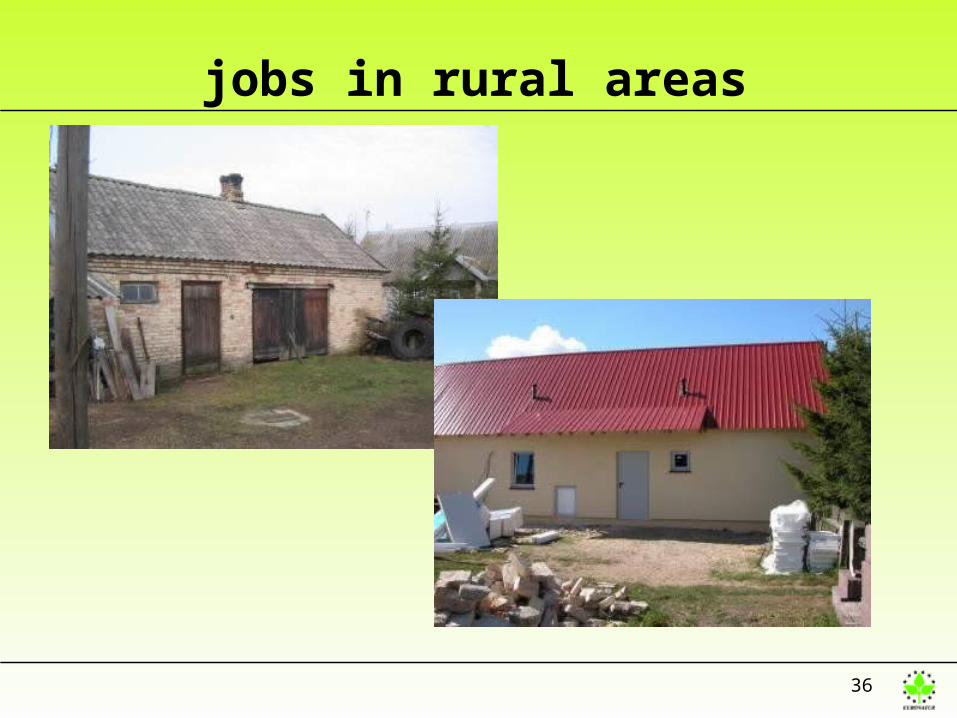
jobs in rural areas
37
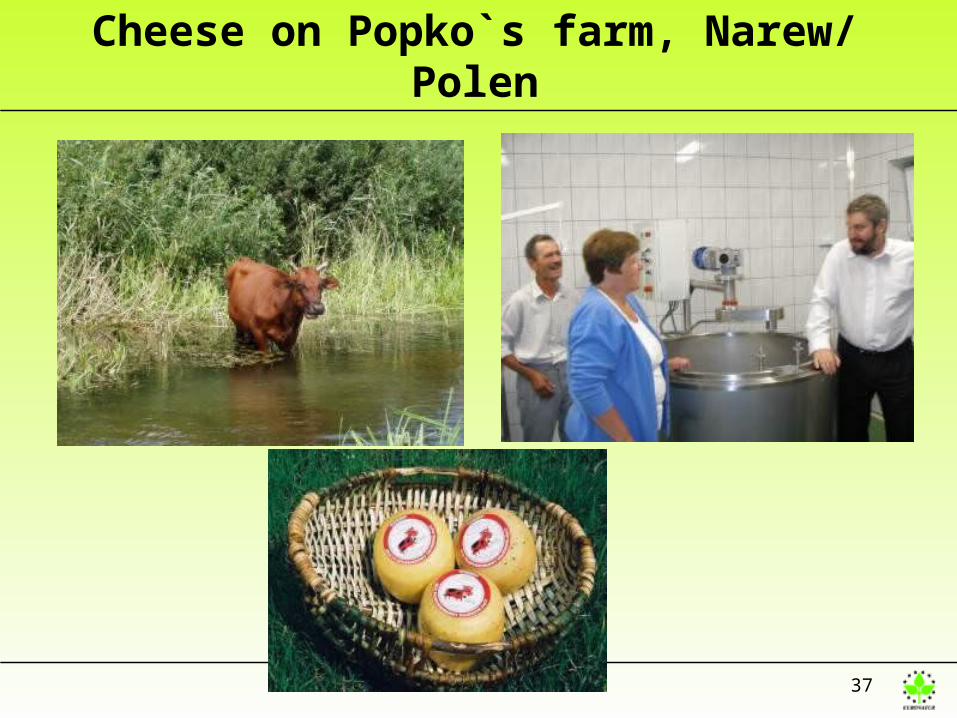
Cheese on Popko`s farm, Narew/ Polen
38
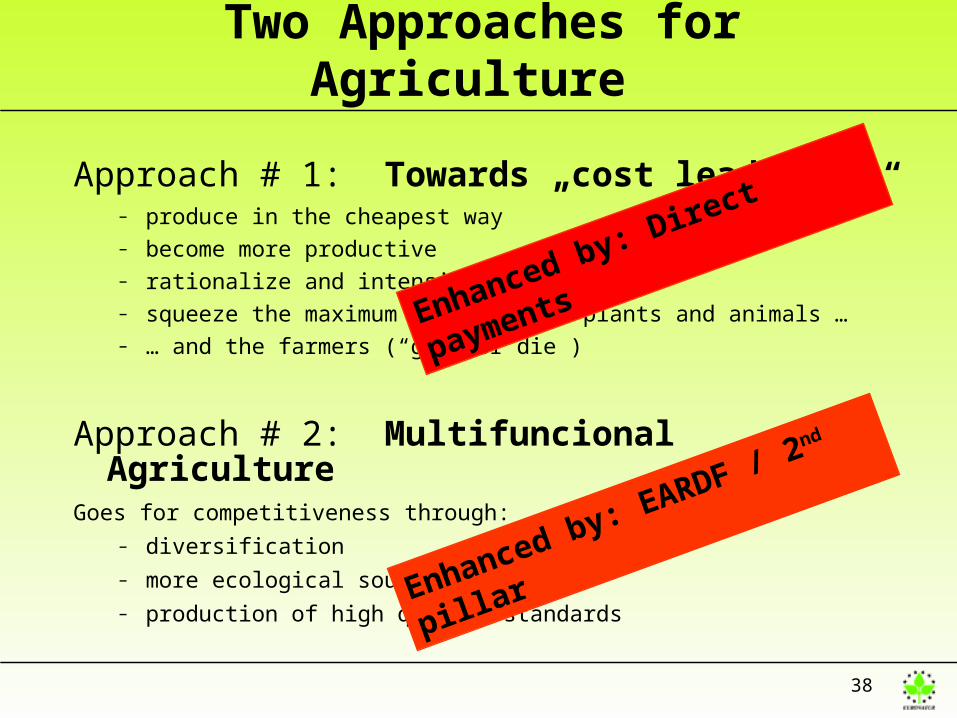
Two Approaches for Agriculture
Approach # 1: Towards „cost leadership“– produce in the cheapest way– become more productive – rationalize and intensify– squeeze the maximum out of soil, plants and animals …– … and the farmers (“grow or die”)
Approach # 2: Multifuncional AgricultureGoes for competitiveness through:
– diversification
– more ecological sound agriculture
– production of high quality standards
Enhanced by: Direct payments
Enhanced by: EARDF / 2nd pillar
39
Common Agriculture Policy (CAP)
For a long time the European Common Agriculture Policy only supported cost- reduction by improving productivity – regardless of the damages to rural areas.
approx. 80% of all agricultural payments go into the 1st pillar
40
1st pillar of the CAPuntil 1992:
- price support, export subsidies, storage, destruction ….
since 1992:
- price compensation for formerly price supported products
since 2005:
- decoupled direct payments,
cross compliance ( obey the laws, mulch once every 2 years)
Where is the service in return for the society?
41
EU policy is changing
For more than 10 years now a new idea is spreading in Brussels:
the policy for rural development (2nd pillar of the CAP)
approx. 20% of all agricultural payments
go into the 2nd pillar
42
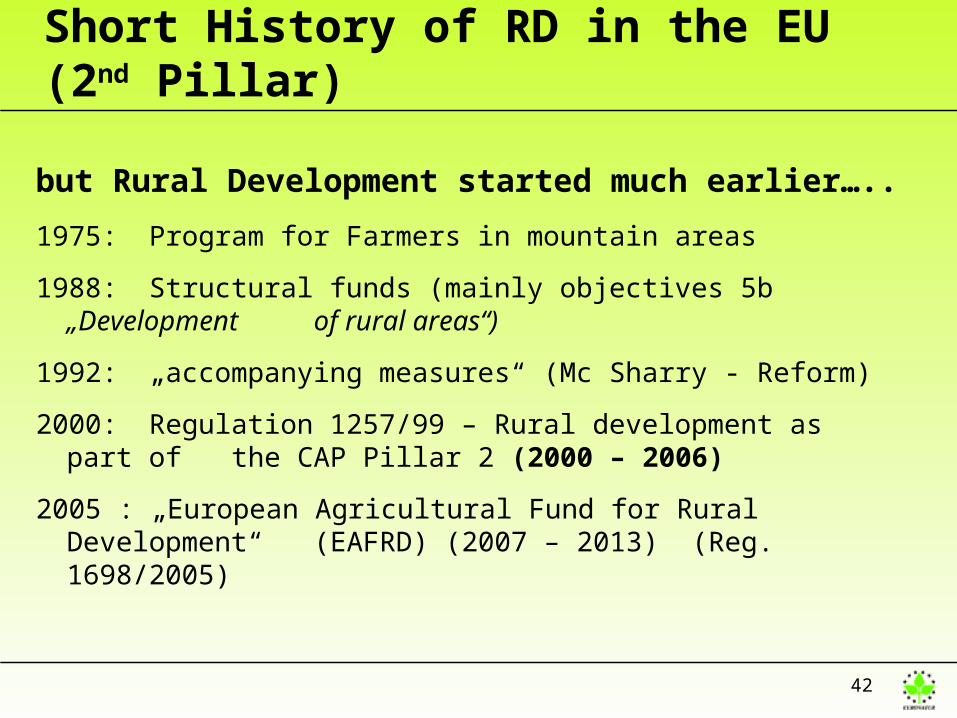
Short History of RD in the EU (2nd Pillar)
but Rural Development started much earlier…..
1975: Program for Farmers in mountain areas
1988: Structural funds (mainly objectives 5b „Development of rural areas“)
1992: „accompanying measures“ (Mc Sharry - Reform)
2000: Regulation 1257/99 – Rural development as part of the CAP Pillar 2 (2000 – 2006)
2005 : „European Agricultural Fund for Rural Development“ (EAFRD) (2007 – 2013) (Reg. 1698/2005)

43
Initial Situation in the EU Commissioner Fischer-Boel: 2nd pillar is
“agriculture’s life insurance“
Mr. Borchardt (deputy director of Fischer- Boel´s cabinet): The 1st pillar will not create new jobs but the 2nd pillar will.
EU promised: 2nd pillar is the “future”, we will strengthen it.
44
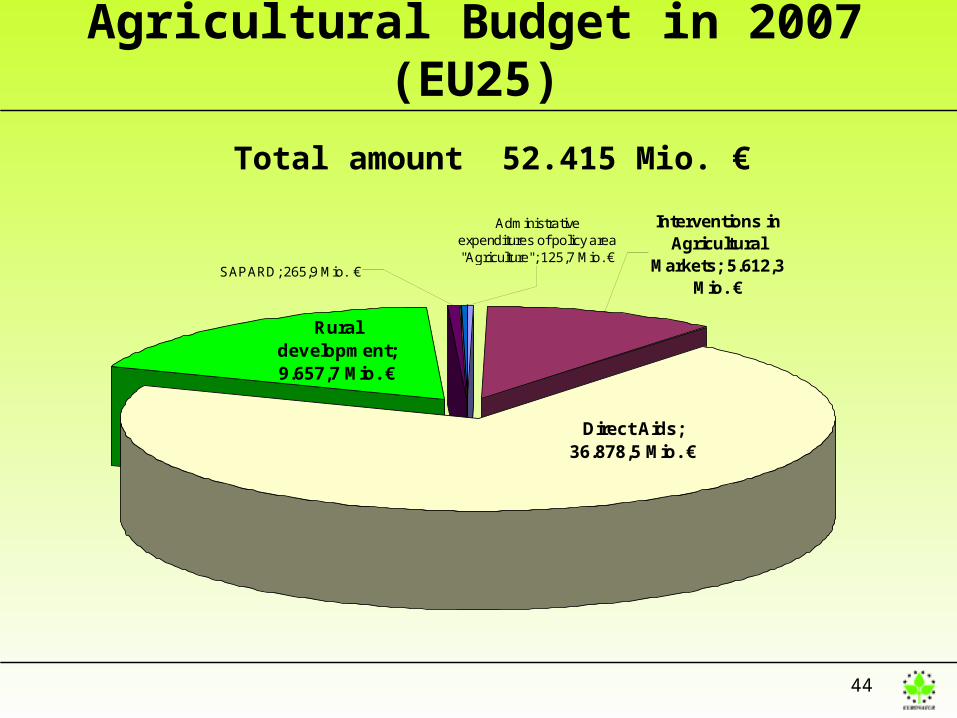
Agricultural Budget in 2007 (EU25)
Total amount 52.415 Mio. €
Rural development; 9.657,7 Mio. €
SAPARD; 265,9 Mio. €
Administrative expenditures of policy area "Agriculture"; 125,7 Mio. €
Interventions in Agricultural
Markets; 5.612,3 Mio. €
Direct Aids; 36.878,5 Mio. €
45
The responsible politicians in Brussels are in favor of the Rural Development (EAFRD)
but ….
the budget 2007 – 2013 shows a different reality
48
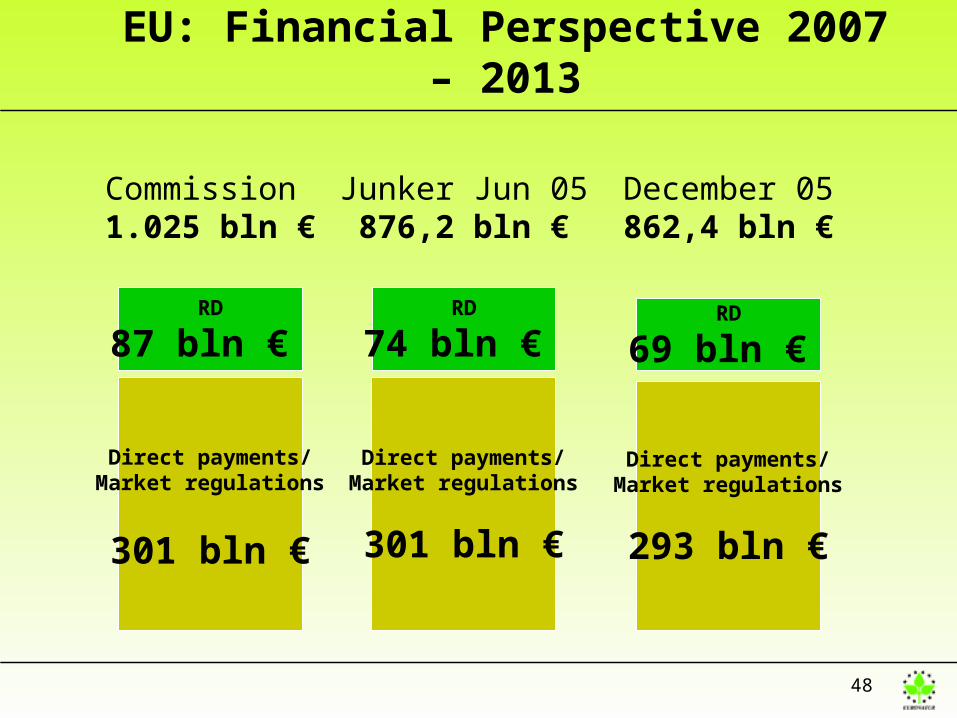
Commission 1.025 bln €
Direct payments/Market regulations
301 bln €
RD
87 bln €
EU: Financial Perspective 2007 – 2013
Junker Jun 05876,2 bln €
Direct payments/Market regulations
301 bln €
RD
74 bln €
December 05862,4 bln €
Direct payments/Market regulations
293 bln €
RD
69 bln €

49
RD-expenditures according to the agreement of the European council (12/2005)
69 bln €
36 bln €
33 bln €
EU10 + 2(2007 - 2013)
EU15(2007 – 2013)
5.1 bln €
4.7 bln €
EU25 + 2(2007 – 2013)
EU10 + 2(annual)
EU15(annual)
7.8 bln €
EU15(2005)
The expenditures of EU15-states will be cut back by 30%.

50
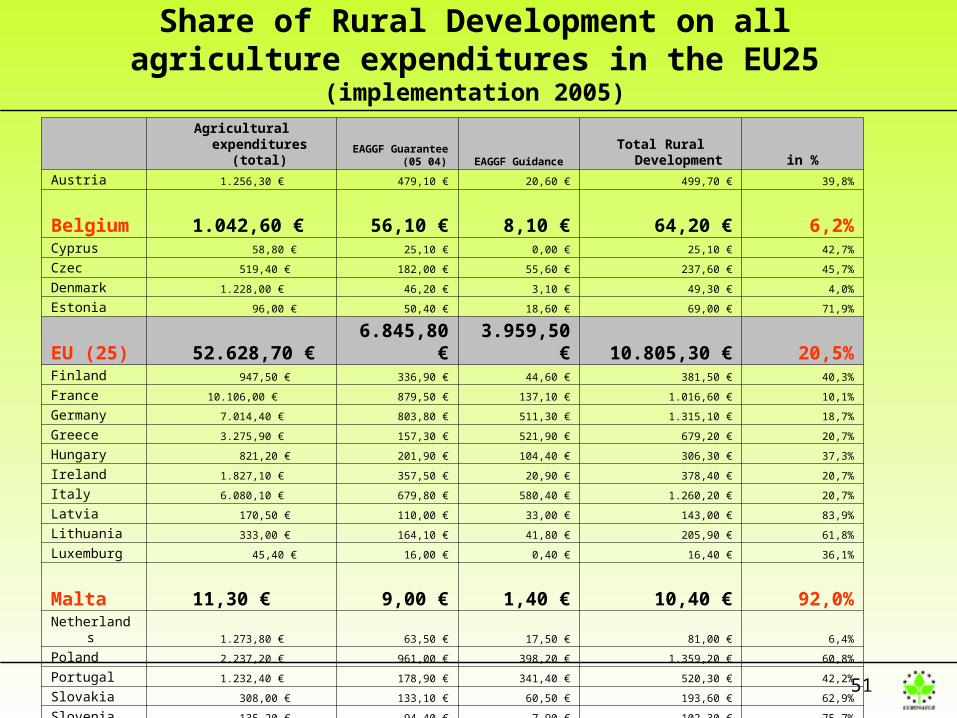
Share of Rural Development on all agriculture expenditures in the EU25 (implementation 2005)
Agricultural expenditures
(total) EAGGF Guarantee
(05 04) EAGGF Guidance
Total Rural Development in %
Austria 1.256,30 € 479,10 € 20,60 € 499,70 € 39,8%
Belgium 1.042,60 € 56,10 € 8,10 € 64,20 € 6,2%
Cyprus 58,80 € 25,10 € 0,00 € 25,10 € 42,7%
Czec 519,40 € 182,00 € 55,60 € 237,60 € 45,7%
Denmark 1.228,00 € 46,20 € 3,10 € 49,30 € 4,0%
Estonia 96,00 € 50,40 € 18,60 € 69,00 € 71,9%
EU (25) 52.628,70 € 6.845,80 € 3.959,50 € 10.805,30 € 20,5%Finland 947,50 € 336,90 € 44,60 € 381,50 € 40,3%
France 10.106,00 € 879,50 € 137,10 € 1.016,60 € 10,1%
Germany 7.014,40 € 803,80 € 511,30 € 1.315,10 € 18,7%
Greece 3.275,90 € 157,30 € 521,90 € 679,20 € 20,7%
Hungary 821,20 € 201,90 € 104,40 € 306,30 € 37,3%
Ireland 1.827,10 € 357,50 € 20,90 € 378,40 € 20,7%
Italy 6.080,10 € 679,80 € 580,40 € 1.260,20 € 20,7%
Latvia 170,50 € 110,00 € 33,00 € 143,00 € 83,9%
Lithuania 333,00 € 164,10 € 41,80 € 205,90 € 61,8%
Luxemburg 45,40 € 16,00 € 0,40 € 16,40 € 36,1%
Malta 11,30 € 9,00 € 1,40 € 10,40 € 92,0%
Netherlands 1.273,80 € 63,50 € 17,50 € 81,00 € 6,4%
Poland 2.237,20 € 961,00 € 398,20 € 1.359,20 € 60,8%
Portugal 1.232,40 € 178,90 € 341,40 € 520,30 € 42,2%
Slovakia 308,00 € 133,10 € 60,50 € 193,60 € 62,9%
Slovenia 135,20 € 94,40 € 7,90 € 102,30 € 75,7%
Spain 7.341,70 € 533,90 € 935,20 € 1.469,10 € 20,0%
Sweden 981,20 € 170,70 € 24,90 € 195,60 € 19,9%
UK 4.285,70 € 155,60 € 70,70 € 226,30 € 5,3%
51
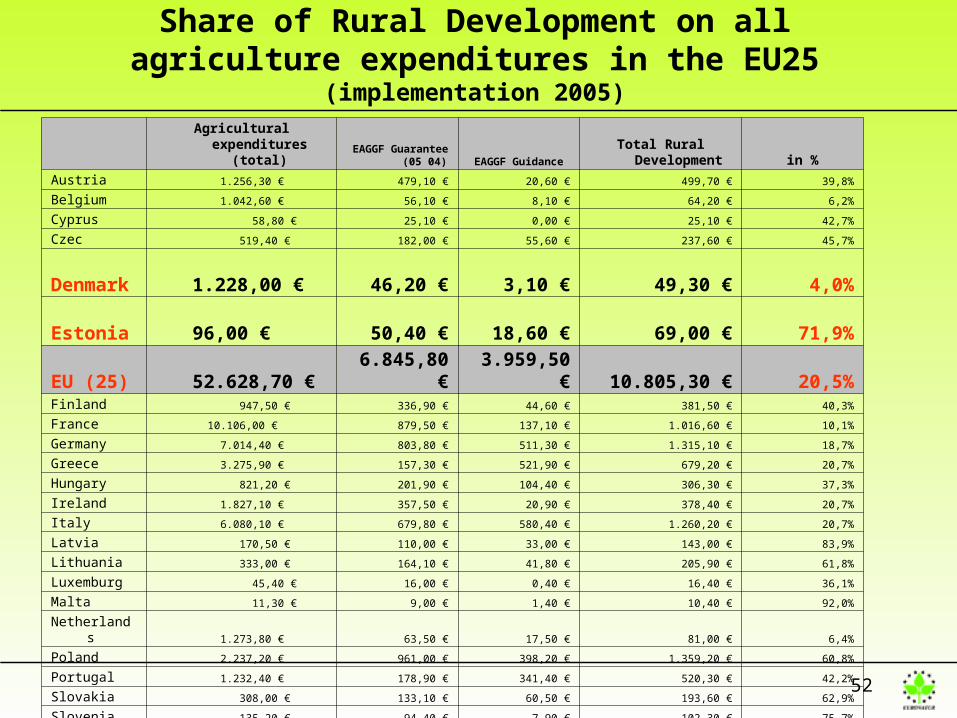
Share of Rural Development on all agriculture expenditures in the EU25 (implementation 2005)
Agricultural expenditures
(total) EAGGF Guarantee
(05 04) EAGGF Guidance
Total Rural Development in %
Austria 1.256,30 € 479,10 € 20,60 € 499,70 € 39,8%
Belgium 1.042,60 € 56,10 € 8,10 € 64,20 € 6,2%Cyprus 58,80 € 25,10 € 0,00 € 25,10 € 42,7%
Czec 519,40 € 182,00 € 55,60 € 237,60 € 45,7%
Denmark 1.228,00 € 46,20 € 3,10 € 49,30 € 4,0%
Estonia 96,00 € 50,40 € 18,60 € 69,00 € 71,9%
EU (25) 52.628,70 € 6.845,80 € 3.959,50 € 10.805,30 € 20,5%Finland 947,50 € 336,90 € 44,60 € 381,50 € 40,3%
France 10.106,00 € 879,50 € 137,10 € 1.016,60 € 10,1%
Germany 7.014,40 € 803,80 € 511,30 € 1.315,10 € 18,7%
Greece 3.275,90 € 157,30 € 521,90 € 679,20 € 20,7%
Hungary 821,20 € 201,90 € 104,40 € 306,30 € 37,3%
Ireland 1.827,10 € 357,50 € 20,90 € 378,40 € 20,7%
Italy 6.080,10 € 679,80 € 580,40 € 1.260,20 € 20,7%
Latvia 170,50 € 110,00 € 33,00 € 143,00 € 83,9%
Lithuania 333,00 € 164,10 € 41,80 € 205,90 € 61,8%
Luxemburg 45,40 € 16,00 € 0,40 € 16,40 € 36,1%
Malta 11,30 € 9,00 € 1,40 € 10,40 € 92,0%Netherlands 1.273,80 € 63,50 € 17,50 € 81,00 € 6,4%
Poland 2.237,20 € 961,00 € 398,20 € 1.359,20 € 60,8%
Portugal 1.232,40 € 178,90 € 341,40 € 520,30 € 42,2%
Slovakia 308,00 € 133,10 € 60,50 € 193,60 € 62,9%
Slovenia 135,20 € 94,40 € 7,90 € 102,30 € 75,7%
Spain 7.341,70 € 533,90 € 935,20 € 1.469,10 € 20,0%
Sweden 981,20 € 170,70 € 24,90 € 195,60 € 19,9%
UK 4.285,70 € 155,60 € 70,70 € 226,30 € 5,3%
52
Share of Rural Development on all agriculture expenditures in the EU25 (implementation 2005)
Agricultural expenditures
(total) EAGGF Guarantee
(05 04) EAGGF Guidance
Total Rural Development in %
Austria 1.256,30 € 479,10 € 20,60 € 499,70 € 39,8%
Belgium 1.042,60 € 56,10 € 8,10 € 64,20 € 6,2%
Cyprus 58,80 € 25,10 € 0,00 € 25,10 € 42,7%
Czec 519,40 € 182,00 € 55,60 € 237,60 € 45,7%
Denmark 1.228,00 € 46,20 € 3,10 € 49,30 € 4,0%
Estonia 96,00 € 50,40 € 18,60 € 69,00 € 71,9%
EU (25) 52.628,70 € 6.845,80 € 3.959,50 € 10.805,30 € 20,5%Finland 947,50 € 336,90 € 44,60 € 381,50 € 40,3%
France 10.106,00 € 879,50 € 137,10 € 1.016,60 € 10,1%
Germany 7.014,40 € 803,80 € 511,30 € 1.315,10 € 18,7%
Greece 3.275,90 € 157,30 € 521,90 € 679,20 € 20,7%
Hungary 821,20 € 201,90 € 104,40 € 306,30 € 37,3%
Ireland 1.827,10 € 357,50 € 20,90 € 378,40 € 20,7%
Italy 6.080,10 € 679,80 € 580,40 € 1.260,20 € 20,7%
Latvia 170,50 € 110,00 € 33,00 € 143,00 € 83,9%
Lithuania 333,00 € 164,10 € 41,80 € 205,90 € 61,8%
Luxemburg 45,40 € 16,00 € 0,40 € 16,40 € 36,1%
Malta 11,30 € 9,00 € 1,40 € 10,40 € 92,0%
Netherlands 1.273,80 € 63,50 € 17,50 € 81,00 € 6,4%
Poland 2.237,20 € 961,00 € 398,20 € 1.359,20 € 60,8%
Portugal 1.232,40 € 178,90 € 341,40 € 520,30 € 42,2%
Slovakia 308,00 € 133,10 € 60,50 € 193,60 € 62,9%
Slovenia 135,20 € 94,40 € 7,90 € 102,30 € 75,7%
Spain 7.341,70 € 533,90 € 935,20 € 1.469,10 € 20,0%
Sweden 981,20 € 170,70 € 24,90 € 195,60 € 19,9%
UK 4.285,70 € 155,60 € 70,70 € 226,30 € 5,3%
53
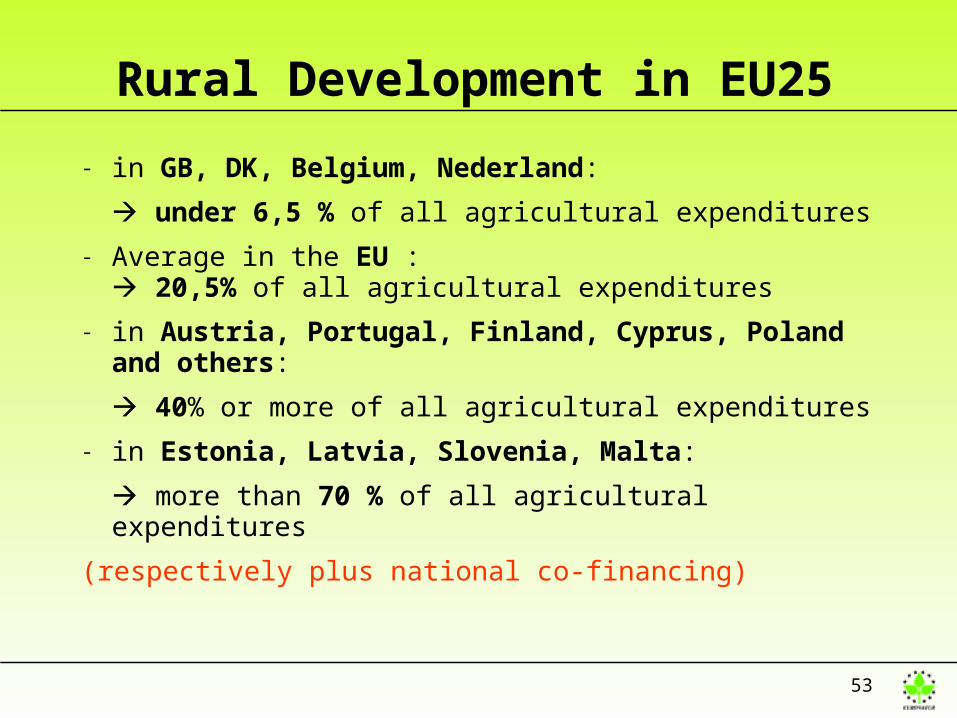
Rural Development in EU25
- in GB, DK, Belgium, Nederland:
under 6,5 % of all agricultural expenditures
- Average in the EU : 20,5% of all agricultural expenditures
- in Austria, Portugal, Finland, Cyprus, Poland and others:
40% or more of all agricultural expenditures
- in Estonia, Latvia, Slovenia, Malta:
more than 70 % of all agricultural expenditures
(respectively plus national co-financing)
54
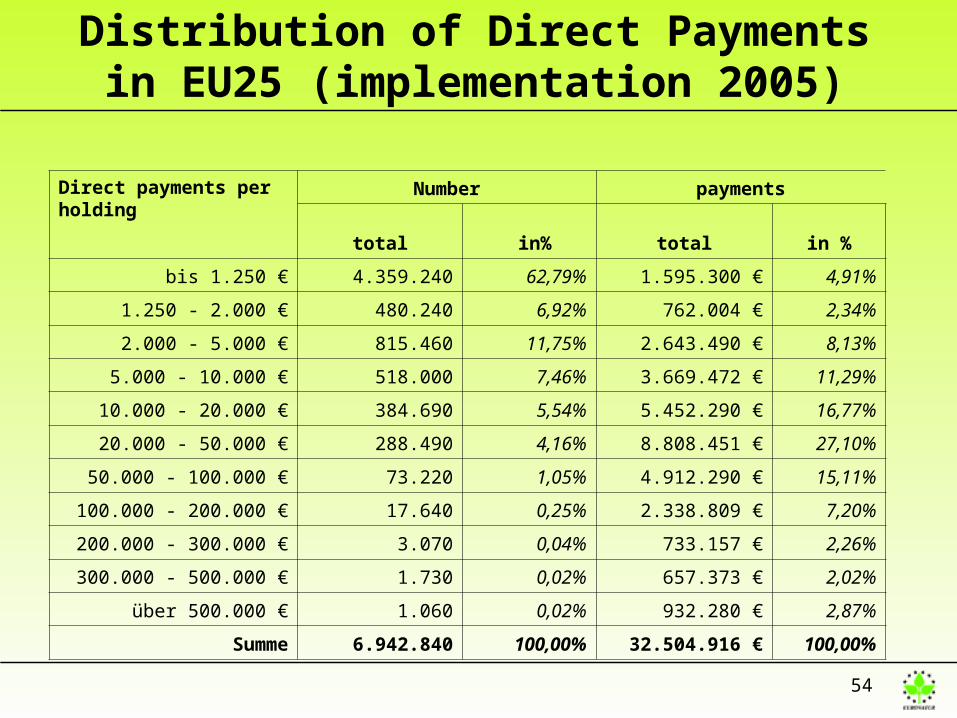
Distribution of Direct Payments in EU25 (implementation 2005)
Direct payments per holding
Number payments
total in% total in %
bis 1.250 € 4.359.240 62,79% 1.595.300 € 4,91%
1.250 - 2.000 € 480.240 6,92% 762.004 € 2,34%
2.000 - 5.000 € 815.460 11,75% 2.643.490 € 8,13%
5.000 - 10.000 € 518.000 7,46% 3.669.472 € 11,29%
10.000 - 20.000 € 384.690 5,54% 5.452.290 € 16,77%
20.000 - 50.000 € 288.490 4,16% 8.808.451 € 27,10%
50.000 - 100.000 € 73.220 1,05% 4.912.290 € 15,11%
100.000 - 200.000 € 17.640 0,25% 2.338.809 € 7,20%
200.000 - 300.000 € 3.070 0,04% 733.157 € 2,26%
300.000 - 500.000 € 1.730 0,02% 657.373 € 2,02%
über 500.000 € 1.060 0,02% 932.280 € 2,87%
Summe 6.942.840 100,00% 32.504.916 € 100,00%
55
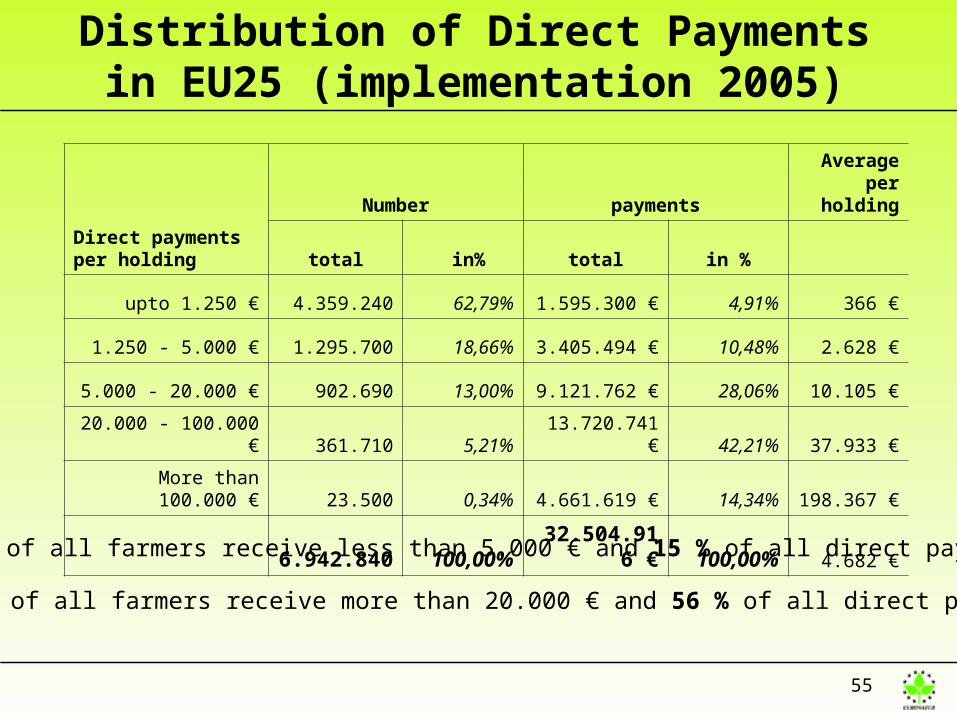
Distribution of Direct Payments in EU25 (implementation 2005)
Direct payments per holding
Number payments
Average per
holding
total in% total in %
upto 1.250 € 4.359.240 62,79% 1.595.300 € 4,91% 366 €
1.250 - 5.000 € 1.295.700 18,66% 3.405.494 € 10,48% 2.628 €
5.000 - 20.000 € 902.690 13,00% 9.121.762 € 28,06% 10.105 €
20.000 - 100.000 € 361.710 5,21% 13.720.741 € 42,21% 37.933 €
More than 100.000 € 23.500 0,34% 4.661.619 € 14,34% 198.367 €
6.942.840 100,00% 32.504.916 € 100,00% 4.682 €
81 % of all farmers receive less than 5.000 € and 15 % of all direct payments
5,6 % of all farmers receive more than 20.000 € and 56 % of all direct payments
56
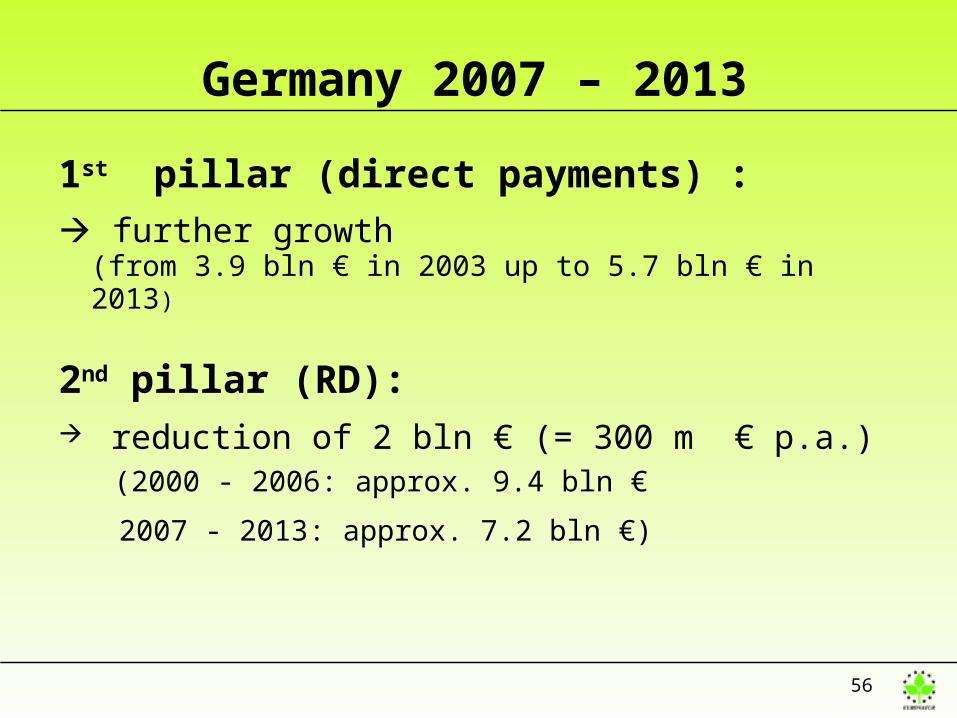
Germany 2007 – 2013
1st pillar (direct payments) :
further growth (from 3.9 bln € in 2003 up to 5.7 bln € in 2013)
2nd pillar (RD): reduction of 2 bln € (= 300 m € p.a.)
(2000 - 2006: approx. 9.4 bln €
2007 - 2013: approx. 7.2 bln €)
57
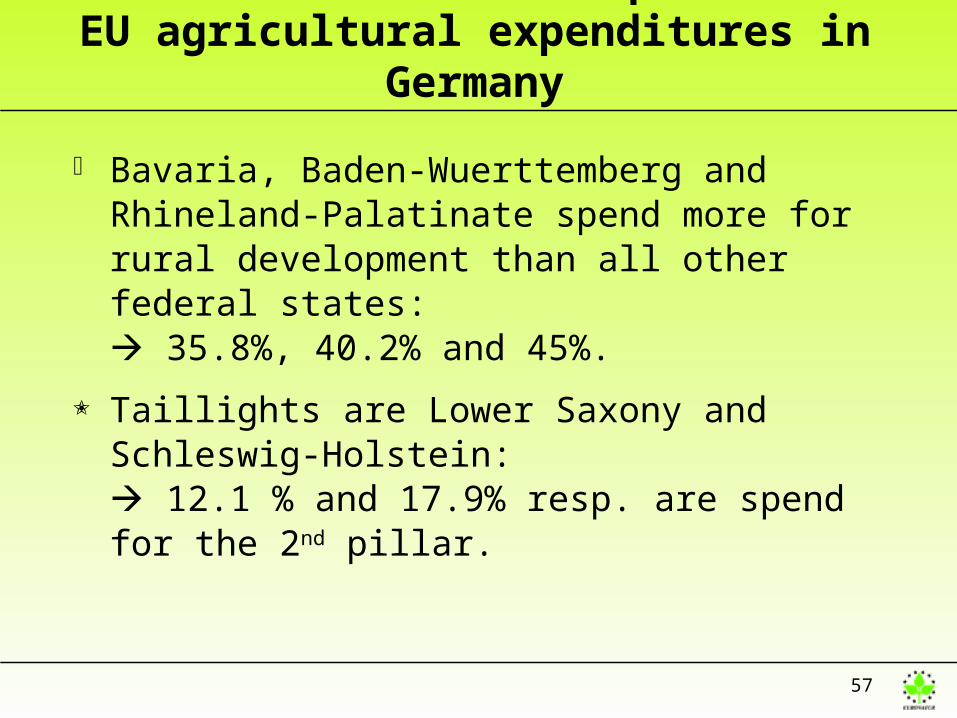
Share of rural developement of EU agricultural expenditures in Germany
Bavaria, Baden-Wuerttemberg and Rhineland-Palatinate spend more for rural development than all other federal states: 35.8%, 40.2% and 45%.
Taillights are Lower Saxony and Schleswig-Holstein: 12.1 % and 17.9% resp. are spend for the 2nd pillar.
58
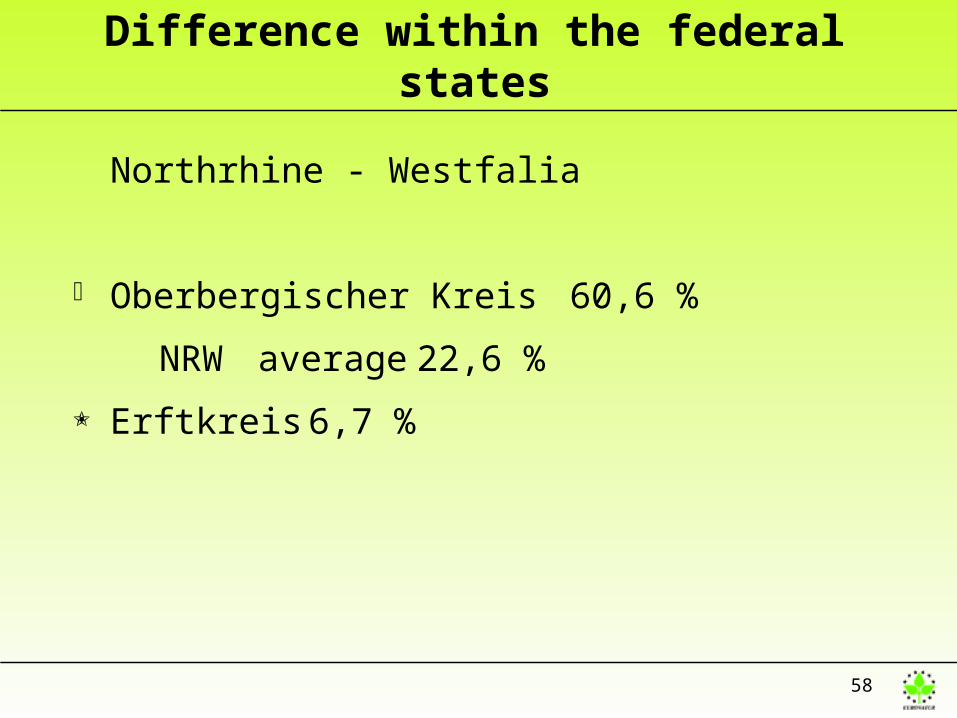
Difference within the federal states
Northrhine - Westfalia
Oberbergischer Kreis 60,6 %
NRW average 22,6 %
Erftkreis 6,7 %
59
Future Effects
- e.g. no further promotion of organic Farming (the boosting German market for eco-products will be supplied from outside)
- “nature protection by contract “, NATURA 2000 etc. financial disaster
- big farms in privileged areas will profit most
- farms in marginalized regions will loose
60
How to Balance
The heads of states and governments proposed to shift money from 1st to 2nd pillar
the so called: „facultative modulation“
– Maximum share: 20% of 1st pillar
– No national co-financing needed
61
Reactions
- Representatives of German Ministry stress the importance of direct payments for farmers’ income
Who benefits of these direct payments?
Is the 2nd pillar less important for income?
- Farmers need planning reliability.
„Planning reliability“ only for those farmers who benefited in the past?
No planning reliability for the 2nd pillar ?
62
Reality in 2007
Implementation of the facultative modulation only in UK and Portugal
…. but ….
obligatory modulation is discussed now, as a possible option for 2008 / 2009 (Health Check) resp. 2013 (End of current GAP).
63
Crucial Question: Where to cut?
Direct payments (very little public acceptance) for a few big farmers who already have cost benefits due to there farm structure (keyword: degression of costs)
or
Rural development (2nd pillar) which rewards farmers generating real services to the public (distribution to many farmers)

68
Politics in the EU
Many politicians focus on– cost leadership.
– promotion of big farms.
– „planning reliability“ for those who made most of the profit in the past.
There is no planning reliability for the 2nd pillar.
There is only hope for better times