Embed Size (px)
Citation preview
1
OPSM 405 Service Management
Class 9:
Service System Design Tools:
Service Blueprinting
Conjoint Analysis
Koç University
Zeynep [email protected]
2
Service blueprinting
Activities Decision points Precedence relations Line of visibility Resources

Low complexity, high divergence

High complexity, low divergence
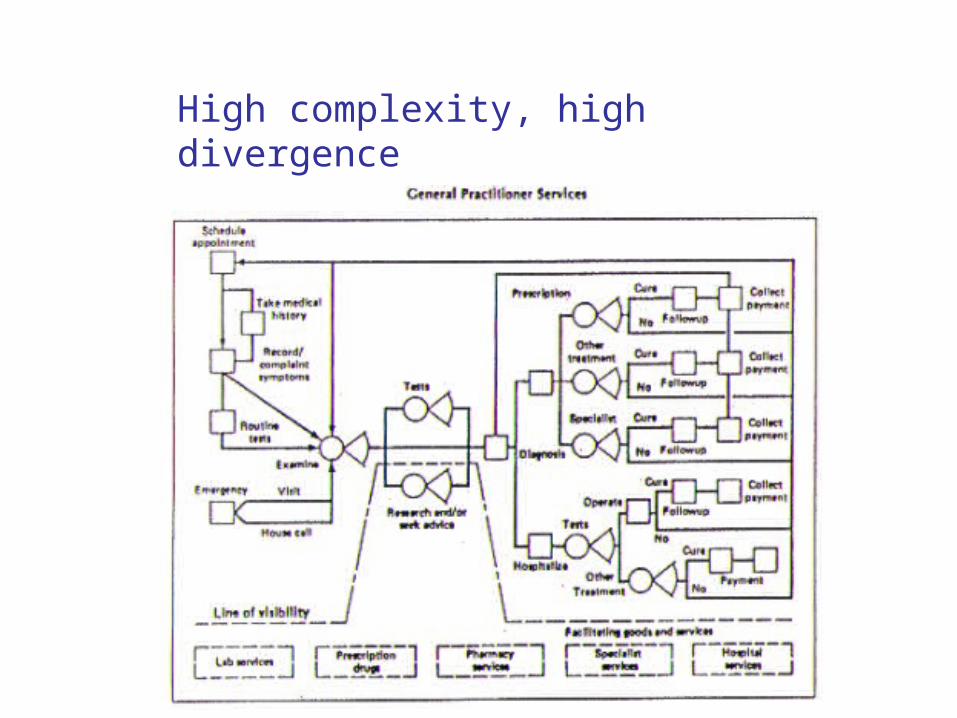
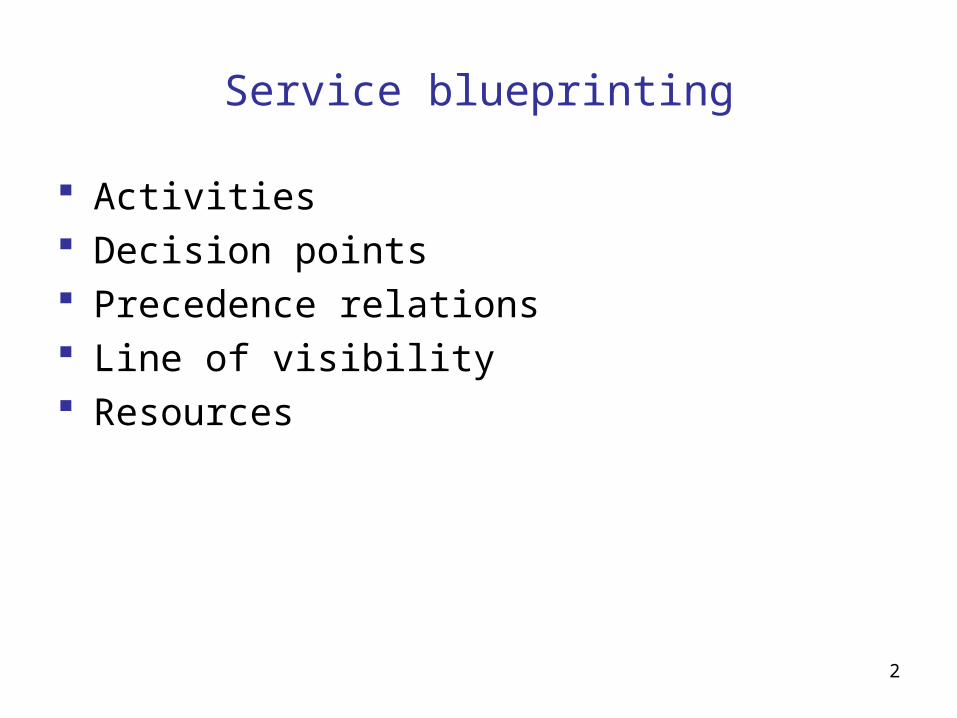
High complexity, high divergence
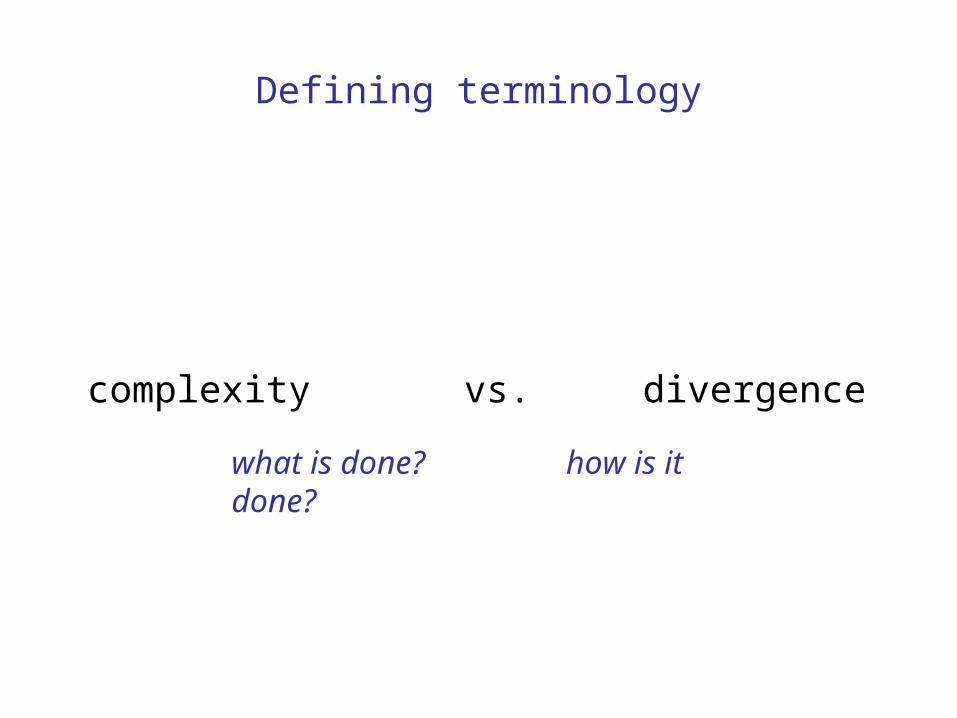
Defining terminology
complexity vs. divergence
what is done? how is it done?

Understanding the link between positioning and service structure
Structural change: reduce divergence
positioning: economies of scale
+ : perceived increase in reliability
- : conformity, inflexibility

Understanding the link between positioning and service structure
Structural change: increase divergence
positioning: niche
+ : prestige, customization, personalization
- : difficult to manage and control
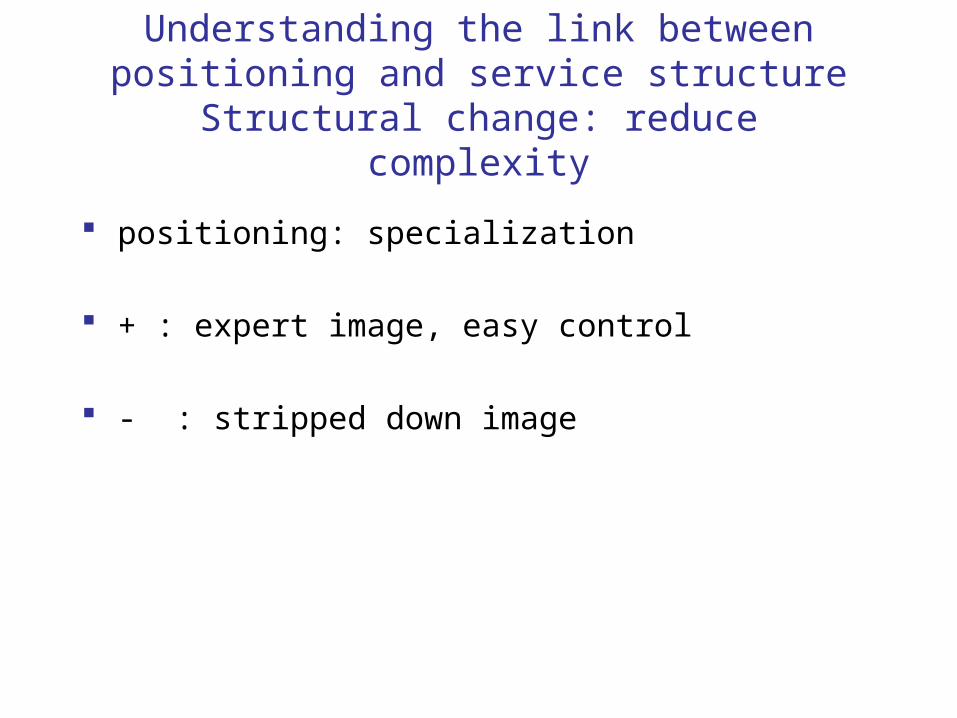
Understanding the link between positioning and service structure
Structural change: reduce complexity
positioning: specialization
+ : expert image, easy control
- : stripped down image
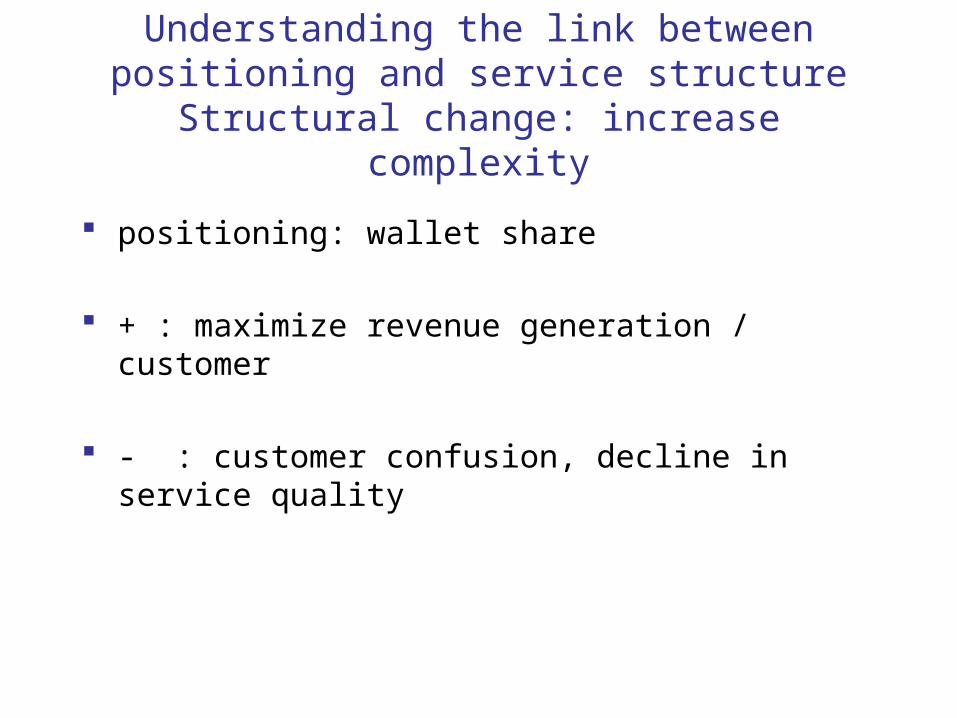
Understanding the link between positioning and service structure
Structural change: increase complexity
positioning: wallet share
+ : maximize revenue generation / customer
- : customer confusion, decline in service quality
11
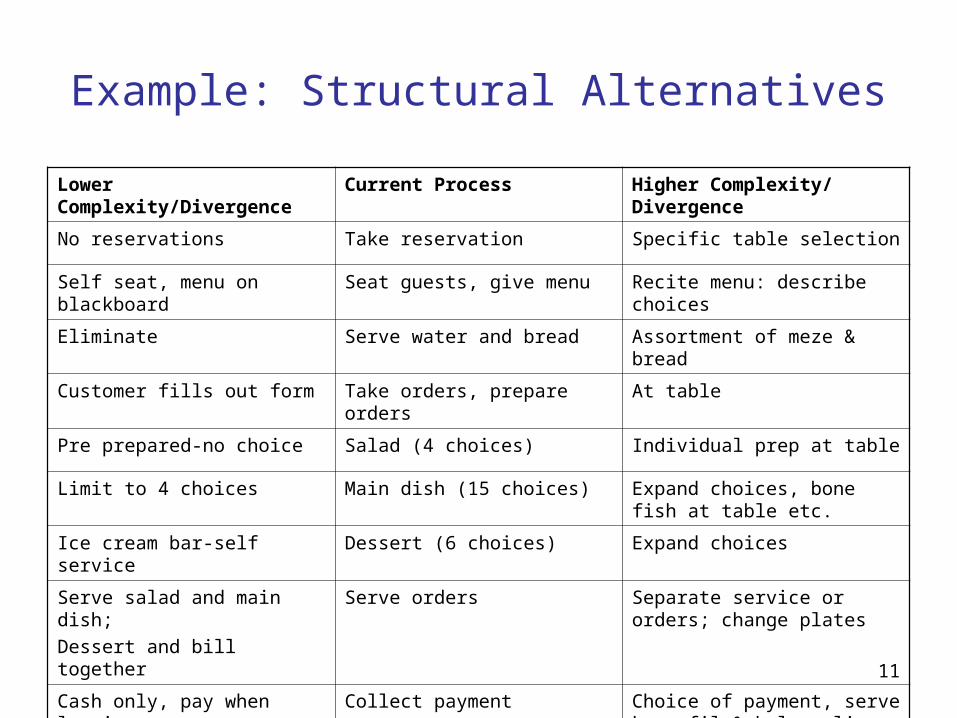
Example: Structural Alternatives
Lower Complexity/Divergence Current Process Higher Complexity/ Divergence
No reservations Take reservation Specific table selection
Self seat, menu on blackboard Seat guests, give menu Recite menu: describe choices
Eliminate Serve water and bread Assortment of meze & bread
Customer fills out form Take orders, prepare orders At table
Pre prepared-no choice Salad (4 choices) Individual prep at table
Limit to 4 choices Main dish (15 choices) Expand choices, bone fish at table etc.
Ice cream bar-self service Dessert (6 choices) Expand choices
Serve salad and main dish;
Dessert and bill together
Serve orders Separate service or orders; change plates
Cash only, pay when leaving Collect payment Choice of payment, serve karanfil & kolonyali mendil
12
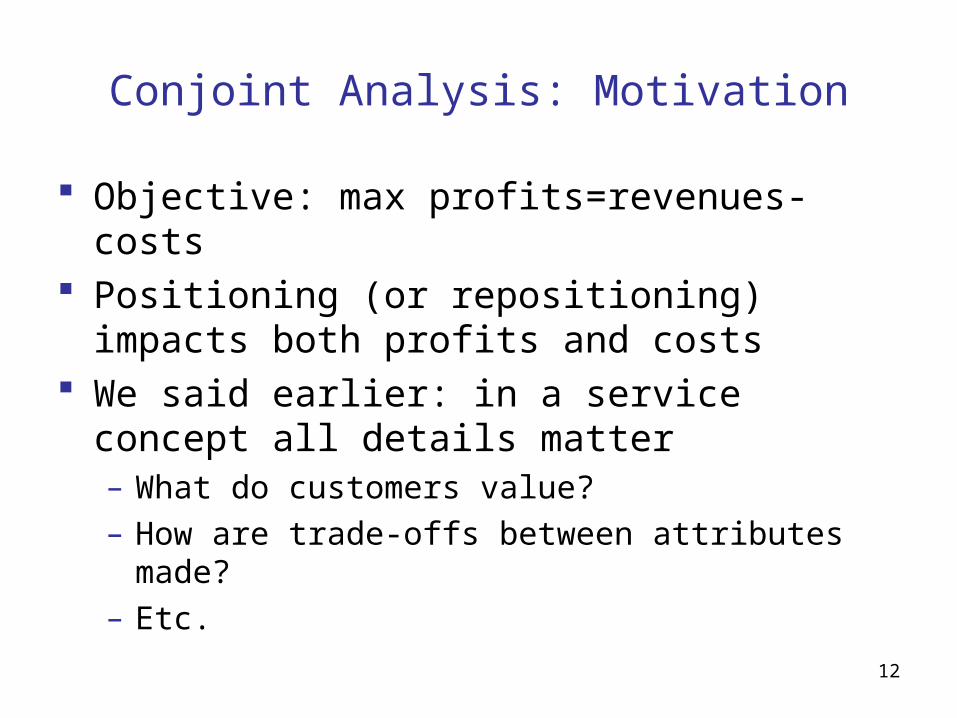
Conjoint Analysis: Motivation
Objective: max profits=revenues-costs Positioning (or repositioning) impacts both profits
and costs We said earlier: in a service concept all details
matter– What do customers value?– How are trade-offs between attributes made?– Etc.
13
Conjoint Analysis
Conjoint: joined together, combined CONsidered JOINTly

14
What’s So Good about Conjoint?
More realistic questions:
Would you prefer . . .
210 Horsepower or 140 Horsepower17 MPG 28 MPG
If choose left, you prefer Power. If choose right, you prefer Fuel Economy
Rather than ask directly whether you prefer Power over Fuel Economy, we present realistic tradeoff scenarios and infer preferences from your product choices
15
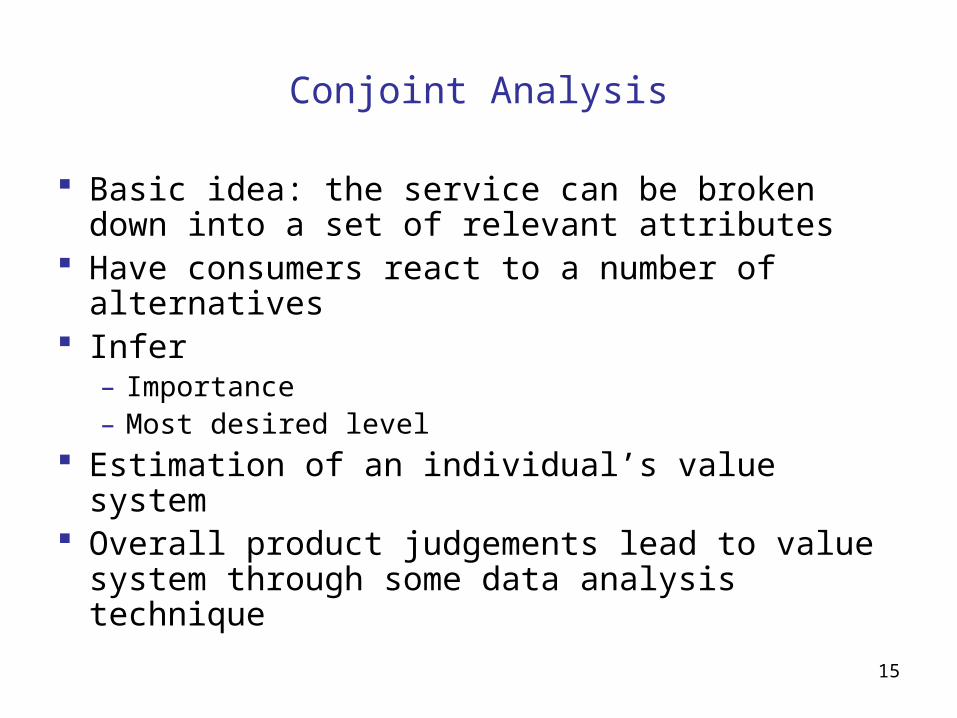
Conjoint Analysis
Basic idea: the service can be broken down into a set of relevant attributes
Have consumers react to a number of alternatives
Infer– Importance– Most desired level
Estimation of an individual’s value system Overall product judgements lead to value system
through some data analysis technique
16
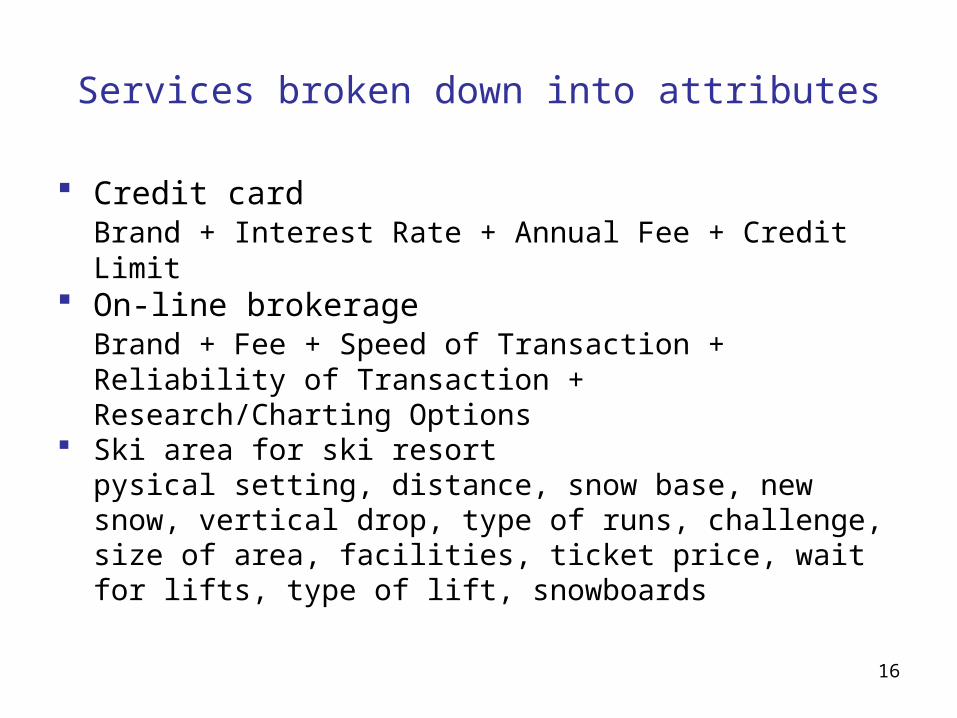
Services broken down into attributes
Credit cardBrand + Interest Rate + Annual Fee + Credit Limit
On-line brokerageBrand + Fee + Speed of Transaction + Reliability of Transaction + Research/Charting Options
Ski area for ski resortpysical setting, distance, snow base, new snow, vertical drop, type of runs, challenge, size of area, facilities, ticket price, wait for lifts, type of lift, snowboards
17
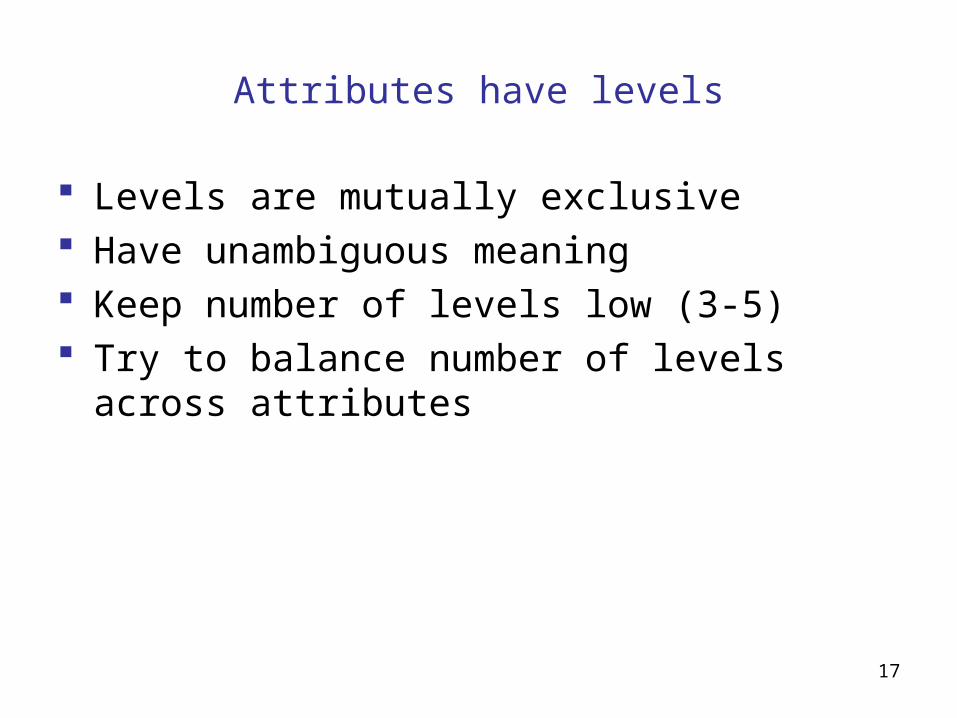
Attributes have levels
Levels are mutually exclusive Have unambiguous meaning Keep number of levels low (3-5) Try to balance number of levels across attributes
18
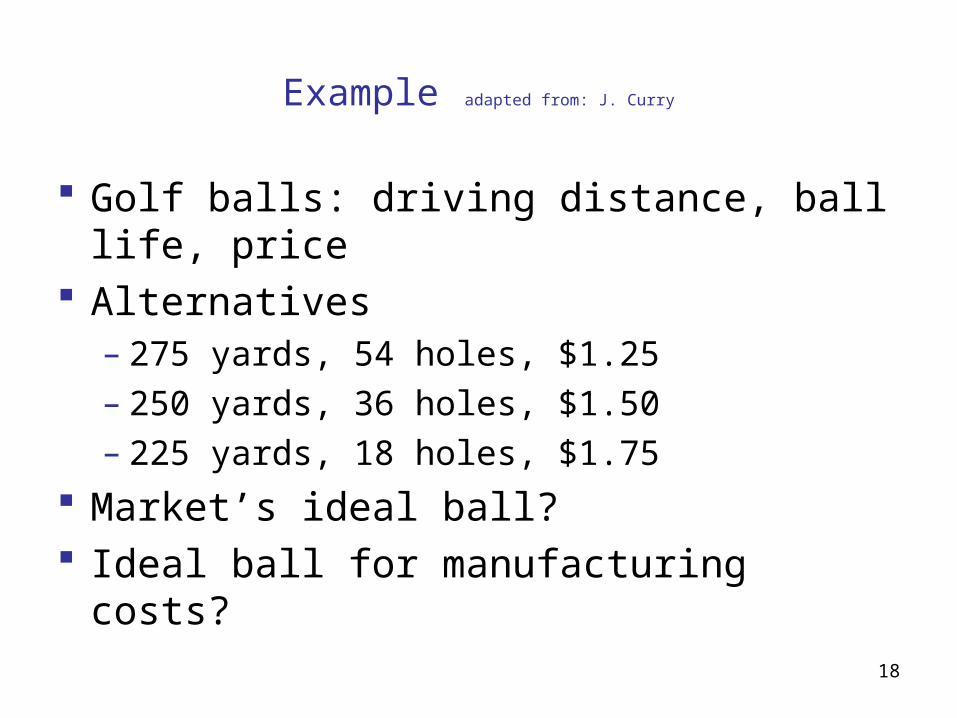
Example adapted from: J. Curry
Golf balls: driving distance, ball life, price Alternatives
– 275 yards, 54 holes, $1.25– 250 yards, 36 holes, $1.50– 225 yards, 18 holes, $1.75
Market’s ideal ball? Ideal ball for manufacturing costs?

19
Rank the balls
Distance– 275 yards Rank 1– 250 yards Rank 2– 225 yards Rank 3
Ball Life– 54 holes Rank 1– 36 holes Rank 2– 18 holes Rank 3
Doesn’t really tell us anything we didn’t know
20
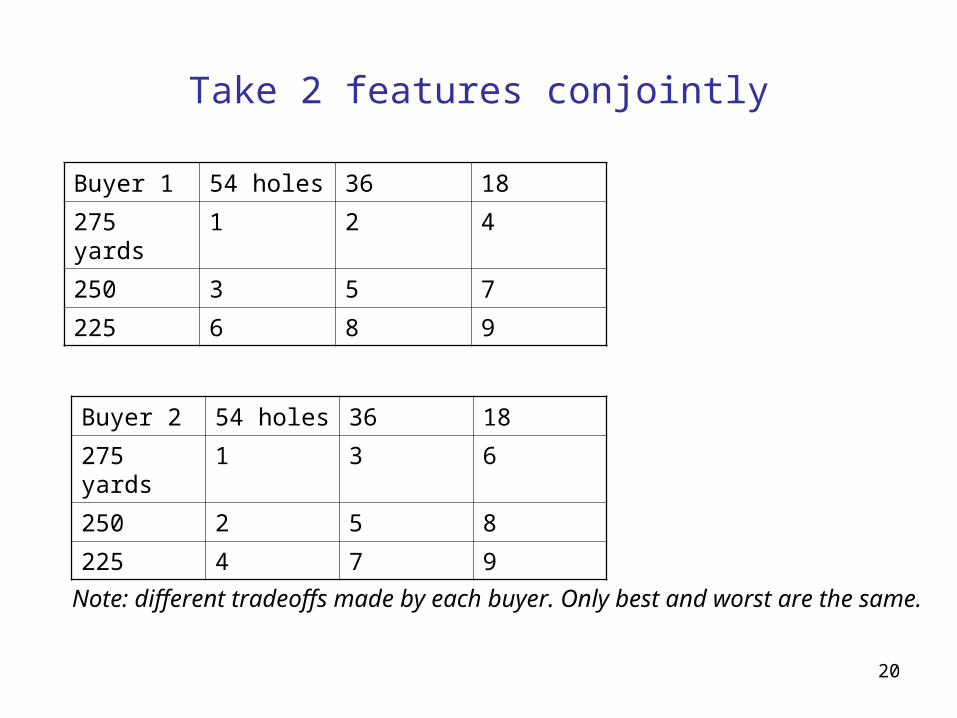
Take 2 features conjointly
Buyer 1 54 holes 36 18
275 yards 1 2 4
250 3 5 7
225 6 8 9
Buyer 2 54 holes 36 18
275 yards 1 3 6
250 2 5 8
225 4 7 9
Note: different tradeoffs made by each buyer. Only best and worst are the same.

21
Illustration by example (source: Dolan 1999)
Fitness facility design– Towel service: yes or no– Locker service
• Small storage lockers permanently assigned plus large hanging ones for daily use
• Mid-size only permanently assigned• No permanently assigned locker, large hanging
locker with mirror inside door

22
Rank from most to least preferred
Yes No
Small storage, large daily
Rank 2 Rank 4
Medium storage only
Rank 1 Rank 3
Large daily with mirror only
Rank 5 Rank 6
Towel Service
Lock
er
23
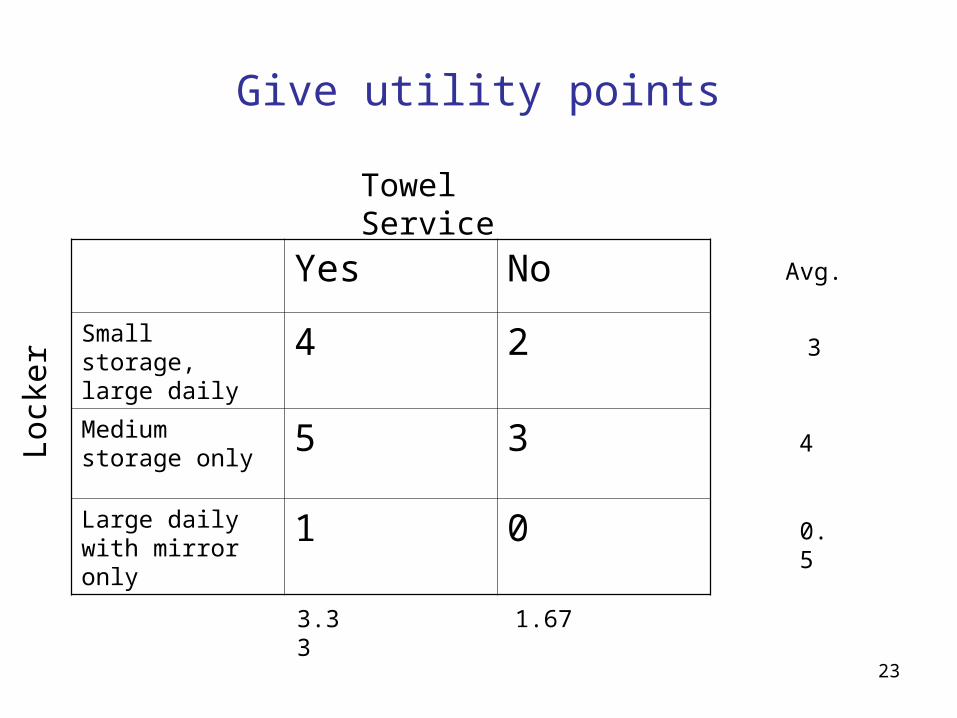
Give utility points
Yes No
Small storage, large daily
4 2
Medium storage only
5 3
Large daily with mirror only
1 0
Towel Service
Lock
er
Avg.
3
4
0.5
3.33 1.67

24
Value system
Product Value System Score
Value system score rank
Stated original rank
MSO+Towel 4+3.33=7.33 1 1
SSLD+Towel 3+3.33=6.33 2 2
MSO+No Towel
4+1.67=5.67 3 3
SSLD+No Towel
3+1.67=4.67 4 4
LDMO + Towel
.5+3.33=3.83 5 5
LDMO+ No Towel
.5+1.67=2.17 6 6
25
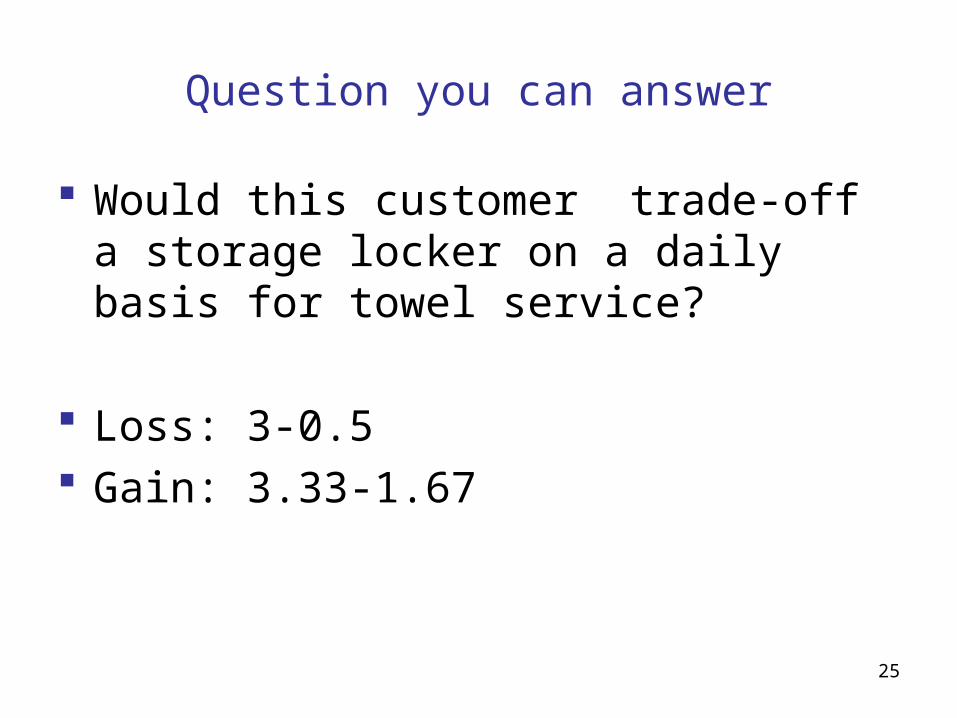
Question you can answer
Would this customer trade-off a storage locker on a daily basis for towel service?
Loss: 3-0.5 Gain: 3.33-1.67
26
In sum
Collect tradeoffs Estimate buyer value system Make choice prediction

27
Example: Output analysis (source: Montgomery and Wittink, 1979)
Business Travel<= 1 night .1632-5 nights .109>=6 nights -.273
Geographic AreaEast .070Midwest -.198South -.321West .449
Opportunity for AdvanceRapid .216Moderate -.216
Range: .436 Range: .770 Range: .432
Attribute importance for business travel:.436/(.436+.770+.432)
Importance analysis only relevant if attributes are in relevant ranges
28
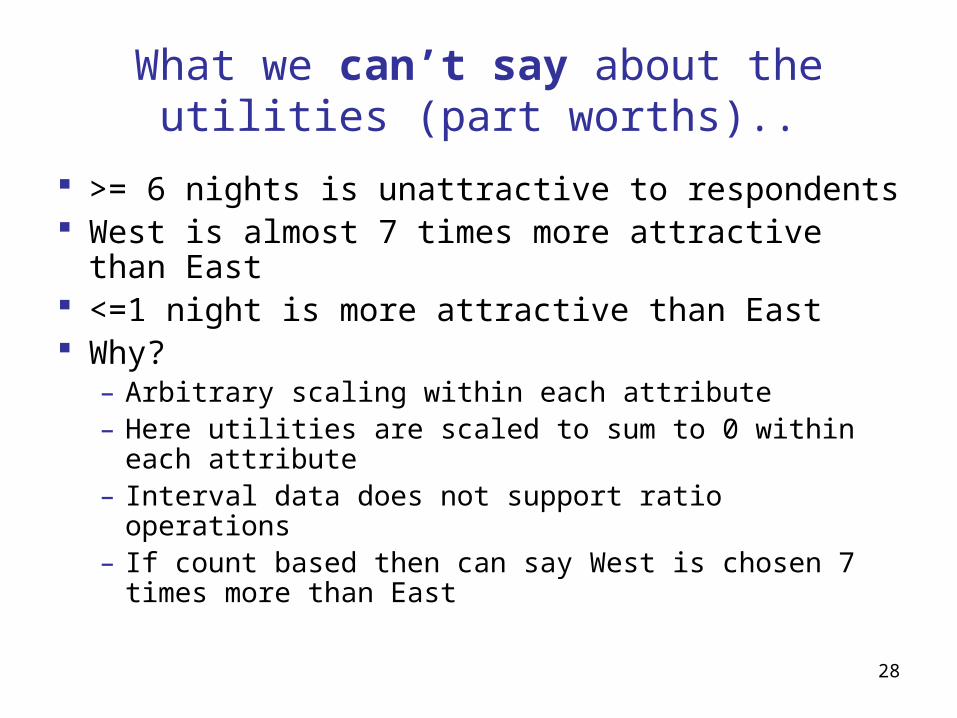
What we can’t say about the utilities (part worths)..
>= 6 nights is unattractive to respondents West is almost 7 times more attractive than East <=1 night is more attractive than East Why?
– Arbitrary scaling within each attribute– Here utilities are scaled to sum to 0 within each
attribute– Interval data does not support ratio operations– If count based then can say West is chosen 7 times
more than East
29
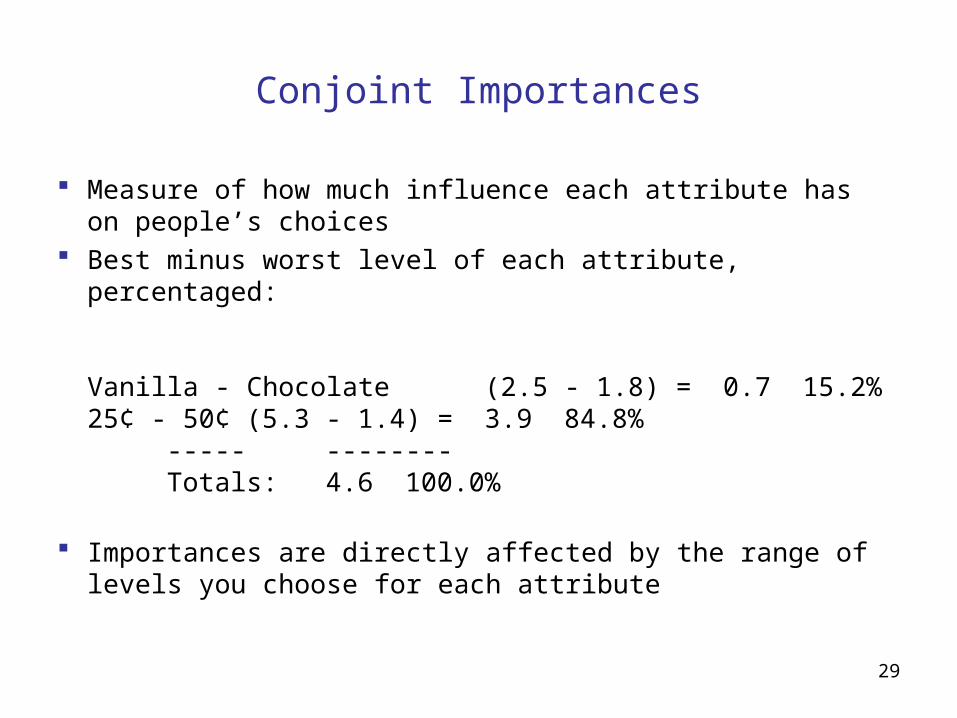
Conjoint Importances
Measure of how much influence each attribute has on people’s choices
Best minus worst level of each attribute, percentaged:
Vanilla - Chocolate (2.5 - 1.8) = 0.7 15.2%25¢ - 50¢ (5.3 - 1.4) = 3.9 84.8%
----- --------Totals: 4.6 100.0%
Importances are directly affected by the range of levels you choose for each attribute

30
Output analysis: PC Example (source Dolan)
Weight<= 2 lbs 1.22-5 lbs .9>5lbs 0.0
BatteryLife1 hr 0.02hrs 0.24hrs 1.58hrs 1.5
ResolutionBelow avg 0.0Avg. .4Above avg. .5
Price1000 1.02000 0.53000 0.0
Product A: 2 lbs 1hr below average 2000Product B: 5 lbs 4hrs average 3000ProductC: >5lbs 8 hrs average 1000
Value of A= 1.2+0+0+0.5=1.7Value of B = 1.9Value of C = 3.0Sum = 6.6
Share of preference approach:Prob. of choosing A: 1.7/6.6=26%Prob of choosing B: 1.9/6.6=29%Prob. of choosing C: 3.0/6.6=45%
Market share: average purchase probability across all subjects
31
Output analysis
Aggregate analysis Segmentation analysis Scenario simulations
32
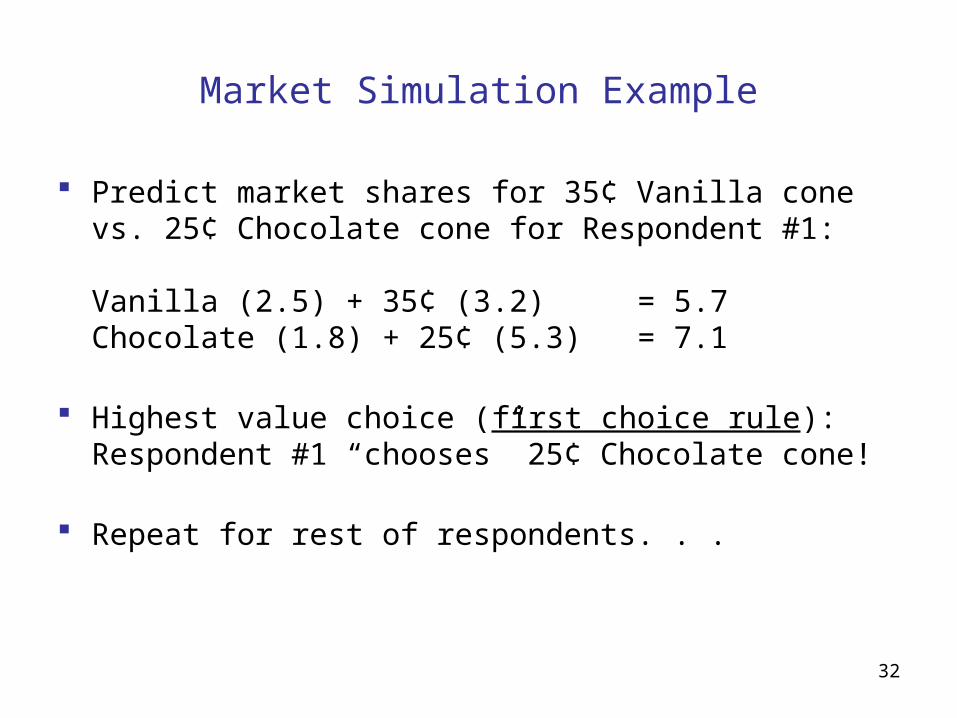
Market Simulation Example
Predict market shares for 35¢ Vanilla cone vs. 25¢ Chocolate cone for Respondent #1:
Vanilla (2.5) + 35¢ (3.2) = 5.7Chocolate (1.8) + 25¢ (5.3) = 7.1
Highest value choice (first choice rule): Respondent #1 “chooses” 25¢ Chocolate cone!
Repeat for rest of respondents. . .
33
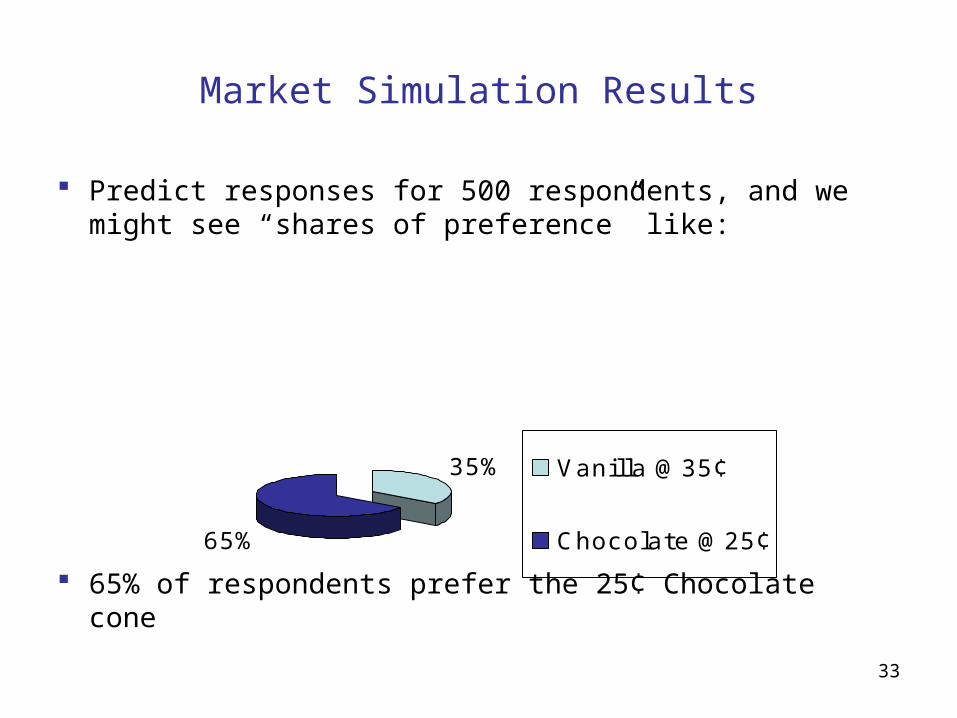
Market Simulation Results
Predict responses for 500 respondents, and we might see “shares of preference” like:
65% of respondents prefer the 25¢ Chocolate cone
35%
65%
Vanilla @ 35¢
Chocolate @ 25¢

34
Example source: sawtoothsoftware
9 cards, ranked by 2 volunteers Copy of Excel spreadsheet available from
course web site

35
Traditional Conjoint Designs
Full profile: each service concept is defined using all attributes being studied
Full factorial: a design in which all possible product combinations are shown
Fractional Factorial: a fraction of the full factorial that permits efficient estimation of the parameters of interest)– From design catalogs– From software programs
36
Study design
Step 1: determine relevant attributes Step 2: choose stimulus representations (how
products will be described to respondents, full or partial)
Step 3: Choose response type (choice, ranking, rating)
Step 4: Choose criterion (liking, preference, likelihood of purchase)
Step 5: Choose method of data analysis
37
Summary
Blueprints for documentation Analyze for complexity & divergence for
positioning Understand links between positioning and costs
(service delivery system) Conjoint analysis to assess customer valuations Use output from conjoint analysis to link
valuation, purchase, aggregate market share and profitability
38
Next time
Will continue Conjoint Analysis Class will be held in the computer lab SOS Z13 Be on-time! Counts as in-class activity. Will practice doing conjoint analysis via
regression using Excel