Embed Size (px)
Citation preview
1
November 16, 2010
National Business Coalition on Health
A Data Driven, Employer Focused Value Based Health Strategy
Initiative
Presentation Sponsored by Pfizer
2
Empowering the EmployerEmpowering the Employer
William L. BruningPresident & CEO, Mid-America Coalition on Health Care
Douglas TappVice President, Total RewardsH&R BlockChairman - Board of Directors, Mid-America
Coalition on Health Care
3
Presentation FocusPresentation Focus
Background on the Kansas City Collaborative (KC2) initiative and its key partners
Introduce the American Health Strategy Project
Identify some of the VBB interventions that several employers are currently implementing
4
Mid-America Coalition on Health CareMid-America Coalition on Health Care
Improve the health of employees and their families
Promote employee and community wellness
Develop strategies for containing health care costs
Serve as a community resource in generating and communicating health care information
Over 30 years of collaboration toward incremental, Over 30 years of collaboration toward incremental, sustainable, and replicable change in health caresustainable, and replicable change in health care
Over 30 years of collaboration toward incremental, Over 30 years of collaboration toward incremental, sustainable, and replicable change in health caresustainable, and replicable change in health care
Mission:Mission:Mission:Mission:
5
Mid-America Coalition on Health CareMid-America Coalition on Health Care
Who We Are:Who We Are:Who We Are:Who We Are:
Founded: 1978 Established as a 501(c)(3)Founded: 1978 Established as a 501(c)(3)Founded: 1978 Established as a 501(c)(3)Founded: 1978 Established as a 501(c)(3)
Bi-State
60 members – 500,000 lives
Board of employers and all regional stakeholders
Budget $500,000 – split between dues and donations
4 employees
Fourth oldest employer Coalition in the nation
6
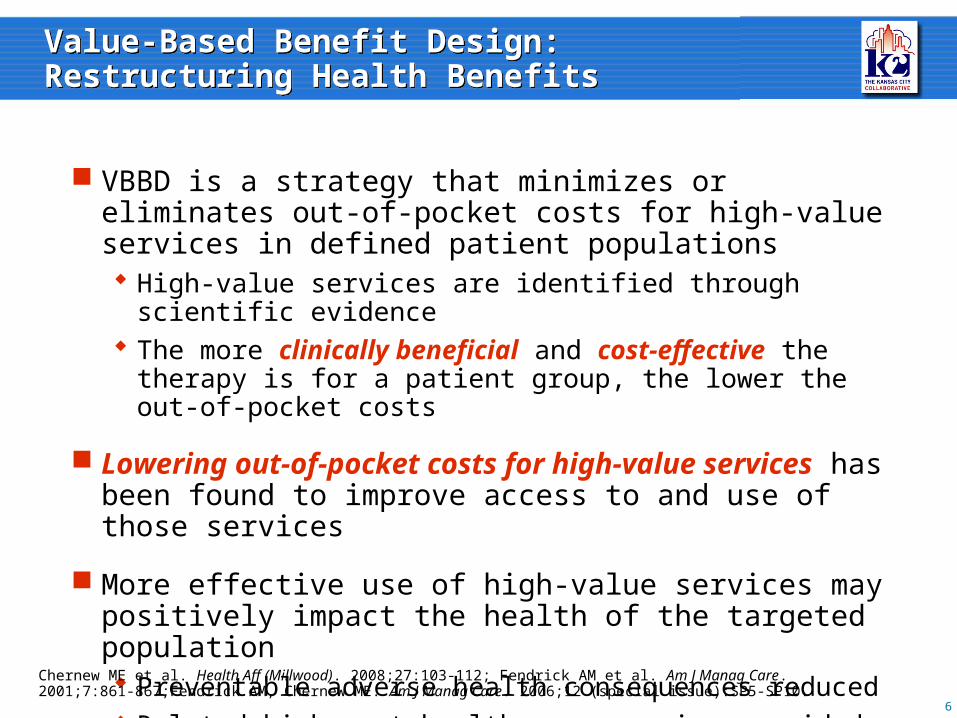
Value-Based Benefit Design: Restructuring Health BenefitsValue-Based Benefit Design: Restructuring Health Benefits
VBBD is a strategy that minimizes or eliminates out-of-pocket costs for high-value services in defined patient populations High-value services are identified through scientific evidence The more clinically beneficial and cost-effective the therapy is
for a patient group, the lower the out-of-pocket costs
Lowering out-of-pocket costs for high-value services has been found to improve access to and use of those services
More effective use of high-value services may positively impact the health of the targeted population Preventable adverse health consequences reduced Related high-cost health care services avoided
Chernew ME et al. Health Aff (Millwood). 2008;27:103-112; Fendrick AM et al. Am J Manag Care. 2001;7:861-867;Fendrick AM, Chernew ME. Am J Manag Care. 2006;12 (special issue):SP5-SP10.
7
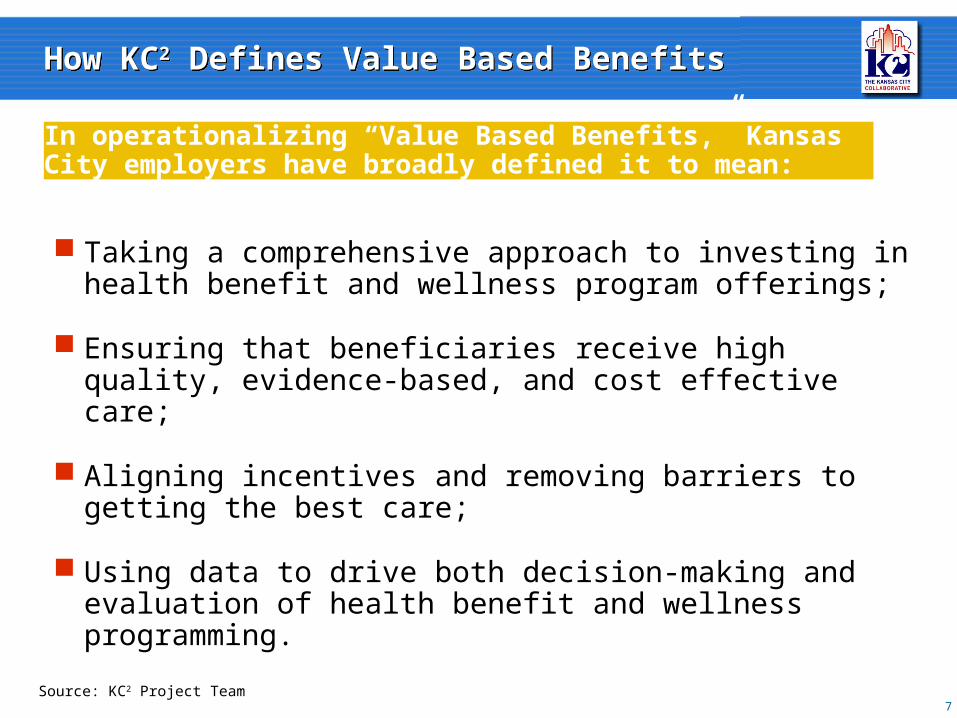
How KC2 Defines Value Based BenefitsHow KC2 Defines Value Based Benefits
Taking a comprehensive approach to investing in health benefit and wellness program offerings;
Ensuring that beneficiaries receive high quality, evidence-based, and cost effective care;
Aligning incentives and removing barriers to getting the best care;
Using data to drive both decision-making and evaluation of health benefit and wellness programming.
In operationalizing “Value Based Benefits,” Kansas City employers have broadly defined it to mean:
Source: KC2 Project Team
8
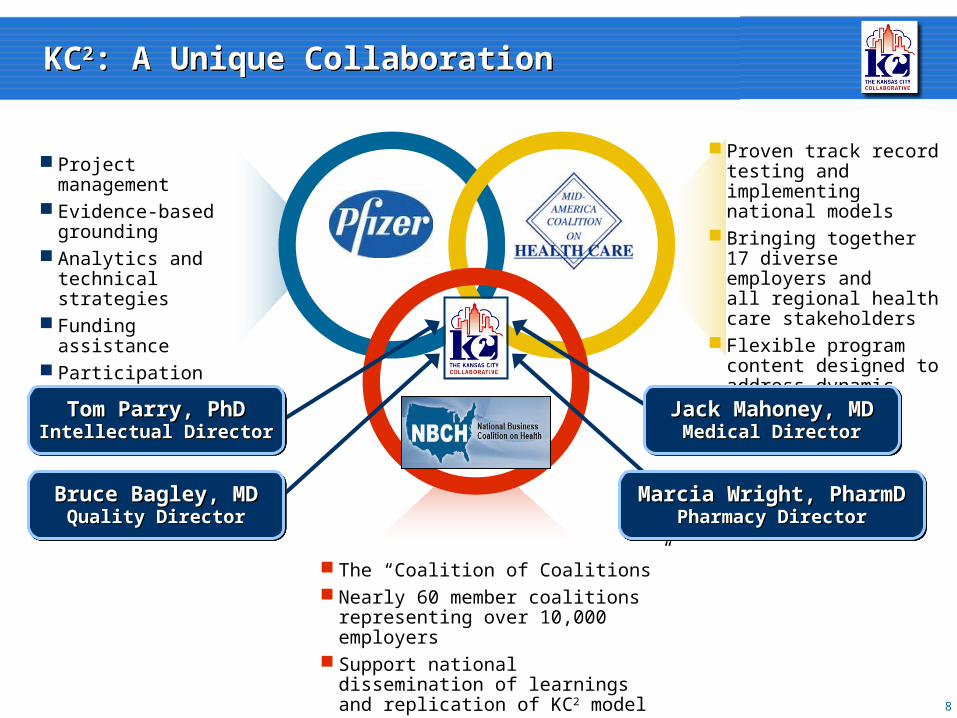
KC2: A Unique Collaboration KC2: A Unique Collaboration
Proven track record testing and implementing national models
Bringing together 17 diverse employers and all regional health care stakeholders
Flexible program content designed to address dynamic employer needs
The “Coalition of Coalitions” Nearly 60 member coalitions
representing over 10,000 employers Support national dissemination of
learnings and replication of KC2 model
Project management Evidence-based
grounding Analytics and
technical strategies Funding assistance Participation in
national replication
Bruce Bagley, MDBruce Bagley, MDQuality DirectorQuality Director
Bruce Bagley, MDBruce Bagley, MDQuality DirectorQuality Director
Tom Parry, PhDTom Parry, PhDIntellectual DirectorIntellectual DirectorTom Parry, PhDTom Parry, PhD
Intellectual DirectorIntellectual DirectorJack Mahoney, MDJack Mahoney, MD
Medical DirectorMedical DirectorJack Mahoney, MDJack Mahoney, MD
Medical DirectorMedical Director
Marcia Wright, PharmDMarcia Wright, PharmDPharmacy DirectorPharmacy Director
Marcia Wright, PharmDMarcia Wright, PharmDPharmacy DirectorPharmacy Director
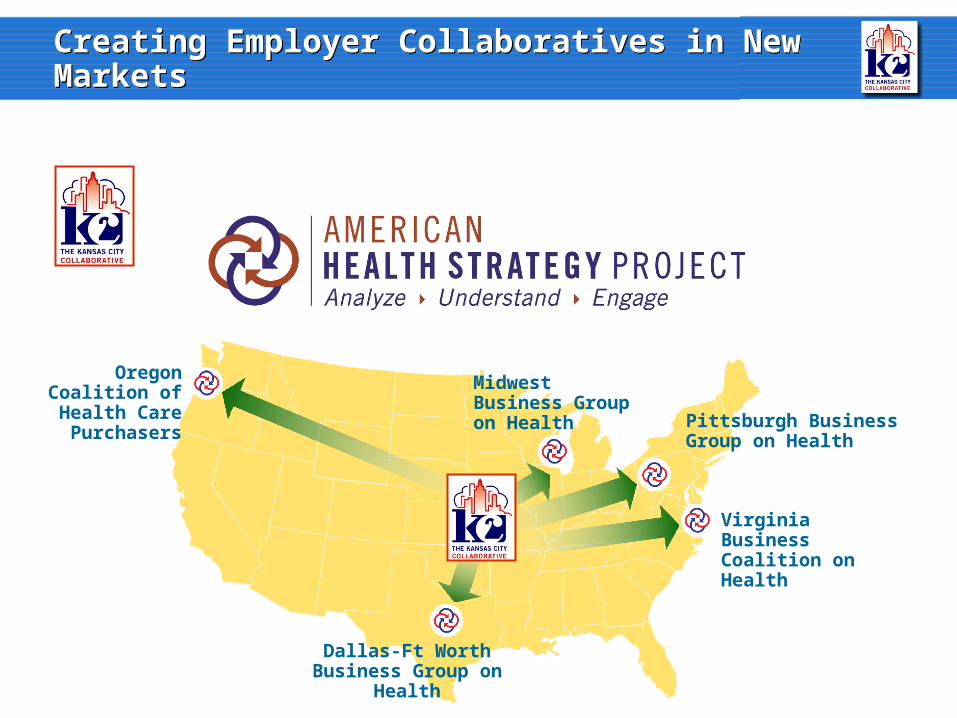
Creating Employer Collaboratives in New MarketsCreating Employer Collaboratives in New Markets
Oregon Coalition of Health Care
Purchasers
Dallas-Ft Worth Business Group on
Health
Midwest Business Group on Health
Pittsburgh Business Group on Health
Virginia Business Coalition on Health
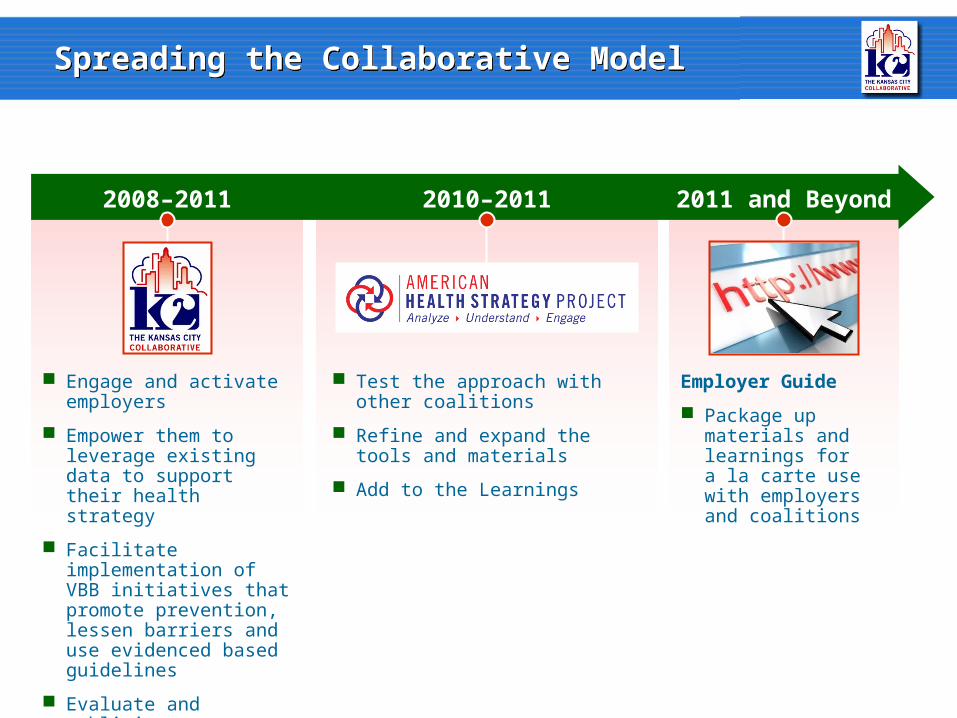
Spreading the Collaborative Model Spreading the Collaborative Model
2008–2011
Engage and activate employers
Empower them to leverage existing data to support their health strategy
Facilitate implementation of VBB initiatives that promote prevention, lessen barriers and use evidenced based guidelines
Evaluate and publicize process learnings and outcomes
2010–2011
Test the approach with other coalitions
Refine and expand the tools and materials
Add to the Learnings
2011 and Beyond
Employer Guide
Package up materials and learnings for a la carte use with employers and coalitions
The Kansas City Collaborative:
The predecessor to
American Health Strategy Project
The Kansas City Collaborative:
The predecessor to
American Health Strategy Project
12
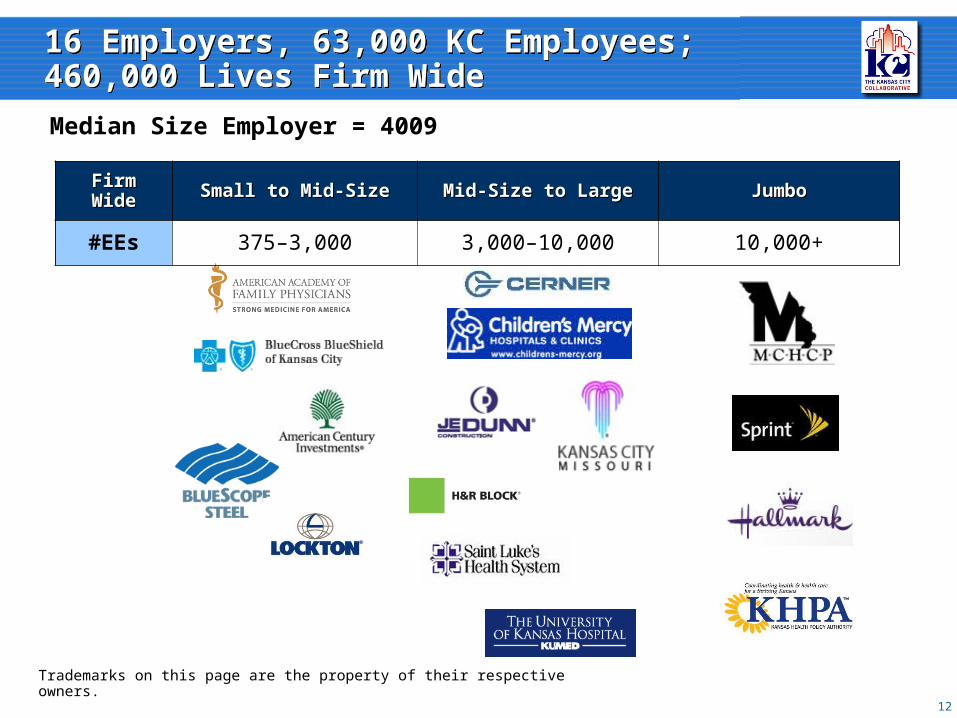
16 Employers, 63,000 KC Employees; 460,000 Lives Firm Wide16 Employers, 63,000 KC Employees; 460,000 Lives Firm Wide
Trademarks on this page are the property of their respective owners.
Firm WideFirm Wide Small to Mid-SizeSmall to Mid-Size Mid-Size to LargeMid-Size to Large JumboJumbo
#EEs 375–3,000 3,000–10,000 10,000+
Median Size Employer = 4009
13
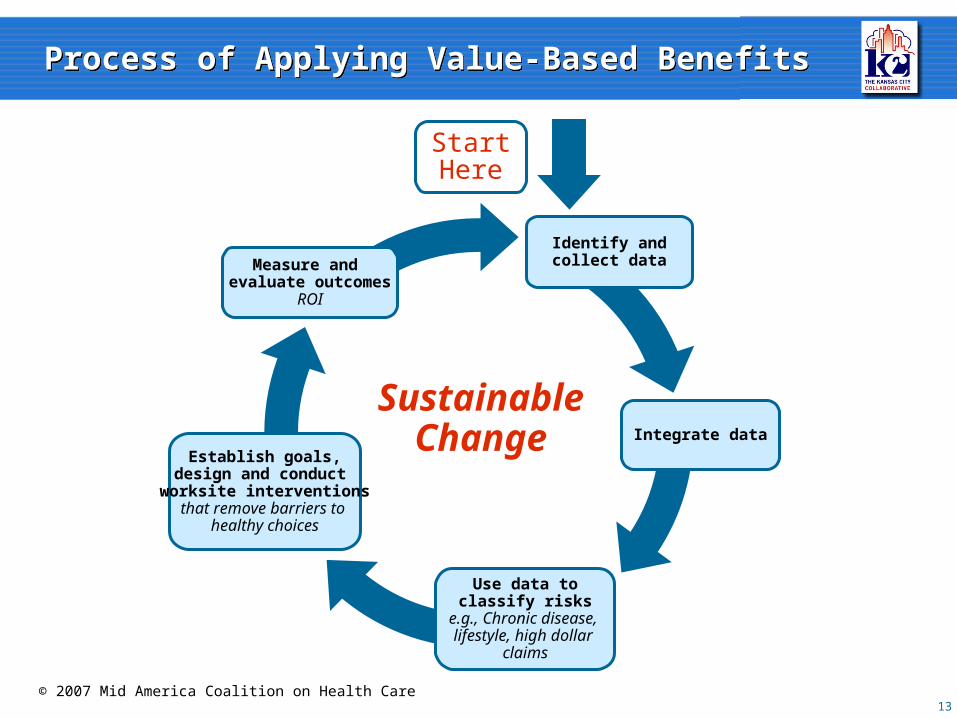
Process of Applying Value-Based BenefitsProcess of Applying Value-Based Benefits
SustainableChange
© 2007 Mid America Coalition on Health Care
StartHere
Identify andcollect data
Integrate data
Use data toclassify risks
e.g., Chronic disease, lifestyle, high dollar
claims
Establish goals,design and conduct
worksite interventionsthat remove barriers to
healthy choices
Measure and evaluate outcomes
ROI
14
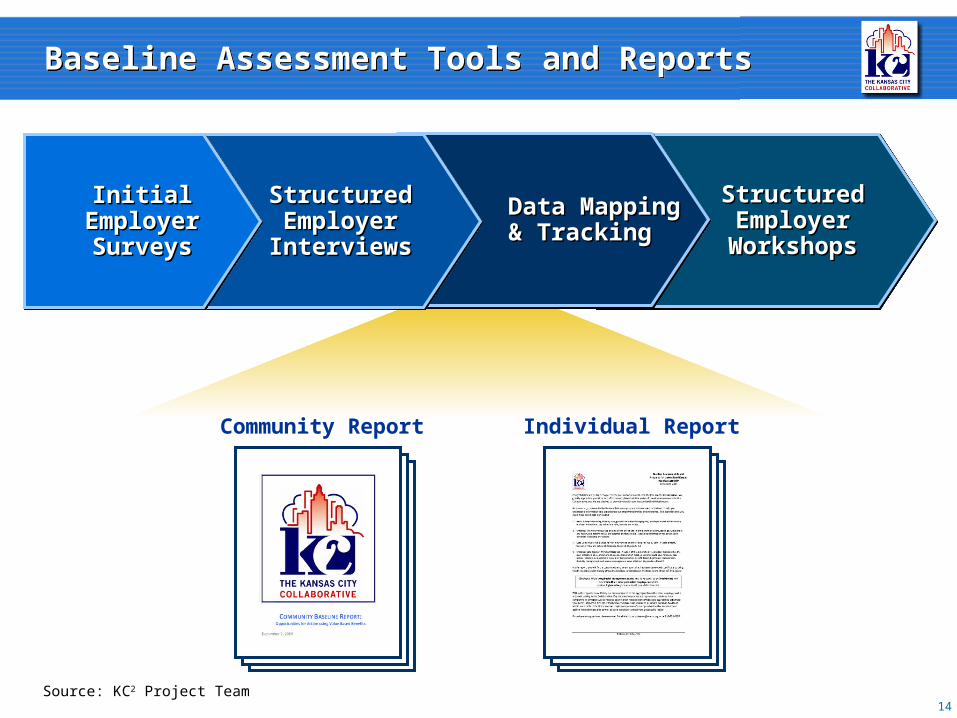
Baseline Assessment Tools and ReportsBaseline Assessment Tools and Reports
Community Report Individual Report
Source: KC2 Project Team
StructuredStructuredEmployerEmployer
WorkshopsWorkshops
StructuredStructuredEmployerEmployer
WorkshopsWorkshops
Data MappingData Mapping& Tracking& Tracking
Data MappingData Mapping& Tracking& Tracking
Structured Structured Employer Employer InterviewsInterviews
Structured Structured Employer Employer InterviewsInterviews
Initial Employer Initial Employer SurveysSurveys
Initial Employer Initial Employer SurveysSurveys
15
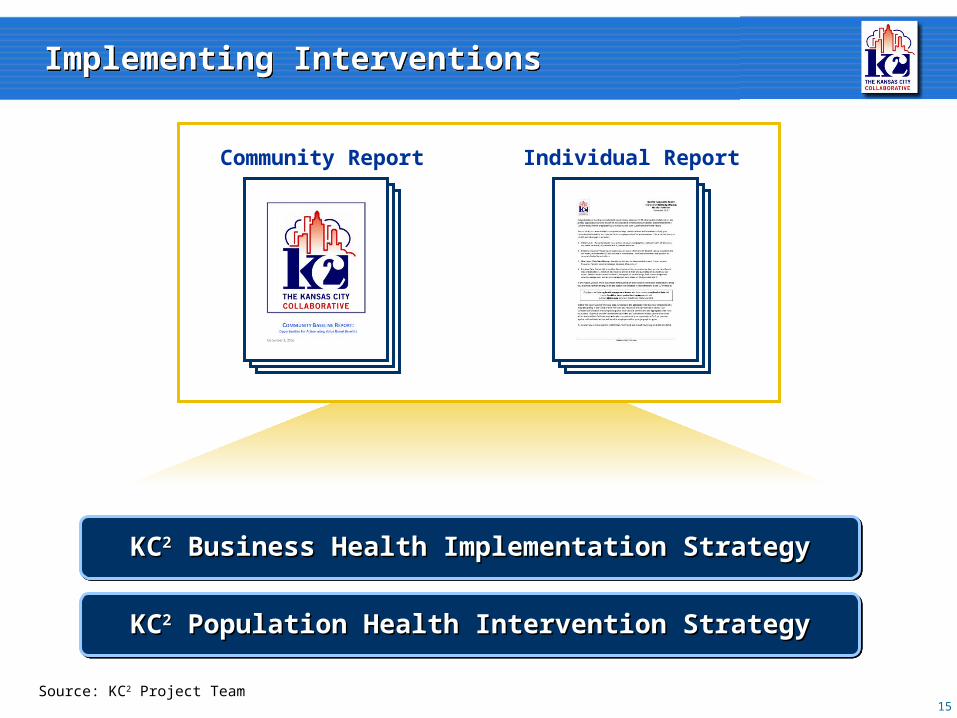
Implementing InterventionsImplementing Interventions
Community Report Individual Report
KCKC22 Business Health Implementation Strategy Business Health Implementation StrategyKCKC22 Business Health Implementation Strategy Business Health Implementation Strategy
KCKC22 Population Health Intervention Strategy Population Health Intervention StrategyKCKC22 Population Health Intervention Strategy Population Health Intervention Strategy
Source: KC2 Project Team
16
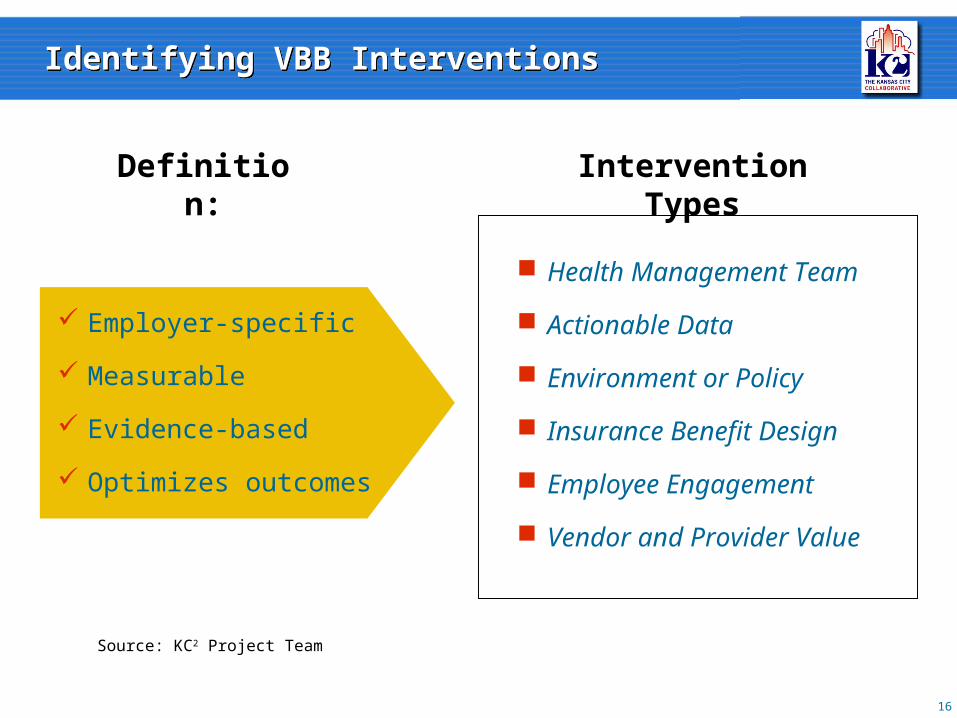
Identifying VBB InterventionsIdentifying VBB Interventions
Employer-specific
Measurable
Evidence-based
Optimizes outcomes
Definition:
Health Management Team
Actionable Data
Environment or Policy
Insurance Benefit Design
Employee Engagement
Vendor and Provider Value
Intervention Types
Source: KC2 Project Team
Health a Core Business Strategy
Health a Core Business Strategy
17
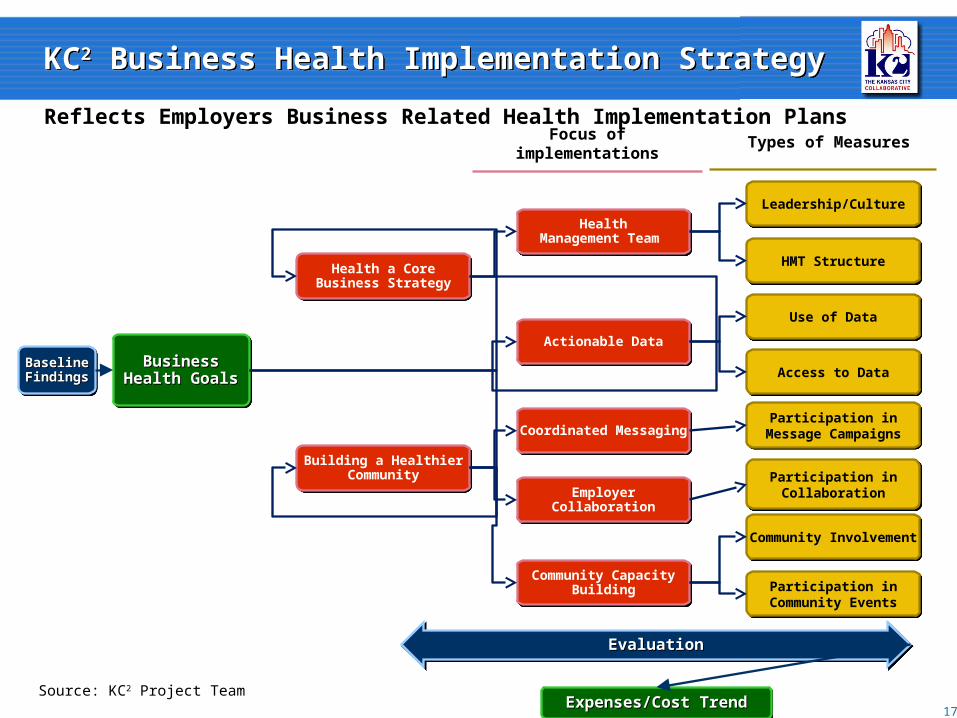
KC2 Business Health Implementation StrategyKC2 Business Health Implementation Strategy
Reflects Employers Business Related Health Implementation Plans
EvaluationEvaluationEvaluationEvaluation
Expenses/Cost TrendExpenses/Cost TrendExpenses/Cost TrendExpenses/Cost Trend
Focus of implementations
Types of Measures
Source: KC2 Project Team
BaselineBaselineFindingsFindingsBaselineBaselineFindingsFindings
BusinessBusinessHealth GoalsHealth Goals
BusinessBusinessHealth GoalsHealth Goals
Leadership/CultureLeadership/Culture
HMT StructureHMT Structure
Use of DataUse of Data
Access to DataAccess to Data
Actionable DataActionable Data
HealthManagement Team
HealthManagement Team
Building a HealthierCommunity
Building a HealthierCommunity
Coordinated Messaging
Coordinated Messaging
Employer Collaboration
Employer Collaboration
Community Capacity Building
Community Capacity Building
Community InvolvementCommunity Involvement
Participation in Community Events
Participation in Community Events
Participation in Collaboration
Participation in Collaboration
Participation in Message Campaigns
Participation in Message Campaigns
18
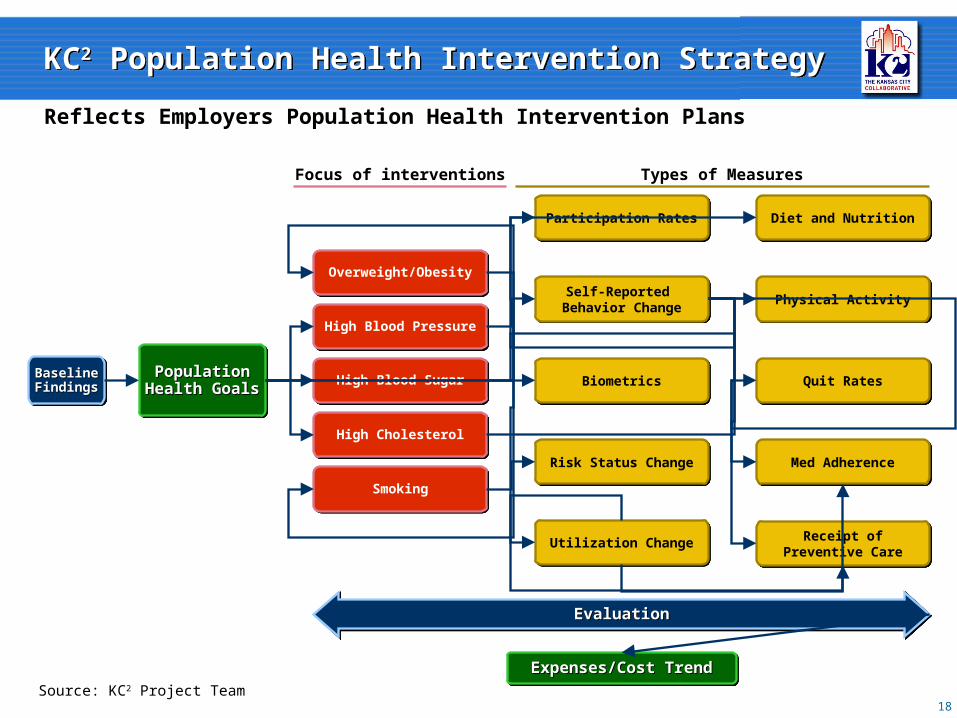
KC2 Population Health Intervention StrategyKC2 Population Health Intervention Strategy
Reflects Employers Population Health Intervention Plans
BaselineBaselineFindingsFindingsBaselineBaselineFindingsFindings
PopulationPopulationHealth GoalsHealth GoalsPopulationPopulation
Health GoalsHealth Goals
Participation RatesParticipation Rates
Self-Reported Behavior ChangeSelf-Reported
Behavior Change
BiometricsBiometrics
Risk Status ChangeRisk Status Change
Utilization ChangeUtilization Change
Overweight/ObesityOverweight/Obesity
High Blood PressureHigh Blood Pressure
High Blood SugarHigh Blood Sugar
High CholesterolHigh Cholesterol
SmokingSmoking
Diet and NutritionDiet and Nutrition
Physical ActivityPhysical Activity
Quit RatesQuit Rates
Med AdherenceMed Adherence
Receipt ofPreventive Care
Receipt ofPreventive Care
EvaluationEvaluationEvaluationEvaluation
Expenses/Cost TrendExpenses/Cost TrendExpenses/Cost TrendExpenses/Cost Trend
Focus of interventions Types of Measures
Source: KC2 Project Team
Implementation Support ToolsImplementation Support Tools
Glossary of types of Interventions
Intervention Models
Guide to Business and Population Health Objectives
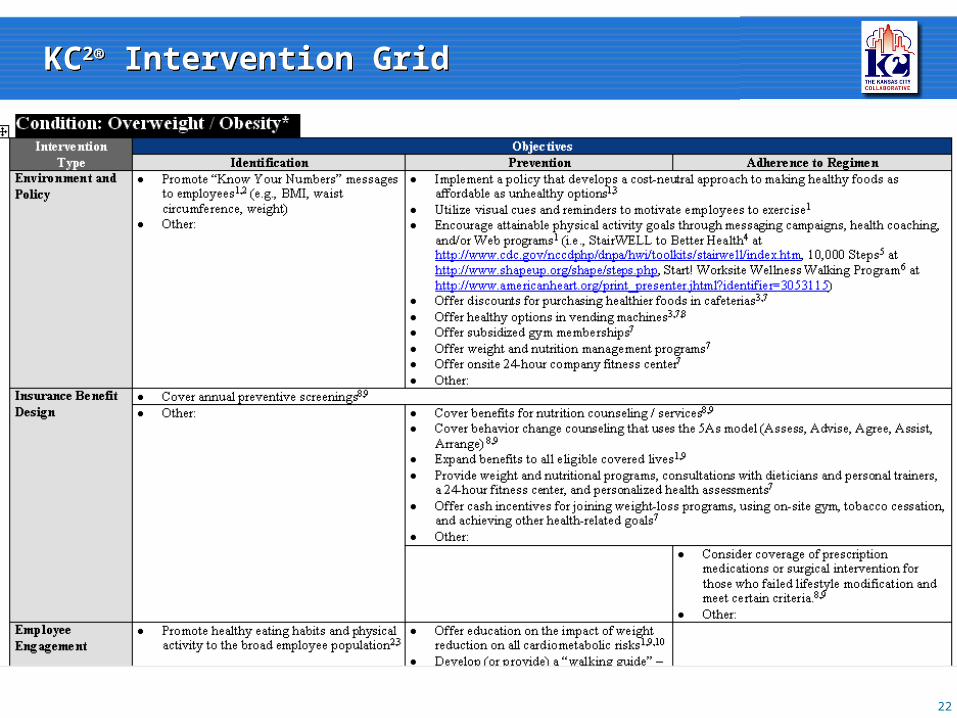
Intervention Grids
Cardiometabolic Road Map
19
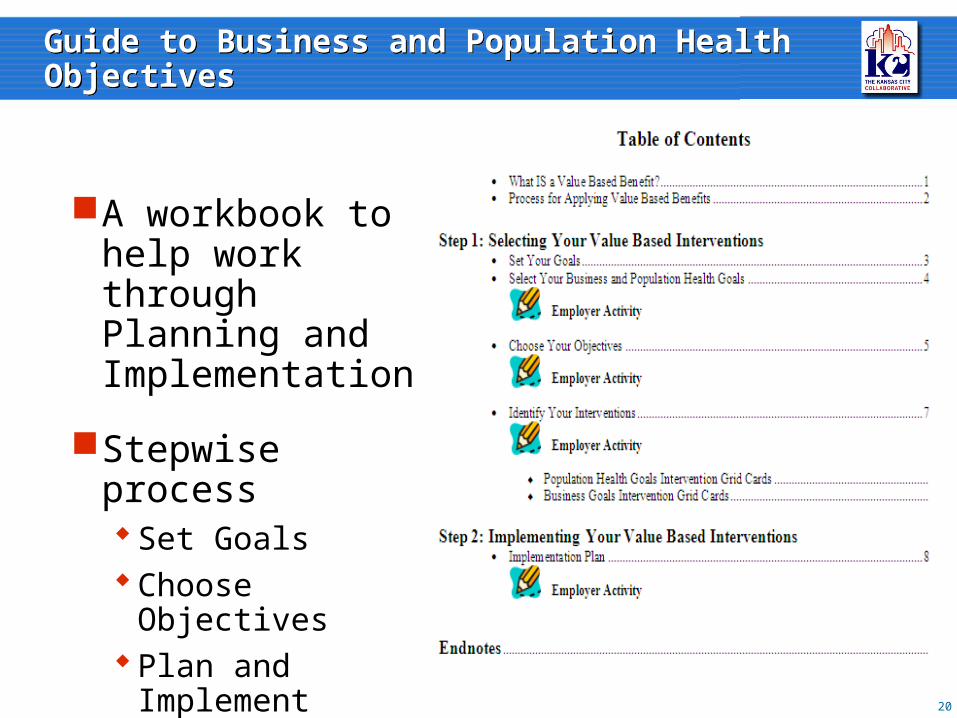
Guide to Business and Population Health ObjectivesGuide to Business and Population Health Objectives
A workbook to help work through Planning and Implementation
Stepwise processSet GoalsChoose ObjectivesPlan and Implement
Interventions
20
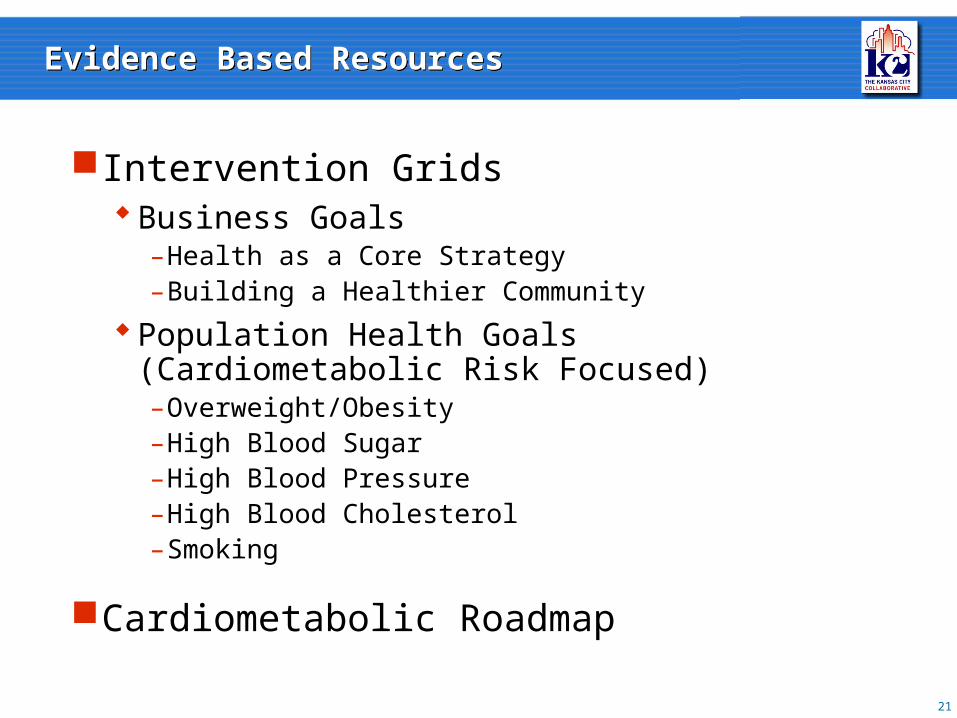
Evidence Based ResourcesEvidence Based Resources
Intervention GridsBusiness Goals
–Health as a Core Strategy–Building a Healthier Community
Population Health Goals (Cardiometabolic Risk Focused)–Overweight/Obesity–High Blood Sugar–High Blood Pressure–High Blood Cholesterol–Smoking
Cardiometabolic Roadmap
21
22
KC2® Intervention GridKC2® Intervention Grid
Employer Applications of Value
Based Benefits
November 16, 2010
Employer Applications of Value
Based Benefits
November 16, 2010
Douglas Tapp
Vice President, Total Rewards
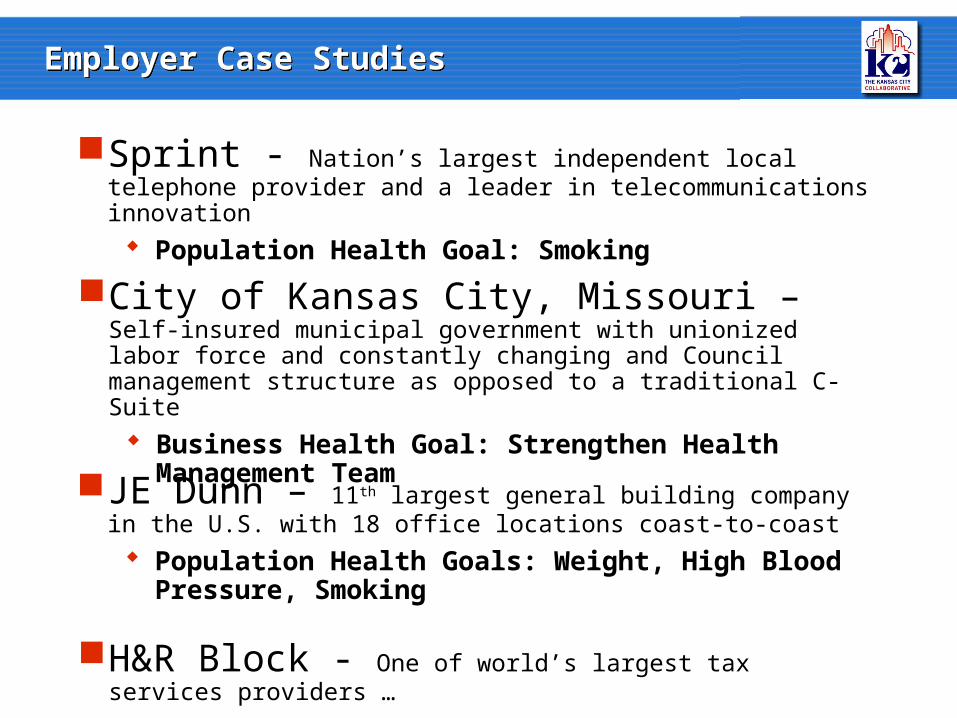
Employer Case StudiesEmployer Case Studies
Sprint - Nation’s largest independent local telephone provider and a leader in telecommunications innovation
Population Health Goal: Smoking
City of Kansas City, Missouri – Self-insured municipal government with unionized labor force and constantly changing and Council management structure as opposed to a traditional C-Suite
Business Health Goal: Strengthen Health Management Team
JE Dunn – 11th largest general building company in the U.S. with 18 office locations coast-to-coast
Population Health Goals: Weight, High Blood Pressure, Smoking
H&R Block - One of world’s largest tax services providers …
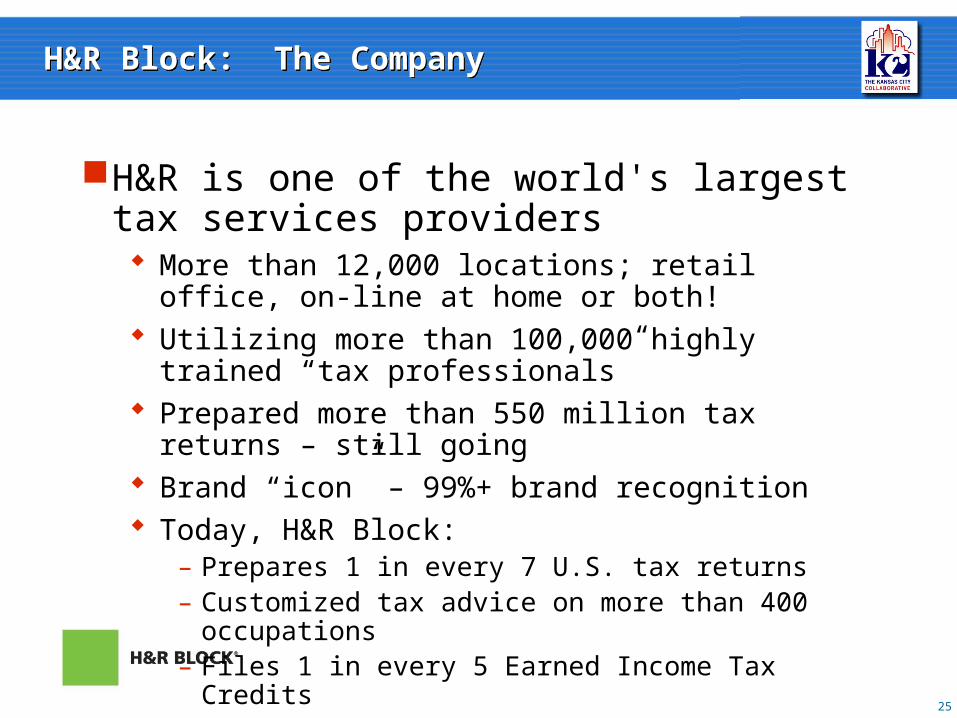
H&R Block: The CompanyH&R Block: The Company
25
EDUCATIONEDUCATION
H&R is one of the world's largest tax services providers More than 12,000 locations; retail office, on-line at
home or both! Utilizing more than 100,000 highly trained “tax
professionals” Prepared more than 550 million tax returns – still going Brand “icon” – 99%+ brand recognition Today, H&R Block:
– Prepares 1 in every 7 U.S. tax returns – Customized tax advice on more than 400 occupations– Files 1 in every 5 Earned Income Tax Credits
H&R Block: The CompanyH&R Block: The Company
26
EDUCATIONEDUCATION
Leading providers of business services through McGladrey and traditional banking solutions through H&R Block Bank
H&R Block success factors: Superior customer service A pledge to stand behind our work A commitment to serving clients where they
prefer to be reached — in a retail office, online, using software or a combination of methods.
H&R Block: Total Rewards PhilosophyH&R Block: Total Rewards Philosophy
27
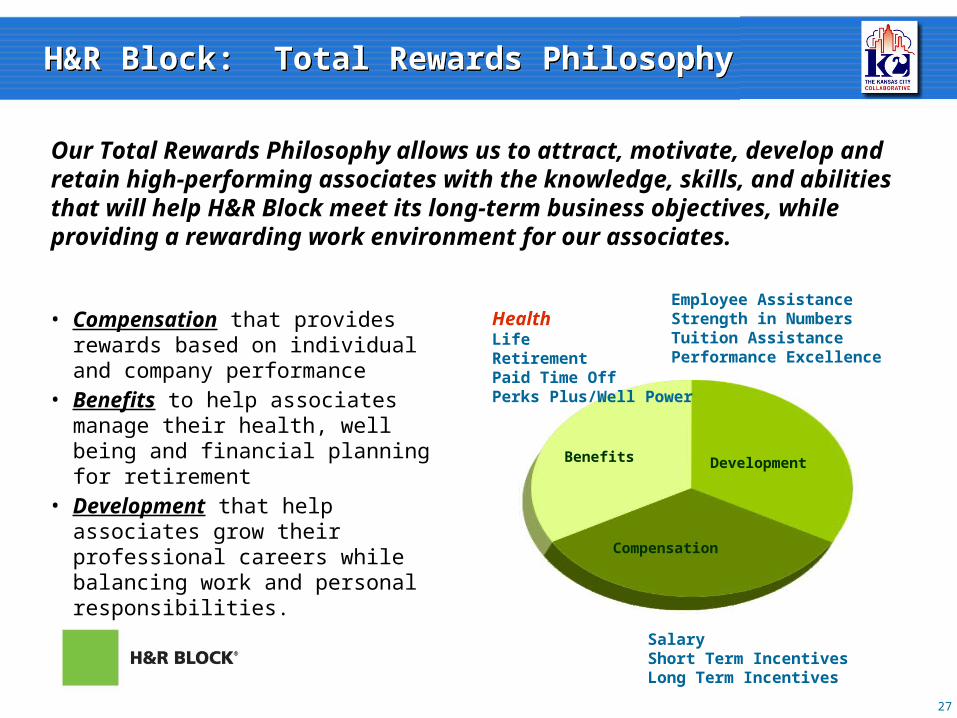
Our Total Rewards Philosophy allows us to attract, motivate, develop and retain high-performing associates with the knowledge, skills, and abilities that will help H&R Block meet its long-term business objectives, while providing a rewarding work environment for our associates.
• Compensation that provides rewards based on individual and company performance
• Benefits to help associates manage their health, well being and financial planning for retirement
• Development that help associates grow their professional careers while balancing work and personal responsibilities.
Employee Assistance Strength in NumbersTuition AssistancePerformance Excellence
HealthLifeRetirementPaid Time OffPerks Plus/Well Power
SalaryShort Term IncentivesLong Term Incentives
Benefits
Development
Compensation
H&R Block: “Vision of Health”H&R Block: “Vision of Health”
28
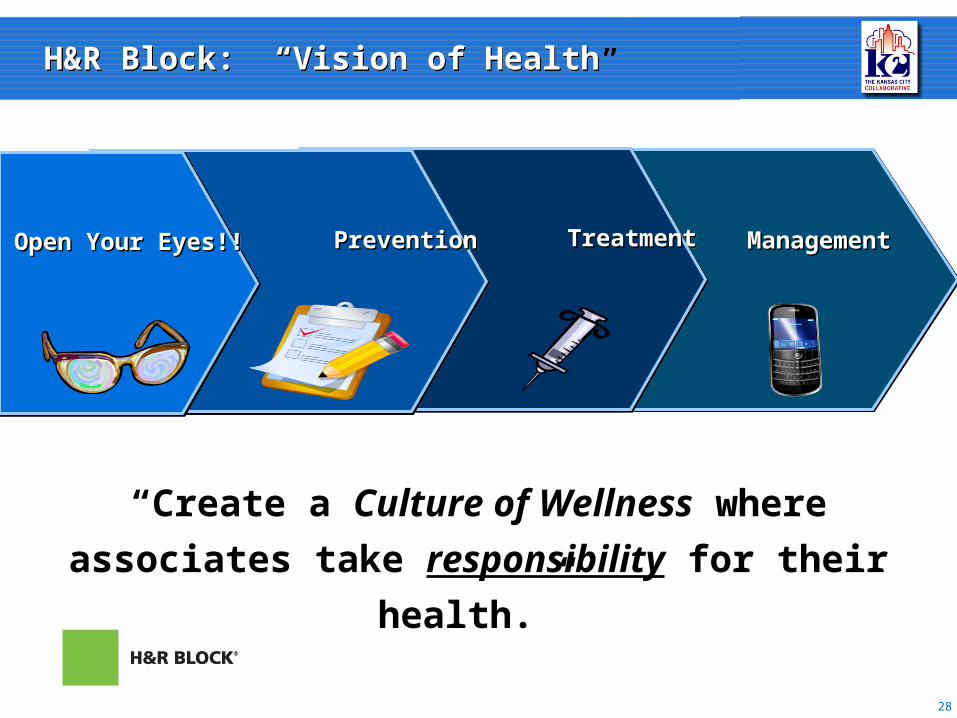
Management Management Management Management TreatmentTreatmentTreatmentTreatment
PreventionPrevention
PreventionPreventionOpen Your Eyes!!Open Your Eyes!!Open Your Eyes!!Open Your Eyes!!
“Create a Culture of Wellness where
associates take responsibility for their health.”
ManagementManagementManagementManagement
H&R Block: “Vision of Health”H&R Block: “Vision of Health”
29
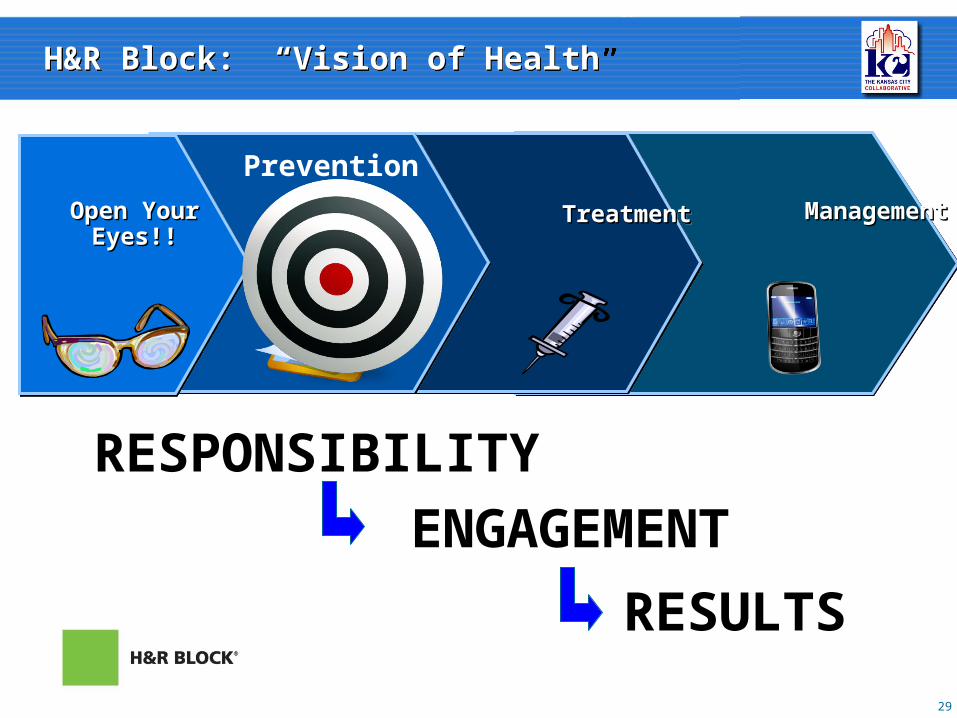
TreatmentTreatment TreatmentTreatment
Open Your Open Your Eyes!!Eyes!!
Open Your Open Your Eyes!!Eyes!!
ENGAGEMENT
RESPONSIBILITY
RESULTS
Prevention
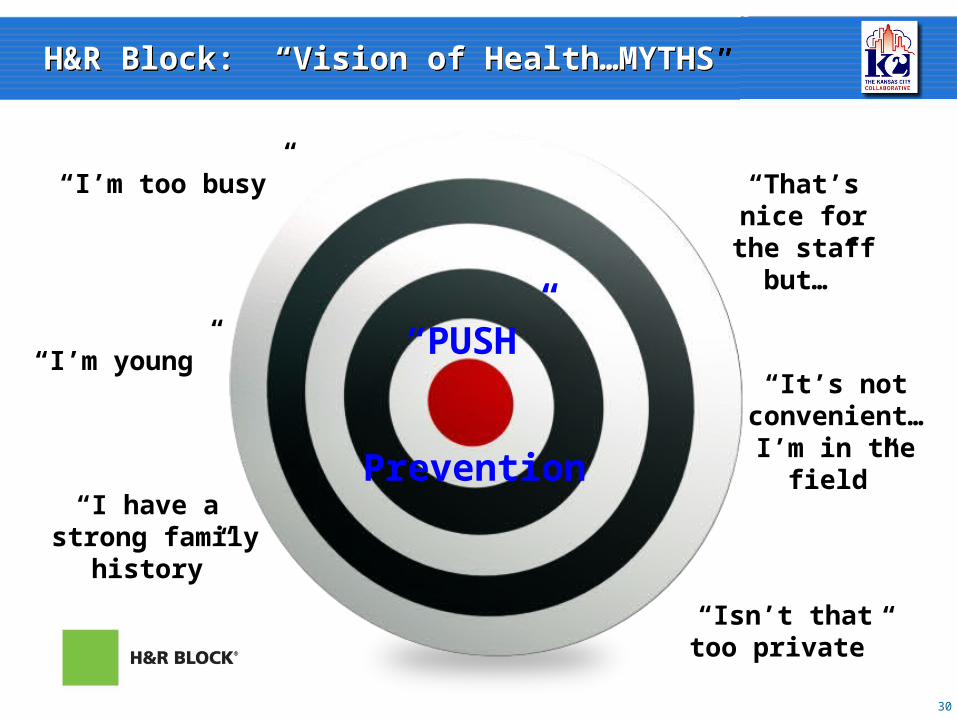
H&R Block: “Vision of Health…MYTHS”H&R Block: “Vision of Health…MYTHS”
30
“PUSH”
Prevention
“I’m too busy”
“It’s not convenient…
I’m in the field”
“I’m young”
“I have a strong family
history”
“Isn’t thattoo private”
“That’s nice for the staff
but…”
31
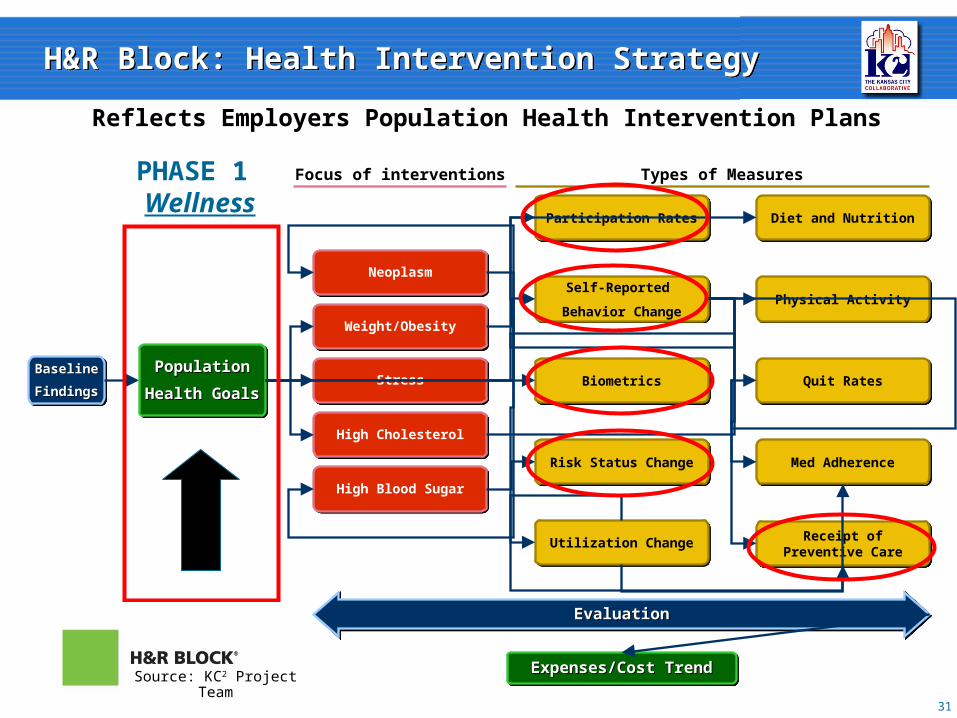
H&R Block: Health Intervention StrategyH&R Block: Health Intervention Strategy
Reflects Employers Population Health Intervention Plans
BaselineBaseline
FindingsFindings
BaselineBaseline
FindingsFindings
PopulationPopulation
Health GoalsHealth Goals
PopulationPopulation
Health GoalsHealth Goals
Participation RatesParticipation Rates
Self-Reported
Behavior Change
Self-Reported
Behavior Change
BiometricsBiometrics
Risk Status ChangeRisk Status Change
Utilization ChangeUtilization Change
NeoplasmNeoplasm
Weight/ObesityWeight/Obesity
StressStress
High CholesterolHigh Cholesterol
High Blood SugarHigh Blood Sugar
Diet and NutritionDiet and Nutrition
Physical ActivityPhysical Activity
Quit RatesQuit Rates
Med AdherenceMed Adherence
Receipt ofPreventive Care
Receipt ofPreventive Care
EvaluationEvaluationEvaluationEvaluation
Expenses/Cost TrendExpenses/Cost TrendExpenses/Cost TrendExpenses/Cost Trend
Focus of interventions Types of MeasuresPHASE 1 Wellness
Source: KC2 Project Team
32
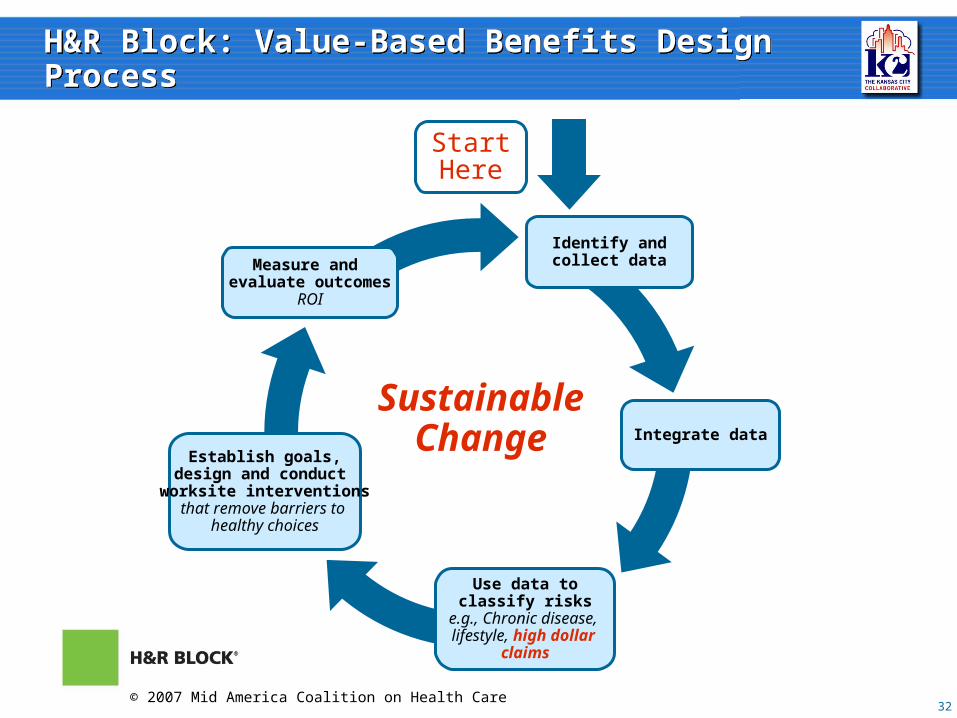
H&R Block: Value-Based Benefits Design ProcessH&R Block: Value-Based Benefits Design Process
SustainableChange
StartHere
Identify andcollect data
Integrate data
Use data toclassify risks
e.g., Chronic disease, lifestyle, high dollar
claims
Establish goals,design and conduct
worksite interventionsthat remove barriers to
healthy choices
Measure and evaluate outcomes
ROI
© 2007 Mid America Coalition on Health Care
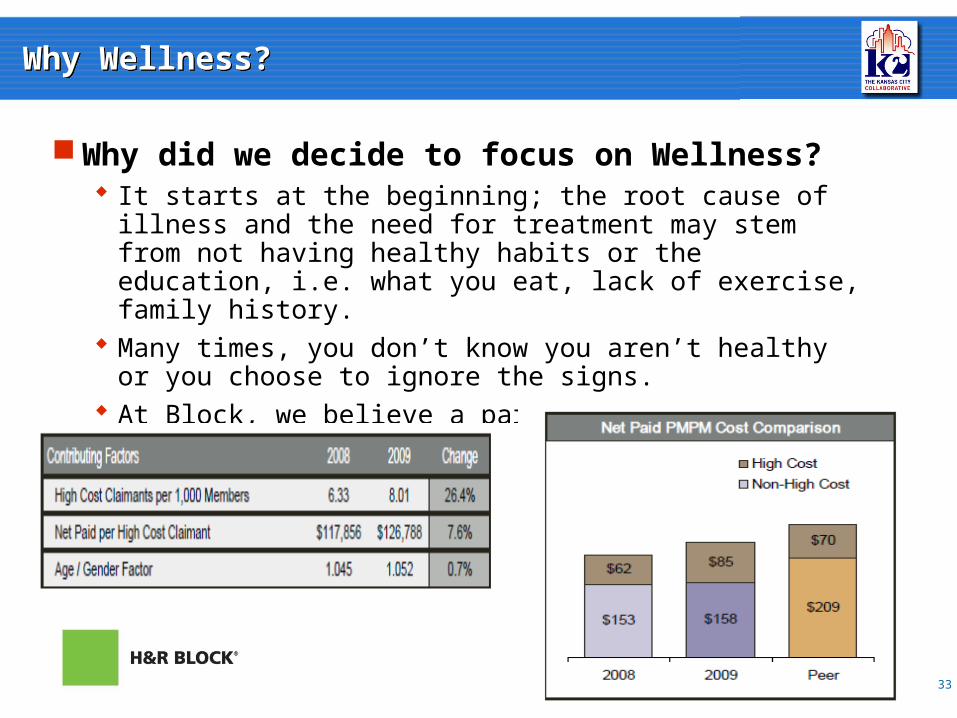
Why did we decide to focus on Wellness? It starts at the beginning; the root cause of illness and the need
for treatment may stem from not having healthy habits or the education, i.e. what you eat, lack of exercise, family history.
Many times, you don’t know you aren’t healthy or you choose to ignore the signs.
At Block, we believe a partnership is the key. With education, our associates were ready.
33
Why Wellness?Why Wellness?
Why Wellness?Why Wellness?
34
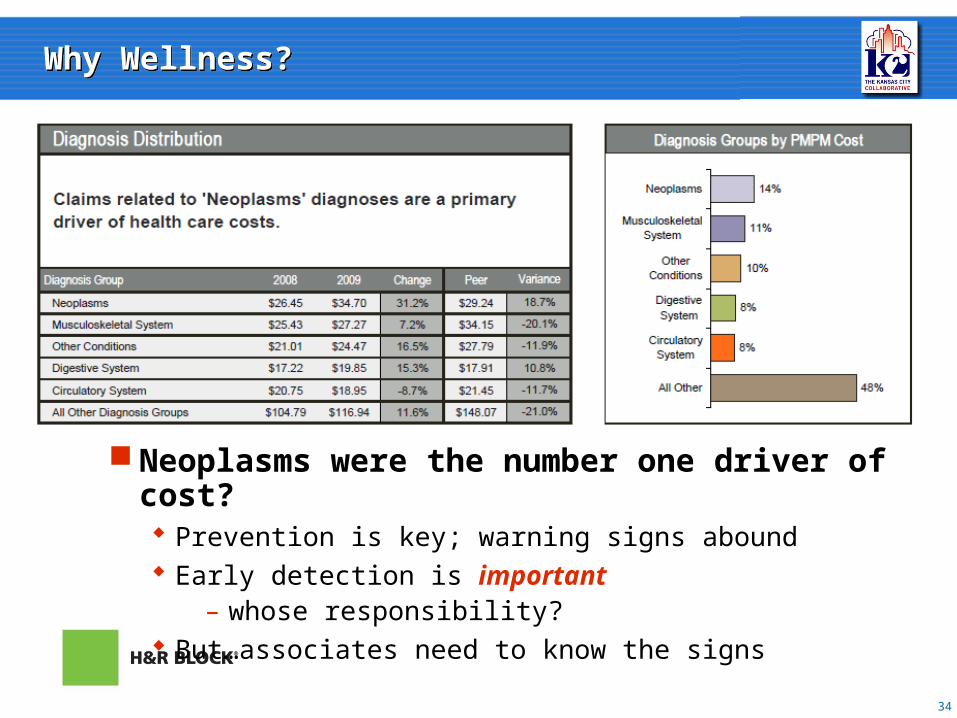
Neoplasms were the number one driver of cost? Prevention is key; warning signs abound Early detection is important
– whose responsibility? But…associates need to know the signs
Why Wellness?Why Wellness?
35
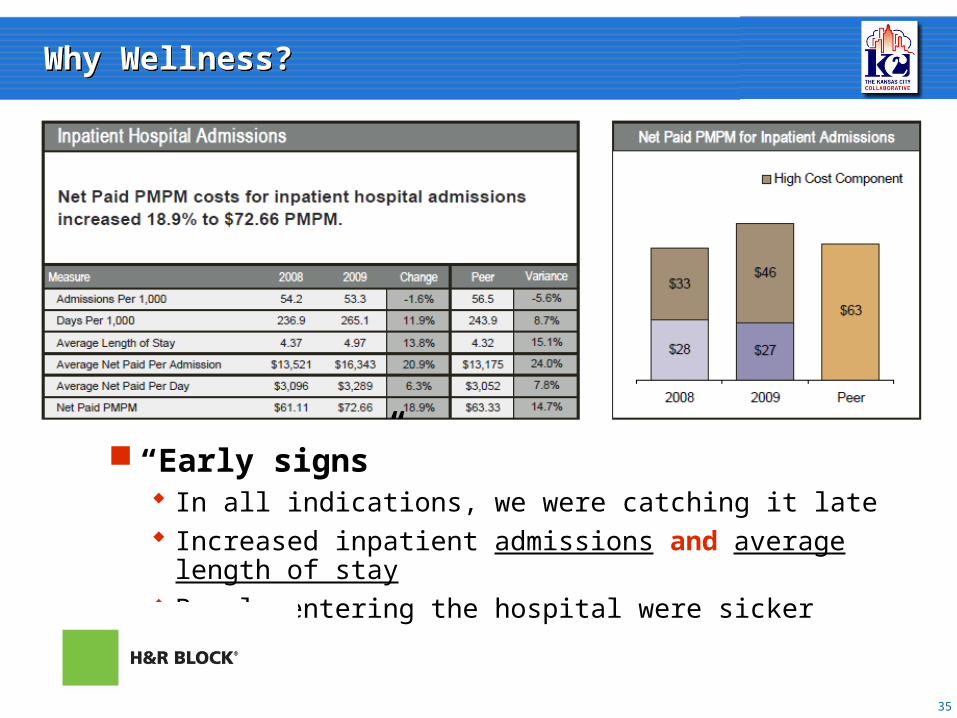
“Early signs” In all indications, we were catching it late Increased inpatient admissions and average length of stay People entering the hospital were sicker
Why Wellness?Why Wellness?
36
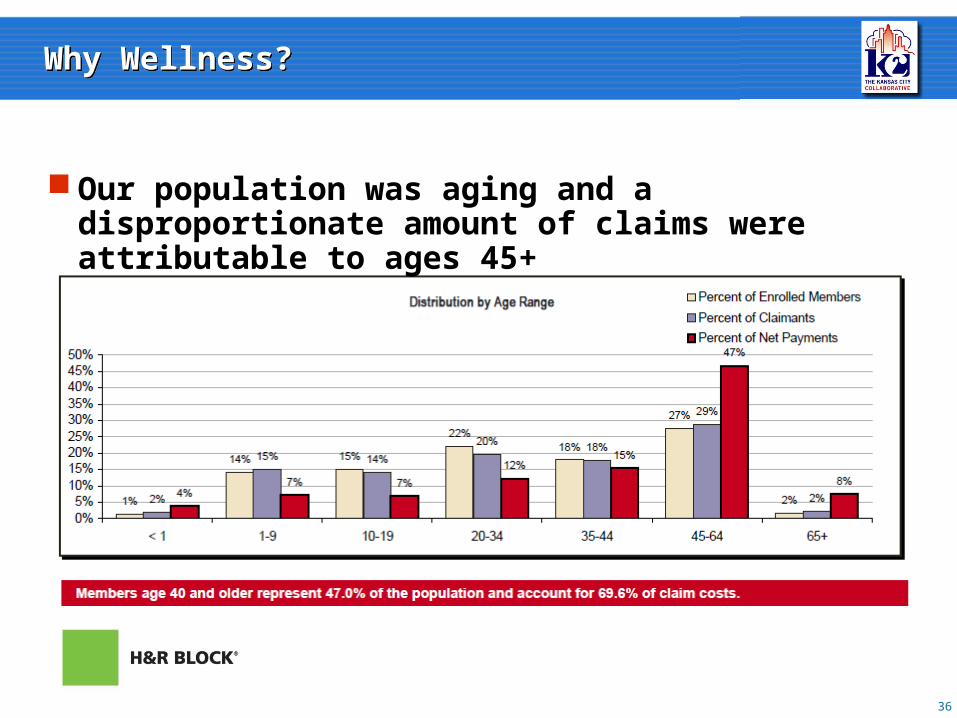
Our population was aging and a disproportionate amount of claims were attributable to ages 45+
Why Wellness?Why Wellness?
37
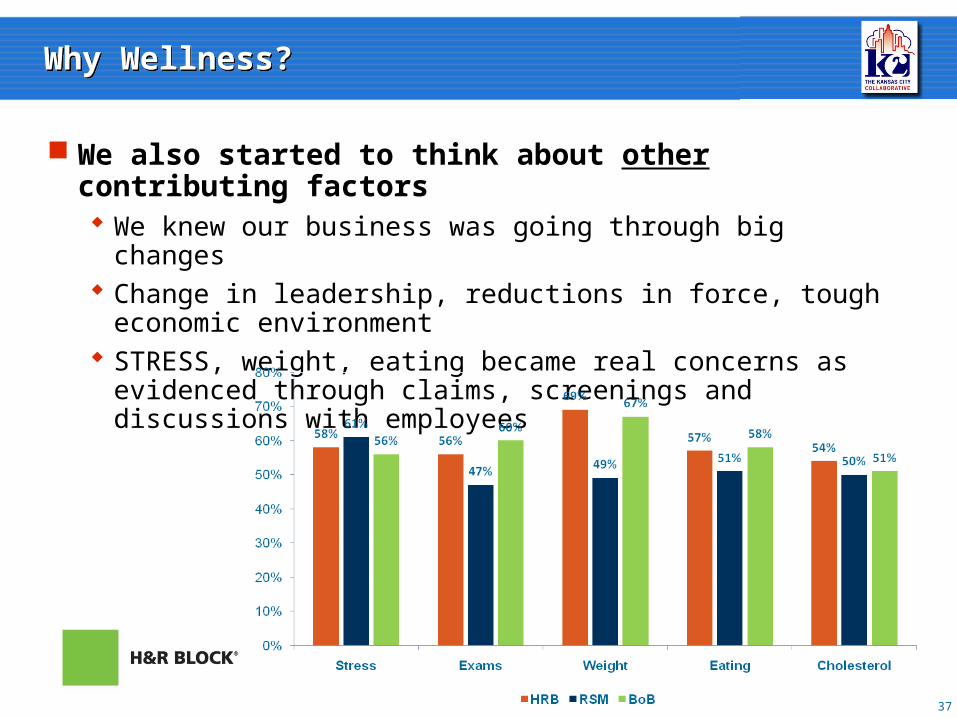
We also started to think about other contributing factors We knew our business was going through big changes Change in leadership, reductions in force, tough economic
environment STRESS, weight, eating became real concerns as evidenced
through claims, screenings and discussions with employees
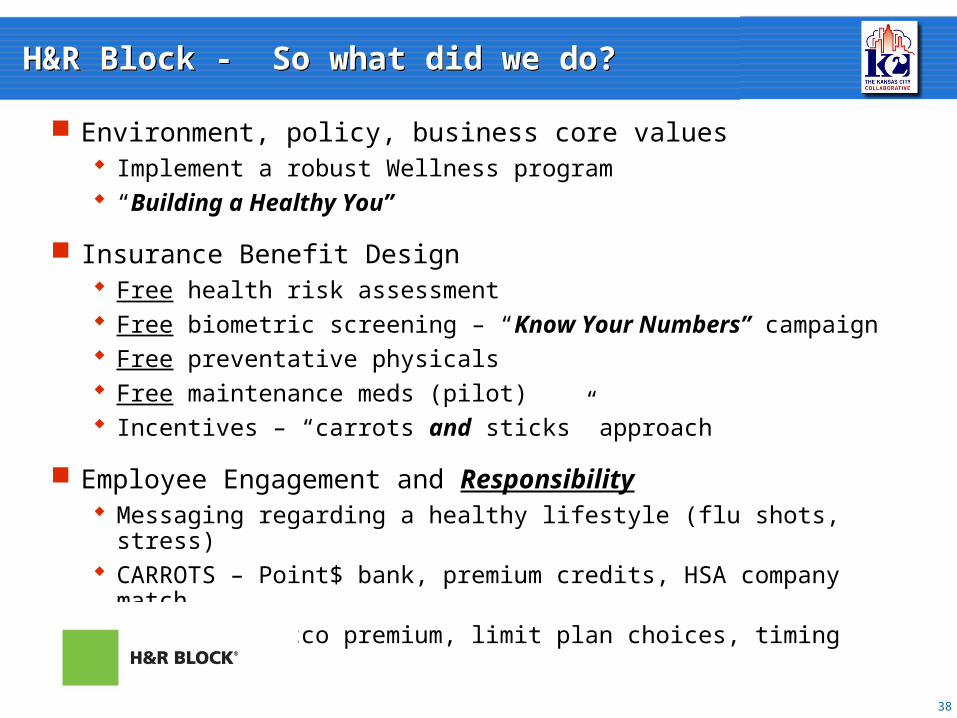
Environment, policy, business core values Implement a robust Wellness program “Building a Healthy You”
Insurance Benefit Design Free health risk assessment Free biometric screening – “Know Your Numbers” campaign Free preventative physicals Free maintenance meds (pilot) Incentives – “carrots and sticks” approach
Employee Engagement and Responsibility Messaging regarding a healthy lifestyle (flu shots, stress) CARROTS – Point$ bank, premium credits, HSA company match STICK – Tobacco premium, limit plan choices, timing
38
H&R Block - So what did we do?H&R Block - So what did we do?
39
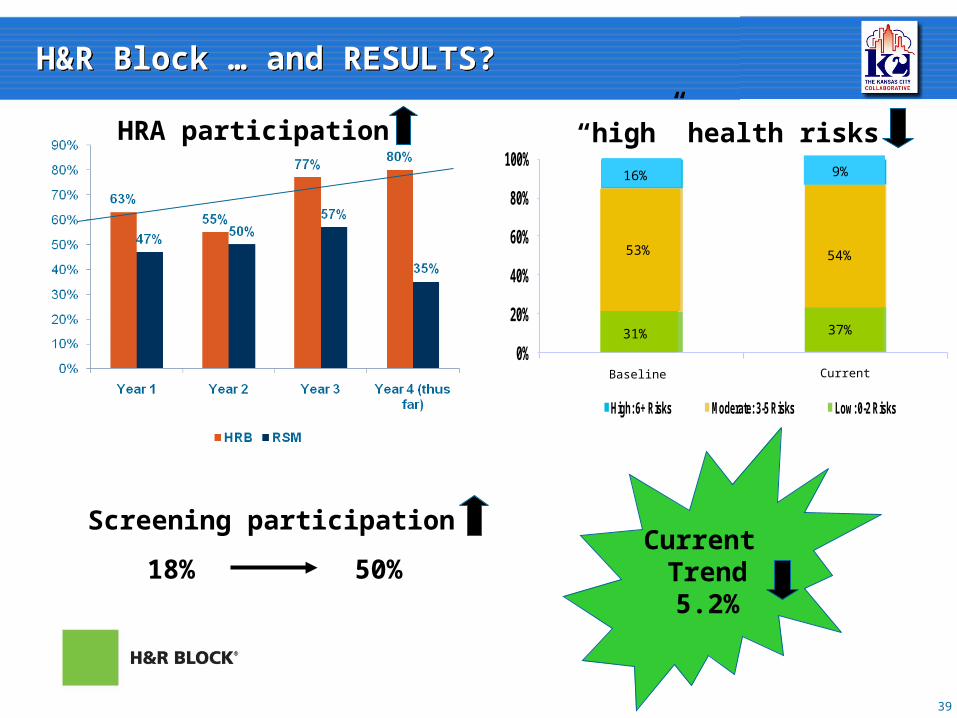
H&R Block … and RESULTS?H&R Block … and RESULTS?
HRA participation
Screening participation
18% 50%Current Trend5.2%
21% 24%
64% 63%
15% 13%
0%
20%
40%
60%
80%
100%
Past Current
High: 6+ Risks Moderate: 3-5 Risks Low: 0-2 Risks
“high” health risks 16%
53%
31%
9%
54%
37%
Baseline Current
40
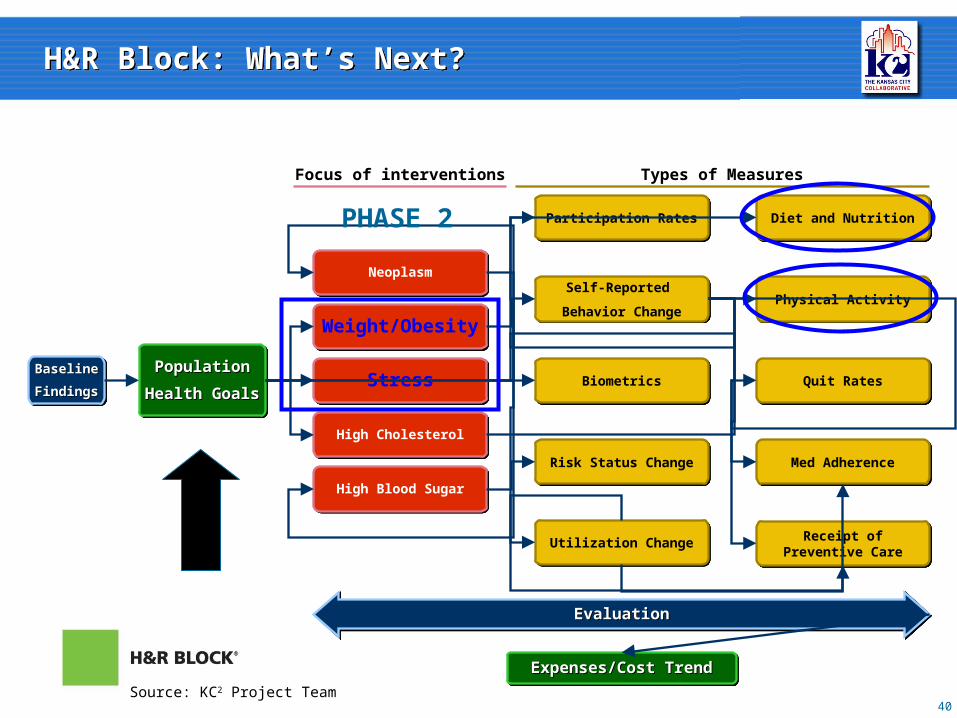
H&R Block: What’s Next?H&R Block: What’s Next?
BaselineBaseline
FindingsFindings
BaselineBaseline
FindingsFindings
PopulationPopulation
Health GoalsHealth Goals
PopulationPopulation
Health GoalsHealth Goals
Participation RatesParticipation Rates
Self-Reported
Behavior Change
Self-Reported
Behavior Change
BiometricsBiometrics
Risk Status ChangeRisk Status Change
Utilization ChangeUtilization Change
NeoplasmNeoplasm
Weight/ObesityWeight/Obesity
StressStress
High CholesterolHigh Cholesterol
High Blood SugarHigh Blood Sugar
Diet and NutritionDiet and Nutrition
Physical ActivityPhysical Activity
Quit RatesQuit Rates
Med AdherenceMed Adherence
Receipt ofPreventive Care
Receipt ofPreventive Care
EvaluationEvaluationEvaluationEvaluation
Expenses/Cost TrendExpenses/Cost TrendExpenses/Cost TrendExpenses/Cost Trend
Focus of interventions Types of Measures
PHASE 2
Source: KC2 Project Team
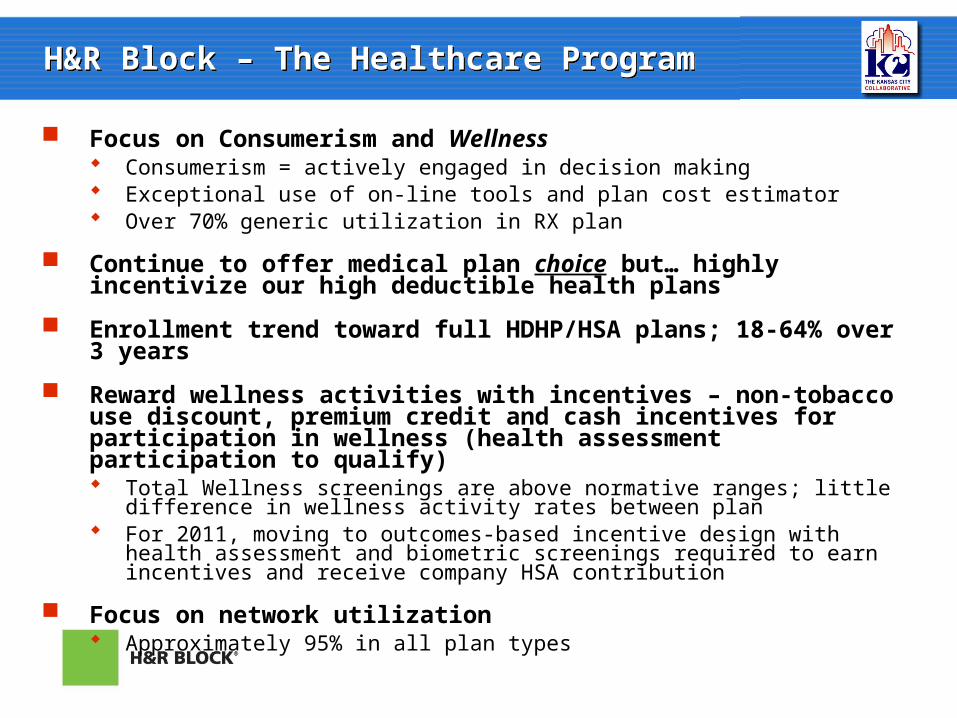
H&R Block – The Healthcare ProgramH&R Block – The Healthcare Program
Focus on Consumerism and Wellness Consumerism = actively engaged in decision making Exceptional use of on-line tools and plan cost estimator Over 70% generic utilization in RX plan
Continue to offer medical plan choice but… highly incentivize our high deductible health plans
Enrollment trend toward full HDHP/HSA plans; 18-64% over 3 years
Reward wellness activities with incentives – non-tobacco use discount, premium credit and cash incentives for participation in wellness (health assessment participation to qualify) Total Wellness screenings are above normative ranges; little difference in wellness
activity rates between plan For 2011, moving to outcomes-based incentive design with health assessment and
biometric screenings required to earn incentives and receive company HSA contribution
Focus on network utilization Approximately 95% in all plan types
Discussionwww.machc.org
Bill [email protected]
Doug Tapp
Discussionwww.machc.org
Bill [email protected]
Doug Tapp
© 2010 Kansas City Collaborative All Rights Reserved. PG286306