Embed Size (px)
Citation preview

1-month Practical CourseGenome Analysis
Lecture 3: Residue exchange matrices
Centre for Integrative Bioinformatics VU (IBIVU)Vrije Universiteit AmsterdamThe Netherlands
CENTR
FORINTEGRATIVE
BIOINFORMATICSVU
E

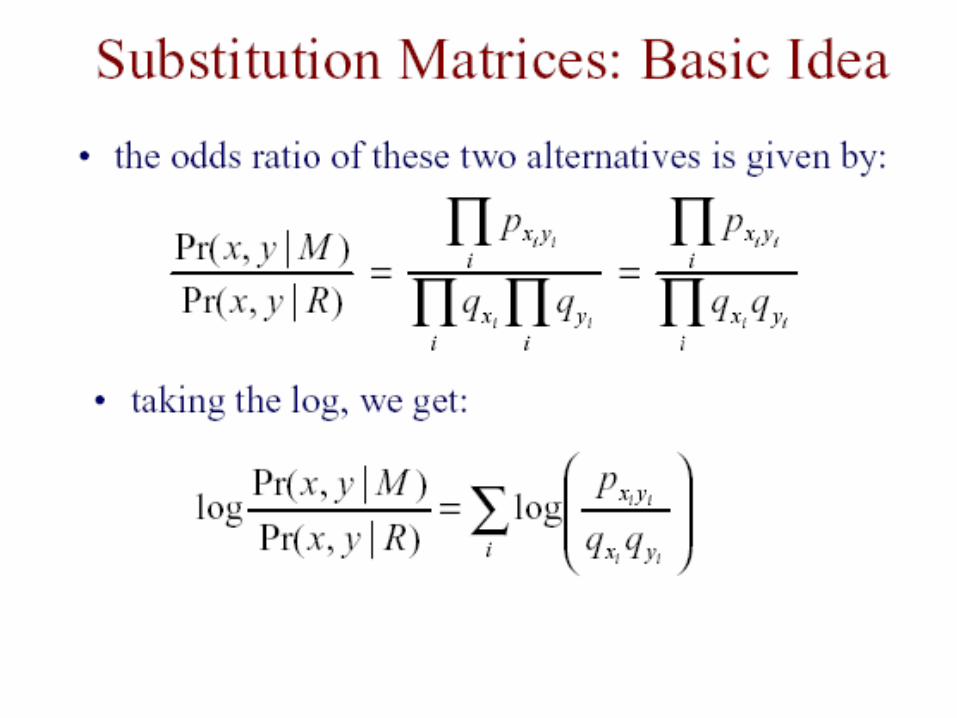
Amino acid exchange matrices
How do we get one?
And how do we get associated gap penalties?
First systematic method to derive a.a. exchange matrices by Margaret Dayhoff et al. (1968) – Atlas of Protein Structure
2020

A 2
R -2 6
N 0 0 2
D 0 -1 2 4
C -2 -4 -4 -5 12
Q 0 1 1 2 -5 4
E 0 -1 1 3 -5 2 4
G 1 -3 0 1 -3 -1 0 5
H -1 2 2 1 -3 3 1 -2 6
I -1 -2 -2 -2 -2 -2 -2 -3 -2 5
L -2 -3 -3 -4 -6 -2 -3 -4 -2 2 6
K -1 3 1 0 -5 1 0 -2 0 -2 -3 5
M -1 0 -2 -3 -5 -1 -2 -3 -2 2 4 0 6
F -4 -4 -4 -6 -4 -5 -5 -5 -2 1 2 -5 0 9
P 1 0 -1 -1 -3 0 -1 -1 0 -2 -3 -1 -2 -5 6
S 1 0 1 0 0 -1 0 1 -1 -1 -3 0 -2 -3 1 2
T 1 -1 0 0 -2 -1 0 0 -1 0 -2 0 -1 -3 0 1 3
W -6 2 -4 -7 -8 -5 -7 -7 -3 -5 -2 -3 -4 0 -6 -2 -5 17
Y -3 -4 -2 -4 0 -4 -4 -5 0 -1 -1 -4 -2 7 -5 -3 -3 0 10
V 0 -2 -2 -2 -2 -2 -2 -1 -2 4 2 -2 2 -1 -1 -1 0 -6 -2 4
B 0 -1 2 3 -4 1 2 0 1 -2 -3 1 -2 -5 -1 0 0 -5 -3 -2 2
Z 0 0 1 3 -5 3 3 -1 2 -2 -3 0 -2 -5 0 0 -1 -6 -4 -2 2 3
A R N D C Q E G H I L K M F P S T W Y V B Z
PAM250 matrix
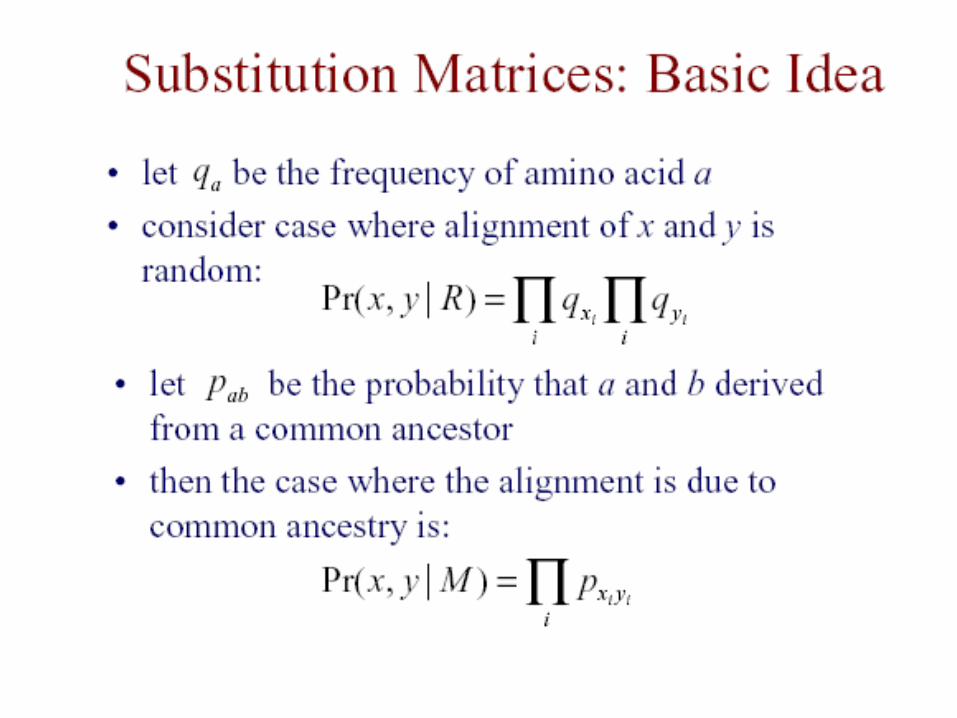
amino acid exchange matrix (log odds)
Positive exchange values denote mutations that are more likely than randomly expected, while negative numbers correspond to avoided mutations compared to the randomly expected situation

Amino acids are not equal:
1. Some are easily substituted because they have similar:
• physico-chemical properties
• chemical structure
2. Some mutations between amino acids occur more often due to similar codons
The two above observations give us ways to define substitution matrices
Amino acid exchange matrices
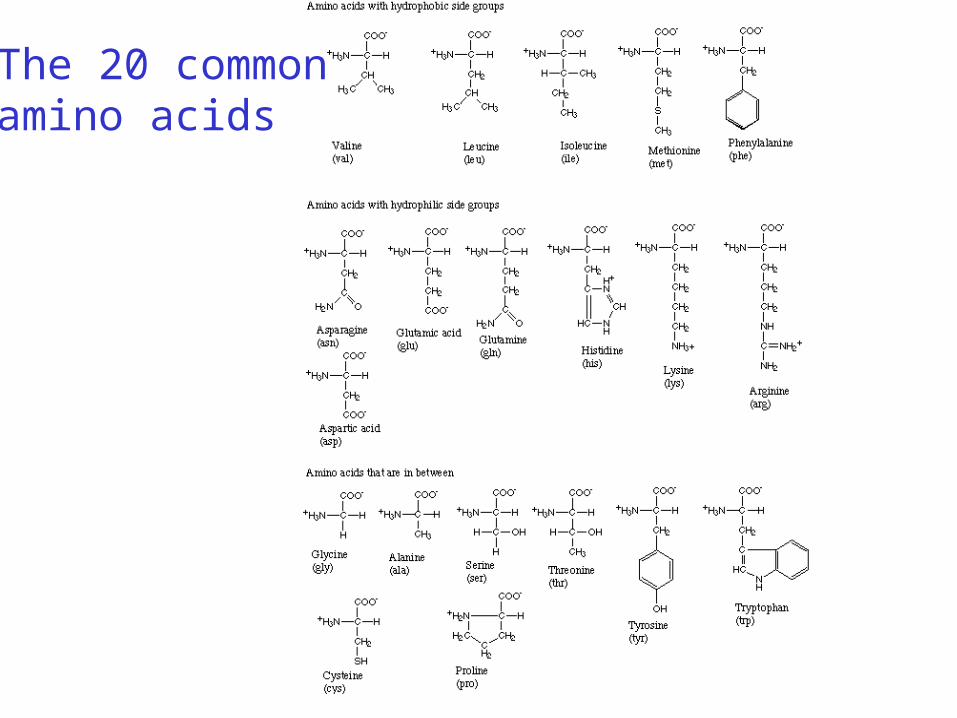
The 20 commonamino acids

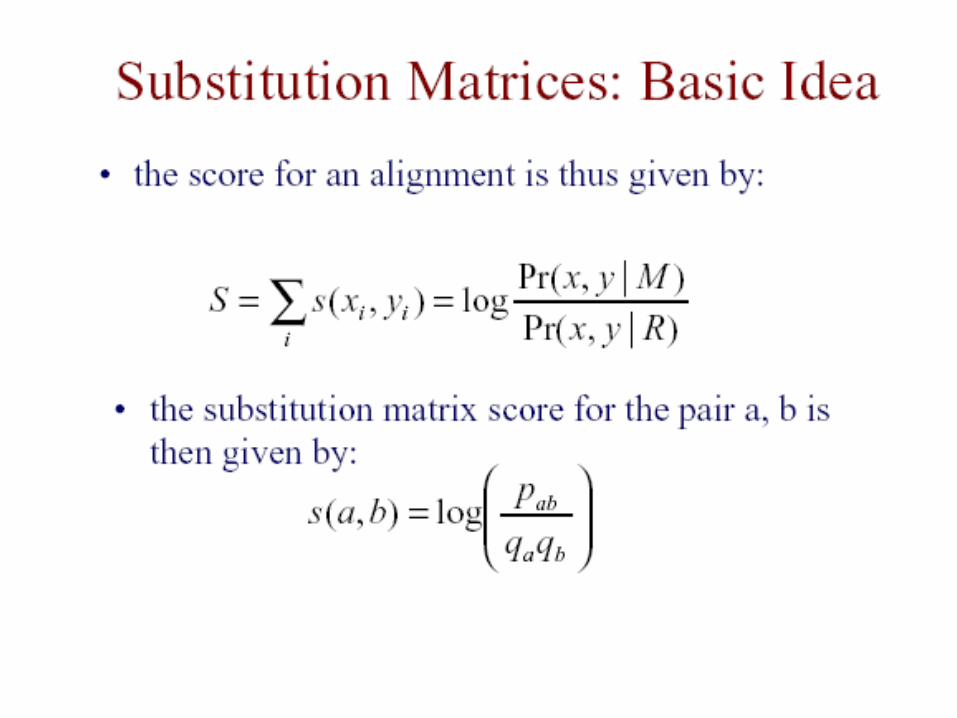
Substitution matrices
A C G T
A 91 -114 -31 -123
C -114 100 -125 -31
G -31 -125 100 -114
T -123 -31 -114 91
A 2
R -2 6
N 0 0 2
D 0 -1 2 4
C -2 -4 -4 -5 12
Q 0 1 1 2 -5 4
E 0 -1 1 3 -5 2 4
G 1 -3 0 1 -3 -1 0 5
H -1 2 2 1 -3 3 1 -2 6
I -1 -2 -2 -2 -2 -2 -2 -3 -2 5
L -2 -3 -3 -4 -6 -2 -3 -4 -2 2 6
K -1 3 1 0 -5 1 0 -2 0 -2 -3 5
M -1 0 -2 -3 -5 -1 -2 -3 -2 2 4 0 6
F -4 -4 -4 -6 -4 -5 -5 -5 -2 1 2 -5 0 9
P 1 0 -1 -1 -3 0 -1 -1 0 -2 -3 -1 -2 -5 6
S 1 0 1 0 0 -1 0 1 -1 -1 -3 0 -2 -3 1 2
T 1 -1 0 0 -2 -1 0 0 -1 0 -2 0 -1 -3 0 1 3
W -6 2 -4 -7 -8 -5 -7 -7 -3 -5 -2 -3 -4 0 -6 -2 -5 17
Y -3 -4 -2 -4 0 -4 -4 -5 0 -1 -1 -4 -2 7 -5 -3 -3 0 10
V 0 -2 -2 -2 -2 -2 -2 -1 -2 4 2 -2 2 -1 -1 -1 0 -6 -2 4
B 0 -1 2 3 -4 1 2 0 1 -2 -3 1 -2 -5 -1 0 0 -5 -3 -2 2
Z 0 0 1 3 -5 3 3 -1 2 -2 -3 0 -2 -5 0 0 -1 -6 -4 -2 2 3
A R N D C Q E G H I L K M F P S T W Y V B Z
PAM250 matrix
WR exchange is too large (due to paucity of data)
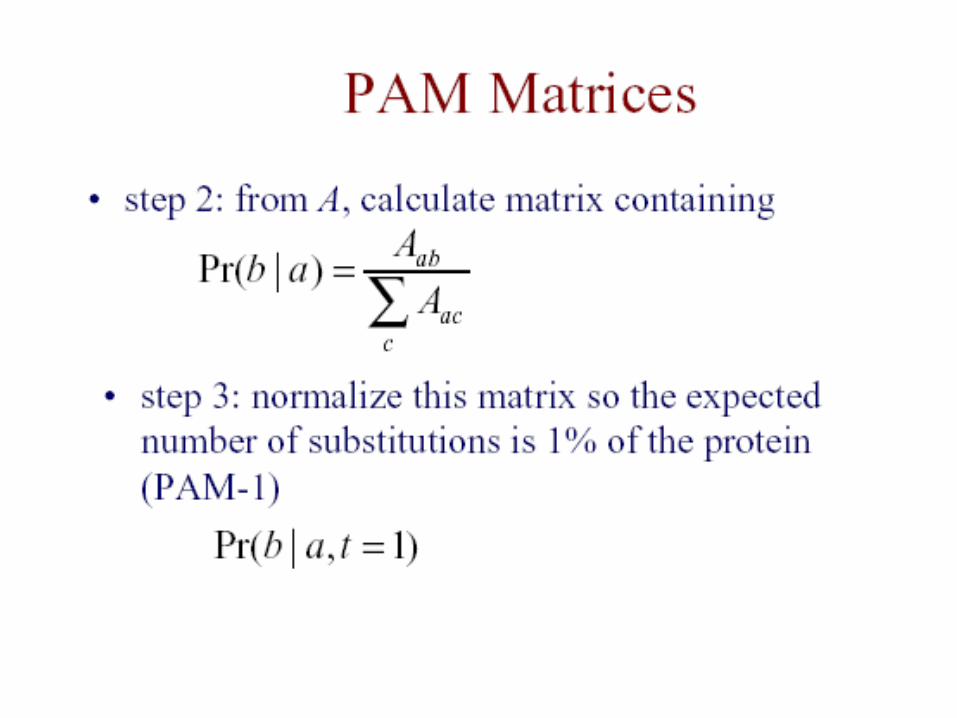
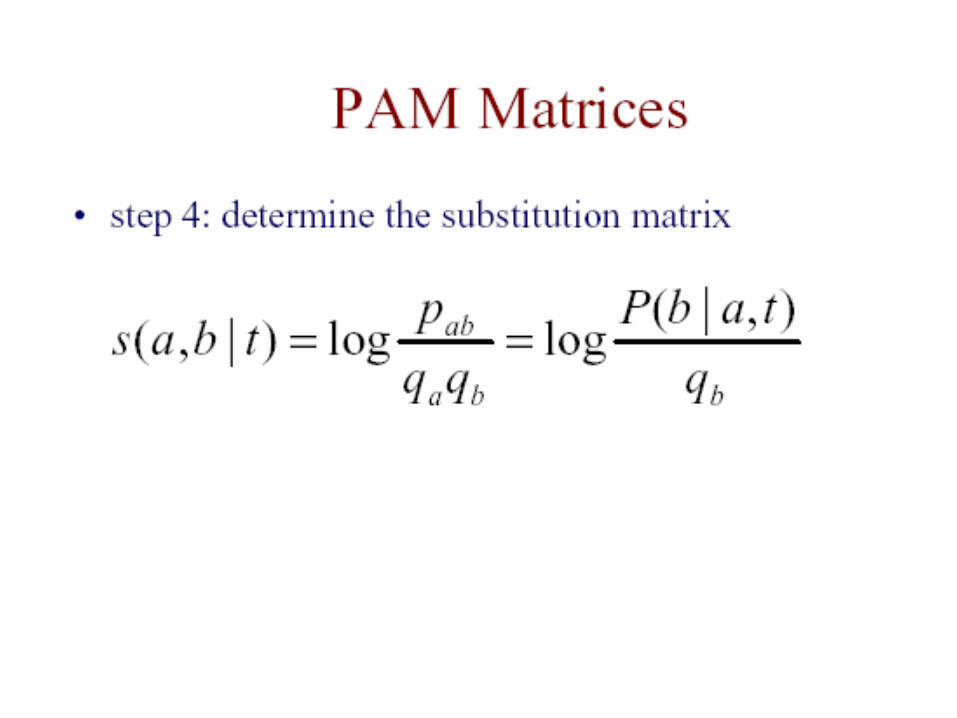
PAM model
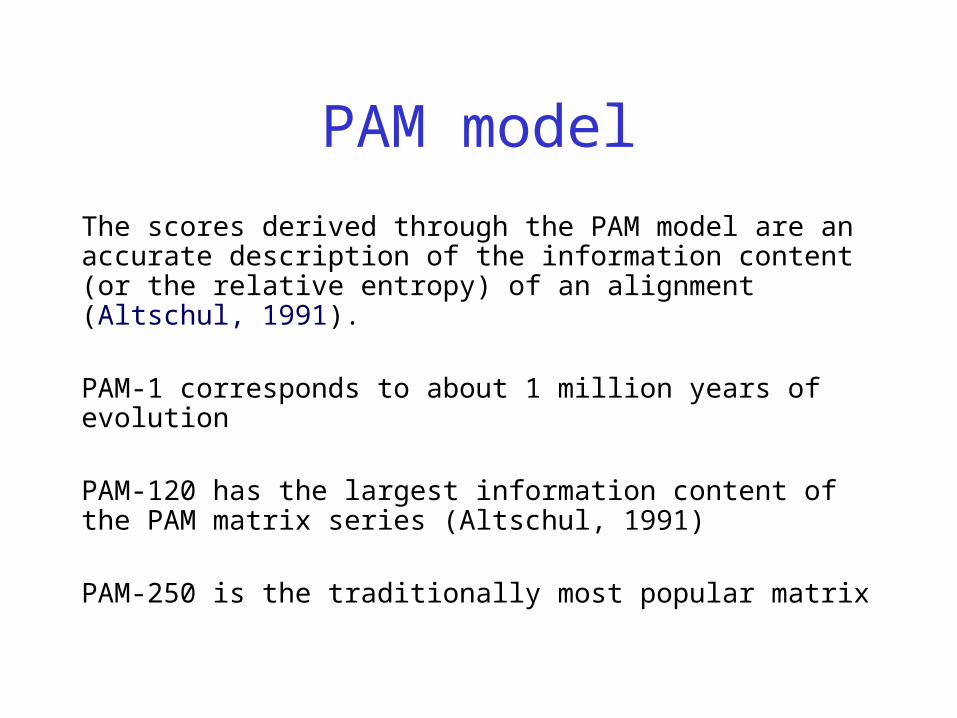
The scores derived through the PAM model are an accurate description of the information content (or the relative entropy) of an alignment (Altschul, 1991).
PAM-1 corresponds to about 1 million years of evolution
PAM-120 has the largest information content of the PAM matrix series (Altschul, 1991)
PAM-250 is the traditionally most popular matrix
Summary Dayhoff’s PAM-matricesSummary Dayhoff’s PAM-matrices
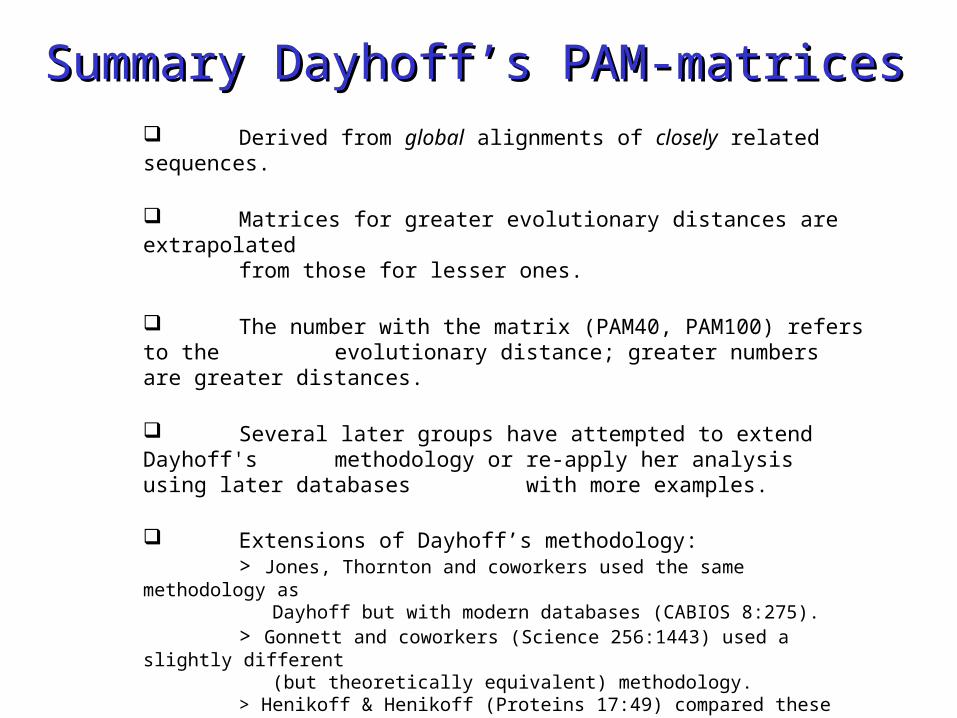
Derived from global alignments of closely related sequences.
Matrices for greater evolutionary distances are extrapolated from those for lesser ones.
The number with the matrix (PAM40, PAM100) refers to the evolutionary distance; greater numbers are greater distances.
Several later groups have attempted to extend Dayhoff's methodology or re-apply her analysis using later
databases with more examples.
Extensions of Dayhoff’s methodology: > Jones, Thornton and coworkers used the same methodology as Dayhoff but with modern databases (CABIOS 8:275). > Gonnett and coworkers (Science 256:1443) used a slightly different (but theoretically equivalent) methodology. > Henikoff & Henikoff (Proteins 17:49) compared these two newer versions of the PAM matrices with Dayhoff's originals.

The BLOSUM matricesThe BLOSUM matrices(BLOcks SUbstitution Matrix)(BLOcks SUbstitution Matrix)
The BLOSUM series of matrices were created by Steve Henikoff and colleagues (PNAS 89:10915).
Derived from local, un-gapped alignments of distantly related sequences.
All matrices are directly calculated; no extrapolations are used.
Again: the observed frequency of each pair is compared to the expected frequency (which is essentially the product of the frequencies of each residue in the dataset). Then: Log-odds matrix.
The Blocks DatabaseThe Blocks Database
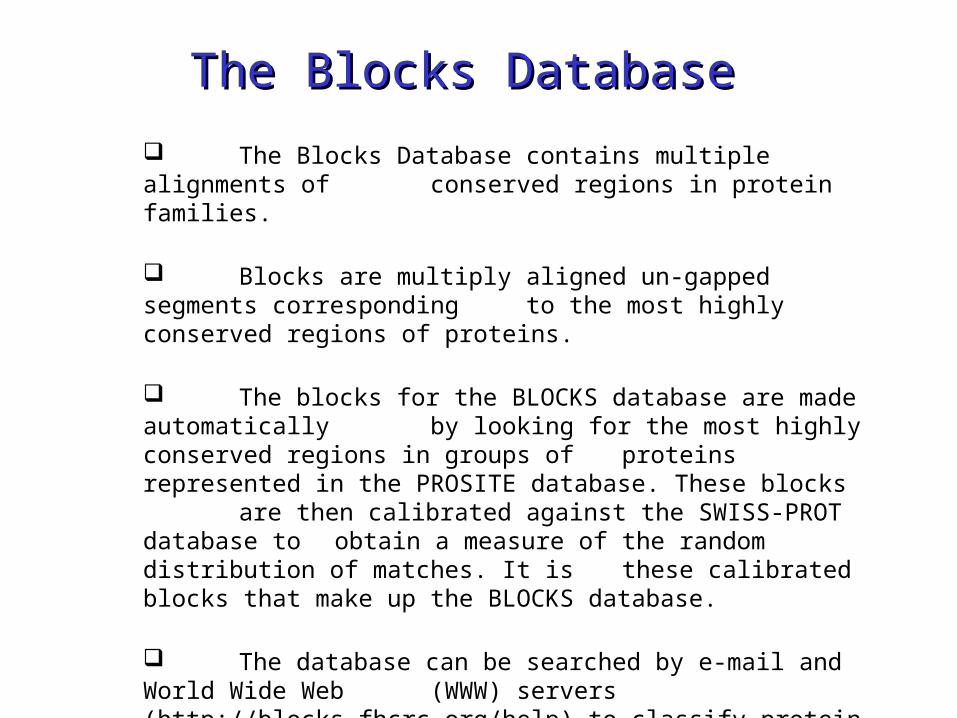
The Blocks Database contains multiple alignments of conserved regions in protein families.
Blocks are multiply aligned un-gapped segments corresponding to the most highly conserved regions of proteins.
The blocks for the BLOCKS database are made automatically by looking for the most highly conserved regions in groups of proteins represented in the PROSITE database. These blocks are then calibrated against the SWISS-PROT database to obtain a measure of the random distribution of matches. It is these calibrated blocks that make up the BLOCKS database.
The database can be searched by e-mail and World Wide Web (WWW) servers (http://blocks.fhcrc.org/help) to classify protein and nucleotide sequences.

The Blocks DatabaseThe Blocks Database
Gapless alignment blocks

The BLOSUM seriesThe BLOSUM series
BLOSUM30, 35, 40, 45, 50, 55, 60, 62, 65, 70, 75, 80, 85, 90.
The number after the matrix (BLOSUM62) refers to the minimum percent identity of the blocks (in the BLOCKS database) used to construct the matrix (all blocks have >=62% sequence identity);
No extrapolations are made in going to higher evolutionary distances
High number - closely related sequences Low number - distant sequences
BLOSUM62 is the most popular: best for general alignment.

BLOSUM62 Matrix, log-odds representation
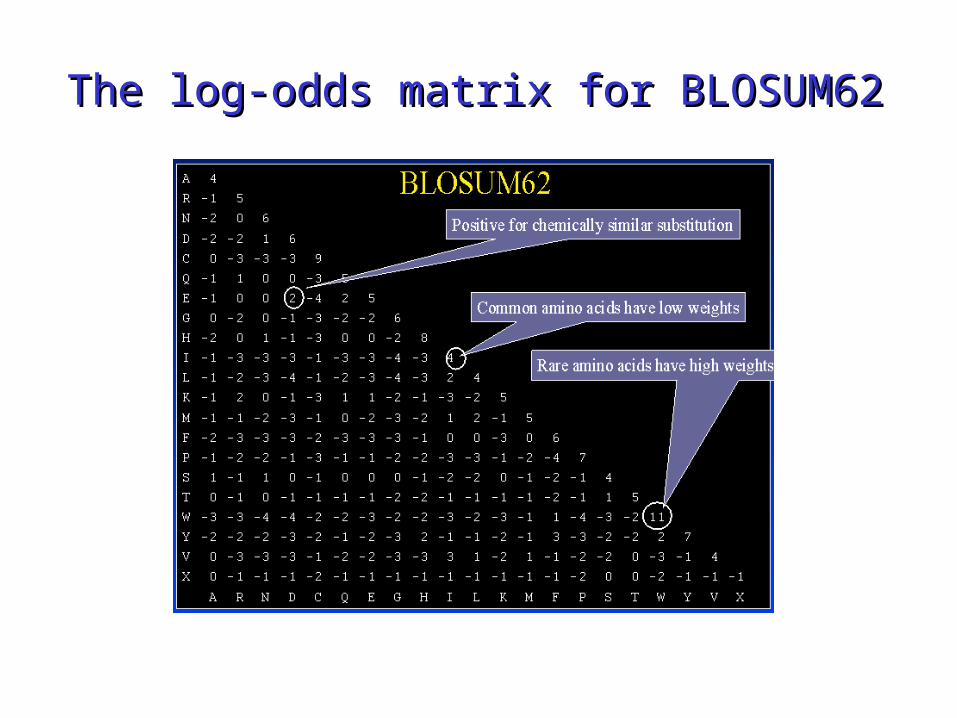
The log-odds matrix for BLOSUM62The log-odds matrix for BLOSUM62
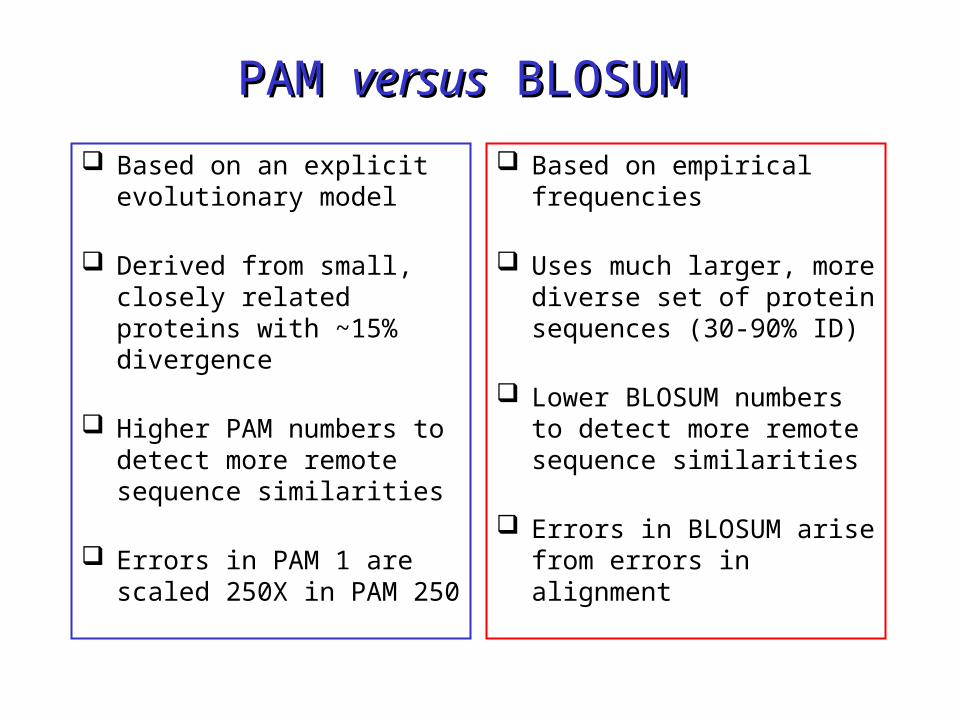
Based on an explicit evolutionary model
Derived from small, closely related proteins with ~15% divergence
Higher PAM numbers to detect more remote sequence similarities
Errors in PAM 1 are scaled 250X in PAM 250
Based on empirical frequencies
Uses much larger, more diverse set of protein sequences (30-90% ID)
Lower BLOSUM numbers to detect more remote sequence similarities
Errors in BLOSUM arise from errors in alignment
PAM PAM versusversus BLOSUM BLOSUM

Comparing exchange matricesComparing exchange matrices
To compare amino acid exchange matrices, the "Entropy" value can be used. This is a relative
entropy value (H) which describes the amount of information available per aligned residue pair.

Blosum Entropy PAM Entropy
30 0.1424 10 3.43
35 0.2111 50 2
40 0.2851 80 1.44
45 0.3795 100 1.18
50 0.4808 120 0.979
55 0.5637 180 0.591
60 0.6603 200 0.507
62 0.6979 250 0.354
65 0.7576 300 0.254
70 0.8391 350 0.186
75 0.9077 400 0.139
80 0.9868 450 0.105
85 1.0805 500 0.0803
90 1.1806
100 1.4516
To compare amino acid exchange matrices, the "Entropy" value can be used. This is a relative entropy value which describes the amount of information available per aligned residue pair. As two protein sequences diverge over time, information about the evolutionary process at work is lost (e.g. back mutations). Therefore, matrices with larger entropy values are more sensitive to less divergent sequences, while matrices with smaller entropy values are more sensitive to distantly related sequences.
Comparing exchange matrices

Specialized matricesSpecialized matrices
Claverie (J.Mol.Biol 234:1140) developed a set of substitution matrices designed explicitly for finding possible frameshifts in protein sequences.
These matrices are designed solely for use in protein-protein comparisons; they should not be used with programs which blindly translate DNA (e.g. BLASTX, TBLASTN).
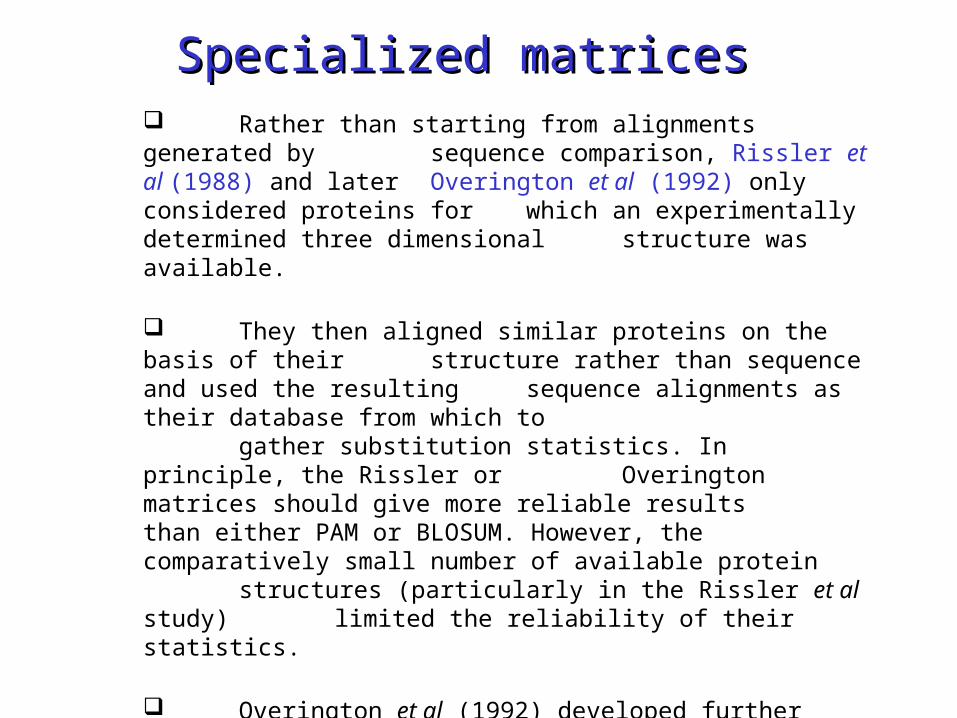
Specialized matricesSpecialized matrices Rather than starting from alignments generated by
sequence comparison, Rissler et al (1988) and later Overington et al (1992) only considered proteins for
which an experimentally determined three dimensional structure was available.
They then aligned similar proteins on the basis of their structure rather than sequence and used the resulting sequence alignments as their database from which to gather substitution statistics. In principle, the Rissler or Overington matrices should give more reliable results than either PAM or BLOSUM. However, the comparatively small number of available protein structures (particularly in the Rissler et al study) limited the reliability of their statistics.
Overington et al (1992) developed further matrices that consider the local environment of the amino
acids.