Embed Size (px)
Citation preview
1Mohammad Shahbaz & Naveed Aamir
WWW.SPDC.ORG.PK
PAKISTAN
Introduction The particular pioneering endeavor explores the impact of macroeconomic factors that influence the happiness of poor individuals of society in case of developing economy like Pakistan.
There is no particular literature relevant to our study but some studies explain the happiness decreasing factors in the society.
• Several studies found that current happiness of whole society influenced through economic growth of previous period directly and indirectly [Pollak, (1970); Eastern, (1974); Veenhoven, (1993); Clark and Oswald, (1994); Winkelmann and Winkelmann, (1998) and, Diener and Biswas-Diener, (1999)].
• Easterlin (1974) explained “Happiness scores carry no meaning, they are not comparable across people, people redefines their happiness scores over time, happiness should depend on health, environment, leisure and variables other than income”. Happiness is more a qualitative and subjective matter; nevertheless, it is not absolutely impossible to translate it into quantitative terms. No doubt, it keeps on changing with time and perception.
2Mohammad Shahbaz & Naveed Aamir

Blanchflower and Oswald (1997) explain the effects of unemployment on happiness and find strong negative effect not only in western countries but also transition countries. While, Veenhoven (1996) points out that there is usually a high positive correlation between satisfaction and education in low-income countries. • Moreover, in poor countries with higher rate of inflation poor people tend to show lower levels of well being than the rich people as inflation always hurts the people of the lower bracket. Especially in the emerging market economies, macroeconomic trends have quite a significant effect on individual’s life satisfaction reflecting level of happiness. Thus, the process of reforms must stabilize higher levels of inflation (Shahbaz, 2007).
• Trade-openness route is a very important mechanism to enhance the level of happiness of poor individuals in world because it not only tend to improve the incomes but also provide some additional resources in order to overcome the issue of poverty and hence raise the utility level [Winters, (2000); Nicolas, (2001) and David and Scott, 2005)]. Relevant literature reveals that a mixture of export-promotion and import- substitution policies can help a state to manage its poverty better that raises the happiness of poor segments of population in the society, rather than a solely inward or outward looking policy, since the states that have adopted either of these two (or both) policies have done to improve the happiness of poor compared to the other factors.
3Mohammad Shahbaz & Naveed Aamir
Another argument in favor of the beneficial effects of trade to raise the happiness level of deprived segment is put forward by Bhagwati and Srinivasan (2002); who pointed out that if a country wants to rely on free trade, it must maintain a framework of macroeconomic stability. Because stability implies low inflation, it is another channel through which trade influences the happiness of poor positively, since the satisfaction of poor tends to be hardest hit by high inflation (Bardhan, 2004).
4Mohammad Shahbaz & Naveed Aamir
B. METHODOLOGY
We employ Modified Auto Regressive Distributive Lag Model to investigate long run relationship and Error Correction Model for short run association using the bound testing.
The first advantage is that it can be applied irrespective of whether underlying regressors are purely I(0), purely I(1) or mutually co-integrated (Pesaran and Pesaran, 1999).
The second advantage of using the bounds testing, it performs better than Engle and Granger (1987), Johansen (1990) and Philips and Hansen (1990) Co-integration test in small samples (see e.g. Haug, 2002).
5Mohammad Shahbaz & Naveed Aamir
The third advantage of this approach is that, the model takes sufficient number of lags to capture the data generating process in a general-to-specific modeling framework (Laurenceson and Chai, 2003).
6Mohammad Shahbaz & Naveed Aamir

C. DATA PERIOD
Study utilizes annual time series data covering the period from 1973 to 2006. We have obtained data from World Development Indicators (WDI, 2006), International Financial Statistics (IFS, 2006) and Economic Survey (various issues).
7Mohammad Shahbaz & Naveed Aamir
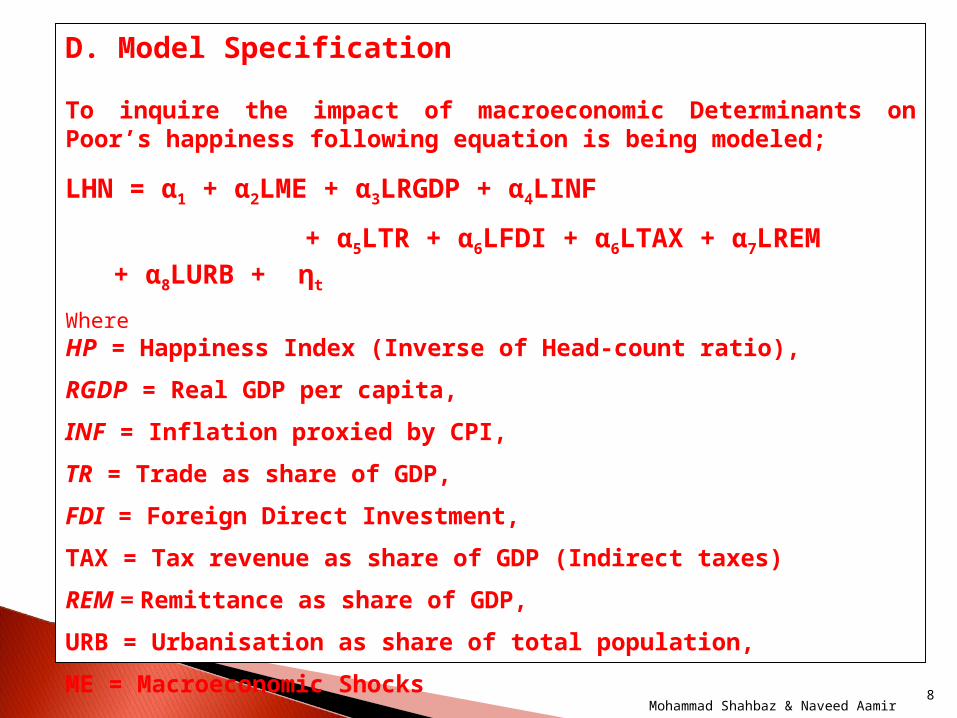
D. Model Specification
To inquire the impact of macroeconomic Determinants on Poor’s happiness following equation is being modeled;
LHN = α1 + α2LME + α3LRGDP + α4LINF
+ α5LTR + α6LFDI + α6LTAX + α7LREM + α8LURB + ηt
WhereHP = Happiness Index (Inverse of Head-count ratio),
RGDP = Real GDP per capita,
INF = Inflation proxied by CPI,
TR = Trade as share of GDP,
FDI = Foreign Direct Investment,
TAX = Tax revenue as share of GDP (Indirect taxes)
REM = Remittance as share of GDP,
URB = Urbanisation as share of total population,
ME = Macroeconomic Shocks
8Mohammad Shahbaz & Naveed Aamir
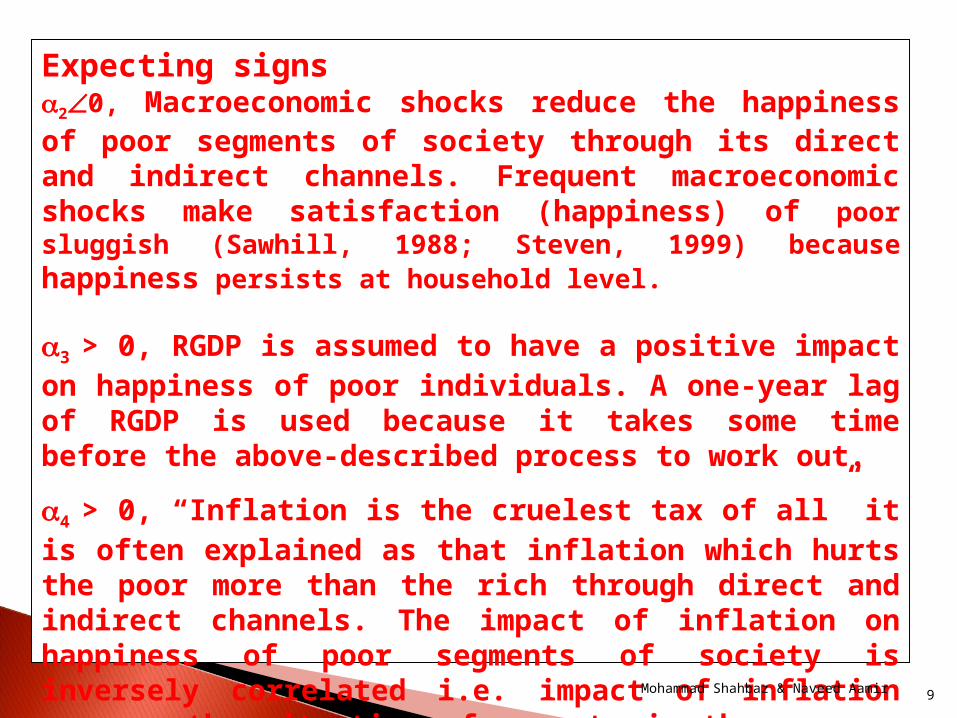
Expecting signs20, Macroeconomic shocks reduce the happiness of poor segments of society through its direct and indirect channels. Frequent macroeconomic shocks make satisfaction (happiness) of poor sluggish (Sawhill, 1988; Steven, 1999) because happiness persists at household level.
3 > 0, RGDP is assumed to have a positive impact on happiness of poor individuals. A one-year lag of RGDP is used because it takes some time before the above-described process to work out.
4 > 0, “Inflation is the cruelest tax of all” it is often explained as that inflation which hurts the poor more than the rich through direct and indirect channels. The impact of inflation on happiness of poor segments of society is inversely correlated i.e. impact of inflation worsens the situation of poverty in the economy and obvious levels of happiness of poor.
9Mohammad Shahbaz & Naveed Aamir

5>0, Trade-openness enhances the happiness of bottom 20 % population through consumer surplus and export oriented policies alongwith improvement in productivity by adopting the new technologies.
6>0 or 6<0, The effects of foreign direct investment on poor’s happiness depend on the policies of the country but in the case of developing country like Pakistan it has large potential to increase happiness of poor through reduction in poverty levels from foreign direct investment.
6<0, Indirect taxes decline the levels of poor’s happiness. More indirect tax means more inflation, which hurts the poor inhabitants more as compared to rich individuals.
10Mohammad Shahbaz & Naveed Aamir
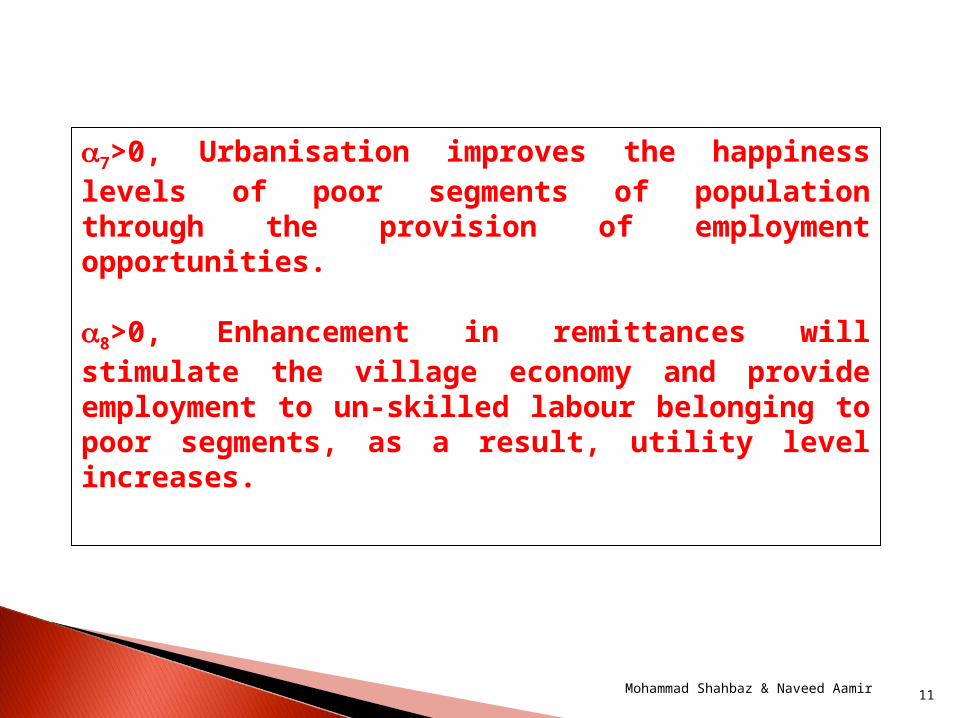
7>0, Urbanisation improves the happiness levels of poor segments of population through the provision of employment opportunities.
8>0, Enhancement in remittances will stimulate the village economy and provide employment to un-skilled labour belonging to poor segments, as a result, utility level increases.
11Mohammad Shahbaz & Naveed Aamir
-20
-10
0
10
20
30
12Mohammad Shahbaz & Naveed Aamir
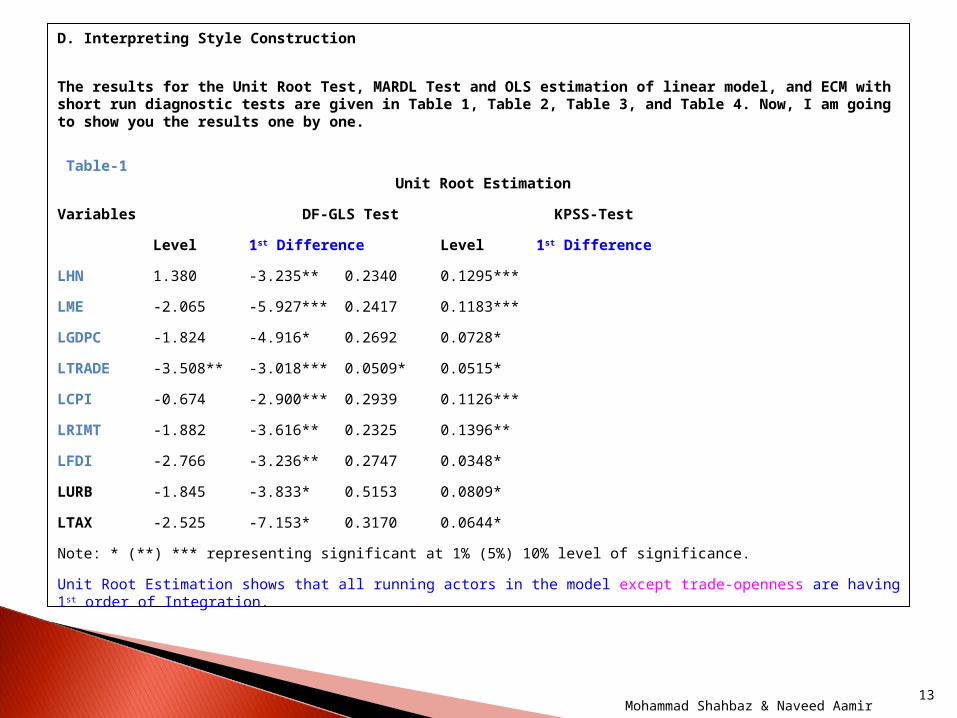
D. Interpreting Style Construction
The results for the Unit Root Test, MARDL Test and OLS estimation of linear model, and ECM with short run diagnostic tests are given in Table 1, Table 2, Table 3, and Table 4. Now, I am going to show you the results one by one.
Table-1 Unit Root Estimation
Variables DF-GLS Test KPSS-Test
Level 1st Difference Level 1st Difference
LHN 1.380 -3.235** 0.2340 0.1295***
LME -2.065 -5.927*** 0.2417 0.1183***
LGDPC -1.824 -4.916* 0.2692 0.0728*
LTRADE -3.508** -3.018*** 0.0509* 0.0515*
LCPI -0.674 -2.900*** 0.2939 0.1126***
LRIMT -1.882 -3.616** 0.2325 0.1396**
LFDI -2.766 -3.236** 0.2747 0.0348*
LURB -1.845 -3.833* 0.5153 0.0809*
LTAX -2.525 -7.153* 0.3170 0.0644*
Note: * (**) *** representing significant at 1% (5%) 10% level of significance.
Unit Root Estimation shows that all running actors in the model except trade-openness are having 1st order of Integration.
13Mohammad Shahbaz & Naveed Aamir

Table-3
MARDL OLS Regression Results
Dependent Variable: LHN
Variable Co-efficient t-values Inst-values
Constant 0.4560 1.719 0.0990
LME -1.0182 -71.912 0.0000
LGDP(-1) - 0.0800 -2.736 0.0118
LINF - 0.0442 -3.680 0.0012
LTR 0.1075 5.544 0.0000
LREM 0.0145 6.258 0.0000
LTAX - 0.0774 -2.512 0.0194
LFDI - 0.0048 -1.244 0.2259
LURB 0.0124 0.274 0.7865
R-squared = 0.99914
S.E. of regression =0.0074
Log likelihood = 116.6737
Durbin-Watson stat = 2.167* Adjusted R2 = 0.99884
Akaike criterion =-6.7296
Schwarz criterion =-6.3173
F-statistic = 3358.883
14Mohammad Shahbaz & Naveed Aamir

Table-4
ECM Version of MARDL ApproachDependent Variable: LHNΔ
Variables Co-efficient Std. Error Inst.value*
Constant 0.0023 0.0033 0.5035
ΔLME -1.0401 0.0254 0.0000
ΔLINF -0.1148 0.0379 0.0067
ΔLGDP(-1) 0.0628 0.0305 0.0530
ΔLFDI -0.00023 0.0022 0.9195
ΔLREM 0.0086 0.0031 0.0106
ΔLTAX -0.0401 0.0194 0.0519
ΔLTAX(-1) 0.0443 0.0184 0.0255
ΔTR 0.0721 0.0117 0.0000
ΔLURB 0.1377 0.0339 0.0006
ECT(-1) -1.4081 0.2084 0.0000
R-squared = 0.99036
Adjusted R-squared = 0.98554
Akaike info criterion = -7.31181
Schwarz criterion = -6.80298
Durbin-Watson stat = 1.80616
F-statistic = 205.51
*Instability: Value means probability value or significance level.
15Mohammad Shahbaz & Naveed Aamir

Sensitivity Analysis of short run (ECM) ModelSerial Correlation LM, F = 0.614 (0.44)
ARCH Test = 0.855 (0.85)
Normality J-B Value = 4.30 (0.12)
Heteroscedisticity Test, F = 0.529 (0.42)
Ramsey RESET Test, F =0.835 (0.79)Figure-2 Plot of Cumulative Sum of Recursive Residuals
The straight lines represent critical bounds at 5% significance level.
Figure-3 Plot of Cumulative Sum of Squares of Recursive Residuals
The straight lines represent critical bounds at 5% significance level.
16Mohammad Shahbaz & Naveed Aamir
-8
-4
0
4
8
2001 2002 2003 2004 2005 2006
CUSUM 5% Significance
-0.4
0.0
0.4
0.8
1.2
1.6
2001 2002 2003 2004 2005 2006
CUSUM of Squares 5% Significance
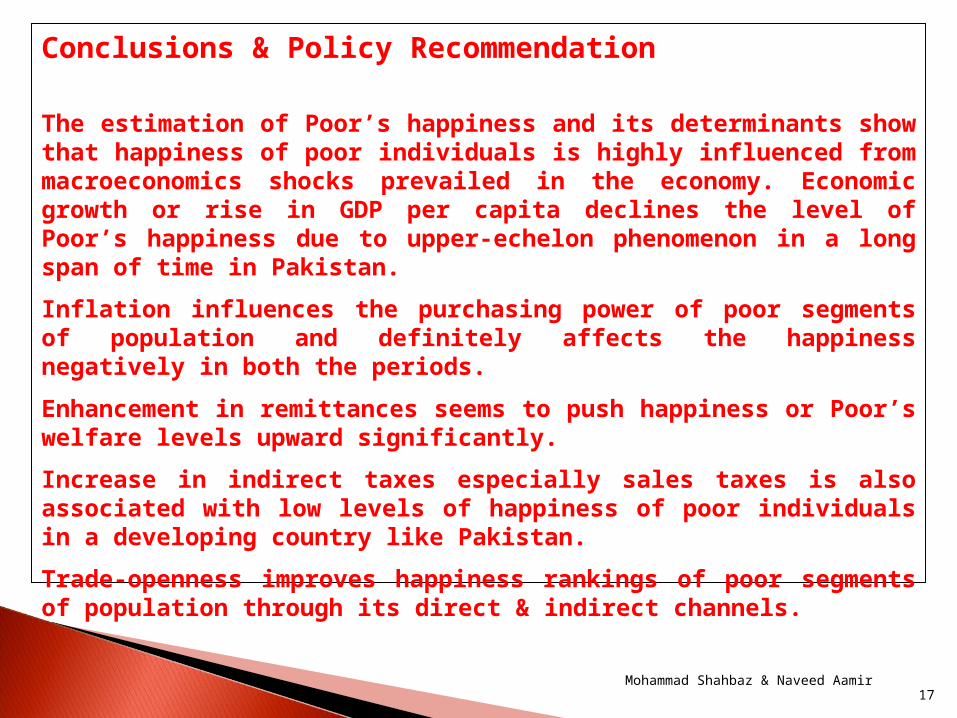
Conclusions & Policy Recommendation
The estimation of Poor’s happiness and its determinants show that happiness of poor individuals is highly influenced from macroeconomics shocks prevailed in the economy. Economic growth or rise in GDP per capita declines the level of Poor’s happiness due to upper-echelon phenomenon in a long span of time in Pakistan.
Inflation influences the purchasing power of poor segments of population and definitely affects the happiness negatively in both the periods.
Enhancement in remittances seems to push happiness or Poor’s welfare levels upward significantly.
Increase in indirect taxes especially sales taxes is also associated with low levels of happiness of poor individuals in a developing country like Pakistan.
Trade-openness improves happiness rankings of poor segments of population through its direct & indirect channels.
17Mohammad Shahbaz & Naveed Aamir
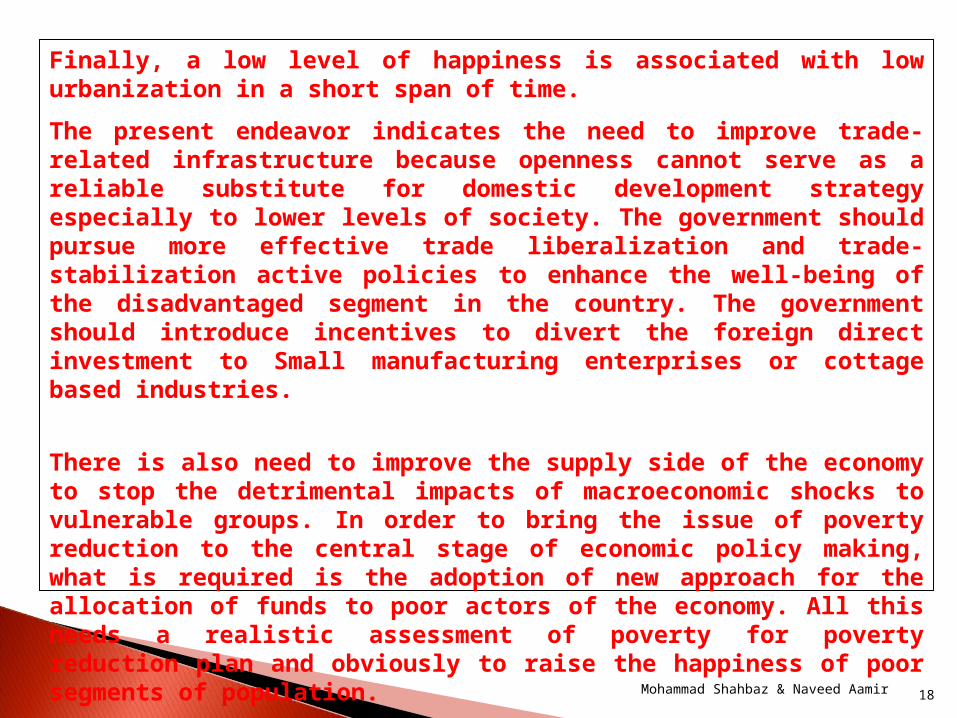
Finally, a low level of happiness is associated with low urbanization in a short span of time.
The present endeavor indicates the need to improve trade-related infrastructure because openness cannot serve as a reliable substitute for domestic development strategy especially to lower levels of society. The government should pursue more effective trade liberalization and trade-stabilization active policies to enhance the well-being of the disadvantaged segment in the country. The government should introduce incentives to divert the foreign direct investment to Small manufacturing enterprises or cottage based industries.
There is also need to improve the supply side of the economy to stop the detrimental impacts of macroeconomic shocks to vulnerable groups. In order to bring the issue of poverty reduction to the central stage of economic policy making, what is required is the adoption of new approach for the allocation of funds to poor actors of the economy. All this needs a realistic assessment of poverty for poverty reduction plan and obviously to raise the happiness of poor segments of population.
18Mohammad Shahbaz & Naveed Aamir
EndTake Care, Good Bye
and Allah Hafiz
19Mohammad Shahbaz & Naveed Aamir