Embed Size (px)
Citation preview
1
Microeconomic Foundations of the Economic Theory of Innovation:
Competition and Innovation
B. Verspagen, 2005The Economics of Technological
ChangeChapter 4
2
Introduction
• Schumpeterian hypotheses: the relationship between market structure and R&D intensity
• Innovation and R&D are mainly taking place in large monopolized firms
• R&D intensity is higher for large firms and for firms with a high degree of monopoly power– Demand pull perspective: large firms tend to supply to
a larger part of the market and posses superior knowledge about buyers’ preferences
– Technology push perspective: large firms have more means to finance R&D from internal sources and employ more scientists and engineers (importance on basic R&D)
3
Introduction
• Why Schumpeterian hypotheses are of interest?• Different implications for static and dynamic efficiency of
an economy• Static efficiency: fixed technology
– Monopoly may lead to welfare losses due to high prices charged– Static welfare loss by the loss of the consumer surplus: these
losses are minimized under a fully competitive market structure
• Dynamic efficiency: endogenously generated technologies within the economy– An innovation will result in more consumer surplus if it leads to
lower prices or higher product quality: welfare gains from innovation
4
Incentives to innovate
• Profits are the prime motivation for a firm to innovate• How much profits a firm can expect from an innovation
partly depends on its market position• Consider a process innovation that lowers the marginal
production costs• For monopoly: find the amount a firm would be willing to
pay for license of the patent on the innovation– Demand evaluated at monopolist’s optimal price
• For competitive market: by buying the license, the firm will become a monopolist in the market and whether or not it will charge the monopoly price depends on whether the innovation is drastic or minor– Demand evaluated at the pre-innovation marginal production
costs
5
Incentives to innovate
• Competitive market– For minor innovation, the extra profits from the innovation for a
competitive firm are larger than those for a monopolist– For drastic innovation, a monopolist and a competitive firm will
earn identical profits after innovation, because the competitive firm becomes a de facto monopolist after adopting the innovation
• The incentive of competitive firm to introduce the innovation is larger than the incentive of a monopolist– Kenneth Arrow: the replacement effect
• A competitive firm has nothing to loose and hence only to gain from introducing an innovation, while a monopolist is replacing herself and hence has current profits to loose
6
Incentives and R&D spending: patent races
• The role of incentives in the relationship between market structure and R&D expenditures
• A number of firms is simultaneously trying to develop the same innovation
• By raising its R&D expenditure, a firm may increase its chance of making the innovation sooner
• Only the firm that makes the invention first will receive the patent
• Two different models relating to differences in market structure– Threatened monopoly: existing monopolies controls the industry
and the monopolist races with one firm that is currently not operating in the industry
– Symmetric: there are n firms, neither of which holds a more advantageous position than any of the others
7
Incentives and R&D spending: patent races
Threatened monopoly• Spending more on R&D increases the probability of being first• Patent race between a monopolist in an industry and an outside firm• The replacement effect states that a monopolist will have less
incentive to innovate than a potential entrant, because the monopolist is replacing herself
• The efficiency effect states that a monopolist can always earn at least as much profits as two duopolists together would be able to earn– In the case of minor innovation, the monopolist will also stay in
the market and a duopoly results– In case of drastic innovation, a monopolist will invest less in R&D
than a potential entrant– In case of minor innovation, the monopolist may have a higher
incentive to innovate and hence spend more on R&D
8
Incentives and R&D spending: patent races
Symmetric patent races• All firms are equal and they are all potential
entrants in an industry• When the number of firms in the industry
increases, R&D spending per firm goes up, until the point is reached where R&D is no longer profitable
• Compared to a single monopolist, any number of decentralized firms together will spend more on R&D due to rivalry and duplication in R&D process
9
Patent races as a common pool problem
• An individual firm has a clear incentive to innovate for investing more R&D as the number of rivals goes up
• This will raise the probability of winning the race compared to the situation of not increasing R&D spending
• From aggregate point of view, increased spending shortens the expected innovation date and this raises the total pay-off of the innovation because it reduces the negative impact of discounting
• The increased spending that occurs as a reaction of an increased number of participants is wasteful
• “Common pool problem” – Entry of an additional firm in the patent race lowers the
probability of all firms to win the race and it also drives up the costs
10
Technological regimes: Schumpeter revisited
• Rationality and availability of information on the part of firms making investments in R&D– Know exactly the relationship between their R&D investment and
the (expected) cost reductions resulting from innovation– Know the actions of their competitors, and to include this in their
own decisions
• The only uncertainty is the relationship between R&D expenditures and innovative success (weak uncertainty)
• If not rely on the assumption of weak uncertainty? (strong uncertainty)
• Nelson and Winter (1982) model presenting how market structure and R&D intensity co-evolve under different technological regimes
11
Technological regimes: Schumpeter revisited
• Technological regime relates to the possible sources of knowledge that a firm may use to develop an innovation
• Internal and external sources:– Internal: R&D departments, production and marketing
departments as well– External: competitors (imitated), firms in other
business lines but with related technologies, public and semi-public institutes (universities)
• Technological regime as the set of conditions that determine how important these different sources of knowledge are relative to each other
12
Technological regimes: Schumpeter revisited
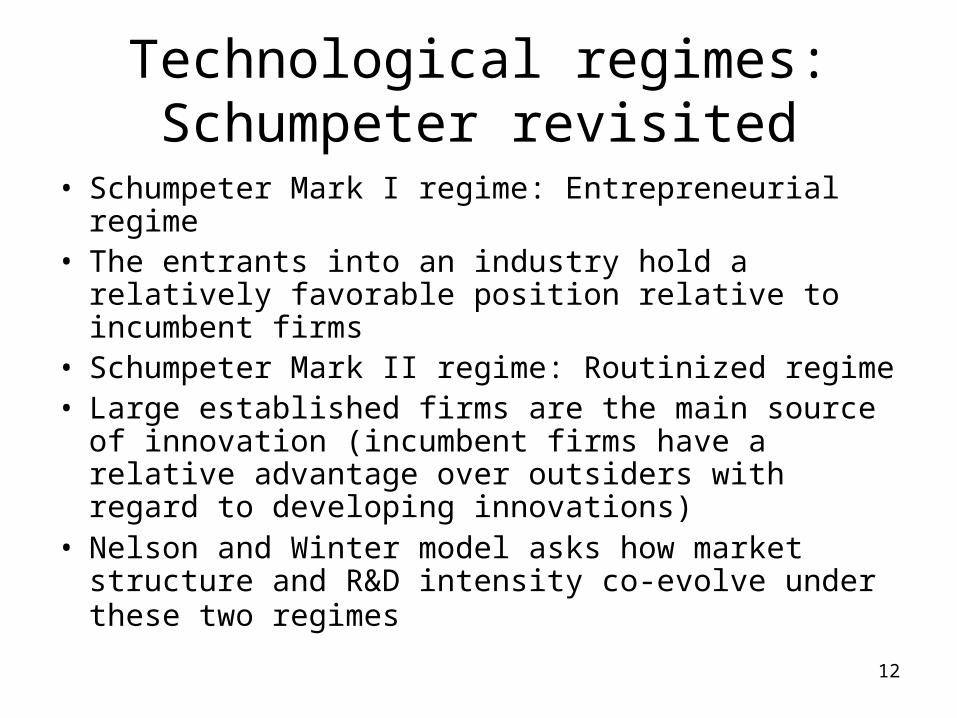
• Schumpeter Mark I regime: Entrepreneurial regime• The entrants into an industry hold a relatively
favorable position relative to incumbent firms• Schumpeter Mark II regime: Routinized regime• Large established firms are the main source of
innovation (incumbent firms have a relative advantage over outsiders with regard to developing innovations)
• Nelson and Winter model asks how market structure and R&D intensity co-evolve under these two regimes
13
Technological regimes: Schumpeter revisited
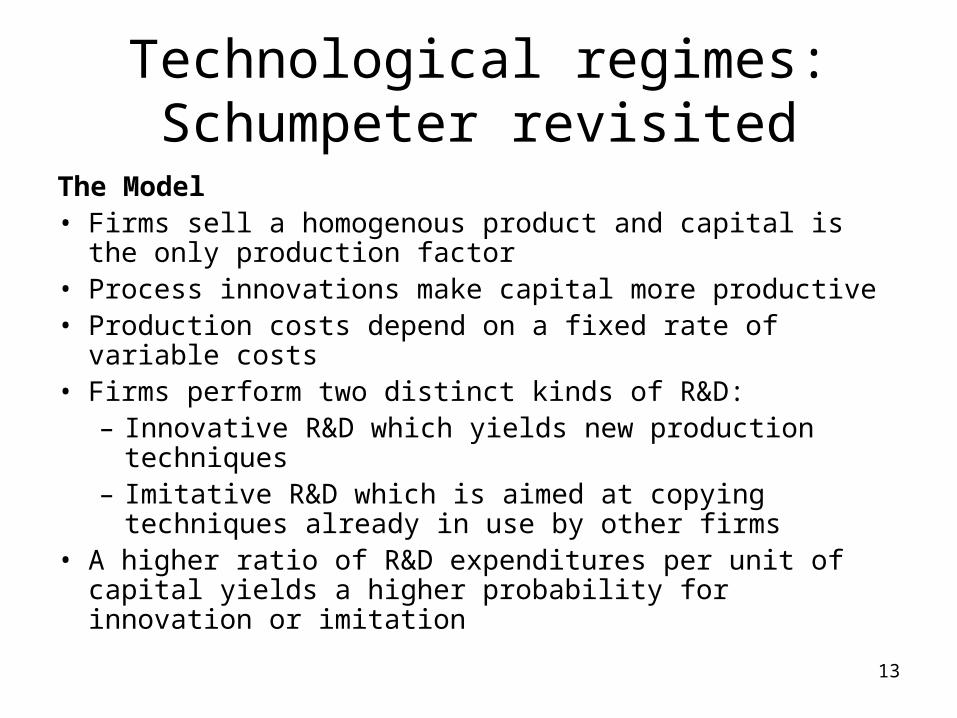
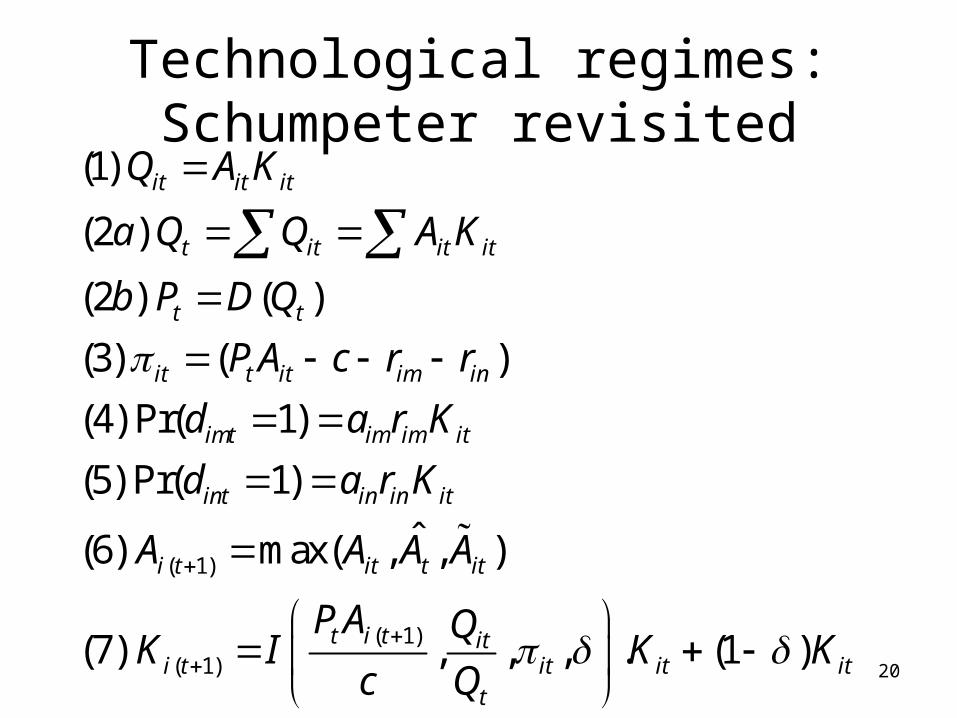
The Model• Firms sell a homogenous product and capital is the only
production factor• Process innovations make capital more productive• Production costs depend on a fixed rate of variable costs• Firms perform two distinct kinds of R&D:
– Innovative R&D which yields new production techniques
– Imitative R&D which is aimed at copying techniques already in use by other firms
• A higher ratio of R&D expenditures per unit of capital yields a higher probability for innovation or imitation
14
Technological regimes: Schumpeter revisited
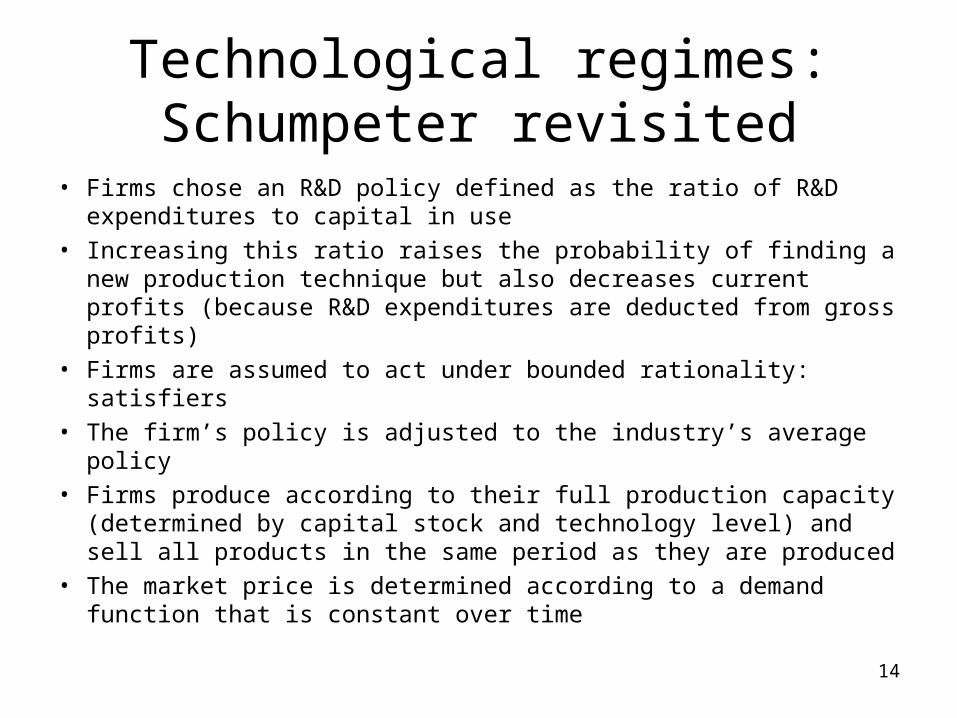
• Firms chose an R&D policy defined as the ratio of R&D expenditures to capital in use
• Increasing this ratio raises the probability of finding a new production technique but also decreases current profits (because R&D expenditures are deducted from gross profits)
• Firms are assumed to act under bounded rationality: satisfiers
• The firm’s policy is adjusted to the industry’s average policy
• Firms produce according to their full production capacity (determined by capital stock and technology level) and sell all products in the same period as they are produced
• The market price is determined according to a demand function that is constant over time
15
Technological regimes: Schumpeter revisited
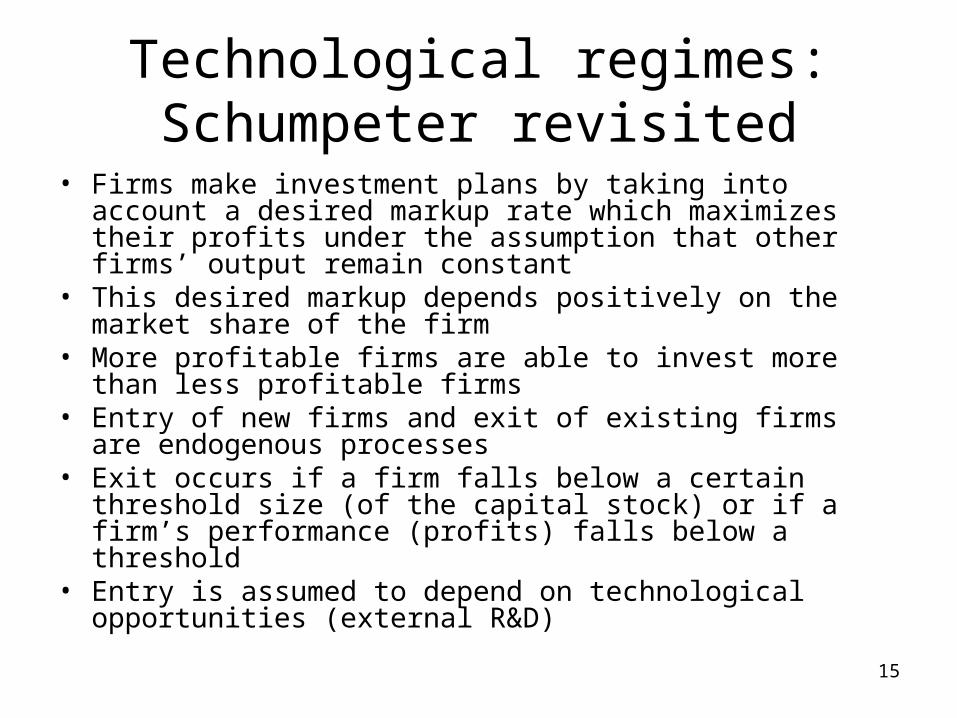
• Firms make investment plans by taking into account a desired markup rate which maximizes their profits under the assumption that other firms’ output remain constant
• This desired markup depends positively on the market share of the firm
• More profitable firms are able to invest more than less profitable firms
• Entry of new firms and exit of existing firms are endogenous processes
• Exit occurs if a firm falls below a certain threshold size (of the capital stock) or if a firm’s performance (profits) falls below a threshold
• Entry is assumed to depend on technological opportunities (external R&D)
16
Technological regimes: Schumpeter revisited
• The entrepreneurial and routinized regimes differ in two respects
• First difference: The efficiency of innovative R&D differs
• The entrepreneurial regime will yield a lower probability for innovation
• The probability of innovative entry would be lower under the entrepreneurial regime
• A higher amount of external R&D under the entrepreneurial regime
17
Technological regimes: Schumpeter revisited
• Second difference: Productivity levels corresponding to innovations
• Under the entrepreneurial regime, innovation draws are made from a random distribution with steadily growing mean (called latent productivity)
• Entrants draw their innovations from the same distribution as incumbent firms
• The routinized regime uses a similar distribution, but the mean of the distribution is equal to the average of the firm’s current productivity and latent productivity
18
Technological regimes: Schumpeter revisited
• Under the routinized regime, the distribution’s mean for entrants’ innovative draws is equal to the average of latent productivity and a base level productivity parameter that remains constant over time
• Under the routinized regime, innovation depends not only on external science but also on firm’s own experience
• Entry by innovation (new production techniques) will become much more difficult when the industry grows older in this regime
19
Technological regimes: Schumpeter revisited
• The rates of (innovative) entry will differ between the routinized and entrepreneurial regimes
• Differences between two regimes in terms of entry and market structure due to assumptions
• However, R&D intensity or profit rate are completely endogenous
• Simulation technique
20
Technological regimes: Schumpeter revisited
( 1)
( 1)( 1)
(1)
(2 )
(2 ) ( )
(3) ( )
(4) Pr( 1)
(5) Pr( 1)
ˆ(6) max( , , )
(7) , , , . (1 )
it it it
t it it it
t t
it t it im in
imt im im it
int in in it
i t it t it
t i t iti t it it it
t
Q A K
a Q Q A K
b P D Q
PA c r r
d a r K
d a r K
A A A A
PA QK I K K
c Q
21
Technological regimes: Schumpeter revisited
• Under the routinized regime, both the number of imitations and innovations is higher than under the entrepreneurial regime
• Under the entrepreneurial regime, the number of innovations stagnates relative to the number of imitations, whereas under the routinized regime, these two variables grow more or less along the same path
• Under both regimes, entry stagnates in the long run, but under the entrepreneurial regime, imitative entry is clearly higher than innovative entry
• For the routinized regime, the levels of both types of entry are more or less the same
22
Technological regimes: Schumpeter revisited
• Measures of market structure: the number of firms, the Herfindahl N and C4 measure
• The Herfindahl N indicator is defined as the inverse of the sum of squared market shares of all firms– This indicator is high when the market is competitive
(many relatively small firms) and low when the market is concentrated (monopolistic)
• The C4 indicator is defined as the sum of the market share of the four largest firms– This indicator is high for monopolistic markets
• After an initial phase of adjustment, the market structure indicators for the entrepreneurial regime do not show a clear trend, but fluctuate around a more or less stable level
• In the routinized regime, there is a clear tendency for the market to become more monopolized over time
23
Technological regimes: Schumpeter revisited
The results for batch runs• The routinized regime shows significantly more
monopolistic market structure towards the second half of the simulation period, but the reverse is true for the period just after the initialization
• Average age of firms is higher for the routinized regime• The profit rate is higher for the entrepreneurial regime
initially but later it is higher for the routinized regime• Total R&D expenditures are higher under the routinized
regime, but this is the result of higher innovative R&D expenditures
• Imitative R&D expenditures are lower for the routinized regime
24
Technological regimes: Schumpeter revisited
• These results confirm the Schumpeterian hypotheses: R&D intensity is higher in industries that are monopolistic
• This finding is not the result of a one-way causal interaction from market structure to R&D expenditures as in the simple Schumpeterian literature
• Market structure and R&D intensity co-evolve under the influence of exogenous differences in the knowledge base
• While innovative R&D is higher for market structures that are relatively monopolistic, the reverse holds for imitative R&D
25
Conclusions
• The investigation of the relationship between market structure and R&D expenditures
• Schumpeterian hypotheses that large firms with a high degree of monopoly power tend to spend more on R&D than small firms that operate on a competitive basis
• The patent race models tend to stress the role of incentives on the decision on how much to invest in R&D:– A patent race between an incumbent monopolist and a
challenging potential entrant– A patent race between a number n of equal rivals
• The evolutionary model dealing with the issue of technology regimes co-evolving
26
Conclusions
The patent race models:• First case: the impact of monopoly power on R&D
expenditures depends on the size of the expected innovation
• In case of drastic innovations, the potential entrant will spend more on R&D than the incumbent monopolist, while the reverse is true for minor innovations
• In the case of drastic innovations, the losses for the monopolist due to the replacement effect are relatively large
• The impact of monopoly power on R&D expenditures depends on factors such as the size of the innovation
27
Conclusions
The patent race models:• Second case: a symmetric race is analyzed and it
underlies the possibility that due to competition between firms, R&D expenditures of each individual firm may rise
• This goes against the Schumpeterian hypothesis of a positive relation between size and monopoly power and R&D expenditures
• The spiral higher R&D expenditures due to stronger competition must break down at the point where the higher R&D costs reduce overall profitability
• Competition again has a negative effect on R&D spending ( a non-monotonic relationship)
28
Conclusions
The evolutionary model • Dealing with the issue of technology regimes• Differences in the knowledge base underlying different
industries may lead to both differences in market structure and R&D spending
• Whether or not monopolistic market structure tend to go with higher R&D expenditures depends on whether one considers innovative R&D or imitative R&D
• The imitative R&D tends to be higher in competitive markets, the innovative R&D in monopolistic markets
• This conclusion that the relationship between market structure and R&D expenditures may differ with the type of innovations is in accordance with the result from the asymmetric patent race model
29
Conclusions
• No obvious relation between market structure and innovation
• The causality of this relationship goes both ways: market structure determines R&D expenditures and vice versa
• Which combinations of market structure and R&D intensity will result depends on the size of the innovations or the characteristics of the knowledge base