Embed Size (px)
Citation preview
1
Measuring U.S. Innovative Activities
2008 World Congress on NAEP Measures for Nations
Washington, DC
May 16, 2008
B.K. Atrostic, Senior EconomistCenter for Economic Studies, U.S. Census Bureau
2
Disclaimer
The views expressed in this presentation are those of the author and not necessarily those of the U.S. Census Bureau.
3
Overview
• Importance of Measuring Innovative Activity
• Allocating Scarce Statistical Resources
• Definitions
• U.S.: Data & Lessons Learned
• Other Countries: Data & Lessons Learned
• Critical U.S. Data Gaps – Identifying and Filling
• Innovative Activities and Intangibles
4
Why Measure Innovative Activity?
• Identify sources of new goods and services
• Identify sources of total factor productivity, growth, other economic outcomes
5
Measuring Innovative Activity and Its Impact
• Innovation surveys – European countries, Canada, Australia, many
other countries– Georgia, for the U.S.
• Fill key gaps in core microdata needed to analyze economic performance
6
Scarce Statistical System Resources
• Focus on U.S. Census Bureau Data Collections– Dollars– Expertise / core competencies– Respondent burden / cooperation
7
Filling Gaps in Core Data
• Longitudinal data are critical Without longitudinal data, it is hard to rule out the
possibility that a measure of innovative activity merely proxies for something omitted from or measured poorly in the core data.
• Similar issues in developing new measures of effects of information technology on economic performance
• Neither innovation survey nor more systematic data on innovative activity would fill core data gaps
8
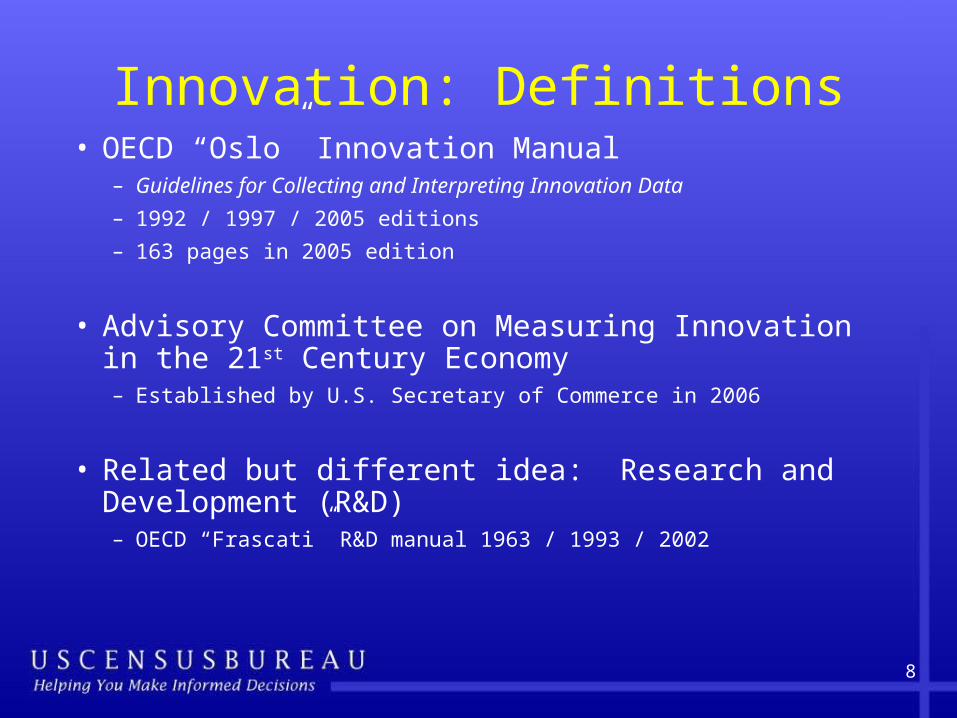
Innovation: Definitions• OECD “Oslo” Innovation Manual
– Guidelines for Collecting and Interpreting Innovation Data
– 1992 / 1997 / 2005 editions
– 163 pages in 2005 edition
• Advisory Committee on Measuring Innovation in the 21st Century Economy– Established by U.S. Secretary of Commerce in 2006
• Related but different idea: Research and Development (R&D)– OECD “Frascati” R&D manual 1963 / 1993 / 2002
9
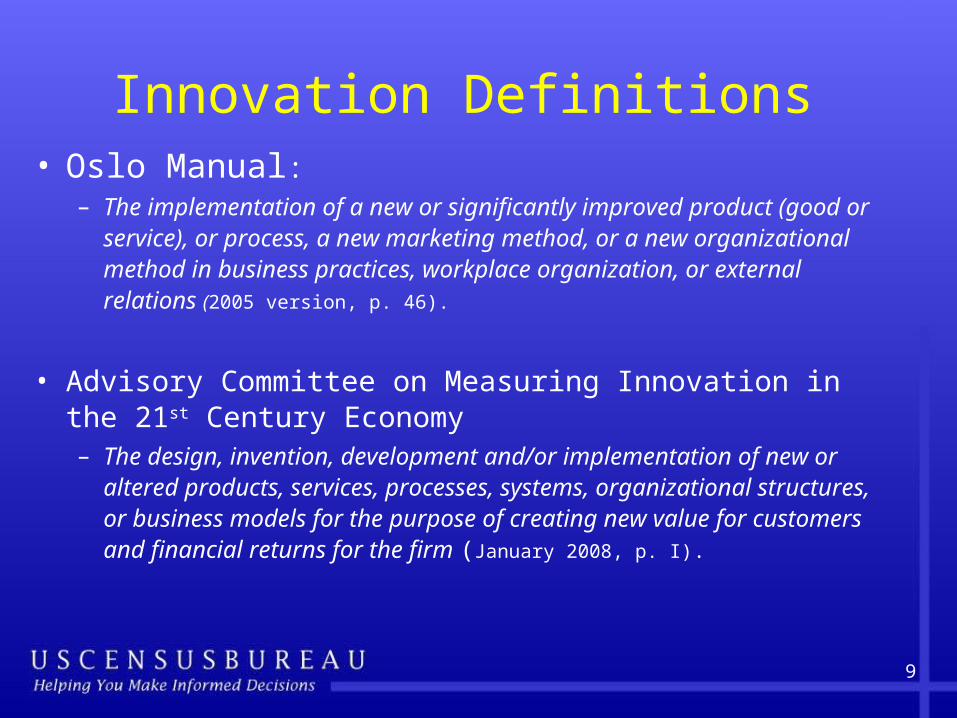
Innovation Definitions • Oslo Manual:
– The implementation of a new or significantly improved product (good or service), or process, a new marketing method, or a new organizational method in business practices, workplace organization, or external relations (2005 version, p. 46).
• Advisory Committee on Measuring Innovation in the 21st Century Economy– The design, invention, development and/or implementation of new or
altered products, services, processes, systems, organizational structures, or business models for the purpose of creating new value for customers and financial returns for the firm (January 2008, p. I).
10
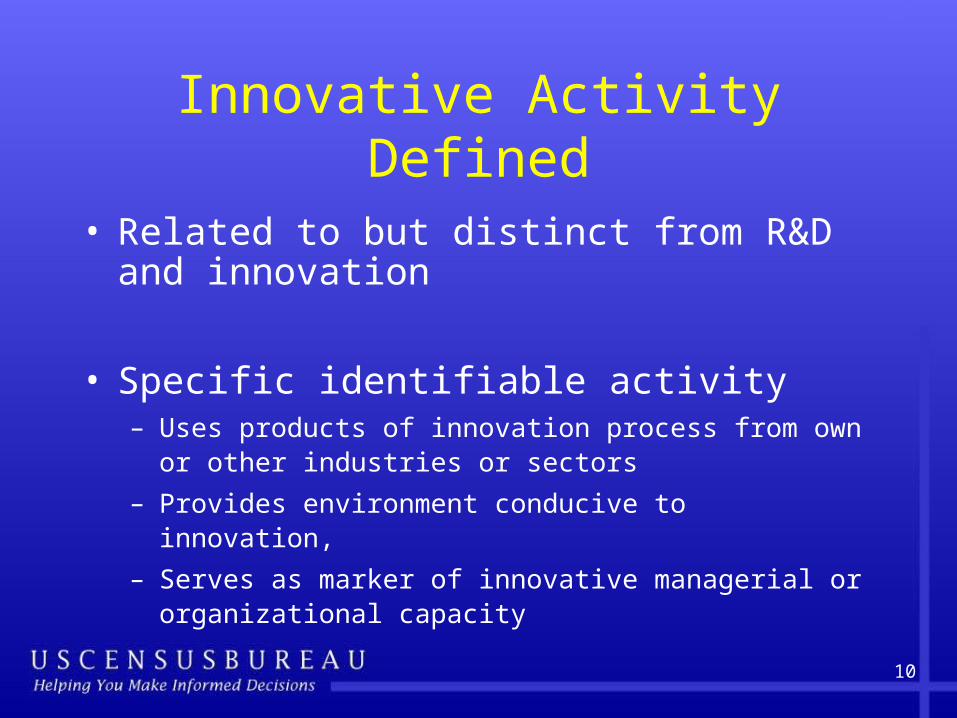
Innovative Activity Defined
• Related to but distinct from R&D and innovation
• Specific identifiable activity– Uses products of innovation process from own or other
industries or sectors
– Provides environment conducive to innovation,
– Serves as marker of innovative managerial or organizational capacity
11
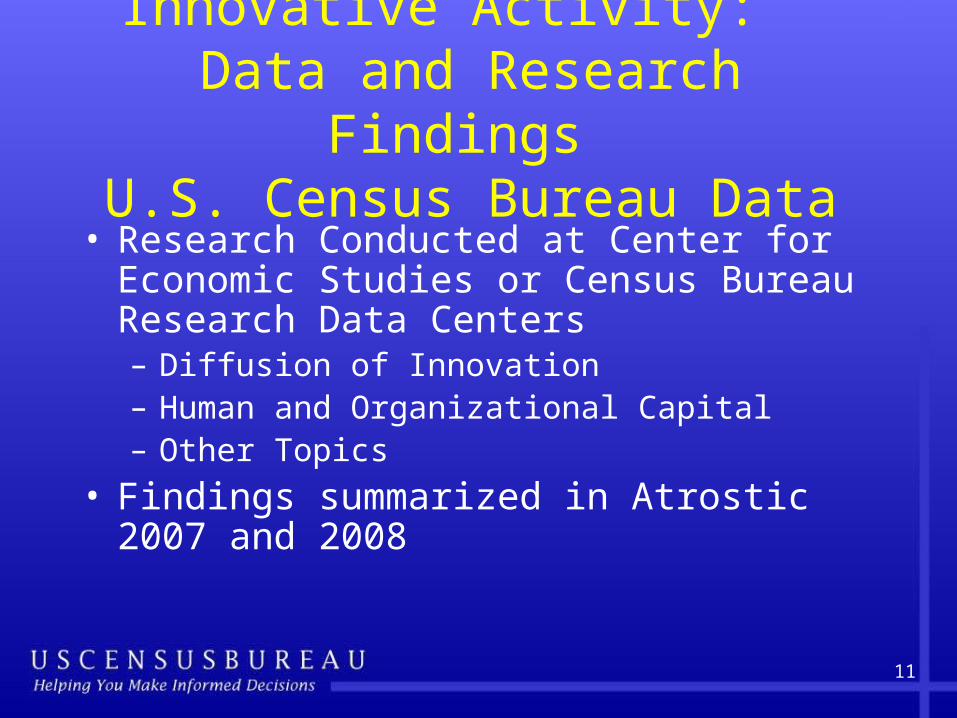
Innovative Activity: Data and Research Findings
U.S. Census Bureau Data• Research Conducted at Center for Economic
Studies or Census Bureau Research Data Centers– Diffusion of Innovation– Human and Organizational Capital– Other Topics
• Findings summarized in Atrostic 2007 and 2008
12
Innovative Activity: Data and Research Findings
Other Countries• Community Innovation Survey (CIS)
• Research Findings
13
U.S. Census Bureau Data: Diffusion of Innovation
• Survey of Manufacturing Technologies: 1988
and 1993 ASM supplements
• Computer Network Use Survey (CNUS): 1999
ASM supplement
• Information and Communications Technology Survey (ICTS): 2003 + Annual Capital Expenditure
Survey (ACES) Supplements
14
U.S. Census Bureau Data: Human and Organizational
Capital• Broader capital measures would include richer
measures of a firm’s human and organizational capital (Corrado et al. 2005, 2006)
• National Employer Surveys (NES): 1994, 1996, 1997, 1998,
2000
• Entrepreneurship: – Integrated Longitudinal Business Database (ILBD),
– Characteristics of Business Owners Survey (CBO)
• Firm Organization
15
U.S. Census Bureau Data: Other Topics
• Dynamics of Labor Markets:– Worker and Firm Characteristics: Longitudinal Employer-
Household Dynamics (LEHD)
• International Trade:– Importing, Exporting, Outsourcing
– Foreign Direct Investment • Successful BEA/NSF/Census Bureau pilot project
• Matched BEA FDI and U.S. Direct Investment Abroad with NSF/Census Survey of Industrial Research and Development (SIRD)
• Subsequent extension and expansion of pilot
16
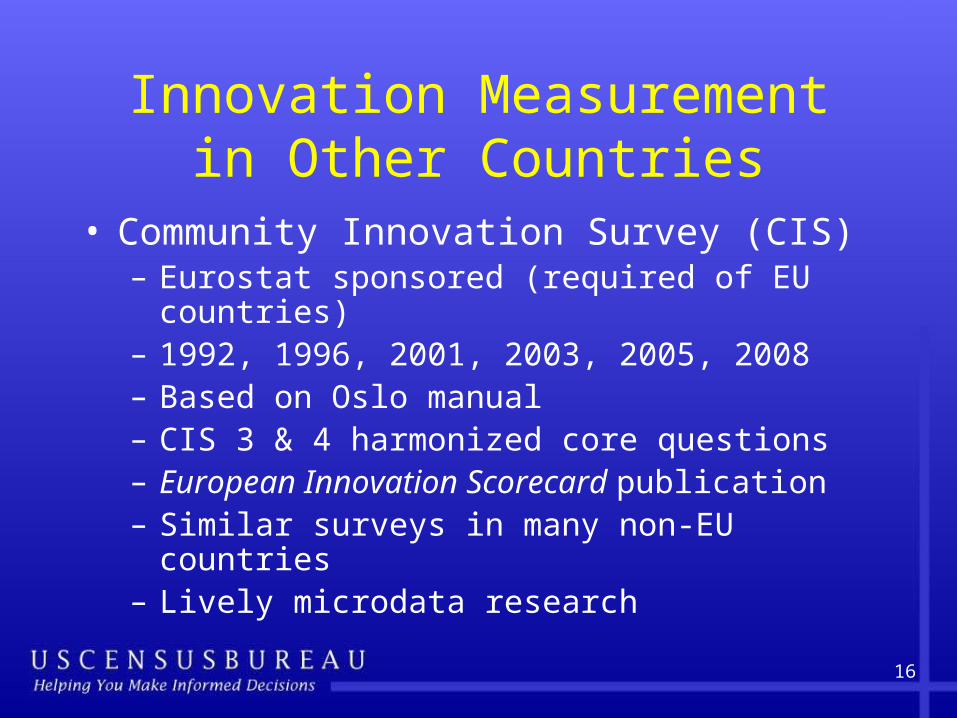
Innovation Measurement in Other Countries
• Community Innovation Survey (CIS) – Eurostat sponsored (required of EU countries)– 1992, 1996, 2001, 2003, 2005, 2008– Based on Oslo manual– CIS 3 & 4 harmonized core questions– European Innovation Scorecard publication– Similar surveys in many non-EU countries– Lively microdata research
17
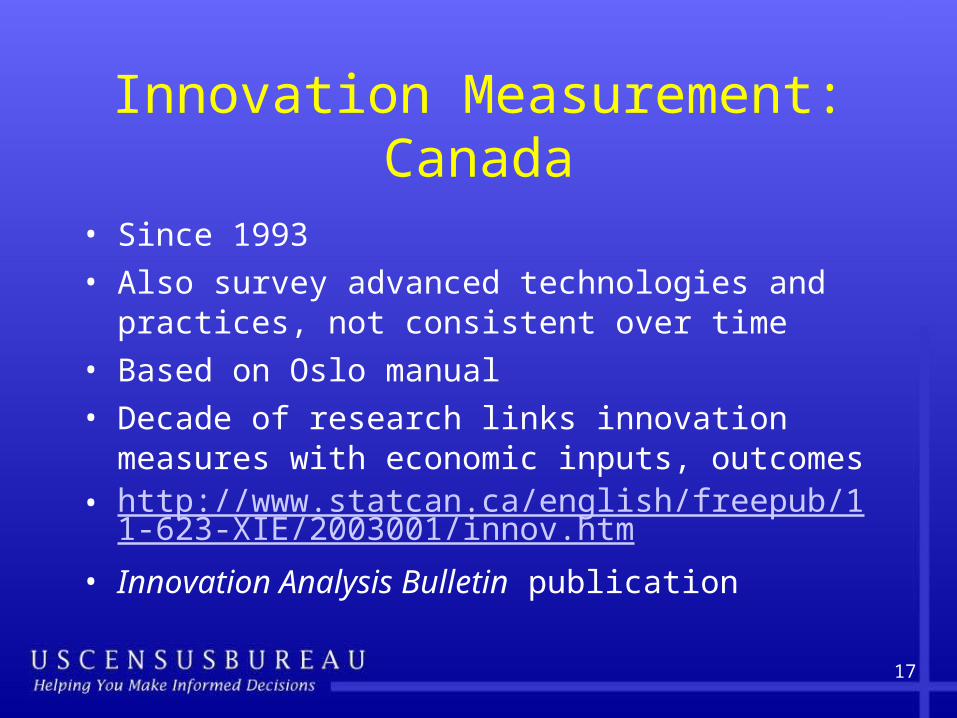
Innovation Measurement: Canada
• Since 1993
• Also survey advanced technologies and practices, not consistent over time
• Based on Oslo manual
• Decade of research links innovation measures with economic inputs, outcomes
• http://www.statcan.ca/english/freepub/11-623-XIE/2003001/innov.htm
• Innovation Analysis Bulletin publication
18
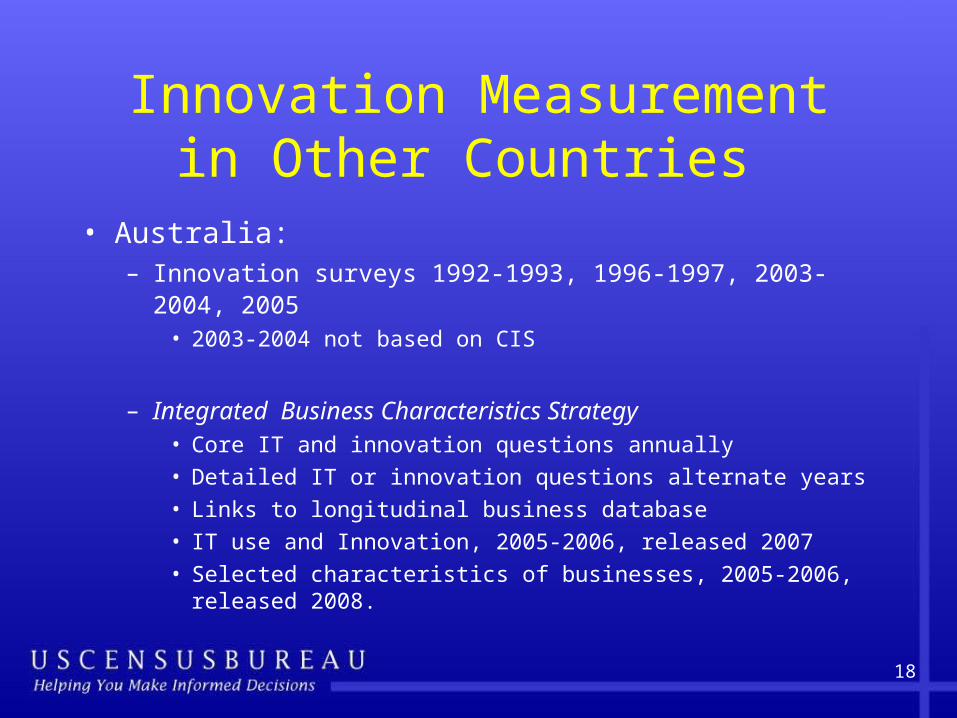
Innovation Measurement in Other Countries
• Australia:– Innovation surveys 1992-1993, 1996-1997, 2003-2004, 2005
• 2003-2004 not based on CIS
– Integrated Business Characteristics Strategy• Core IT and innovation questions annually
• Detailed IT or innovation questions alternate years
• Links to longitudinal business database
• IT use and Innovation, 2005-2006, released 2007
• Selected characteristics of businesses, 2005-2006, released 2008.
19
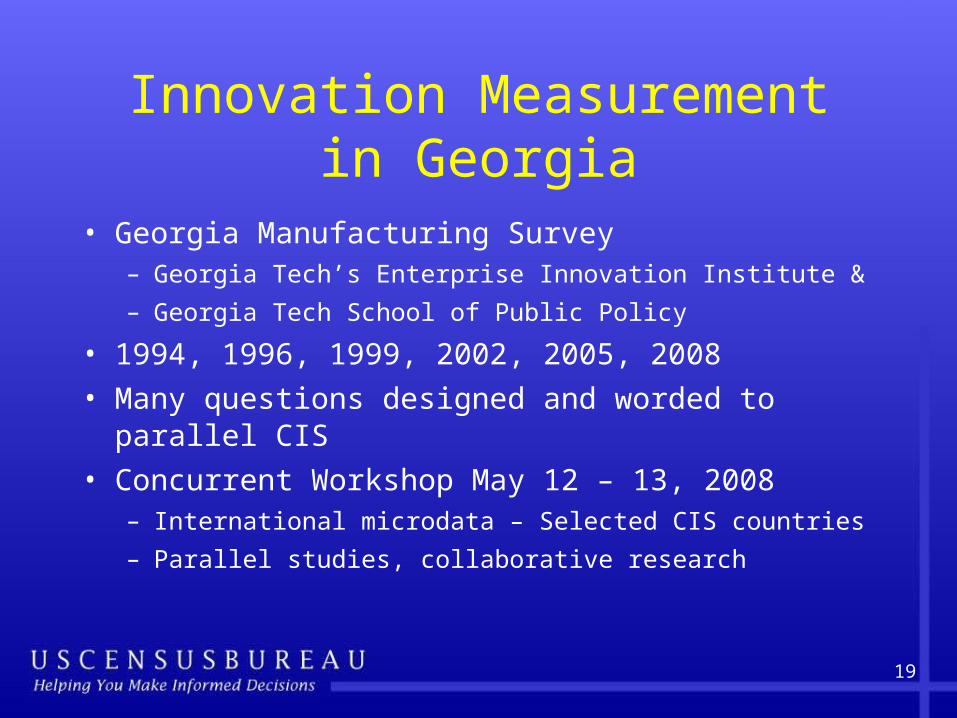
Innovation Measurement in Georgia
• Georgia Manufacturing Survey– Georgia Tech’s Enterprise Innovation Institute &
– Georgia Tech School of Public Policy
• 1994, 1996, 1999, 2002, 2005, 2008
• Many questions designed and worded to parallel CIS
• Concurrent Workshop May 12 – 13, 2008– International microdata – Selected CIS countries
– Parallel studies, collaborative research
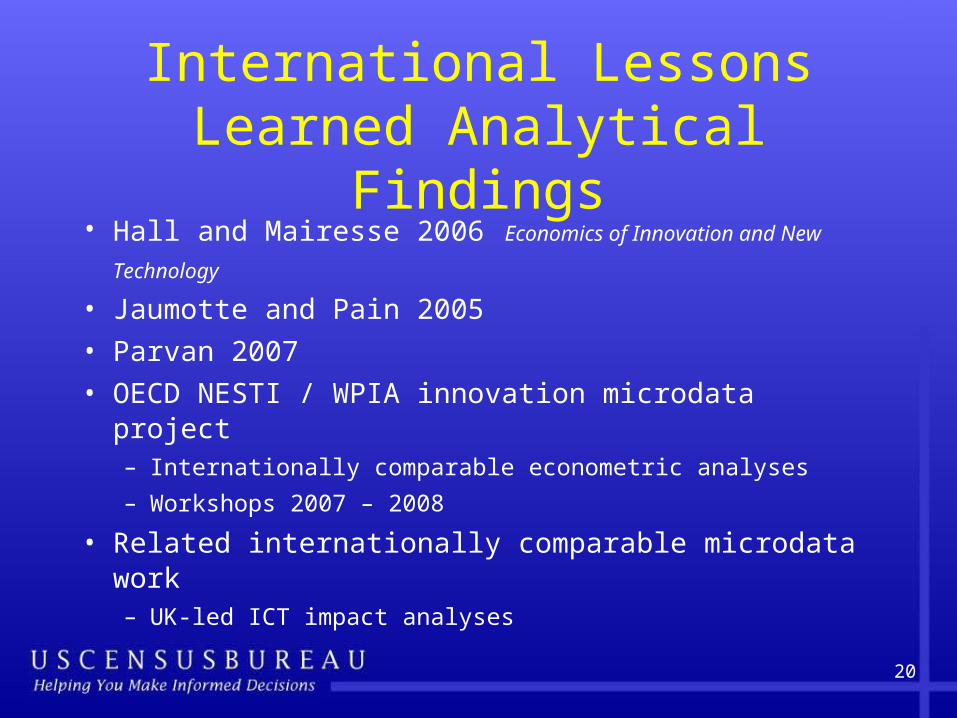
20
International Lessons Learned Analytical Findings
• Hall and Mairesse 2006 Economics of Innovation and New
Technology
• Jaumotte and Pain 2005
• Parvan 2007
• OECD NESTI / WPIA innovation microdata project– Internationally comparable econometric analyses
– Workshops 2007 – 2008
• Related internationally comparable microdata work– UK-led ICT impact analyses
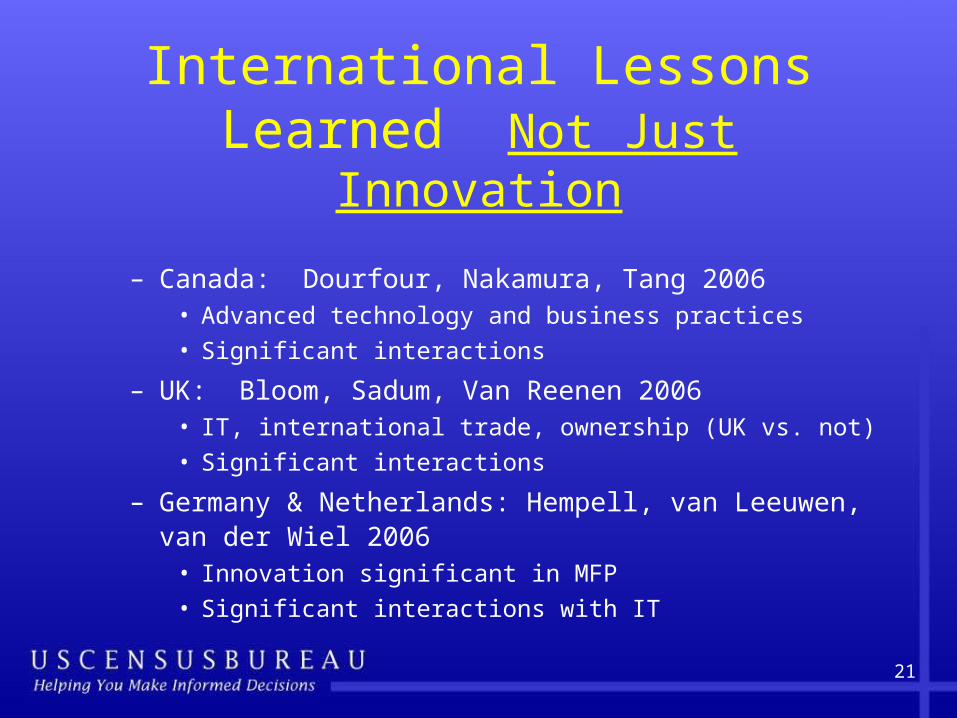
21
International Lessons Learned Not Just Innovation
– Canada: Dourfour, Nakamura, Tang 2006• Advanced technology and business practices
• Significant interactions
– UK: Bloom, Sadum, Van Reenen 2006• IT, international trade, ownership (UK vs. not)
• Significant interactions
– Germany & Netherlands: Hempell, van Leeuwen, van der Wiel 2006
• Innovation significant in MFP
• Significant interactions with IT
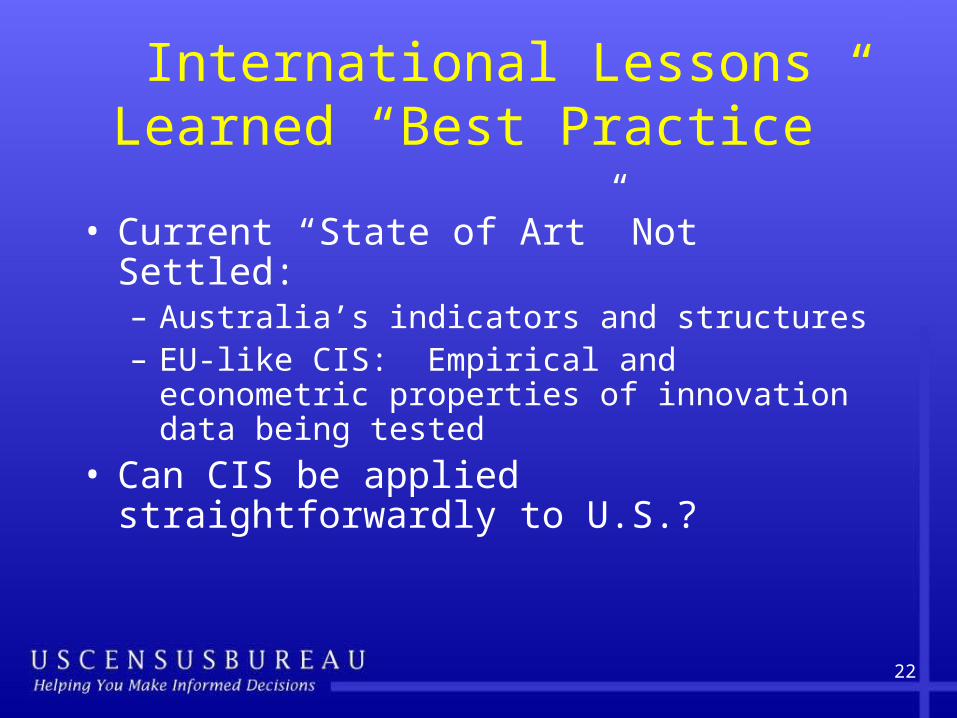
22
International Lessons Learned “Best Practice”
• Current “State of Art” Not Settled:– Australia’s indicators and structures– EU-like CIS: Empirical and econometric
properties of innovation data being tested
• Can CIS be applied straightforwardly to U.S.?
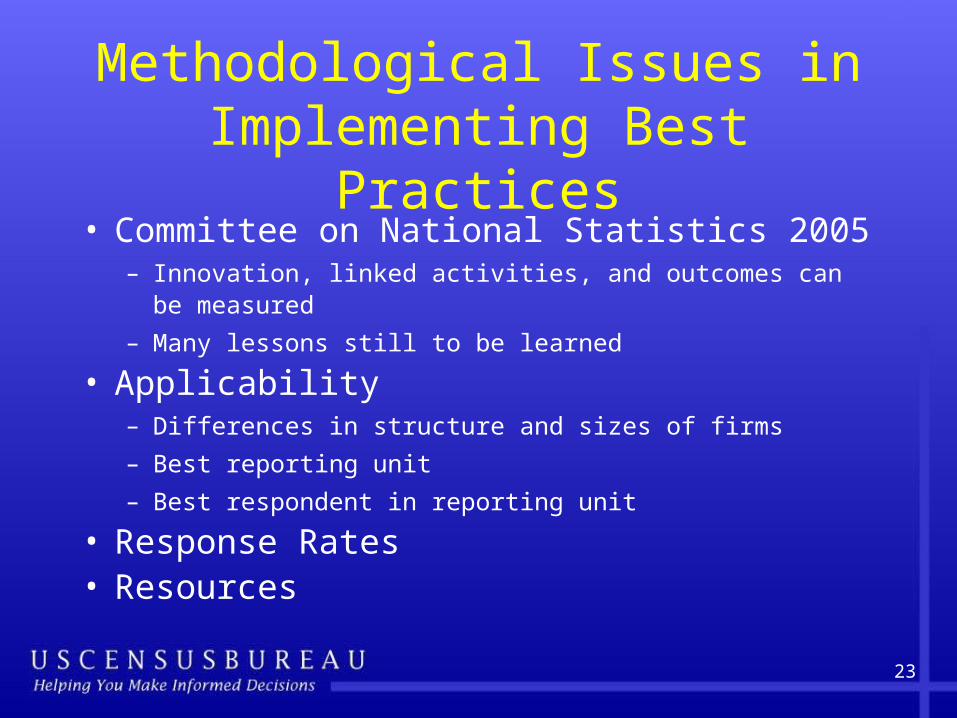
23
Methodological Issues in Implementing Best Practices
• Committee on National Statistics 2005– Innovation, linked activities, and outcomes can be measured
– Many lessons still to be learned
• Applicability – Differences in structure and sizes of firms
– Best reporting unit
– Best respondent in reporting unit
• Response Rates• Resources
24
Critical U.S. Data Gaps• Neither an innovation survey nor more
systematic data on innovative activity would fill core data gaps
• Innovative activities of interest as potential drivers of economic outcomes of interest, such as total factor productivity
25
Critical U.S. Data Gaps• Do not cover all of services
– No annual product data for retail & wholesale trade, or services
• Data not designed to be linked– May not be collected as panel
– Links may not work as well as expected
• Small business performance– Need to improve measures, e.g., current SBO vs. 1987 & 1992
CBO
• Data on inputs sparse– Not comparable across sectors
26
Filling Critical Gaps – New Data• FY2008 Budget initiative – quarterly and annual
coverage of all service sectors
• Off shoring & outsourcing indicators – 2007 Economic Census
• Corporate structure– 2007 SBO – add franchising, more characteristics of
business, business owner
– Report of Organization Survey asks imported services in 2007
27
Filling Critical Gaps – New Data• R&D:
– NSF-sponsored addition of questions for selected industries, 2007 Economic Census
– Survey of Industrial Research and Development (SIRD) being redesigned with some of these issues in mind
28
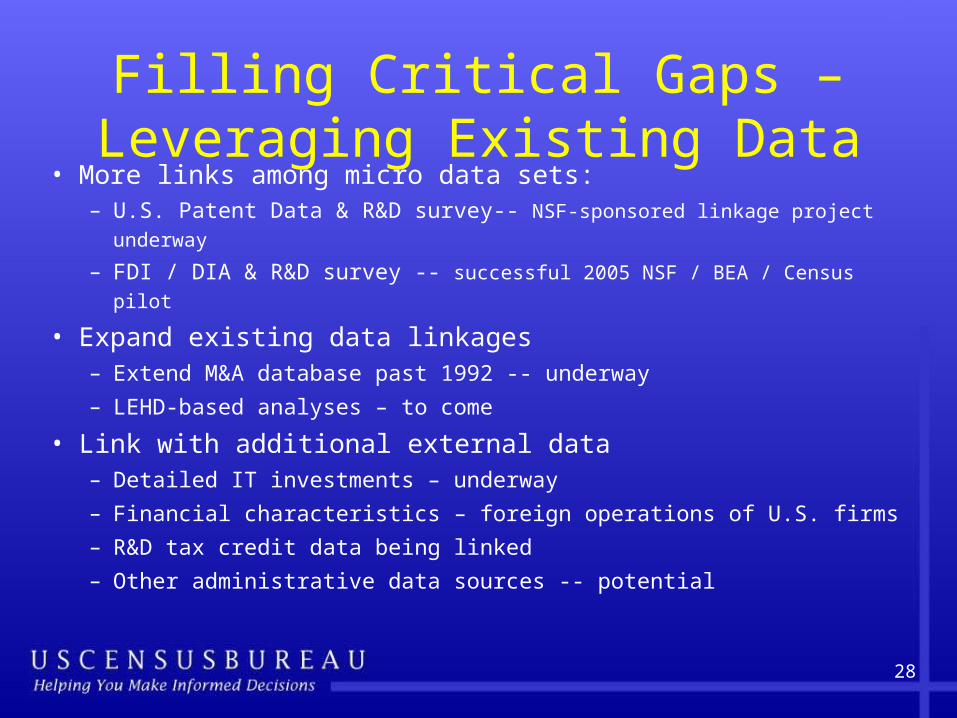
Filling Critical Gaps – Leveraging Existing Data
• More links among micro data sets:– U.S. Patent Data & R&D survey-- NSF-sponsored linkage project
underway
– FDI / DIA & R&D survey -- successful 2005 NSF / BEA / Census pilot
• Expand existing data linkages– Extend M&A database past 1992 -- underway
– LEHD-based analyses – to come
• Link with additional external data– Detailed IT investments – underway
– Financial characteristics – foreign operations of U.S. firms
– R&D tax credit data being linked
– Other administrative data sources -- potential
29
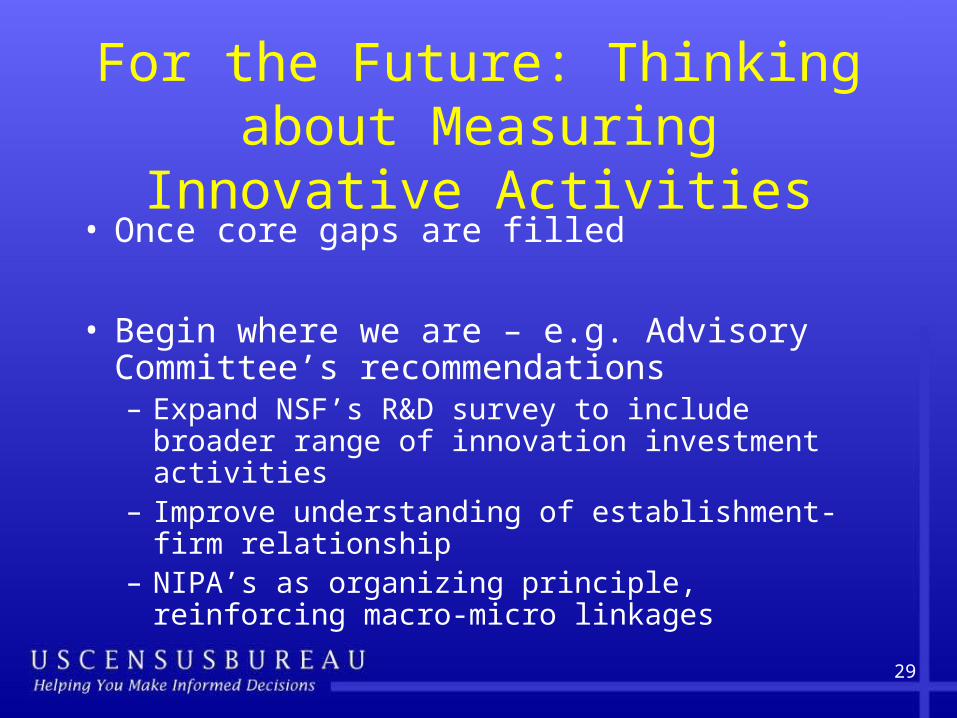
For the Future: Thinking about Measuring Innovative Activities
• Once core gaps are filled
• Begin where we are – e.g. Advisory Committee’s recommendations– Expand NSF’s R&D survey to include broader
range of innovation investment activities– Improve understanding of establishment-firm
relationship– NIPA’s as organizing principle, reinforcing macro-
micro linkages
30
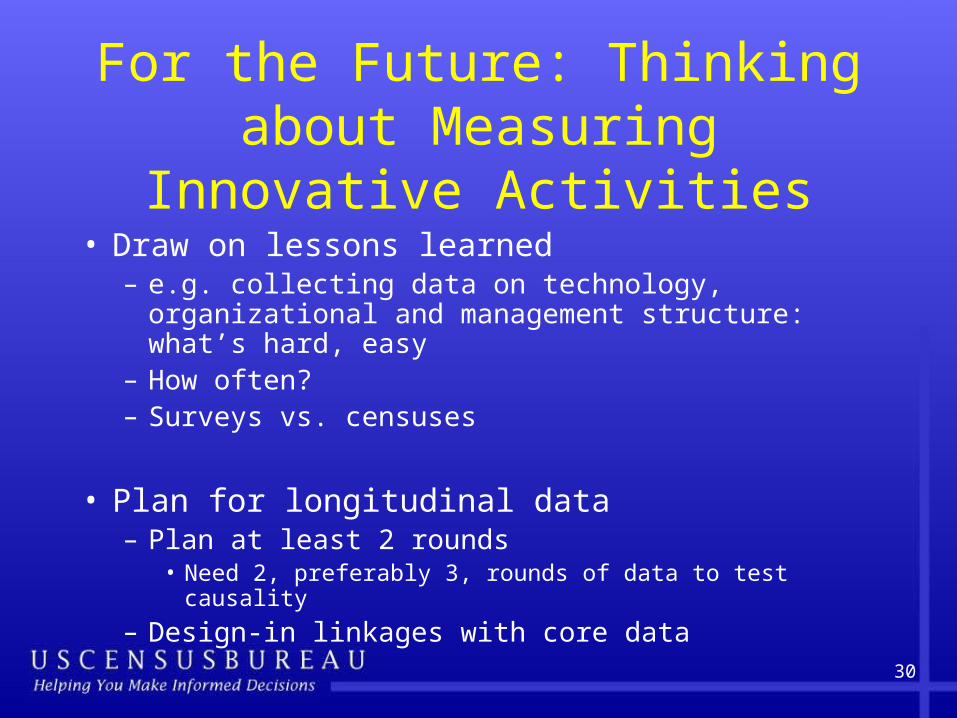
For the Future: Thinking about Measuring Innovative Activities
• Draw on lessons learned– e.g. collecting data on technology, organizational
and management structure: what’s hard, easy– How often?– Surveys vs. censuses
• Plan for longitudinal data– Plan at least 2 rounds
• Need 2, preferably 3, rounds of data to test causality
– Design-in linkages with core data
31
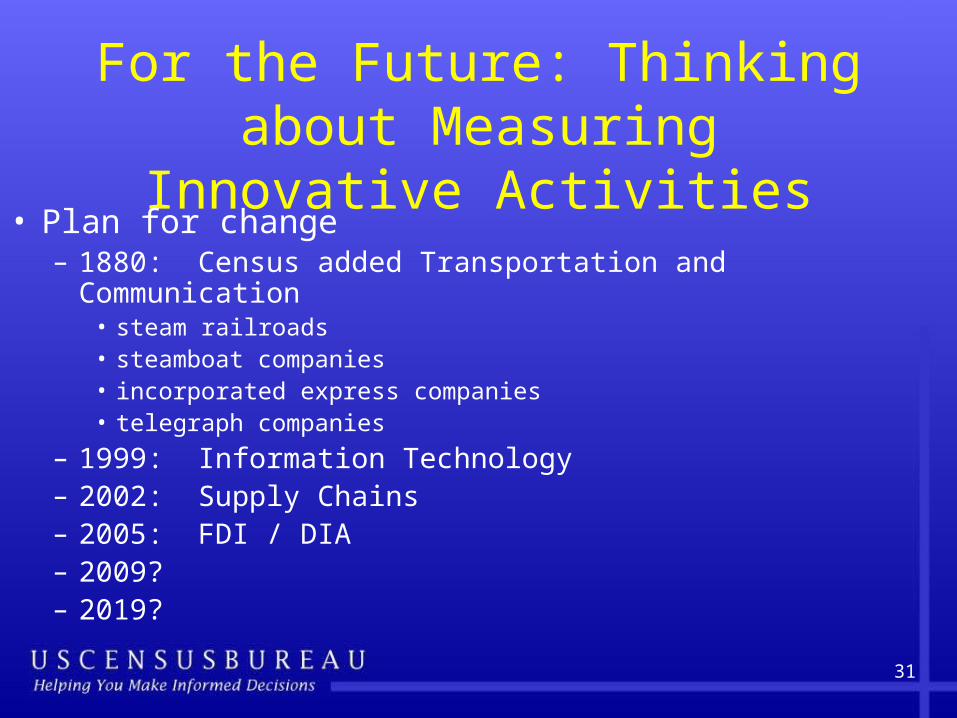
For the Future: Thinking about Measuring Innovative Activities
• Plan for change– 1880: Census added Transportation and Communication
• steam railroads• steamboat companies• incorporated express companies• telegraph companies
– 1999: Information Technology– 2002: Supply Chains– 2005: FDI / DIA– 2009? – 2019?
32
Conclusion
• Understanding role of innovative activity requires – Solid data on core measures of economy– Data on innovative activity– Longitudinal measures of both
• Filling these gaps would improve our ability to understand – Entire economy – Economic performance: TFP, other measures
33
Appendix: The Census Bureau Research Data Center Program
• Purpose
• Research Data Centers (RDCs) offer qualified researchers restricted access to confidential economic and demographic data collected by the Census Bureau in its surveys and censuses. RDCs are established through partnerships with academic and similar organizations.
34
RDC Locations
• Ann Arbor MI
• Berkeley CA
• Boston MA
• Chicago IL
• Ithaca NY
• New York NY
• Los Angeles CA
• Research Triangle NC
• Upper Marlboro MD
• RDCs are Census Bureau facilities staffed by a Census Bureau employee and meet all physical and computer security requirements for restricted access
35
Datasets Available at RDCs
• Most Economic Censuses and Surveys
• Selected Demographic Surveys and Decennial Censuses
• Special Files crated for research purposes:
• Longitudinal Research Database, Integrated Longitudinal Business Database, linked files (e.g., LEHD), etc.
36
RDCs: Title 13 and Title 26
• Our legal authority to provide access to these data require that there be a legitimate Title 13, Chapter 5 purpose to any research.
• Our legal authority to provide access to IRS (Title 26) data in our custody requires that the Title 13 benefit be the predominant purpose.
37
RDCs: Review and Approval Process
• 1. Researcher interacts with an RDC Administrator to gather information about the data available and the procedures to be followed.
• 2. Proposals are submitted for review by Census Bureau staff and are either approved or denied. If denied, they can be resubmitted if they are revised to address noted deficiencies.
38
RDCs: Review and Approval Process, continued
• 3. If approved by the Census Bureau, the proposal must also be approved by the agency “owning” the data (e.g., IRS or the survey sponsor).
• More information:• www.ces.census.gov.