Embed Size (px)
Citation preview

1
Measurements and modeling of the ion backflow properties of
integrated Micromegas(MP3-2)
M. Chefdeville
NIKHEF, Amsterdam
MPGD, Hawaii 07
2
Overview
• Introduction– GridPix detectors– InGrid, an integrated Micromegas – Ion backflow of InGrid
• Measurements– Experimental set-up– Results
• Simulations– 2D, 3D Monte Carlo– 1D, 2D, 3D Numerical calculation
• Conclusion
3
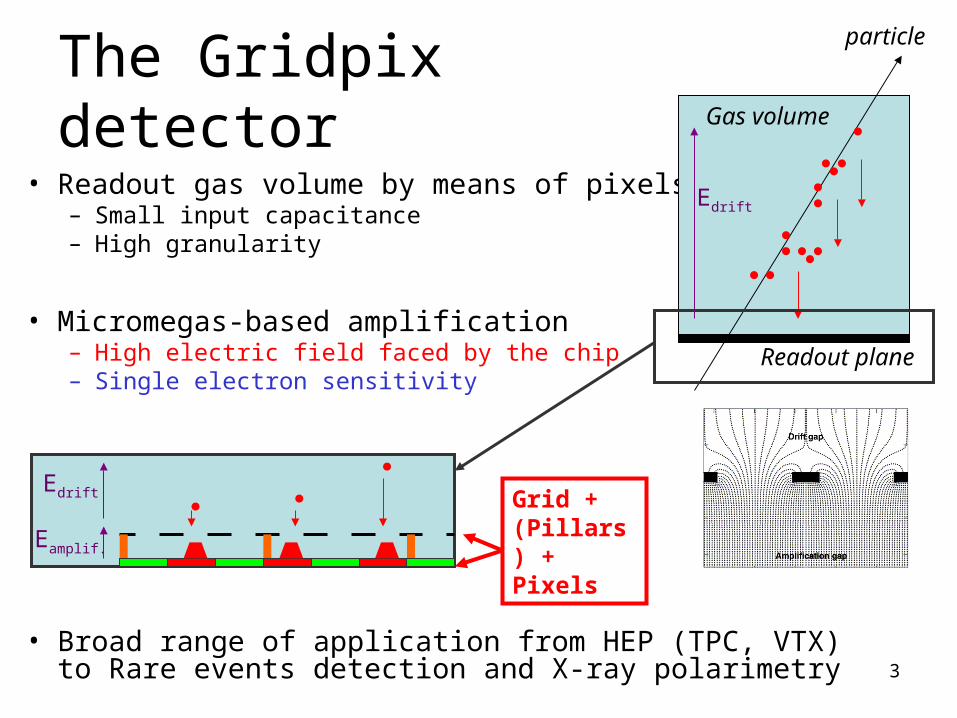
The Gridpix detector
• Readout gas volume by means of pixels– Small input capacitance– High granularity
• Micromegas-based amplification– High electric field faced by the chip– Single electron sensitivity
• Broad range of application from HEP (TPC, VTX) to Rare events detection and X-ray polarimetry
Edrift
Readout plane
Gas volume
particle
Edrift
Eamplif.
Grid + (Pillars) + Pixels

4
• Demonstrated to work in 2004• Issues
– Gas detectors do spark
sensitive to gas discharges– Large Micromegas pillar Ø
detection area loss– Pixel pads and grid holes misaligned
efficiency loss– Grid hole and pixel pitches ≠
periodic variation of efficiency
Moiré pattern
Fraction the 14x14 mm2 Medipix2 pixel area
~ 7 mm
The Gridpix detector

5
InGrid, an integrated Micromegas
• Solve the alignment / pillar Ø / pitch issues by integrating the Micromegas onto the chip
• Wafer post-processing– Grid geometry fits the chip– Pillar Ø ~ 30 μm
• Very good grid flatness– Minimum gain fluctuations– Extremely good resolution of
11.7 % FWHM @ 5.9 keVin Ar 10% CH4
• Ion backflow propertiesrecently studied
2 cm Ø
11.7 % FWHM
pillar

6
Ion backflow in Micromegas• Intrinsic low BF as most of the field
lines in the avalanche gap end on the grid
• Number of ions arriving on the grid depends on:– Shape/size of the field line funnel– Ion formation positions
• Shape/size of the field line funnel– Grid geometry– Ratio of the Amplification to Drift fields
• Ion formation positions– Longitudinally: Townsend coefficient– Transversally: Electron diffusion
Ion drift lines
Electron avalanches
EDrift
EAmplif.

7
Size of the field line funnel• Gauss theorem: ∫funnelE.dS = 0
– For D and A fields: ED.SD = EA.SA
• SA, SD funnel length (1D) orcross section areas (2D,3D)in Amplification and Drift regions
– Thus: SA = SD . ED / EA = SD / FR• FR, field ratio
• Increasing field ratio FR (EA ↑ or ED ↓)– SD ↑ (up-bounded by hole pitch)– SA ↓ (no lower bound)
• Above certain field ratio FR, SD = p*p:– SA = p*p / FR– the backflow fraction ↓ like 1/FR and ↑ like p2
SA
Sd
EDrift
EAmplif.

8
Measuring the ion backflow fraction of Micromegas
• Definition, for a single e- induced avalanche, the backflow fraction is:– back-flowing ions / total number of ions
i.e. ions collected on the cathode / ions on the anode
• Experimentally, the ion backflow fraction BF is:– BF = (Ic - Ip) / Ia = Ib / Ia
Ic: cathode currentIp: primary currentIa: anode current
• Constraints:– Measurable primary currents– Accurate measure of Ib (very small at high field ratio)
• Should operate the detector:– Under relatively high irradiation (strong e- radio source / X-ray gun)– High gains
Ip
-Ip
Ia
Ib

9
Measuring the ion backflow fraction of InGrid
• InGrid have a small area (π cm2)
• Recombination in drift region may occur if charge density is too high
• No field cage: electric field not uniform on the grid edges (effect ↑ at low Drift fields)– Collection loss– Limit the minimum drift field (maximum FR)
• Therefore:– Moderate irradiation and small gains
measure small currents (Ip ~ tens of pA)– Use guard electrode around the grid
+ strong source collimation
2 cm Ø

10
Experimental set-up• X-ray gun up to 12 keV photons, 200 μA
– Operated at 9 keV energy (50 μA)• 10 keV photo e- range ~ 1 cm in Ar
– Collimator is 2 cm thick with a 3 mm Ø hole
• Guard electrode 1 mm above the grid– Adjustable voltage
• Cathode/Anode current measurements– Voltage drop through 92 MΩ resistor
Zinput = 1 GΩ, ΔI = 1 pA– Voltage drop through 10 MΩ resistor
Zinput = 100 MΩ, ΔI = 100 pA
• Reversed polarities:– Cathode at ground, grid and anode
at positive voltages– No field between detector window
and cathode
• Gas mixture: Ar:CH4 90:10

11
Experimental set-up
Electronics
Voltmeters
X-tube
Gas chamber
Collimator

12
Detector geometries4 different hole pitches
20, 32, 45 and 58 μm
20 & 32 μm pitch grids have pillars inside holes45 & 58 μm pitch grids have pillars between holes
3 different amplification gap thicknesses
– 45, 58 and 69 μm ± 1 μm– Operated at 325, 350 and 370 V– Amplification fields of 72, 60 and 53 kV/cm
Gains of 200, 550 and 150Diffusion coef. of 142, 152 and 160 μm/√cmAvalanche width of 9.5, 11.6 and 13.4 μm

13
Measurements in Ar:CH4 90:10• Vary field ratio FR from 100 to 1000
– Drift field from ~ 500 V/cm down to few ~ 50 V/cm– At high FR (low Drift field), primary e- loss due to field distortions
Stop at FR ~ 1000
• Fit curve with BF = p0/FRp1

14
Measurements with 45 μm gap InGrids
Gain ~ 200σt = 9.5 μm
20 μm pitch p1 = 1.0132 μm pitch p1 = 0.9045 μm pitch p1 = 0.9658 μm pitch p1 = 1.19
BF = p0/FRp1
At given field ratio and ion distribution, the backflow fraction ↓ with the pitch

15
Measurements with 58 μm gap InGrids
Gain ~ 500σt = 11.6 μm
20 μm pitch p1 = 1.0832 μm pitch p1 = 1.0245 μm pitch p1 = 1.0158 μm pitch p1 = 1.21
BF = p0/FRp1
BF < 1 ‰
At given field ratio and ion distribution, the backflow fraction ↓ with the pitch

16
Measurements with 70 μm gap InGrids
BF = p0/FRp1
Gain ~ 150σt = 13.4 μm
32 μm pitch p1 = 1.1445 μm pitch p1 = 1.1358 μm pitch p1 = 1.28
BF < 1 ‰
At given field ratio and ion distribution, the backflow fraction ↓ with the pitch

17
Summary of the measurements
At given field ratio, the backflow fraction ↓ with the ion distribution widthand ↑ with the hole pitch

18
Simulations
• Monte Carlo– Calculate the electric field in 3D with MAXWELL3D– Simulate avalanche development within GARFIELD with
MAGBOLTZ calculated Townsend and diffusion coefficients– Count the number of back-flowing and total ions– Can be used to determine the funnel shape
• Numerical calculation– Assume homogeneous amplification field
Assume field line funnel shape and area– Calculate ion distribution in 1D/2D/3D with MAGBOLTZ
calculated Townsend and diffusion coefficients– Integrate the distribution over the field line funnel
length/area/volume

19
3D Monte Carlo• Finite element mesh restricts the study to “large” funnel size (> 0.25 μm)
– OK for low FR
• Not suitable for studying the effect of geometry on the backflow fraction– Requires a lot of field maps to be solved– Time consuming
• However, can be used to check assumption for the numerical calculation– Reveal the field line funnel shape– Alike hole shape? Round? Square?

20
3D Monte Carlo• Finite element mesh restricts the study to “large” funnel size (> 0.25 μm)
– OK for low FR
• Not suitable for studying the effect of geometry on the backflow fraction– Requires a lot of field maps to be solved– Time consuming
• However, can be used to check assumption for the numerical calculation– Reveal the field line funnel shape– Alike hole shape? Round? Square?

21
Numerical calculations• Ion distributed along anode axis or over anode
plane with and without longitudinal development
• X model– Gaussian distribution– Funnel is an interval of length
L2 = L1 / FR = pitch / FR
• X-Z model– Gaussian x exponential distribution G(x,σ(z)).e(α.z)– Funnel is a rectangle of area
S2 = GAP.L2 = GAP . pitch / FR
• XY model– Gaussian distribution G(x,y,σ(GAP))– Funnel is a circle of area
S2 = S1 / FR = pitch2 / FR
• XY-Z model– Gaussian x exponential distribution G(x,y,σ(z)).e(α.z)– Funnel is a cylinder of volume
V2 = GAP . S2 = GAP . S1 / FR = GAP . pitch2 / FR
X model
X-Z model
XY model

22
Ion backflow in the 1D,2D & 3D models• In all models, the backflow fraction reaches a minimum plateau equals
to 1/FR– Ion backflow from neighboring holes – Reducing pitch or increasing ion distribution width further does not help
• In “Z” models, more ions are generated in the funnel– Increase of backflow fraction– Z-dimension can be neglected at high gains

23
Simulations and results• Backflow trend in good agreement with the XY-Z simulation
• Though, measurements show 0.5 to 1 % offset– Errors on σt for data points, or α for simulated points?

24
Conclusions
• Backflow fraction of few per mil reached in Ar:CH4 90:10 gas mixture with 20 μm hole pitch InGrids
• Measurements and simulations:
– Good understanding of dependence on hole pitch and gas diffusion
– Still discrepancies on the trend of backflow w.r.t. field ratio
• Further studies, decrease the backflow further
– Double stage grid (TwinGrid)
– Measure backflow fraction in under-quenched gas mixtures

25
Acknowledgements
NIKHEFHarry van der Graaf, Fred Hartjes, Jan Timmermans, Jan Visschers, Marten Bosma, Martin Fransen, Yevgen Bilevych
TwenteCora Salm, Joost Melai, Jurriaan Schmitz, Sander Smits, Victor Blanco Carballo
SaclayD. Attié, P. Colas, I. Giomataris