Embed Size (px)
Citation preview
1
Manuscript 6130, Revision 1 1 Submission to the Special Collection: Mechanisms, Rates, and Timescales of Geochemical 2 Transport in the Crust and Mantle 3 4 5
Element mobility during regional metamorphism in crustal and subduction zone 6
environments with a focus on the rare earth elements (REE) 7
8
Jay J. Ague1,2 9
10
1Department of Geology and Geophysics 11
Yale University 12
P.O. Box 208109 13
New Haven, CT 06520-8109 USA 14
16
2Peabody Museum of Natural History 17
Yale University 18
New Haven, CT 06511 USA 19
20
2
Abstract 21
This paper explores bulk-rock geochemical data for a wide array of metamorphosed 22
mafic, quartzofeldspathic, pelitic, and metacarbonate rocks using a quantitative mass balance 23
approach to assess fluid-driven element mobility—particularly of the rare earth elements 24
(REE)—in regional metamorphic and some high pressure subduction zone environments (40 25
examples; over 240 individual analyses). The results highlight the critical role of mineral 26
reactions in controlling rock compositions and compositional changes. Most examples are from 27
focused fluid flow settings, such as veins and lithologic contacts, where fluxes are large and 28
metasomatic signals are thus strong. A variety of REE behaviors are observed, including little or 29
no REE mobility (roughly 1/3 of the data set); light REE (LREE), mid-REE (MREE), and/or 30
heavy (HREE) mobility; europium “anomalies”; overall REE losses; and local REE 31
redistribution. The REE are typically fractionated by mass transfer, with the exception of several 32
examples that underwent fairly uniform overall losses of REE. The fractionation reflects strong 33
mineralogical controls on REE uptake/loss by rocks by a comparatively small number of phases. 34
Examples include: HREE mass changes associated with garnet, xenotime, and sphene; LREE 35
and MREE changes associated with apatite, monazite, and allanite; and Eu changes associated 36
with plagioclase and lawsonite. As mineralogy is a dominant control, the nature of the 37
metasomatism is not strongly correlated with metamorphic grade, other than obvious 38
mineralogical differences between settings (e.g., plagioclase in Barrovian metamorphism, 39
lawsonite in subduction zones). Extensive mobilization of non-REE major and trace elements 40
can happen without significant open-system transport of the REE. If REE mobility occurs, it is 41
always accompanied by mobilization of other non-REE. When mobile, neighboring REE (e.g., 42
Sm and Nd) typically have strongly correlated mass changes indicating that both were mobilized 43
3
to about the same degree. Thus, constancy of neighboring REE mass ratios does not mean that 44
they were immobile. Although individual examples of metasomatism can show correlations 45
between patterns of mass transfer for the REE and the non-REE, little such correlation is evident 46
across the entire data set, with the exception of P. Once again, this highlights the importance of 47
individual minerals in controlling REE systematics. REE mass transfer coupled to gains or losses 48
of volatiles is also not evident, although more data are clearly needed to document the impact of 49
F, Cl, CO2, sulfur, and other species on REE behavior. Broad correlations of REE and P mobility 50
suggest REE transport by P complexes, or REE and P transport together by some other 51
complexing agent. Mass changes for REE and Y are more strongly coupled, reflecting the 52
geochemical similarity of these elements and perhaps indicating a role for Y complexing as well. 53
The REE are the most mobile of the high-field strength elements (HFSE). On a 54
percentage mass basis the amount of HFSE mobility decreases roughly in the order: 55
REE>U>Nb>Ti>Th~Zr. Th mobility is rare but when present is positively correlated with U and 56
REE mobility. The mobility of the more refractory HFSE is low in aqueous fluids, but is a larger 57
concern in more extreme environments such as magmatic/magmatic-hydrothermal systems, 58
charnockite metamorphism, and supercritical fluids in high-pressure/ultrahigh-pressure settings. 59
The mobility of certain HFSE (e.g., Nb) can be large enough to affect rock plotting positions on 60
petrotectonic discrimination diagrams. 61
Potassium and related (Rb, Ba, Cs) large-ion lithophile elements (LILE) are typically lost 62
in association with mica breakdown. As the data set focuses on high fluid flow environments, 63
LILE changes will likely be smaller for rocks that undergo less fluid-rock interaction. Gains of K 64
and related LILE are coupled to volatile gain and Na loss, consistent with fluid flow down 65
temperature gradients, or infiltration from K-rich sources (e.g., pegmatites). In Barrovian 66
4
settings, two other mass transfer trends are evident in addition to K mass transfer. First, silica 67
loss is coupled to volatile loss, illustrating the dependence of silica mass transfer on 68
devolatilization. Most of the silica loss reflects local mass transfer into adjacent vein fluid flow 69
conduits were additional silica is precipitated; indeed, wallrock inclusions in veins can be highly 70
silicified. Second, Na and Ca mass gains and losses are well correlated in the Barrovian 71
examples, reflecting control of plagioclase growth or destruction. Strontium and Pb behaviors 72
also appear to be largely related to plagioclase behavior (in subduction settings, this role can be 73
played by phases such as lawsonite or epidote group minerals). 74
Carbon dioxide mass transfer by conventional devolatilization as well as near-75
stoichiometric CaCO3 dissolution or precipitation are represented in the data set. Determining the 76
relative roles of these processes as functions of metamorphic grade, intensity of fluid-rock 77
interaction, and tectonic setting will be an important challenge for future research. 78
5
Introduction 79
Time-integrated fluid fluxes due to crustal devolatilization during regional 80
metamorphism of sedimentary rock-dominated sequences can attain ~103 m3 m-2 averaged over 81
regional scales (e.g., Wickham and Tayor, 1985; Ague, 1994b, 2014; Ferry, 1994; Skelton et al., 82
1996; Bickle, 1996; Hanson, 1997; Lyubetskaya and Ague, 2009). In other words, a column of 83
fluid ~1 km long passes through a 1 m2 area of rock oriented perpendicular to flow. Fluxes of 84
this magnitude will be an unavoidable consequence of prograde fluid generation in such 85
sequences. Fluxes upward through subducted oceanic crust are also large and have been 86
estimated to be ~300 m3 m-2 (Zack and John, 2007), but could be even larger depending on the 87
hydration state of subducted mantle (e.g., Faccenda et al. 2009) or if focused along the slab-88
mantle wedge interface (e.g., Wilson et al. 2014). 89
These fluxes transfer massive quantities of H2O, CO2, CH4, and other volatile species 90
from actively metamorphosing regions in the lithosphere to the shallow crust and hydrosphere. In 91
so doing, they drive reaction progress (particularly in carbonate-bearing rocks), exert strong 92
controls on rock rheology and deformation behavior, determine the onset of partial melting in the 93
crust and mantle wedge and, ultimately, influence the long-term global carbon cycle. 94
Such fluxes are undeniably large, but whether or not they can regionally transport “non-95
volatile” elements such as the alkalis, alkaline earths, transition metals, and rare earth elements 96
(REE) depends strongly on the nature of flow. If the flow is everywhere uniform and pervasive 97
at the grain scale, then maximum fluxes in any given part of the rock mass are limited to values 98
in the 103 m3 m-2 range. On the other hand, if the flow is focused into some form of conduit, then 99
within conduits fluxes can be far larger than regional average values by one or even two orders 100
of magnitude (Fig. 1). Of course, this also means that areas outside of a conduit are impoverished 101
6
in fluid, because fluid is diverted away from them. It is in the more focused flow regimes that 102
non-volatile element transfer on large scales will occur most readily, at time-integrated fluxes of 103
~104 to ~106 m3 m-2. 104
Focusing generally results from rock permeability variations. High-permeability areas 105
will have the best potential to evolve into fluid conduits. Examples are many, and include high-106
permeability layers, fractures and veins, boudin necks, shear zones, mélange zones, high 107
permeability regions developed in certain compacting two-phase flow systems (Connolly and 108
Podladchikov, 2007), fold hinges (e.g., Skelton et al. 1995), and lithologic contacts (for reviews 109
see, e.g., Oliver, 1996; Ague, 2014). It is straightforward to illustrate how increasing the 110
permeability and proportions of conduits can drastically alter the hydrologic regime. Consider 111
unidirectional flow where 10 volume percent of the rock mass is composed of conduits parallel 112
to the flow direction that are a factor of 102 more permeable than the surroundings. From 113
Darcy’s law, more than 90% of the total fluid flow is carried by the conduits (assuming uniform 114
fluid pressure gradient and viscosity across the flow region). Permeability variations of this 115
magnitude are easily conceivable; for example, for planar cracks, permeability scales as the cube 116
of the crack aperture (e.g., Norton and Knapp, 1977). 117
The aim of this paper is to examine chemical changes in rocks brought on by focused 118
fluid flow in the continental crust and in subduction zones (mostly <~2.5 GPa) up to, but not 119
including, the realm of extensive partial melting. There are many chemical elements to 120
consider—too many for one paper—so the main theme will be mobility of the rare earth 121
elements (REE). Other elements such as large-ion lithophile (LILE) and high-field strength 122
(HFSE) elements will be discussed when appropriate. 123
7
Historically, REE mobility has commonly been inferred to be relatively limited during 124
hydrothermal or metamorphic fluid-rock interaction, and this is indeed the case in many 125
environments (e.g., Taylor and McLennan, 1985; Michard and Albarède, 1986; Banner and 126
Hanson, 1990; Bau, 1991). Nonetheless, clear examples of transport have been well documented. 127
REE transport in fluids has broad implications for understanding the nature and timing of a wide 128
array of lithospheric processes. For example, determining the tectonic setting of magmatism 129
using trace element discrimination diagrams is predicated on little or no REE mobility 130
subsequent to igneous crystallization (e.g., Pearce et al. 1984). Dating of garnet growth events 131
using Sm-Nd or Lu-Hf isotope systematics likewise requires REE immobility in the host rock 132
(e.g., Baxter and Scherer, 2013). Mobility must also be carefully assessed when interpreting 133
whole-rock isochrons (e.g., O’Neill et al. 2012). REE mobility during subduction, or lack 134
thereof, exerts important controls on arc magma chemistry as well as the REE budget of 135
lithosphere subducted deep into Earth’s mantle beyond the arc magma window (e.g., Sorensen 136
and Grossman, 1989; Spandler et al. 2003; 2004; Zack and John, 2007; Miller et al. 2009; 137
Bebout, 2014; Bebout and Penniston-Dorland, 2016; Taetz et al. 2016). 138
A wide range of approaches have been applied to assess REE mobility. A common 139
strategy is to compare the chondrite-normalized REE patterns of a suite of low-grade protoliths 140
to those of higher-grade rocks. This approach has been used, for example, to deduce little REE 141
mobility in subduction complex rocks from western Liguria (Tribuzio et al. 1996) and New 142
Caledonia (Spandler et al. 2003; 2004). Variability of REE patterns can also provide clues to 143
transport. Zhao et al. (2007) found that light REE (LREE) patterns in UHP eclogites from the 144
Sulu orogen ranged widely, whereas HREE patterns were more or less constant. They concluded 145
that the LREE variability resulted from mobilization, but that the HREE were immobile. Similar 146
8
conclusions regarding larger LREE mobility relative to heavier REE have been reached in a 147
variety of other studies (e.g., Weaver and Tarney, 1981; Griffin and Brueckner, 1985; Zack and 148
John, 2007). The presence of isotopic disequilibrium, as evidenced by, for example, negative 149
Sm-Nd model ages, or extreme ranges of Nd isotopic ratios, are further indicators of REE 150
transport (e.g., Windrim et al. 1984; Munz et al. 1994). 151
This paper will center on selected studies for which the mass balance assessment of 152
element transport, including major and trace elements, is feasible. This is related to, but distinct 153
from, the ever-growing body of work that has illuminated REE partitioning between phases at 154
the scale of hand samples or thin sections. Such REE redistribution can be the result of 155
progressive reaction in closed or nearly closed systems, and need not indicate mobility into or 156
out of a rock mass. Studies of the REE patterns of individual phases are a critical aspect of 157
understanding the geochemistry of REE, but our focus is mostly on bulk-rock chemistry and the 158
prospect of larger-scale mobility in focused flow environments including veins, lithologic 159
contacts, and shear zones. REE mobility in shallow and/or low-temperature settings including 160
hydrothermal seafloor alteration, burial metamorphism, and contact metamorphic phenomena 161
such as skarns (e.g., Hellman et al. 1979; Windrim et al. 1984; Bartley, 1986; Gruau et al. 1992; 162
Marsh et al. 2012; Durand et al, 2015; Floess et al. 2015) is for the most part not considered, the 163
emphasis being placed on deeper lithospheric processes. 164
Most of the data has been published; some is presented here for the first time (Table 1). 165
The data set is by no means exhaustive, but it nonetheless attempts to document the more 166
common sorts of mobility recognized in nature. 167
Some Comments on Determining Chemical Changes in Rocks 168
9
Mass balance analysis compares rocks that have been chemically changed by fluid 169
infiltration to those that have not in order to determine what elements have been gained or lost. 170
The governing equations describing mass and volume changes have been well studied; 171
derivations and discussion can be found in, for example, Gresens (1967), Grant (1986), Brimhall 172
and Dietrich (1987), Brimhall et al. (1988), Ague (1994a), and Baumgartner and Olsen (1995). A 173
brief summary is given in the appendix. The final mass balance expressions are similar 174
regardless of treatment, although Brimhall and Dietrich (1987) and Brimhall et al. (1988) 175
illuminated the relationships between mass change, rock and mineral density, porosity, and 176
volume change. 177
Closure 178
Despite the straightforward mathematical nature of the equations, the basic problem of 179
how to quantify rock mass and volume changes has generated a remarkable amount of confusion 180
over the years. The source of much of this confusion is the fact that increases or decreases in the 181
weight percent or ppm of an element need not correlate with actual gains or losses of the mass of 182
that element. At first, this seems very counterintuitive. If the concentration of, for example, La 183
increases from 100 to 125 ppm during some fluid-driven mass transfer event, doesn’t that have to 184
mean that the rock gained La? 185
It turns out that there is more than one explanation and La need not have been gained. 186
Suppose that 20 wt. % silica was removed from the rock due to, for example, local diffusion to 187
an adjacent quartz vein. Such mass changes are commonly observed (e.g., Ague, 1994b; 188
Penniston-Dorland and Ferry, 2008). So 100 g of rock now has a mass of 80 g. Let us further 189
assume that La was immobile during this alteration. Compositions are normalized to 100 wt. %, 190
so the new La concentration is: (100 ppm/80) 100 = 125 ppm. Somewhat surprisingly, then, the 191
10
La increase from 100 to 125 ppm had nothing to do with La addition in this hypothetical 192
example. Conversely, if the rock gained mass, the concentration of La would be decreased. The 193
key point is that the concentrations of immobile elements can change during metasomatism. For 194
cases where the REE are immobile, REE patterns can be shifted up (rock mass loss) or down 195
(rock mass gain) (e.g., Masters and Ague, 2005; Wagner et al. 2010; Fig. 2). 196
The complicating factor here is closure: the concentrations of all the constituents in the 197
composition have to add up to 100 wt. % (within analytical error). Thus, due to the 100 % 198
normalization constraint, changes in one oxide or element will impact one or more of the others 199
(e.g., Chayes, 1949; 1971). Therefore, compositions are inherently multivariate, and statistical 200
analysis of compositional data commonly benefits from multivariate statistical techniques (e.g., 201
Aitchison, 1986; Woronow and Love, 1990; Ague and van Haren, 1996; Ague, 2011). The core 202
of this multivariate approach is to use ratios of concentrations, not their absolute values. Because 203
ratio statistics tend not to be Gaussian and for other technical reasons, it is better to work with 204
the logarithms of ratios rather than the ratios themselves, but this is easily done. Note that 205
expressing compositions in moles does not alleviate the closure problem, as the underlying 206
closure correlations remain. 207
208
Relative and absolute chemical changes 209
Chemical changes can be determined in a relative or absolute sense. Assessing relative 210
changes only requires consideration of elemental ratios, whereas some type of reference frame is 211
required to assess absolute changes (see below). 212
Consider the increase in La/Lu along a metapelite layer approaching a fluid conduit in 213
Figure 3a. There is no ambiguity regarding the precursor rock, so the change in ratio means 214
11
unequivocally that metasomatic changes have occurred. The percent change in ratio can be 215
quantified, as can the statistical significance of differences in ratios between groups of samples 216
(e.g., Woronow and Love, 1990). 217
The effects of metasomatism are undeniable in Figure 3a, but there are multiple (five) 218
interpretations for what actually happened. (1) La was added and Lu was lost. (2) La was added 219
and Lu remained constant. (3) La and Lu were both added, but La was added to a greater extent. 220
(4) La and Lu were both lost, but Lu was lost to a greater extent. (5) La was constant and Lu was 221
lost. For this example, the mass transfer followed (2), resulting in a nearly order-of-magnitude 222
increase in Lu/La. Figure 3b depicts a decrease in Eu/Sm toward a fluid conduit in a metarbonate 223
rock. Here, both Eu and Sm were gained, but Sm was gained to a greater extent. 224
For many purposes, the change in ratio is all that is needed to test a particular geologic 225
hypothesis. On the other hand, to differentiate between the five possibilities for ratio change, 226
some type of reference frame is needed to enable quantification of mass changes for each 227
element individually. Three reference frames are available: (1) zero or known rock mass change; 228
(2) zero or known rock volume change (e.g. Chowdhury et al. 2013; Centrella et al. 2016); and 229
(3) zero mass change for an “immobile” element or elements. 230
The geochemical reference frame of option (3) is the most general and permits evaluation 231
of rock mass, volume, and individual element changes. There have been many discussions of 232
how best to select the geochemical reference frame to which the reader is referred (e.g., Grant, 233
1986; Brimhall et al. 1988; Ague, 1994a; 2003; Baumgartner and Olsen, 1995; Ague and van 234
Haren, 1996; Penniston-Dorland and Ferry, 2008). Typical elements considered in this regard are 235
the high-field strength elements (HFSE); Zr has received perhaps the most attention. Some 236
commonly-employed elements, like Al and Ti, have limited mobility in some geologic settings, 237
12
but can be quite mobile in others. Using the REE as a reference frame without careful evaluation 238
could be highly problematic as they can undergo significant transport despite being HFSE (see 239
below). Moreover, in extreme environments, including some ultrahigh-pressure (UHP) rocks and 240
zones of extensive partial melting, all or nearly all elements can be mobilized, thus limiting the 241
utility of the geochemical reference frame approach. In what follows, the reference frame used in 242
the original studies (option 1, 2, or 3) is also used herein unless otherwise noted. Statistical 243
treatment of data follows Ague (2011). 244
Care must be taken when reading the classic paper by Grant (1986) which describes the 245
“isocon” method for quantifying metasomatic changes. The method as employed in, e.g., Figure 246
2 of Grant (1986) is straightforward. However, it is also asserted that for immobile elements, the 247
change in “geochemical concentration” is equal to zero (p. 1977). Such “geochemical 248
concentrations” must not be confused with actual concentrations; as shown above, the 249
concentrations of immobile elements must vary due to the closure constraint if there are overall 250
rock mass changes. It follows that the concentrations of immobile elements will be unchanged 251
only in situations where there has been no overall bulk rock mass change (e.g., 100 kg of starting 252
rock is transformed into 100 kg of altered rock). However, this is not the general case in 253
metasomatism. 254
A further important consideration is that physical mixing of rock types may produce a 255
very different metasomatic signature than fluid infiltration. This can affect, for example, the 256
metasomatic rinds on blocks within deforming subduction zone mélange (e.g., Bebout and 257
Barton, 2002; Penniston-Dorland et al. 2014). 258
13
Finally, intrinsic variations in pre-alteration rock chemistry due to, for example, original 259
sedimentary heterogeneities or igneous fractionation, may be large enough to obscure or mask 260
the geochemical evidence for metasomatism (e.g., Penniston-Dorland and Ferry, 2008). 261
262
REE Behavior During Fluid-Rock Interaction 263
Rock types and patterns of REE mobility 264
The data set focuses on representative examples for which quantitative mass balance 265
analysis is viable. These have direct relationships between precursors and their altered 266
equivalents together with well-defined reference frames, as well as compositional data for a 267
reasonably wide range of major, minor, and trace elements. Given these constraints, metasomatic 268
studies that lack REE analyses, or that have REE and trace element analyses but lack major 269
elements are, with two exceptions, not included in the data set. New studies are being published 270
on a regular basis; unfortunately, some are too recent to be incorporated herein but it would be 271
very instructive to include them in future updates to the data set. 272
To help facilitate discussion, rock types are subdivided somewhat arbitrarily into six 273
broad categories. (1) Regional metamorphism including mostly Barrovian metamorphism of 274
pelitic rocks but also mafic lithologies. (2) Regional metamorphism of carbonate rocks. (3) 275
Subduction zone metamorphism including pelitic and mafic precursor rock types. (4) Subduction 276
zone metamorphism of carbonate rocks. (5) Greenschist facies shear zones cutting granitic rocks, 277
Mont Blanc Massif. (6) The final category comprises examples that do not fit neatly into the 278
other categories: dynamothermal aureole (shear zone), magmatic/pegmatite fluid infiltration, and 279
charnockite formation. The mass changes for many elements including the REE and other HFSE 280
can be significant in this category, thus pushing the limits of mass balance-type analysis. The 281
14
charnockite example is from the classic locality at Kabbaldurga, southern India (Stähle et al. 282
1987), but is not intended to represent all forms of charnockite-related mass transfer. Rather, it is 283
included as an illustration of strong HREE metasomatism (see below). 284
Patterns of REE mobility have also been subdivided, as follows. (A) Limited or no REE 285
mobility. (B) Light REE mobility. (C) Heavy REE mobility. (D) Overall loss of REE. (E) 286
Europium “anomalies”. The quotation marks are employed to distinguish between the Eu mass 287
changes due to fluid-rock interaction studied herein and other processes for which the term Eu 288
anomaly is typically used such as igneous fractional crystallization. (F) Local redistribution of 289
REE. Some overlap between categories is unavoidable as samples may be characterized by 290
multiple patterns of metasomatism. 291
The element with the maximum mass change is referred to as REEMax (values are given 292
in Table 1). The most common REEMax elements are La, Yb-Lu, and Eu; they are associated 293
primarily with LREE, HREE, and Eu “anomaly” mass transfer, respectively, and account for 294
about half of the total. For the remainder, all REE except Nd and Er are found as REEMax. These 295
relationships should not be taken as representative of all natural systems, as the data set is not a 296
statistical sampling of every form of REE mass transfer. 297
298
Graphical representation of chemical changes 299
Two types of plots are used extensively in this paper. The first type is percentage mass 300
change diagrams for REE and other selected elements (Figs. 4, 6, 8, 10, 12, 14). Some data sets 301
have small numbers of samples that may not fully represent the chemical variability of 302
precursors or their altered equivalents, thus limiting the amount of statistical analysis that can be 303
done. In some cases, only one precursor and one altered analysis are available. When they can be 304
15
calculated, ±2σ standard errors on average mass change values are shown. It is very important to 305
point out that these are not chondrite-normalized plots, but rather depictions of elemental 306
percentage mass change (mass gains are positive, losses negative). The second type of plot was 307
developed herein and is referred to as a “bar code” diagram. These display percentage mass 308
changes using a color-coding scheme (Figs. 5, 7, 9, 11, 13). Given the statistical limitations 309
noted above, the mass changes are grouped into broad ranges that attempt to capture the general 310
patterns of metasomatism while avoiding unwarranted detail that could lead to 311
overinterpretation. 312
Immobile or limited mobility of REE 313
While the data set is not a statistically-comprehensive survey of all types of REE 314
mobility, more examples (about 1/3) fall into this group than any other and include all the rock 315
type categories noted above except category (6) (Figs. 4, 5). Thorium mobility is very rare in this 316
group, as it is in most others. On the other hand, there are several examples of significant U 317
metasomatism in subduction (LM7–LM9) and shear zone settings (LM13). Two examples 318
underwent large P mass changes (LM2, LM11), but most did not. However, although mean P 319
mass changes may be indistinguishable from zero statistically, 2σ uncertainties can be large 320
which suggests local scale redistribution of P even though it was not lost or gained overall. 321
Yttrium was mostly immobile in these examples, although several display small gains or losses. 322
Importantly, a wide array of other major and trace elements were mobile, illustrating that 323
significant rock chemical alteration is possible without strongly affecting the REE (Fig. 5). The 324
patterns of element mobility vary considerably, but most samples lost considerable LILE. 325
Mobility of the LREE 326
16
Most examples gained LREE, but losses are also observed (Figs. 6, 7). For samples that 327
gained LREE, enrichments can be extreme and in some cases exceed +1000 %. Where data are 328
available, these LREE gains are commonly associated with phosphates, particularly monazite 329
and/or apatite; allanite can be another important LREE host in this group (Pan and Fleet, 1996). 330
Gains of P, Y, or both are consistent with LREE concentration in phosphate phases. Most of 331
these rocks lack garnet or other phases that would concentrate the HREE. For example, LREE2 332
has only 1-2 volume % garnet. Loss of HREE and Y due to hornblende breakdown to biotite in 333
the dynamothermal ophiolite aureole example (LREE6) is inferred to have been offset by HREE 334
gains due to garnet growth (Dostal et al. 1980). In addition, the rock gained substantial Zr, Th, 335
and U, so growth of metasomatic zircon may also have helped offset HREE losses. Although not 336
specified in the original paper, the large gains in P strongly suggest that LREE gains were 337
associated with a phosphate phase or phases. The LREE loss examples are also associated with 338
phosphates. For example, LREE5 lost P and contains irregular monazite grains interpreted to be 339
corroded relics. In addition, this example preserves remnants of allanite in kyanite; this could 340
also have contributed to LREE loss. 341
All examples underwent various forms of major and minor element metasomatism; 342
clearly, REE transport did not occur without the mobilization of other elements as well (Fig. 7). 343
Calculated mass additions for LREE2 increase smoothly with decreasing atomic number 344
implying systematic open system behavior. However, it should be noted that due to uncertainties 345
in the LREE2 geochemical reference frame and intrinsic sample heterogeneity, it is debatable if 346
the LREE mass additions calculated herein for this example are in fact significant (Penniston-347
Dorland and Ferry, 2008). Nonetheless, reference frames using Al, Ti, and two Zr measurements 348
17
(XRF or ICP-MS) yield a mean mass change for La of 52.4% ± 6.4% (2σ standard error), an 349
uncertainty roughly the size of the data symbols in Figure 7. 350
Mobility of the HREE 351
Gain of HREE is the most commonly observed pattern in this group (Figs. 8, 9). Where 352
data are available, this was due mainly to the growth of garnet or xenotime; hornblende and 353
sphene may also have been important in some instances (Fig. 8). Gain of HREE is commonly 354
coupled to gain of Y, which is unsurprising given the importance of phases like garnet or 355
xenotime in the chemical alteration. Phosphorous behavior is more variable. Example HREE9 356
that interacted with pegmatite fluids gained Th. Metasomatic apatite in this sample contains Th 357
(Carson and Ague, 2008), and it was also likely hosted by allanite (e.g., Hermann, 2002). 358
Otherwise there was little Th mobility in this group. HREE9 also gained U, but the mineral host 359
is uncertain. The example of incipient charnockite formation (HREE10) has the most striking 360
REE losses, attributed to zircon, apatite, and monazite destruction by Stähle et al. (1987). 361
Many other major and trace elements were mobile but they do not vary systematically 362
with HREE mass changes (Fig. 9). 363
Overall loss of REE 364
Examples which lost all REE are less common than others in the data set (Figs. 10, 11). 365
They span a diverse range of settings: subduction complex, magmatic-hydrothermal fluid 366
alteration, charnockite, and Barrovian metapelite. The subduction examples involve high fluid 367
fluxes and infiltration of fluids with low solute loads capable of dissolving REE and destroying 368
REE carriers including epidote, titanite, garnet, and/or phosphates (John et al. 2008; van der 369
Straaten et al. 2008). The magmatic-hydrothermal fluid example is highly altered metapelite 370
consisting mostly of sillimanite, muscovite, and graphite at the contact with pegmatite and 371
18
associated quartz veins. REE loss is inferred to be the result of apatite, monazite, and garnet 372
destruction during alteration. The Barrovian example is a plagioclase-rich alteration selvage 373
adjacent to a quartz vein. Garnet breakdown led to HREE and Y loss, and there is considerable 374
evidence for overgrowths on, and dissolution-reprecipitation of, apatite which likely affected the 375
LREE and mid REE (MREE) (Masters and Ague, 2005; Ague and Baxter, 2007). As noted 376
above, loss of REE during incipient charnockite formation was attributed to zircon, apatite, and 377
monazite destruction by Stähle et al. (1987). All examples lost P, Y, and U; extreme fluid-rock 378
interaction even caused Th loss in two cases. No discernible correlations of REE behavior with 379
that of other elements are evident (Fig. 11). 380
Fluid-rock interaction and europium “anomalies” 381
The precipitation or breakdown of plagioclase or lawsonite largely control gains or losses 382
of Eu with respect to other REE. These Eu mass change “anomalies” are here subdivided into 383
four categories (Figs. 12, 13). (1) Fluid-rock interactions that destroy plagioclase can deplete Eu, 384
whereas those that produce plagioclase can enrich it. For example, in Eu1, plagioclase and garnet 385
grew in response to fluid infiltration. The growth of garnet is inferred to have produced the Y 386
enrichment. Minor to moderate losses of some REE in this example may have resulted from 387
phosphate mineral destabilization. In Eu2, plagioclase was destroyed, leading to a negative 388
“anomaly”. (2) The precipitation of plagioclase from vein-forming metamorphic or pegmatitic 389
fluids progressively depletes the fluids in Eu relative to neighboring REE. Consequently, these 390
Eu-depleted fluids can produce metasomatic REE patterns characterized by negative Eu 391
“anomalies” in the rocks they infiltrate (Eu3, Eu5, Eu6), even if the infiltrated rocks lack 392
plagioclase (e.g., Eu3; Ague, 2003; Carson and Ague, 2008). Profiles across zones of altered 393
rock adjacent to conduits for such fluids commonly show progressively deepening Eu 394
19
“anomalies” as the conduits are approached (Eu3). (3) Redistribution of Eu among feldspars 395
resulting in little or no overall Eu mass change. For the charnockite example (Eu7), the positive 396
Eu “anomaly” is very distinct relative to the other REE, most of which were lost due to 397
destruction of apatite, monazite, and zircon (Stähle et al. 1987). (4) Preferential enrichment of Eu 398
is also observed in metasomatic lawsonite (Eu6; Vitale Brovarone et al. 2014). Oxygen fugacity 399
is not quantified for all the examples so its role remains to be established. 400
Most of the examples gained Y, whereas P behavior was more variable. U was either 401
immobile or was gained; both Th and U were added to two examples at pegmatite contacts (Eu5, 402
Eu6). 403
Local redistribution of REE 404
Local-scale transport of REE can also occur within a rock mass; two examples are shown 405
in Figure 14. Average mass changes converge to around zero with a large standard deviation 406
indicative of local redistribution. Fluid flow was highly channelized in both the subduction 407
example (R1,2) and the granitic shear zone example (R3,4). For the subduction case, HREE loss 408
due to reaction of pre-existing rutile and sphene was followed by HREE reincorporation into 409
newly-grown garnet (Beinlich et al. 2010). For the shear zone, LREE losses were associated with 410
alteration of protolith magmatic minerals whereas gains resulted from precipitation of new 411
LREE-bearing phases (e.g., monazite, bastnäsite, aeschynite and tombarthite; Rolland et al. 412
2003). 413
414
Geochemical Relationships Among Elements 415
Neighboring REE 416
20
Neighboring REE, such as La-Ce, Sm-Nd, and Yb-Lu, are strongly positively correlated 417
along 1:1 percentage mass change lines (Fig. 15). The LREE have the largest range of mass 418
changes (Fig. 15a). The HREE have a notably smaller range but nonetheless can undergo 419
considerable mobility (Fig. 15d). Europium mass change “anomalies” are clearly discernible 420
when plotted with respect to neighboring Sm (Fig. 15c). Aside from this Eu behavior, a key point 421
to emphasize is that adjacent REE are in most cases mobilized together. It follows that constancy 422
of neighboring REE ratios does not mean that the elements were immobile. 423
Phosphorous and Yttrium 424
Mass changes for La (a representative LREE) correlate positively with those for P (Fig. 425
16a). Similar relations hold for REEMax-P, although there is somewhat more scatter (Fig. 16b). 426
On the other hand, there is considerable scatter in HREE (Lu)-P mass changes, and the positive 427
correlation between them is very weak at best (Fig. 16c). Mass change relations for P-Y are quite 428
scattered as well, although there is a dispersed positive correlation (Fig. 16d). Positive 429
correlations between Lu-Y and REEMax-Y, however, are much stronger, remarkably so for 430
REEMax-Y (Figs. 16e, f). 431
Five samples fall off the REEMax-Y 1:1 correlation line (Fig. 16f). The REEMax elements 432
for the four non-metacarbonate examples are in the LREE (e.g., La); they underwent large P 433
gains as well. The LREE mass changes are less strongly linked to Y changes than the MREE or 434
HREE. Two of these five nonetheless also gained significant Y. The metacarbonate sample 435
(HREE3) has strong gains of HREE, Y, and P. 436
Thorium, Uranium, and Niobium 437
Thorium is largely immobile or nearly so for most rocks (Figs. 17a, b). Only five 438
examples display clear Th mass transfer. (1) A mylonite shear zone in a dynamothermal aureole 439
21
below an ophiolite remnant that channeled high-T fluids (LREE6; Figs. 6, 7). (2, 3) Two 440
examples of orthogneiss infiltrated by magmatic-hydrothermal fluids exsolved from pegmatite 441
dikes (Eu6/HREE9 and Eu7; Figs. 12, 13). (4) Graphitic sillimanite-muscovite rock derived from 442
metapelite adjacent to or incorporated into a pegmatite-quartz vein complex (LOSS2; Figs. 10, 443
11). (5) High-P (HP) or possibly ultrahigh-P (UHP) eclogite facies veins derived from blueschist 444
by prograde devolatilization (LOSS3; Figs. 10, 11). Glaucophane, dolomite, and sphene were 445
replaced by omphacite, garnet, and rutile; ~75% of the rock’s total carbon was released as CO2 to 446
infiltrating fluids (John et al. 2008). In summary, four of the five examples involve aureoles 447
and/or magmatic-hydrothermal fluids, and the fifth is from a HP (UHP?) setting in a subduction 448
zone. 449
A plot of Th-U mass changes shows that U is more mobile than Th such that U mass 450
transfer can occur without mobilization of Th (Fig. 17a). This is consistent with experimental 451
evidence showing higher U solubilities relative to Th in aqueous fluids given sufficiently 452
elevated oyygen fugacity and/or salinity (e.g., Bailey and Ragnarsdottir, 1994; Bali et al. 2011). 453
In the five examples for which Th was mobile, however, a very clear positive correlation of U-454
Th mass changes exists (Fig. 17a). Furthermore, for these rocks, the positive correlation between 455
Th and REEMax mass changes is also strong (Fig. 17b). Thus, Th mobilization did not occur 456
without U and REE mobilization in the studied samples. 457
Mass changes for U and REEMax tend to be associated, although there is considerable 458
scatter (Fig. 17c). U and Nb mass changes appear to be roughly correlated (Fig. 17d); in the 459
subduction rocks, this may reflect some control of U-Nb geochemical systematics by rutile (e.g., 460
Rudnick et al. 2000). 461
462
22
Alkalis and Alkaline Earths 463
Relationships among selected alkali and alkaline earth elements are shown in Figures 18–464
20. Loss of K together with Na is common (Fig. 18a). Coupled Na gain and K loss, as well as K 465
gain and Na loss, are also observed. Remarkably, however, there are no examples of both 466
significant Na and K gain. Overall, there are many more examples of K loss than K gain in the 467
data set, although it is possible that this reflects some degree of sampling bias. 468
Geochemically, Ca commonly behaves similarly to Na giving rise to sodic-calcic 469
metasomatism in crustal settings (e.g., Battles and Barton, 1995; de Jong and Williams, 1995; 470
Ague, 1997). For non-subduction zone rocks, there is a general positive correlation between Na 471
and Ca mass changes, reflecting the important control of plagioclase as a host for these elements 472
(Fig. 18c). One low-grade metacarbonate example diverges strongly from the trend as it contains 473
albite-rich feldspar (HREE3). As expected on geochemical grounds, Ca and Sr mass changes are 474
positively correlated (Fig. 18e). Thus, although they differ in detail, Ca-K and Sr-Rb systematics 475
resemble those for Na-K, with few or no examples of coupled Ca-K gain or Sr-Rb gain (Figs. 476
18b, f). 477
Subduction zone rocks, on the other hand, display no Na-Ca correlations, although the 478
lack of examples of simultaneous Na-Ca gain is conspicuous (Fig. 18d). In subduction settings, 479
Na and Ca are not closely coupled in plagioclase, but instead are distributed across multiple 480
phases (e.g., lawsonite, glaucophane, omphacite, garnet, epidote) facilitating a range of behavior. 481
The subduction metacarbonate examples are distinct. Their strong Na-gains reflect growth of 482
sodic phases such as glaucophane, omphacite, and pectolite (LM11, LM12, HREE8). Calcium 483
loss in two of these examples resulted from stoichiometric carbonate mineral dissolution 484
occurring simultaneously with silicate precipitation (Ague and Nicolescu, 2014). The dissolved 485
23
carbonate species are transported away from the site of reaction and may precipitate elsewhere in 486
the subduction zone (e.g., Piccoli et al. 2016; Scambelluri et al. 2016). The liberated Ca could 487
also potentially drive calcic metasomatism and the growth of Ca-bearing silicates including 488
lawsonite (e.g., Alberto Brovarone et al. 2014) or clinopyroxene (e.g., LM10, in which 489
glaucophane broke down and Ca-bearing sodic clinopyroxene grew). 490
Excellent positive correlations exist between mass changes for K and those for the 491
geochemically-similar trace elements such as Rb hosted largely by micas and/or K-feldspar (Fig. 492
19a). Correlations among K, Ba, and Cs are similar (not shown). Pb mass changes do not 493
correlate well with these elements, but do show a positive relationship with Sr mass changes, 494
indicating significant coupling of Sr-Pb behaviors (Fig. 19b). For non-subduction zone rocks, 495
this is probably due to growth or breakdown of plagioclase. The large Pb gain recorded by LM8 496
that falls off the general trend is inferred to be related to Pb incorporation into abundant sulfide 497
minerals (mostly pyrite and chalcopyrite). The three examples plotting well above the trend are 498
characterized by extensive lawsonite (Eu4, Eu5) or epidote metasomatism (LM1). REEMax mass 499
changes (or those of individual REE) do not vary in any clear systematic way with Rb, Sr, K, Ba, 500
Cs, Ca, or Na mass changes overall across the dataset (not shown). 501
502
Volatiles, REE, and Alkalis 503
REEMax mass changes relative to those of the major volatiles are shown in Figure 20a. 504
The bulk of the volatile data are actually X-ray fluorescence loss on ignition values, which serve 505
as proxies mostly for H2O and CO2 contents (but also include organic matter oxidized during 506
analysis and other complications). Data for actual H2O and CO2 contents, as well as other 507
volatiles including F, S, and Cl, are available for some examples but are not treated separately as 508
24
they are not determined in most analyses. The REEMax-volatile mass changes range widely and 509
all fields of the mass change diagram are occupied. The patterns for La, Sm, and Lu differ, as 510
expected given the differing mass changes for LREE, MREE, and HREE (Fig. 15), but 511
systematic trends with volatile mass changes are not obvious (not shown). 512
Alkali metal behaviors relative to rock volatile gain or loss are shown in Figure 20b. For 513
rocks that lost volatiles, only two main types of Na-K behavior are observed: 1) gain of Na and 514
loss of K or 2) loss of both Na and K. For rocks that gained volatiles, gain of K and loss of Na is 515
also possible, in addition to the two other types (Fig. 20b). As noted above, the lack of any 516
examples that gained both K and Na is striking. Ca-K and Sr-Rb systematics are similar to those 517
of Na-K (not shown). Figure 20b illustrates that K is generally lost when volatiles are lost (also 518
the case for Ba, Cs, and Rb). Potassium and related elements can also be lost if volatiles are 519
gained. Notably, however, volatile gains were required to add K to the rocks of the dataset, 520
coupled to Na loss (Fig. 20b). 521
522
Discussion 523
The mobilization of REE is always accompanied by the mobilization of an array of other 524
non-REE major and trace elements. On the other hand, numerous examples exist of extensive 525
mobilization of non-REE without significant open-system transport of the REE. The patterns of 526
REE transport show no clear correlations with the general form of major element metasomatism, 527
such as Si-Al, Mg-Fe, or alkali-alkaline earth metasomatism (Figs. 5, 7, 9, 11, 13). Of course, for 528
individual examples, there is coupled mass transfer among elements, but with the exception of P 529
and Y (see below) the overall lack of systematic relationships across the entire data set is 530
striking. 531
25
The mobilization of REE is, however, a strong function of the growth or breakdown of 532
REE-bearing phases. Given the wide range of rock types investigated, the number of key phases 533
is notably small. Mass transfer involving LREE and MREE in the data set was dominated by 534
reactions involving apatite, monazite, and allanite/epidote-group minerals; rarer phases including 535
Ca-LREE-fluorocarbonates can also be important. Metasomatism involving plagioclase or 536
lawsonite determines Eu mass change “anomalies” relative to neighboring REE. Metamorphic 537
HREE systematics are controlled largely by garnet and xenotime. Contributions from 538
hornblende, rutile, sphene, extremely REE-rich phases like tombarthite, and in rare cases even 539
zircon are documented as well. 540
The REE are locally redistributed among phases, in closed or open systems, and can be 541
added or lost from rocks during fluid-rock interaction. REE-bearing phases that precipitate take 542
REE out of fluids, whereas those that breakdown release REE. One possibility is that the host 543
phase is already present in the rock. For example, garnet that grows during infiltration could pick 544
up HREE and Y and thus add them to the bulk rock (e.g., HREE1). Garnet breakdown would do 545
the opposite (e.g., LREE6). Another possibility is that fluid-dominated metasomatism is so 546
extensive that new REE-bearing phases are produced. Examples include the growth of xenotime 547
associated with P and Y metasomatism and the consequent enrichment of HREE (HREE3), and 548
the growth of monazite, bastnäsite, aeschynite and/or tombarthite in example LREE8. 549
REE and P mass changes are broadly correlated (Figs. 16a, b). This reflects the 550
importance of phosphate minerals—mainly apatite, monazite, and xenotime—to REE 551
metasomatism in many examples. Furthermore, REEMax mass changes for most rocks have an 552
extremely strong positive correlation with Y mass changes (Fig. 16f). The excellent 1:1 553
correlation reflects coupling of HREE or MREE mass changes to Y mass changes. Yttrium and 554
26
the HREE are hosted largely by the same phases (garnet, xenotime), leading to strong Y-HREE 555
covariance. In addition, the ionic radius of Y3+ is very similar to the MREE (e.g., Gd3+), yielding 556
Y-MREE correlations. Five samples whose maximum REE gains are in the LREE fall off the 1:1 557
REEMax-Y correlation line (Fig. 16f). This reflects the strong controls exerted by phases such as 558
apatite and monazite on LREE budgets. Apatite and monazite can contain considerable Y, so Y 559
metasomatism can take place concurrently; indeed, three of these five examples gained Y in 560
addition to LREE. 561
Notably, the uncertainties on mean P mass changes are commonly larger than those for 562
other elements (Fig. 16). Phosphorous mass changes that are statistically indistinguishable from 563
zero but with very large error bars are consistent with significant local redistribution that did not 564
necessarily transport P into or out of the rock. Interface coupled dissolution-reprecipitation (e.g., 565
Putnis and Austrheim, 2010; Putnis and John, 2010) is one process by which this could happen 566
that has implications for the REE systematics of phosphates (e.g., Harlov et al. 2011). For 567
example, dissolution of original grains would release phosphate-hosted REE to infiltrating fluids 568
whereas reprecipitation could incorporate a new suite of REE depending on fluid chemistry. 569
The REE are typically fractionated by metasomatism. More or less equal amounts of REE 570
mass transfer are evident for some REE loss examples, but are otherwise rare. Mobility of just 571
one or several REE is also uncommon; it is only observed herein for an example of Eu 572
sequestration in plagioclase (Eu1). The fractionations reflect the preferences that the dominant 573
REE-host minerals have for particular REE or suites of REE, such as garnet for HREE, 574
plagioclase for Eu2+, and so on. 575
REE metasomatism shows no simple correlations with major volatile (H2O, CO2) loss or 576
gain, but rather a range of behaviors (Fig. 20a). Coupled volatile addition and REE loss suggests 577
27
leaching by infiltrating fluids. Loss of fluids carrying REE during prograde devolatilization may 578
have resulted in combined REE and volatile loss. In addition, prograde volatile loss can be 579
driven by infiltration; this could have either removed REE, or added them depending on fluid 580
composition and mineralogy. A number of rocks also underwent REE mass transfer with 581
relatively little overall volatile mass change (Fig. 20a), so in some cases fluids move in and out 582
of rocks transporting REE without dramatically altering rock volatile contents. 583
The lack of clear correlations between REE mass changes and mass transfer of major 584
volatiles (H2O, CO2) or most non-REE elements (except P) suggests that mechanisms of REE 585
transport differ to some degree from those controlling other mobile constituents. Many REE 586
carriers have been shown or postulated to be in fluids, including F, Cl, carbonate, hydroxide, and 587
sulfate species; other variables including oxygen fugacity (for Eu) and pH can also play 588
important roles (e.g., Michard and Albarède, 1986; Gieré, 1990; Bau, 1991; Gruau et al. 1992; 589
Gammons et al. 1996; Pan and Fleet, 1996; Bao et al. 2008; Harlov, 2012; Manning and 590
Aranovich, 2014). For example, LREE gain in example LREE1 was the result of Ca-REE-591
fluorocarbonate precipitation, indicating a likely role for F and carbonate anions in REE 592
transport. Halogen carriers are commonly inferred, but given that Cl complexes can transport 593
major elements including alkalis and alkaline earths, it is somewhat puzzling that clear, 594
systematic relationships among these elements and the REE are not evident in the data set. In 595
addition to the above possibilities, observed correlations between REE and P and/or Y mass 596
changes could be due to REE transport by P and/or Y complexes, or transport of these elements 597
together by some other complexing agent (e.g., Gieré, 1990; Lee and Byrne, 1992; Ague, 2003; 598
Carson and Ague, 2008). 599
28
It is interesting to note that the strong HREE loss for the charnockite example (HREE10) 600
differs from the bulk of the data set (Fig. 8). This may reflect fluids with reduced water activity 601
due to the role of CO2, brines, and/or melt in charnockite and granulite genesis (e.g., Newton et 602
al. 1980; Valley et al. 1990; Harlov, 2012; Rajesh and Santosh, 2012; Manning and Aranovich, 603
2014), as distinct from predominantly aqueous metasomatic fluids for the other rocks. 604
Major gaps in knowledge remain regarding how dissolved REE are transported in fluids 605
that need to be addressed by new field, fluid inclusion, experimental, and theoretical studies. 606
607
Implications 608
Implications for High Field Strength Elements 609
The data set has clear implications for the mobility of REE and high field strength 610
elements (HFSE). The conventional wisdom is that the REE are relatively immobile in 611
metamorphic fluids. This is indeed the case for roughly 1/3 of the data set. As these examples are 612
all from high-flux environments which mobilized other elements, one would expect little REE 613
mobility in lower flux, less channelized environments as well. Some high flux environments, 614
however, are conducive to REE transport, and examples are shown for all settings considered 615
including Barrovian and subduction zone metamorphism. Moreover, under such circumstances, 616
the REE are typically the most mobile of the elements traditionally considered to be refractory 617
including the HFSE (Fig. 21). 618
On a percentage mass change basis, these elements listed in order of decreasing mobility 619
are: REE>U>Nb>Ti>Th~Zr (Fig. 21). This mobility of REE is broadly consistent with recent 620
experimental results relevant for subduction (Tsay et al. 2014), but more work is clearly needed 621
across a range of settings. Uranium mobility is no doubt influenced by redox state, with higher 622
29
solubilities expected for more oxidizing conditions (e.g., Bailey and Ragnarsdottir, 1994; Bali et 623
al. 2011). Nb displays less, but still considerable mobile behavior, in accord with experimental 624
evidence (particularly in halogen-rich fluids; e.g., Tanis et al., 2015). Rutile, a major host for Nb, 625
has been observed in veins and other metasomatic structures (e.g., Ague, 2003; Gao et al. 2007 ; 626
Spandler et al. 2011). Care must be exercised, however, to determine if the Ti and Nb were 627
transported over great distances, or locally from wallrock to vein (e.g., Ague, 2014). 628
At the lowest mobility end of the spectrum, Th and Zr are largely immobile, at least in 629
the water-dominated fluids studied herein. The lower degrees of mobility of Zr or Th relative to, 630
e.g., Ti, is well established by experiment (e.g., Hermann and Spandler, 2008; Tsay et al. 2016). 631
It is true that Zr and/or Th are used as reference frame elements in quite a few of the studies, but 632
they are not used in all of them and, furthermore, Zr-Th behavior is in most cases strongly 633
coupled which would not be expected if one or both were mobile. The much larger degree of U 634
mobility relative to Th can account for at least some of the isotope disequilibrium commonly 635
observed in arcs, including Tonga-Kermadec, Mariana, and Sunda (e.g., Turner et al. 2001). The 636
largest degrees of element mobility recognized herein for Th and Zr, as well as other HFSE, are 637
found in magmatic/magmatic hydrothermal settings as well as the dynamothermal shear zone 638
aureole, charnockite, and HP (UHP?) rocks (Fig. 17a). The well-known mobility of, for example, 639
Th and U from charnockite and other granulite facies terranes is consistent with this pattern (e.g., 640
Rollinson and Windley, 1980; Hansen and Harlov, 2007; Raith et al. 2016). 641
Notably, one example of HP (UHP?) rock shows considerable HFSE depletion (LOSS3, 642
Table 1; John et al. 2008). It is tempting to hypothesize that this mobility could have been aided 643
by solution of refractory phases into supercritical fluids intermediate between aqueous fluids and 644
30
hydrous melts at extreme pressures (e.g., Manning 2004; Ferrando et al. 2005; Hermann et al. 645
2013). 646
Implications for Garnet and the HREE 647
Garnet has considerable potential to sequester HREE and Y, incorporating these elements 648
from fluids during growth. Garnet is also nearly ubiquitous in medium and high grade regional 649
metamorphic settings. These relationships imply that fluids exiting such settings ascending into 650
shallower parts of the lithosphere will carry with them a geochemical fingerprint depleted in the 651
HREE and Y. Although speculative, perhaps this helps explain why many REE ores are 652
noticeably depleted in the HREE (e.g., Long et al. 2010). 653
Implications for LILE and Alkali Systematics 654
Coupled gain of K and loss of Na is observed mainly for rocks that gained volatiles, 655
consistent with retrograde down-temperature (down-T) flow which tends to add K and remove 656
Na (e.g., Brimhall, 1977; Dipple and Ferry, 1992), or infiltration of fluids from K-rich sources 657
(e.g., pegmatites, micaceous metasediments) (Fig. 20b). Coupled K gains and Na losses are 658
observed for down-T flow in the dynamothermal aureole shear zone (LREE6), flow of 659
magmatic-hydrothermal fluid from K-rich pegmatite into feldspathic orthogneiss (Eu7), 660
retrogression of eclogite to blueschist (LOSS4), and replacement of plagioclase by K-feldspar in 661
charnockite (Eu8/LOSS5/HREE10). 662
Leaching of both K and Na are possible during fluid-rock interaction associated with 663
either prograde devolatilization, or volatile gains. In either case, large fluid fluxes are likely 664
required to drive the alkali metasomatism (e.g., Yardley, 1986; Bucholz and Ague, 2010; Ague, 665
2011). 666
31
Importantly, if K and related elements are mobilized during prograde devolatilization, 667
then they are lost, reflecting transport of these elements out of rocks by escaping fluids (Fig. 20b) 668
(e.g., Melzer and Wunder, 2000), up-T fluid flow that also produces Na ± Ca gains (e.g., Dipple 669
and Ferry, 1992; Ague, 1997), strong alkali leaching (e.g., Yardley, 1986), and/or flow across 670
lithologic contacts (e.g., Ague, 2003; Breeding et al. 2004; Ague and Nicolescu, 2014; Galvez et 671
al. 2013) (Fig. 20b). Examples include the destruction of micas and growth of plagioclase (e.g., 672
Eu1, HREE3) or, in subduction zones, the destruction of phengite and the growth of glaucophane 673
and/or omphacite (e.g., LM11, LM12, HREE8). 674
Comments on LILE and HFSE in Arcs 675
An important general feature of arc magmas are the elevated concentrations of LILE 676
relative to HFSE. In particular, the relative “depletion” of Nb relative to K and related LILE has 677
been extensively studied (e.g., Kelemen et al., 1993). Fluids tend to remove K, Rb, Ba, and Cs 678
during prograde devolatilization in high flux zones, and thus have the potential to deposit these 679
elements elsewhere as they migrate along flow paths. As a consequence, fluids ascending from 680
subducted crust (mafic or metasedimentary) are likely an important source of LILE enrichment 681
in arcs (e.g., Stolper and Newman, 1994; Noll et al. 1996; Schmidt, 1996; Johnson and Plank, 682
1999; Becker et al. 2000). Furthermore, these fluids would in general lack HFSE including Nb, 683
Ti, Th, and Zr, consistent with the observed relative depletions in these elements. 684
At higher temperatures involving partial melting, HFSE including Th are mobilized (e.g., 685
Johnson and Plank, 1999). Zircon solubility in silicate melts is considerable, leading to increased 686
zircon destabilization as temperature increases (e.g., Boehnke et al. 2013). Moreover, Zr 687
partitions into coexisting rutile with increasing temperature (e.g., Zack et al. 2004; Watson et al. 688
2006; Tomkins et al. 2007), further destabilizing zircon. Indeed, at ultrahigh-temperature (UHT) 689
32
conditions in metasedimentary systems, zircon can be completed destroyed (e.g., Kelsey and 690
Powell, 2011). This is likely the case in more mafic bulk compositions as well, but more work 691
remains to verify this. Because rutile, a major Nb host, can remain stable during partial melting, 692
the Nb and Ti anomalies relative to LILE in arcs could be preserved, even though HFSE 693
associated with zircon (e.g., Zr, Th, Hf) could be strongly mobilized. 694
Implications for Geochronology 695
The mobility of Nd, Sm, and Lu has implications for geochronology (Hf data are missing 696
for many examples and are not considered further). Significant mass changes for Sm and/or Nd 697
are present in about 50% of the data set examples; there are fewer examples of Lu changes but 698
mobilization is clearly possible (Figs. 15b, d). Garnet-whole rock Sm/Nd or Lu/Hf 699
geochronology could be affected if, for example, matrix REE values were modified after garnet 700
growth. Whole-rock isochrons (e.g., O’Neil et al. 2012) could be disrupted by scatter or other 701
irregularities if some rocks underwent open-system REE transport and others did not. Pervasive 702
REE metasomatism can take place in large scale, shallow hydrothermal systems (e.g., Hellman et 703
al. 1979; Windrim et al. 1984; Bartley, 1986; Gruau et al. 1992; Marsh et al. 2012). But at higher 704
grades of metamorphism at greater depths, mobility appears to be more localized around, for 705
example, high fluid flux conduits, as discussed herein. Nonetheless, diffusional exchange of Nd 706
and other REE can take place across lithologic contacts, even in environments that did not 707
undergo large fluxes (e.g., Watson and Baxter, 2007). Regardless of mechanism, in most cases 708
Sm and Nd will not be differentially mobilized, such that bulk Sm/Nd ratios remain relatively 709
constant even though considerable mass transfer of both elements may have occurred (Fig. 15b). 710
Implications for Petrotectonic Geochemical Discrimination Diagrams 711
33
Geochemical discrimination diagrams have proven to be invaluable for deducing tectonic 712
settings of magmatism (e.g., Pearce and Cann, 1973; Pearce et al. 1984). Many of these diagrams 713
focus on HFSE, due to their general resistance to alteration. As HFSE can be mobile, however, it 714
is illustrative to see what impact this would have on interpretations of tectonic settings. Consider 715
two examples: the Nb-Zr-Y diagram for mafic rocks (Meschede, 1986), and the Nb-Y diagram 716
for granitic rocks (Pearce et al. 1984). The concentrations of Nb and Y were varied within mass 717
change ranges compatible with Figure 21; Zr was taken to be immobile. Figure 22 shows that 718
this level of variation can skew considerably the field a given rock will plot in. Plotting positions 719
can shift over two, three, or more fields. These results illustrate that immobility of HFSE cannot 720
be taken for granted in petrotectonic studies; this fact becomes increasingly evident as the body 721
of quantitative mass balance studies grows. Appropriate criteria for selecting the least altered 722
rocks are essential to implement, as emphasized by, for example, Pearce (1996). 723
Implications for Major Element Metasomatism During Regional Metamorphism of Pelites 724
Given the remarkable utility of metapelitic mineral assemblages to elucidate 725
metamorphic grade (Barrow, 1893; 1912; Thompson, 1957), the chemical evolution of 726
metapelites during progressive Buchan or Barrovian metamorphism has long been a topic of 727
interest (e.g., Shaw, 1956). It remains relevant today, as pseudosections are typically constructed 728
for systems closed to non-volatile major element mass transfer. Nonetheless, focused flow in and 729
around veins may result in alkali and alkaline earth mass transfer that can stabilize index 730
minerals such as garnet (Ague, 1997) or staurolite and kyanite (Ague, 1994b, 2011; Bucholz and 731
Ague, 2010). Based on a statistical examination of over 350 rock chemical analyses from the 732
literature, Ague (1991) concluded that during progressive metamorphism: (1) in addition to 733
volatiles, significant silica may also be lost; (2) K is commonly lost; and (3) Na and Ca can be 734
34
mobile and be either gained or lost. The data set of the current study is useful to test these 735
findings as it is completely independent of the 1991 data set noted above. 736
Figure 23a confirms the silica loss, and also shows that increasing silica loss is correlated 737
with increasing volatile loss. Even if REE were immobile, they can still undergo considerable 738
concentration increases due to silica loss (Fig. 2). Previous studies have demonstrated that much 739
or all of this silica loss is local, being the result of mass transfer down chemical potential 740
gradients from altered wallrock selvages to adjacent veins. Vein mass balance, however, clearly 741
indicates that more silica is in the veins than can be accounted for by local loss, demonstrating a 742
role for fluid flow in precipitating exogenous silica. Such silica precipitation will in general 743
result from down-temperature flow (Ferry and Dipple, 1991). The fraction of external silica has 744
been found to be in the range of ~30 to >90% (Ague, 1994, 2011; Penniston-Dorland and Ferry, 745
2008; Bucholz and Ague, 2010). Silica can thus be added overall at the outcrop or larger scales 746
(e.g., Ferry, 1992; Breeding and Ague, 2002). If, however, the amount of veining is small, it 747
follows that overall silica additions are modest (e.g. Dasgupta et al. 2009). In addition, one 748
example in the data set gained considerable silica and volatiles (LREE1). It is a heavily altered 749
and silicified wallrock inclusion directly within a vein; it records large fluxes of fluid capable of 750
precipitating exogenous silica. 751
The loss of K and the variable loss or gain of Na and Ca are evident in Figures 23b and 752
23c. To first order, these systematics reflect destruction of micas (Fig. 23b) and Na-Ca mass 753
transfer largely controlled by plagioclase (Fig. 23c). The example of Ca gain and Na loss 754
(HREE1) which plots off the general trend in Figure 23c reflects destruction of feldspar together 755
with uptake of Ca by garnet. The mobility of these elements can, if large enough, help to 756
determine the stability of aluminous phases including chloritoid, garnet, staurolite, and kyanite 757
35
relative to micas and feldspars. Behavior can vary widely; in the low-pressure region of the 758
Barrovian zones, Na-Ca metasomatism, K loss, mica destruction, and feldspar growth was 759
widespread (e.g., LM1–LM3; LREE1). On the other hand, in some other Barrovian settings (e.g., 760
Unst, Shetland Islands, Scotland; Wepawaug Schist, Connecticut) alkali loss and variable Ca 761
behavior are typically observed (e.g., LREE3, LREE4; HREE1). The reasons for these 762
differences remain as important research questions; it is interesting to note in this context that the 763
two latter examples are higher-pressure (~0.8-1.0 GPa) than the first (~0.4-0.5 GPa). 764
The above are broad patterns, but other behavior is of course possible, such as K gain due 765
to large down-temperature fluid fluxes (e.g., van Haren et al. 1996). Moreover, a wide array of 766
other elements can be mobilized, including Al, which can be added to vein-selvage systems (e.g., 767
Figs 7, 9). Regardless of the elements mobilized, the most pronounced effects are found adjacent 768
to conduits such as veins. In regions impoverished in fluid flow due to channelization, or in 769
settings very distal to conduits, much less transfer would be expected. Interestingly, regions of 770
low fluid flux resulting from channelization will tend to border conduits, leading to the non-771
intuitive conclusion that regions of highest and lowest fluxes may be surprisingly closely 772
associated spatially (Fig. 1). Consequently, inferences about mass transfer will be highly 773
dependent on where samples are collected in the flow system. 774
Implications for Carbonate Dissolution and Precipitation 775
Carbon dioxide loss is classically associated with devolatilzation reactions such as: 776
calcite + quartz = wollastonite + CO2. More recently, it has also been recognized that 777
stoichiometric or near stoichiometric carbonate dissolution (e.g., Frezzotti et al. 2011; Ague and 778
Nicolescu, 2014) or precipitation (e.g., Piccoli et al. 2016; Scambelluri et al. 2016) of carbonate 779
phases may occur. In metacarbonate rocks in which calcite or aragonite are the dominant 780
36
carbonate phase, it turns out that stoichiometric carbonate gains or losses will plot near the 1:1 781
line on a Ca-volatile percentage mass change diagram, facilitating distinction of volatile loss 782
behavior. 783
Three types of behavior are shown on Figure 23d. A field for devolatilization is clearly 784
evident, highlighting the important role played by this process. On the other hand, two 785
subduction zone metacarbonate examples plot near the 1:1 mass change line and underwent 786
extensive CaCO3 dissolution (LM11, HREE8). Finally, a syn-metamorphic carbonate-bearing 787
vein from the regional greenschist facies records CaCO3 precipitation (HREE3). It is tempting to 788
speculate that carbonate dissolved at deeper levels of the metamorphic system was redeposited at 789
shallower levels in this vein. Going forward, the answers to these and other questions relating to 790
CO2 mass transfer will be critical to resolve in order to obtain a deeper understanding of deep 791
carbon cycling in the lithosphere. 792
793
Acknowledgements 794
I would like to express my deep appreciation to my colleagues D.M. Rye and M.T. 795
Brandon for countless discussions of fluid-driven processes here at Yale; to J.M. Ferry and D. 796
Rumble for unique geological field experiences that greatly expanded my thinking about 797
metamorphism; to undergraduate students, graduate students, and postdocs J.A. Axler, E.F. 798
Baxter, C.M. Breeding, C.E. Bucholz, C.J. Carson, X. Chu, E.L. Donald, S. Emmanuel, K. 799
Karsh, D.S. Keller, T. Lyubetskaya, R.L. Masters, F. Piccoli, E.M. Stewart, M. Tian, and J.L.M. 800
van Haren who have worked on fluid-rock interaction problems in the lab; and to collaborators 801
and coauthors throughout the years. I sincerely thank J.M. Ferry, R. Milke, and T. Müller for 802
their invitation contribute to this special volume, and S. Chakraborty and S.C. Penniston-Dorland 803
37
for thorough and constructive reviews that significantly improved the paper. Financial support 804
from the National Science Foundation (particularly EAR- EAR-0105927, 0509934, 0744154, 805
0948092, and 1250269), the Department of Energy (DE-FE0004375), the Deep Carbon 806
Observatory, and Yale University is gratefully acknowledged. This report was prepared as an 807
account of work sponsored by an agency of the United States Government. Neither the United 808
States Government nor any agency thereof, nor any of their employees, makes any warranty, 809
express or implied, or assumes any legal liability or responsibility for the accuracy, 810
completeness, or usefulness of any information, apparatus, product, or process disclosed, or 811
represents that its use would not infringe privately owned rights. Reference herein to any 812
specific commercial product, process, or service by trade name, trademark, manufacturer, or 813
otherwise does not necessarily constitute or imply its endorsement, recommendation, or favoring 814
by the United States Government or any agency thereof. The views and opinions of authors 815
expressed herein do not necessarily state or reflect those of the United States Government or any 816
agency thereof. 817
Appendix 818
The following is a brief summary of the mass balance equations describing the chemical 819
and volumetric changes of metasomatism. The reader is referred to Gresens (1967), Grant 820
(1986), Brimhall and Dietrich (1987), Brimhall et al. (1988), Ague (1994a), Baumgartner and 821
Olsen (1995), Ague and van Haren (1996), Ague (2011), and Durand et al. (2015) for discussion 822
of various aspects of these equations. The mass change of a mobile constituent can be calculated 823
using equation (6) for a general system with specified geochemical reference frame, equation 824
(10) for a constant volume system, or equation (16) for a constant mass system. 825
General System 826
38
The basic mass balance expression relevant for describing chemical changes in rocks is 827
(e.g., Brimhall et al. 1988; Ague, 1994a): 828
ii CVCV ′′′= ρρ 000 , (1) 829
in which V and ρ are rock volume and density respectively (including pore space), Ci is the 830
concentration of a reference (immobile) species i defining the geochemical reference frame 831
(mass units), and the 0 and / superscripts refer to the initial and final (altered) states. The volume 832
strain ε is given by: 833
0
0
VVV −′
=ε . (2) 834
Substitution of equation (2) into equation (1) and rearranging for volume strain yields: 835
100
−
′
′
=ρρε
i
ii C
C , (3) 836
in which ει denotes that strain is being computed on the basis of reference element i. The 837
fractional change in mass for some mobile constituent j ( jτ ) is given by: 838
.1000000
000
−′′′
=−′′′
=j
j
j
jjj
CVCV
CVCVCV
ρρ
ρρρ
τ (4) 839
Noting that 0/1 VVi ′=+ε , substitution yields: 840
( ) 1100 −+′′
= ij
jji C
Cε
ρρτ , (5) 841
providing a quantitative relationship between changes in rock chemical and physical properties. 842
This expression may be simplified further by substituting explicitly for volume change: 843
10
0
−
′
′
=j
j
i
iji C
CCCτ . (6) 844
The total change in rock mass Trm is: 845
39
.10000
00
−′′
=−′′=
ρρ
ρρρ
VV
VVVT rm (7) 846
From equation (1), the right side of equation (7) can be recast to give: 847
.10
−
′
=i
irmi C
CT (8) 848
Equations (3), (6), and (8) give fractional changes; percentage changes are obtained by 849
multiplying by 100 (gains are positive, losses negative). 850
Constant Volume or Known Volume Change System 851
For a system with no volume change, the basic mass balance of equation (1) simplifies to: 852
ii CC ′′= ρρ 00 . (9) 853
The mass change for a mobile constituent j is easily obtained from equation (5) by setting the 854
volume strain to zero: 855
100 −′′
=j
jji C
Cρρτ . (10) 856
As final and initial volumes are equal, the total rock mass change in a constant volume system is 857
controlled by the density ratio: 858
1000
00
−′
=−′′=
ρρ
ρρρ
VVVT rm . (11) 859
If the volume change is non-zero, but known, then the change in mass of a mobile 860
constituent j can be calculated from equation (5) by substituting in the known value of volume 861
strain. To calculate the total mass change, we begin by rearranging equation (2): 862
00 VVV +=′ ε . (12) 863
Substituting this expression for V ′ into equation (7) and rearranging gives the expression for the 864
total mass change in a system with known, non-zero volume change: 865
40
( )0
01ρ
ρρε −′+=rmT . (13) 866
If the volume change is zero, this expression reduces to equation (11). 867
Constant Mass or Known Mass Change System 868
In systems with no overall rock mass change, the concentrations of a reference species in 869
the initial and final states are equal. Thus, equation (1) simplifies to: 870
ρρ ′′= VV 00 . (14) 871
It follows that the volume strain expression of equation (3) can be written as follows for a 872
constant mass system: 873
10
−′
=ρρε . (15) 874
Rearranging this expression to give ε + 1 and then substituting the equivalent density ratio into 875
equation (5) yields the mass change for mobile constituent j: 876
10 −′
=j
jj
CC
τ . (16) 877
As there is no overall rock mass change, 0=rmT . 878
In constant mass systems, 1 kg of initial rock has the same mass of 1 kg after alteration. 879
Note, however, that considerable changes in the masses of individual elements may have taken 880
place. The requirement is that the amount of mass lost must equal the amount gained, in order to 881
keep the overall mass constant. 882
If the total change in rock mass Trm is non-zero, but known, then equation (8) for the total 883
rock mass change can be rearranged and substituted into equation (3) for volume strain to yield: 884
( ) 110
−+′
= rmTρρε . (17) 885
41
Similarly, substitution of equation (8) into equation (6) yields the following expression for the 886
mass change of a mobile constituent in a system with known overall mass change Trm: 887
( ) 110 −+
′= rm
j
jj TCC
τ . (18) 888
References Cited 889
Ague, J.J. (1994a) Mass transfer during Barrovian metamorphism of pelites, south-central 890
Connecticut, I: Evidence for composition and volume change. American Journal of 891
Science, 294, 989-1057. 892
Ague, J.J. (1994b) Mass transfer during Barrovian metamorphism of pelites, south-central 893
Connecticut, II: Channelized fluid flow and the growth of staurolite and kyanite. 894
American Journal of Science, 294, 1061-1134. 895
Ague, J.J. and van Haren, J.L.M. (1996) Assessing metasomatic mass and volume changes using 896
the bootstrap, with application to deep-crustal hydrothermal alteration of marble. 897
Economic Geology, 91, 1169-1182. 898
Ague, J.J. (1997) Crustal mass transfer and index mineral growth in Barrow's garnet zone, 899
Northeast Scotland. Geology, 25, 73-76. 900
Ague, J. J. (2003) Fluid infiltration and transport or major, minor, and trace elements during 901
regional metamorphism of carbonate rocks, Wepawaug Schist, Connecticut, USA. 902
American Journal of Science, 303, 753-816. 903
Ague J.J. and Baxter, E.F. (2007) Brief thermal pulses during mountain building recorded by Sr 904
diffusion in apatite and multicomponent diffusion in garnet. Earth and Planetary Science 905
Letters, 261, 500-516. 906
Ague, J.J. (2011) Extreme channelization of fluid and the problem of element mobility during 907
Barrovian metamorphism. American Mineralogist, 96, 333-352. 908
42
Ague, J.J. (2014) Fluid Flow in the Deep Crust. In Treatise on Geochemistry (eds. H.D. Holland 909
and K.K. Turekian), 2nd Edition, vol 4, Elsevier, Oxford, p. 203-247. 910
Ague, J.J., and Nicolescu, S. (2014) Carbon dioxide released from subduction zones by fluid-911
mediated reactions. Nature Geoscience, 7, 355-360. 912
Aitchison, J. (1986) The statistical analysis of compositional data. London, Chapman and Hall, 913
416 p. 914
Bailey, E.H. and Ragnarsdottir, K.V. (1994) Uranium and thorium solubilities in subduction 915
zone fluids. Earth and Planetary Science Letters, 124, 119-129. 916
Bali, E., Audétat, A., and Keppler, H. (2011) The mobility of U and Th in subduction zone 917
fluids: an indicator of oxygen fugacity and fluid salinity. Contributions to Mineralogy 918
and Petrology, 161, 597-613. 919
Banner, J.L. and Hanson, G.N. (1990) Calculation of simultaneous isotopic and trace element 920
variations during water-rock interaction with applications to carbonate diagenesis. 921
Geochimica et Cosmochimica Acta, 54, 3123-3137. 922
Bao, S.-X., Zhou, H.-Y., Peng, X.-T., Ji, F.-W., and Yao, H.-Q. (2008) Geochemistry of REE 923
and yttrium in hydrothermal fluids from the Endeavour segment, Juan de Fuca Ridge. 924
Geochemical Journal, 42, 359-370. 925
Barrow, G. 1893. On an intrusion of muscovite-biotite gneiss in the south-eastern highlands of 926
Scotland, and its accompanying metamorphism. Quarterly Journal of the Geological 927
Society of London, 49, 330-354. 928
Barrow, G. 1912. On the geology of the lower Dee-side and the southern highland border. 929
Proceedings of the Geologist’s Association, 23, 149-156. 930
43
Bartley, J.M. (1986) Evaluation of REE mobility in low-grade metabasalts using mass-balance 931
calculations. Norsk Geologisk Tidsskrift, 66, 145-152. 932
Battles, D.A. and Barton, M.D. (1995) Arc-related sodic hydrothermal alteration in the western 933
United States. Geology, 23, 913-916. 934
Bau, M. (1991) Rare-earth element mobility during hydrothermal and metamorphic fluid-rock 935
interaction and the significance of the oxidation state of europium. Chemical Geology, 936
93, 219-230. 937
Baumgartner, L. P. and Olsen, S. N. (1995) A least-squares approach to mass transport 938
calculations using the isocon method. Economic Geology, 90, 1261-1270. 939
Baxter, E.F. and Scherer, E.E. (2013) Garnet geochronology: timekeeper of tectonometamorphic 940
processes. Elements, 9, 433-438. 941
Bebout, G. E. and Barton, M. D. (2002) Tectonic and metasomatic mixing in a high-T, 942
subduction-zone mélange – insights into the geochemical evolution of the slab-mantle 943
interface. Chemical Geology, 187, 79-106. 944
Bebout, G.E. (2016) Chemical and isotopic cycling in subduction zones (eds. H.D. Holland and 945
K.K. Turekian), 2nd Edition, vol 4, Elsevier, Oxford, p. 703-747. 946
Bebout, G.E. and Penniston-Dorland, S. (2016) Fluid and Mass Transfer at Subduction 947
Interfaces—The Field Metamorphic Record. Lithos, doi: 10.1016/j.lithos.2015.10.007. 948
Becker, H., Jochum, K.P., and Carlson, R.W. (2000) Trace element fractionation during 949
dehydration of eclogites from high-pressure terranes and the implications for element 950
fluxes in subduction zones. Chemical Geology, 163, 65–99. 951
44
Beinlich, A., Klemd, R., John, T., and Gao, J. (2010) Trace-element mobilization during Ca-952
metasomatism along a major fluid conduit: Eclogitization of blueschist as a consequence 953
of fluid–rock interaction. Geochimica et Cosmochimica Acta, 74, 1892-1922. 954
Bickle, M.J. (1996) Metamorphic decarbonation, silicate weathering and the long-term carbon 955
cycle. Terra Nova, 8, 270-276. 956
Boehnke, P., Watson, E.B., Trail, D., Harrison, T.M., Schmitt, A.K. (2013) Zircon saturation re-957
revisited. Chemical Geology, 324-334. 958
Breeding C. M. and Ague J. J. (2002) Slab-derived fluids and quartz-vein formation in an 959
accretionary prism, Otago Schist, New Zealand. Geology, 30, 499-502. 960
Breeding, C. M., Ague, J. J., and Bröcker, M. (2002) Fluid mass transfer of trace elements during 961
retrogression of a high pressure, low temperature metamorphic terrane, Tinos and Syros 962
Islands, Cyclades, Greece. Geological Society of America Abstracts with Programs, 34, 963
503. 964
Breeding, C.M., Ague, J.J., Bröcker, M., and Bolton, E. W. (2003) Blueschist preservation in a 965
retrograded, high‐pressure, low‐temperature metamorphic terrane, Tinos, Greece: 966
Implications for fluid flow paths in subduction zones. Geochemistry, Geophysics, 967
Geosystems, 4, DOI: 10.1029/2002GC000380. 968
Breeding, C. M., Ague, J. J., and Bröcker, M. (2004) Fluid-metasedimentary rock interactions 969
and the chemical composition of arc magmas. Geology, 32, 1041-1044. 970
Brimhall, G.H. (1977) Early fracture-controlled disseminated mineralization at Butte, Montana. 971
Economic Geology, 72, 37-59. 972
Brimhall, G.H and Dietrich, W.E. (1987) Constitutive mass balance relations between chemical 973
composition, volume, density, porosity, and strain in metasomatic hydrochemical 974
45
systems: Results on weathering and pedogenesis. Geochimica et Cosmochimica Acta, 51, 975
567-587. 976
Brimhall, G.H, Lewis, C.J., Ague, J.J., Dietrich, W.E., Hampel, J., Teague, T., and Rix, Peter 977
(1988) Metal enrichment in bauxites by deposition of chemically mature aeolian dust. 978
Nature, 333, 819-824. 979
Bucholz, C.E. and Ague, J.J. (2010) Fluid flow and Al transport during quartz-kyanite vein 980
formation, Unst, Shetland Islands, Scotland. Journal of Metamorphic Geology, 28, 19-39. 981
Carson, C.J. and Ague, J.J. (2008) Early-Palaeozoic metasomatism of the Archaean Napier 982
Complex, East Antarctica: Geological Society, London, Special Publications 2008, 308, 983
283-316, doi:10.1144/SP308.14. 984
Centrella, S., Austrheim, H., and Putnis, A. (2016) Mass transfer and trace element redistribution 985
during hydration of granulites in the Bergen Arcs, Norway. Lithos, 262, 1-10.Chayes, F. 986
(1949) On correlation in petrology. Journal of Geology, 57, 239-254. 987
Chayes, F. (1971) Ratio Correlation. University of Chicago Press, Chicago, 99 p. 988
Chowdhury, P., Taludar, M., Sengupta, P., Sanyal, S., and Mukopadhyay, D. (2013) Controls of 989
P-T path and element mobility on the formation of corundum pseudomorphs in 990
Paleoproterozoic high-pressure anorthosite from Sittampundi, Tamil Nadu, India. 991
American Mineralogist, 98, 1725-1737. 992
Connolly, J.A.D. and Podladchikov, Y.Y. (2007) Decompaction weakening and channeling 993
instability in ductile porous media: Implications for asthenospheric melt segregation. 994
Journal of Geophysical Research-Solid Earth, 112, doi:10.1029/2005JB004213. 995
46
Dasgupta, S., Chakraborty, S., and Neogi, S. (2009) Petrology of an inverted Barrovian sequence 996
of metapelites in Sikkim Himalaya, India: constraints on the tectonics of inversion. 997
American Journal of Science, 309, 43-84. 998
De Jong, G. and Williams, P.J. (1995) Giant metasomatic system formed during exhumation of 999
mid‐crustal Proterozoic rocks in the vicinity of the Cloncurry Fault, northwest 1000
Queensland. Australian Journal of Earth Sciences, 42, 281-290. 1001
Dipple, G.M. and Ferry, J.M. (1992) Metasomatism and fluid flow in ductile fault zones. 1002
Contributions to Mineralogy and Petrology, 112, 149–164. 1003
Dostal, J., Strong, D.F., and Jamieson, R.A. (1980) Trace element mobility in the mylonite zone 1004
within the ophiolite aureole, St. Anothony Complex, Newfoundland. Earth and Planetary 1005
Science Letters, 49, 188-192. 1006
Durand, C., Oliot, E., Marquer, D., Sizun, J-P (2015) Chemical mass transfer in shear zones and 1007
metacarbonate xenoliths: a comparison of four mass balance approaches. European 1008
Journal of Mineralogy, 27, 731-754. 1009
Faccenda, M, Gerya, T., and Burlini, L. (2009) Deep slab hydration induced by bending-related 1010
variations in tectonic pressure. Nature Geoscience, 2, 790-793. 1011
Ferrando, S., Frezzotti, M.L., Dallai, L. and Compagnoni, R. (2005) Multiphase solid inclusions 1012
in UHP rocks (Su-Lu, China): Remnants of supercritical silicate-rich aqueous fluids 1013
released during continental subduction. Chemical Geology, 223, 68-81. 1014
Ferry J. M. (1992) Regional metamorphism of the Waits River Formation, eastern Vermont: 1015
Delineation of a new type of giant metamorphic hydrothermal system. Journal of 1016
Petrology, 33, 45-94. 1017
47
Ferry, J.M. (1994) Overview of the petrological record of fluid flow during regional 1018
metamorphism in northern New England. American Journa1 of Science, 294, 905-988. 1019
Ferry, J.M. and Dipple, G.M. (1991) Fluid flow, mineral reactions, and metasomatism. Geology, 1020
19, 211-214. 1021
Floess, D., Baumgartner, L.P., and Vonlanthen, P. (2015) An observational and thermodynamic 1022
investigation of carbonate partial melting. Earth and Planetary Science Letters, 409, 147-1023
156. 1024
Frezzotti, M.L., Selverstone, J., Sharp, Z.D., and Compagnoni, R. (2011) Carbonate dissolution 1025
during subduction revealed by diamond-bearing rocks from the Alps. Nature Geoscience, 1026
4, 703-706. 1027
Galvez, M., Martinez, I., Beyssac, O., Benzerara, K., Agrinier, P., and Assayag, N. (2013) 1028
Metasomatism and graphite formation at a lithological interface in Malaspina (Alpine 1029
Corsica, France). Contributions to Mineralogy and Petrology, 166, 1687-1708. 1030
Gammons, C.H., Wood, S.A., and Williams-Jones, A.E. (1996) The aqueous geochemistry of the 1031
rare earth elements and yttrium: VI. Stability of neodymium chloride complexes from 25 1032
to 300°C. Geochimica et Cosmochimica Acta, 23, 4615-4630. 1033
Gao, J., John, T., Klemd, R., and Xiong, X. (2007) Mobilization of Ti-Nb-Ta during subduction: 1034
Evidence from rutile-bearing dehydration segregations and veins hosted in eclogite, 1035
Tianshan, NW China. Geochimica et Cosmochimica Acta, 71, 4974–4996. 1036
Gieré, R. (1990) Hydrothermal mobility of Ti, Zr and REE: examples from the Bergell and 1037
Adamello contact aureoles (Italy). Terra Nova, 2, 60–67. 1038
Grant, J.A. (1986) The isocon diagram—A simple solution to Gresens’ equation for metasomatic 1039
alteration. Economic Geology, 81, 1976-1982. 1040
48
Gruau, G., Tourpin, S., Fourcade, S., and Blais, S. (1992) Loss of isotopic (Nd, O) and chemical 1041
(REE) memory during metamorphism of komatiites: new evidence from eastern Finland. 1042
Contributions to Mineralogy and Petrology, 112, 66-82. 1043
Gresens R.L. (1967) Composition-volume relations of metasomatism. Chemical Geology, 2, 47-1044
65. 1045
Griffin, W.L. and Breuckner, H.K. (1985) REE, Rb-Sr, and Sm-Nd studies of Norwegian 1046
eclogites. Chemical Geology, 52, 249-271. 1047
Hanson, R.B. (1997) Hydrodynamics of regional metamorphism due to continental collision. 1048
Economic Geology, 92, 880-891. 1049
Hansen, E.C. and Harlov, D.E. (2007) Whole-rock, phosphate, and silicate compositional trends 1050
across an amphibolite- to granulite-facies transition,Tamil Nadu, India. Journal of 1051
Petrology, 48, 1641-1680. 1052
Harlov, D.E. (2012) The potential role of fluids during regional granulite facies dehydration in 1053
the lower crust. Goescience Frontiers, 3, 813-827. 1054
Harlov, D.E., Wirth, R., and Hetherington, C.J. (2011) Fluid-mediated partial alteration in 1055
monazite: the role of coupled dissolution–reprecipitation in element redistribution and 1056
mass transfer. Contributions to Mineralogy and Petrology, 162, 329-348. 1057
Harlov, D.E. (2012) The potential role of fluids during regional granulite facies dehydration in 1058
the lower crust. Geoscience Frontiers, 3, 813-827. 1059
Hellman, P.L., Smith, R.E., and Henderson, P. (1979) The mobility of the rare earth elements: 1060
Evidence and implications from selected terrains affected by burial metamorphism. 1061
Contributions to Mineralogy and Petrology, 71, 23-44. 1062
49
Hermann, J., 2002, Allanite: thorium and light rare earth element carrier in subducted crust: 1063
Chemical Geology, 192, 289-306. 1064
Hermann, J. and Spandler, C.J. (2008) Sediment melts at sub-arc depths: an experimental study. 1065
Journal of Petrology, 49, 717-740. 1066
Hermann, J., Zheng, Y., and Rubatto, D. (2013) Deep fluids in subducted continental crust. 1067
Elements, 9, 281-287. 1068
John, T., Klemd, R., Gao, J., Garbe-Schönberg, C-.D. (2008) Trace-element mobilization in slabs 1069
due to non steady-state fluid–rock interaction: Constraints from an eclogite-facies 1070
transport vein in blueschist (Tianshan, China). Lithos, 103, 1-24. 1071
Johnson, M.C. and Plank, T. (1999) Dehydration and melting experiments constrain the fate of 1072
subducted sediments. Geochemistry, Geophysics, and Geosystems, v. 1, doi: 1073
10.1029/1999GC000014. 1074
Kelsey, D.E., and Powell, R. (2011) Progress in linking accessory mineral growth and 1075
breakdown to major mineral evolution in metamorphic rocks: a thermodynamic approach 1076
in the Na2O-CaO-K2O-FeO-MgO-Al2O3-SiO2-H2O-TiO2-ZrO2 system. Journal of 1077
Metamorphic Geology, 29, 151-166. 1078
Long, K.R., Van Gosen, B.S., Foley, N.K., and Cordier, D. (2010) The principal rare earth 1079
elements deposits of the United States—A summary of domestic deposits and a global 1080
perspective. U.S. Geological Survey, Scientific Investigations Report 2010-5220, 96 p. 1081
Lee, J.H. and Byrne, R.H. (1992) Examination of comparative rare earth element complexation 1082
behavior using linear free-energy relationships. Geochimica et Cosmochimica Acta, 56, 1083
1127-l 137. 1084
50
Lyubetskaya, T. and Ague, J.J. (2009) Modeling the magnitudes and directions of regional 1085
metamorphic fluid flow in collisional orogens. Journal of Petrology, 50, 1505-1531. 1086
Manning, C.E. (2004). The chemistry of subduction-zone fluids. Earth and Planetary Science 1087
Letters, 223, 1-16. 1088
Manning, C.E. and Aranovich, L.Y. (2014) Brines at high pressure and temperature: 1089
Thermodynamic, petrologic and geochemical effects. Precambrian Research, 253, 6-16. 1090
Marsh, J.H., Grew, E.S., Gerbi, C.C., and Yates, M.G. (2012) The petrogenesis of the garnet 1091
menzerite-(Y) in granulite facies rocks of the Parry Sound Domain, Grenville Province, 1092
Ontario. The Canadian Mineralogist, 50, 73-99. 1093
Masters, R.L. and Ague, J.J. (2005) Regional-scale fluid flow and element mobility in Barrow’s 1094
metamorphic zones, Stonehaven, Scotland. Contributions to Mineralogy and Petrology, 1095
150, 1-18. 1096
Meschede, M. (1986) A method of discriminating between different types of mid-ocean ridge 1097
basalts and continental tholeiites with the Nb-Zr-Y diagram. Chemical Geology, 56, 207-1098
218. 1099
Melzer, S. and Wunder, B. (2000) Island-arc basalt alkali ratios: Constraints from phengite-fluid 1100
partitioning experiments: Geology, 28, 583–586. 1101
Michard, A. and Albarède, F. (1986) The REE content of some hydrothermal fluids. Chemical 1102
Geology, 55, 51-60. 1103
Miller, D.P., Marschall, H.R., and Schumacher, J.C. (2009) Metasomatic formation and 1104
petrology of blueschist-facies hybrid rocks from Syros (Greece): Implications for 1105
reactions at the slab–mantle interface. Lithos, 107, 53-67. 1106
51
Munz, I.A., Wayne, D., and Austrheim, H. (1994) Retrograde fluid infiltration in the high-grade 1107
Modum Complex, South Norway: Evidence for age, source, and REE mobility. 1108
Contributions to Mineralogy and Petrology, 116, 32-46. 1109
Newton, R.C., Smith, J.V., and Windley, B.F. (1990) Carbonic metamorphism, granulites, and 1110
crustal growth. Nature, 288, 45-50. 1111
Noll, P.D., Newsom, H.E., Leeman, W.P., and Ryan, J.G. (1996) The role of hydrothermal fluids 1112
in the production of subduction zone magmas: Evidence from siderophile and chalcophile 1113
trace elements and boron. Geochimica et Cosmochimica Acta, 60, 587–611. 1114
Norton, D.L. and Knapp, R. (1977) Transport phenomena in hydrothermal systems: The nature 1115
of porosity. American Journal of Science, 277, 913-936. 1116
Oliver, N.H.S. (1996) Review and classification of structural controls on fluid flow during 1117
regional metamorphism. Journal of Metamorphic Geology, 14, 477–492. 1118
O'Neil, J., Carlson, R.W., Paquette, J.-L., and Francis, D. (2012) Formation age and 1119
metamorphic history of the Nuvvuagittuq Greenstone Belt. Precambrian Research, 220-1120
221, 23-44. 1121
Pan, Y. and Fleet, M.A. (1996) Rare earth element mobility during prograde granulite facies 1122
metamorphism: significance of fluorine. Contributions to Mineralogy and Petrology, 123, 1123
251-262. 1124
Pearce, J.A. and Cann, J.R. (1973) Tectonic setting of mafic volcanic rocks determined using 1125
trace element analyses. Earth and Planetary Science Letters, 19, 290-300. 1126
Pearce, J.A., Harris, N.B.W., Tindle, A.G. (1984) Trace element discrimination diagrams for the 1127
tectonic interpretation of granitic rocks. Journal of Petrology, 25, 956-983. 1128
52
Pearce, J.A. (1996) A user’s guide to basalt discrimination diagrams (Wyman, D.A., ed.) Trace 1129
element geochemistry of volcanic rocks: Applications for massive sulfide exploration. 1130
Geological Society of Canada, Short Couse Notes, 12, 79-113. 1131
Penniston-Dorland, S.C. and Ferry, J.M. (2008) Element mobility and scale of mass transport in 1132
the formation of quartz veins during regional metamorphism of the Waits River 1133
Formation, east-central Vermont. American Mineralogist, 93, 7-21. 1134
Penniston-Dorland, S.C., Gorman, J.K., Bebout, G.E., Piccoli, P.M., and Walker, R.J. (2014) 1135
Reaction rind formation in the Catalina Schist: Deciphering a history of mechanical 1136
mixing and metasomatic alteration. Chemical Geology, 384, 47-61. 1137
Philpotts, A.R. and Ague, J.J. (2009) Principles of Igneous and Metamorphic Petrology (2nd 1138
ed.). Cambridge, Cambridge University Press, 667 p. 1139
Piccoli, F., Vitale Brovarone, A., Beyssac, O., Martinez, I., Ague, J.J., and Chaduteau, C. (2016) 1140
Carbonation by fluid-rock interactions at High-Pressure conditions: implications for 1141
carbon cycling in subduction zones. Earth and Planetary Science Letters (in press). 1142
Putnis A. and Austrheim H. (2010) Fluid induced processes: Metasomatism and metamorphism. 1143
Geofluids, 10, 254-269. 1144
Putnis A. and John T. (2010) Replacement processes in the Earth’s crust. Elements, 6, 159-164. 1145
Raith, M.M., Brandt, S., Sengupta, P., Berndt, J., John, T., and Srikantappa, C. (2016) Element 1146
Mobility and Behaviour of Zircon during HT Metasomatism of Ferroan Basic Granulite 1147
at Ayyarmalai, South India: Evidence for Polyphase Neoarchaean Crustal Growth and 1148
Multiple Metamorphism in the Northeastern Madurai Province. Journal of Petrology, 57, 1149
1729-1774. 1150
53
Rajesh, H.M. and Santosh, M. (2012) Charnockites and charnockites. Geoscience Frontiers, 3, 1151
737-744. 1152
Rolland, Y., Cox, S., Boullier, A-. M., Pennacchioni, G., and Mancktelow, N. (2003) Rare earth 1153
and trace element mobility in mid-crustal shear zones: insights from the Mont Blanc 1154
Massif (Western Alps). Earth and Planetary Science Letters, 214, 203-219. 1155
Rollinson, H.R. and Windley, B.F. (1980) Selective elemental depletion during metamorphism 1156
of Archaean granulites, Scourie, NW Scotland. Contributions to Mineralogy and 1157
Petrology, 72, 257. 1158
Rudnick, R.L., Barth, M., Horn, I., and McDonough, W.F. (2000) Rutile-bearing refractory 1159
eclogites; missing link between continents and depleted mantle. Science 287, 278–281. 1160
Scambelluri, M., Gray E. Bebout, Belmonte, D., Gilio, M., Campomenosi, N., Collins, N., and 1161
Crispini, L. (2016) Carbonation of subduction-zone serpentinite (high-pressure 1162
ophicarbonate; Ligurian Western Alps) and implications for the deep carbon cycling. 1163
Earth and Planetary Science Letters, 441, 155-166. 1164
Schmidt, M.W. (1996) Experimental constraints on recycling of potassium from subducted 1165
oceanic crust. Science, 272, 1927-1930. 1166
Shaw, D.M. (1956) Geochemistry of pelitic rocks. Part III: Major elements and general 1167
geochemistry. Geological Society of America Bulletin, 67, 919-934. 1168
Skelton A.D.L., Graham, C.M., and Bickle, M.J. (1995) Lithological and structural controls of 1169
regional 3-D fluid flow patterns during greenschist facies metamorphism of the Dalradian 1170
of the SW Scottish Highlands. Journal of Petrology, 36, 563-586. 1171
54
Sorensen, S.S. and Grossman, J.N. (1989) Enrichment of trace elements in garnet amphibolites 1172
from a paleo-subduction zone: Catalina Schist, southern California. Geochmica et 1173
Cosmochimica Acta, 53, 3155-3177. 1174
Spandler, C., Hermann, J., Arculus, R., Mavrogenes, J. (2003) Redistribution of trace elements 1175
during prograde metamorphism from lawsonite blueschist to eclogite facies; implications 1176
for deep subduction-zone processes. Contributions to Mineralogy and Petrology, 146, 1177
205-222. 1178
Spandler, C., Hermann, J., Arculus, R., and Mavrogenes, J. (2004) Geochemical heterogeneity 1179
and element mobility in deeply subducted oceanic crust; insights from high-pressure 1180
mafic rocks from New Caledonia. Chemical Geology, 206, 21-42. 1181
Spandler, C., Pettke, T., and Rubatto, D. (2011) Internal and external fluid sources for eclogite-1182
facies veins in the Monviso meta-ophiolite, Western Alps: Implications for fluid flow in 1183
subduction zones. Journal of Petrology, 52, 1207–1236. 1184
Stolper, E. and Newman, S. (1994) The role of water in the petrogenesis of Mariana trough 1185
magmas. Earth and Planetary Science Letters, 121, 293–325. 1186
Stähle, H.J., Raith, M., Hoernes, S., and Delfs, A. (1987) Element mobility during incipient 1187
granulite formation at Kabbaldurga, southern India. Journal of Petrology, 28, 803-834. 1188
Tanis, E.A., Simon, A., Tschauner, O., Chow, P., Xiao, Y., Burnley, P., Cline, C.J., II, Hanchar, 1189
J.M., Pettke, T., Shen, G., and Zhao, Y. (2015) The mobility of Nb in rutile-saturated 1190
NaCl- and NaF-bearing aqueous fluids from 1–6.5 GPa and 300–800 °C. American 1191
Mineralogist, 100, 1600-1609. 1192
55
Taylor, S.R. and McLennan, S.M. (1985) The Continental Crust: its Composition and Evolution: 1193
an Examination of the Geochemical Record Preserved in Sedimentary Rocks. Blackwell, 1194
Oxford. 1195
Thompson, J.B. (1957) The graphical analysis of mineral assemblages in pelitic 1196
schists. American Mineralogist, 42, 842-858. 1197
Tomkins, H.S., Powell, R., and Ellis, D.J. (2007) The pressure dependence of the zirconium-in-1198
rutile thermometer. Journal of Metamorphic Geology, 25, 703–713. 1199
Taetz, S., John, Timm, Bröcker, M., and Spandler, C., 2016, Fluid–rock interaction and 1200
evolution of a high-pressure/low-temperature vein system in eclogite from New 1201
Caledonia: insights into intraslab fluid flow processes. Contributions to Mineralogy and 1202
Petrology, 171:90, DOI 10.1007/s00410-016-1295-z. 1203
Trail, D., Watson, E.B., and Tailby, N.D. (2012) Ce and Eu anomalies in zircon as proxies for 1204
the oxidation state of magmas. Geochimica et Cosmochimica Acta, 97, 70-87. 1205
Tribuzio, R., Messiga, B., Vannucci, R., and Bottazzi, P. (1996) Rare earth element 1206
redistribution during high-pressure–low-temperature metamorphism in ophiolitic Fe-1207
gabbros (Liguria, northwestern Italy): Implications for light REE mobility in subduction 1208
zones. Geology, 24, 711-714. 1209
Tsay, A., Zajacz, Z., and Sanchez-Valle, C. (2014) Efficient mobilization and fractionation of 1210
rare-earth elements by aqueous fluids upon slab dehydration. Earth and Planetary Science 1211
Letters, 398, 101-112. 1212
Tsay, A., Zajacz, Z., Ulmer, P., and Sanchez-Valle, C. (2016) Mobility of major and trace 1213
elements in the eclogite-fluid system and element fluxes upon slab dehydration. 1214
Geochimica et Cosmochimica Acta, in press. 1215
56
Turner, S., Evans, P., and Hawkesworth, C. (2001) Ultrafast source-to-surface movement of melt 1216
at island arcs from 226Ra-230Th systematics. Science, 292, 1363–1366. 1217
Valley J. W., Bohlen S. W., Essene E. J., and Lamb W. (1990) Metamorphism in the 1218
Adirondacks: II. The role of fluids. Journal of Petrology, 31, 555-596. 1219
van der Straaten, F., Schenk, V., John, T., and Gao, J. (2008) Blueschist-facies rehydration of 1220
eclogites (Tian Shan, NW-China): Implications for fluid–rock interaction in the 1221
subduction channel. Chemical Geology, 255, 195-219. 1222
Van Haren, J.L., Ague, J.J., and Rye, D.M. (1996) Oxygen isotope record of fluid infiltration and 1223
mass transfer during regional metamorphism of pelitic schist, Connecticut, USA. 1224
Geochimica et Cosmochimica Acta, 60, 3487-3504. 1225
Vitale Brovarone, A., Allard, O., Beyssac, O., Martin, L., and Picatto, M. (2014) Lawsonite 1226
metasomatism and trace element recycling in subduction zones. Journal of Metamorphic 1227
Geology, 32, 489-514. 1228
Wagner, T., Boyce, A.J., and Erzinger, J. (2010) Fluid-rock interaction during formation of 1229
metamorphic quartz veins: A REE and stable isotope study from the Rhenish Massif, 1230
Germany. American Journal of Science, 310, 645-682. 1231
Watson, E.B., Wark, D.A., and Thomas, J.B. (2006) Crystallization thermometers for zircon and 1232
rutile. Contributions to Mineralogy and Petrology, 151, 413–433. 1233
Watson, E.B. and Baxter, E.F. (2007) Diffusion in solid-Earth systems. Earth and Planetary 1234
Science Letters, 253, 307–327. 1235
Weaver, B.L. and Tarney, J. (1981) Chemical changes during dyke metamorphism in high-grade 1236
basement terrains. Nature, 289, 47-49. 1237
57
Wickham, S.M. and Taylor, H.P. (1985) Stable isotope evidence for large-scale seawater 1238
infiltration in a regional metamorphic terrane; the Trois Seigneurs massif, Pyrenees, 1239
France. Contributions to Mineralogy and Petrology, 91, 122-137. 1240
Wilson, C.R., Spiegelman, M., van Keken, P.E., and Hacker, B.R. (2014) Fluid flow in 1241
subduction zones: The role of solid rheology and compaction pressure. Earth and 1242
Planetary Science Letters, 401, 261-274. 1243
Windrim, D.P., McColluch, M.T., Chappel, B.W., and Cameron, W.E. (1984) Nd isotopic 1244
systematics and chemistry of Central Australian sapphirine granulites: an example of rare 1245
earth element mobility. Earth and Planetary Science Letters, 70, 27-39. 1246
Woronow, A., and Love, K. M. (1990) Quantifying and testing differences among means of 1247
compositional data suites. Mathematical Geology, 22, 837-852. 1248
Yardley, B.W.D. (1986) Fluid migration and veining in the Connemara schists, Ireland, in 1249
Walther,]. V., and Wood, B. J., editors, Fluid-rock interactions during metamorphism: 1250
New York, Springer-Ver1ag, p. 109-131. 1251
Zack, T. and John, T. (2007) An evaluation of reactive fluid flow and trace element mobility in 1252
subducting slabs. Chemical Geology, 239, 199-216. 1253
Zack, T., Moraes, R., and Kronz, A. (2004) Temperature dependence of Zr in rutile: empirical 1254
calibration of a rutile thermometer. Contributions to Mineralogy and Petrology, 148, 471-1255
488. 1256
Zhao, Z.-F., Zheng, Y.-F., Chen, R.-X., Xia, Q.-X., and Wu, Y.-B. (2007) Element mobility in 1257
mafic and felsic ultrahigh-pressure metamorphic rocks during continental collision. 1258
Geochimica et Cosmochimica Acta, 71, 5244-5266. 1259
1260
58
Figure Captions 1261
Figure 1. Fluid fluxes calculated from numerical model of flow region cut by two high 1262
permeability conduits. Flow is upward, and conduits are 100 times more permeable than matrix. 1263
Note that focusing of flow into the conduits drastically reduces fluxes in adjacent areas, such that 1264
high and low flux zones are closely associated spatially. Modified from Breeding et al. (2003; 1265
see this paper for calculation details). 1266
Figure 2. REE concentration increase in a vein selvage system in which REE were immobile. 1267
Loss of silica from the selvage to an adjacent quartz vein caused residual enrichment of REE 1268
with no REE mass transfer into or out of the system. Data from Penniston-Dorland and Ferry 1269
(2008), site S35-1G (LM4 in Table 1). 1270
Figure 3. Geochemical profiles illustrating changes in REE ratios due to REE mobility. (a) 1271
Increase in La/Lu in selvage adjacent to a quartz-rich vein cutting metapelitic rock. Increase 1272
reflects strong La gains (site 181 data from Bucholz and Ague, 2010; LREE3 in Table 1). Plus 1273
signs and circles denote least altered and more altered metacarbonate rocks, respectively. (b) 1274
Decrease in Eu/Sm ratio in metacarbonate rock toward veined lithologic contact. Both Eu and 1275
Sm were gained, but Sm was gained to a greater extent approaching the veined contact (site 187 1276
data from Ague, 2003; Eu3 in Table 1). Plus signs: least altered metacarbonate rock; light green 1277
circles: diopside-zoisite metacarbonate; dark green circles: hornblende-zoisite metacarbonate; 1278
black square: vein contact zone. 1279
Figure 4. Percentage mass change diagrams for examples that underwent little or no REE mass 1280
transfer. Note that these are not chondrite-normalized plots, but instead depict elemental 1281
percentage mass changes for altered rocks relative to their precursors (mass gains are positive, 1282
losses negative). See Table 1 for rock type descriptions. 1283
59
Figure 5. Bar code diagrams illustrating mass changes for examples that underwent little or no 1284
REE metasomatism. See Table 1 for rock type descriptions. 1285
Figure 6. Percentage mass change diagrams for examples that underwent LREE mass transfer. 1286
Dominant phases controlling REE mass changes are labeled (if known). LREE1 shows mass 1287
transfer for two silicified metapelite wallrock inclusions in vein. LREE3 samples 181Aii and 1288
181Aiii are 1.25 cm and 3.75 cm from vein contact, respectively. See Table 1 for rock type 1289
descriptions. 1290
Figure 7. Bar code diagrams illustrating mass changes for examples that underwent LREE 1291
metasomatism. See Table 1 for rock type descriptions. 1292
Figure 8. Percentage mass change diagrams for examples that underwent HREE mass transfer. 1293
Dominant phases controlling REE mass changes are labeled (if known). HREE3 samples 197Ai, 1294
197AS, and 197Aii are 0 cm, 1 cm, and 3 cm from vein contact, respectively. See Table 1 for 1295
rock type descriptions. 1296
Figure 9. Bar code diagrams illustrating mass changes for examples that underwent HREE 1297
metasomatism. See Table 1 for rock type descriptions. 1298
Figure 10. Percentage mass change diagrams for examples that underwent overall REE loss. 1299
Dominant phases controlling REE mass changes are labeled (if known). See Table 1 for rock 1300
type descriptions. 1301
Figure 11. Bar code diagrams illustrating mass changes for examples that underwent overall 1302
REE loss. See Table 1 for rock type descriptions. 1303
Figure 12. Percentage mass change diagrams for examples that underwent Eu mass transfer. 1304
Dominant phases controlling REE mass changes are labeled (if known). Eu3 samples 187Bii, 1305
60
187Biii, and 187Mi are 2 cm, 5 cm, and 10 cm from vein contact, respectively. See Table 1 for 1306
rock type descriptions. 1307
Figure 13. Bar code diagrams illustrating mass changes for examples that underwent Eu 1308
metasomatism. See Table 1 for rock type descriptions. 1309
Figure 14. Percentage mass change diagrams for examples characterized by local REE 1310
redistribution. Dominant phases controlling REE mass changes are labeled (if known). Samples 1311
JTS-C (R1) and JTS-E (R2) are from blueschist-eclogite transition zone approximately 85 cm 1312
and 40 cm from vein contact, respectively (see Fig. 2 in Beinlich et al. 2010). For the shear zones 1313
cutting granitic rocks, MB69 (R3) is in the site of LREE deposition in the shear zone core, and 1314
MB71 (R4) is in the area of LREE leaching several meters away (see Fig. 6 in Rolland et al. 1315
2003). R3 and R4 not shown on subsequent diagrams due to lack of full major element data in 1316
original paper. See Table 1 for rock type descriptions and references. 1317
Figure 15. Mass changes for neighboring REE. Note that on this and most subsequent x-y plots, 1318
the scaling for negative mass changes (mass losses) has been expanded to make visualization 1319
easier. This is useful because mass losses are bounded at -100%, whereas mass gains have no set 1320
upper bound. (a) Ce-La. (b) Sm-Nd. (c) Eu-Sm. Examples that plot off the 1:1 trend have Eu 1321
“anomalies” relative to neighboring REE. (d) Lu-Yb. 1322
Figure 16. Mass changes involving P and Y. (a) La-P. (b) REEmax-P. REEMax denotes the 1323
maximum mass change for any REE in the rock. (c) Lu-P. (d) P-Y. (e) Lu-Y. (f) REEmax-Y. 1324
Figure 17. Mass changes involving Th and U. (a) Th-U. (b) Th- REEmax. (c) U- REEmax. (d) U-1325
Nb. 1326
Figure 18. Mass changes involving alkalis and alkaline earths. (a) Na-K. Note absence of 1327
examples that gained both Na and K. (b) Ca-K. Note absence of examples that gained both Ca 1328
61
and K. (c) Na-Ca relations for non-subduction zone rocks. (d) Na-Ca relations for subduction 1329
zone rocks. (e) Ca-Sr. (f) Sr-Rb. Note rarity of coupled Sr and Rb gain, and similarity to parts (a) 1330
and (b). 1331
Figure 19. (a) Mass changes for Rb and K. (b) Mass changes for Sr and Pb. 1332
Figure 20. Mass changes in involving volatiles, using LOI as a proxy for volatile content. (a) 1333
REEmax-volatiles. (b) Na versus volatile mass changes, contoured for K mass changes. Note: (1) 1334
examples that gained K are concentrated in the field that lost Na and gained volatiles and (2) the 1335
general loss of K from all other examples. 1336
Figure 21. Comparison of percentage mass changes for HFSE. 1337
Figure 22. Examples of how HFSE mass changes could impact plotting on petrotectonic 1338
discrimination diagrams. Concentrations of Nb and Y varied to be compatible with Fig. 21. The 1339
orange ellipses illustrate mass changes of: Y±50% and Nb±25%. The green ellipses illustrate 1340
somewhat larger mass changes of: Y±75% and Nb ±50%. (a) Nb-Zr-Y diagram for mafic rocks 1341
(Meschede, 1986). (b) Nb-Y diagram for granitic rocks (Pearce et al. 1984). 1342
Figure 23. Mass changes for Barrovian metapelites and metacarbonate rocks from a range of 1343
settings. (a) Si-volatile mass changes for metapelites. Note coupled loss of silica and volatiles, 1344
illustrating dependence of silica loss on extent of devolatilization. Example that gained silica and 1345
volatiles is a silicified wallrock inclusion in a quartz vein (LREE1). (b) K-Rb mass changes for 1346
metapelites. Note preponderance of samples characterized by K-Rb loss. (c) Na-Ca mass changes 1347
for metapelites. General positive correlation due to controls on mass transfer by plagioclase 1348
feldspar. (d) Ca-volatile mass changes for all the metacarbonate rocks of the data set. Examples 1349
that plot close to the 1:1 line characterized by near stoichiometric dissolution or precipitation of 1350
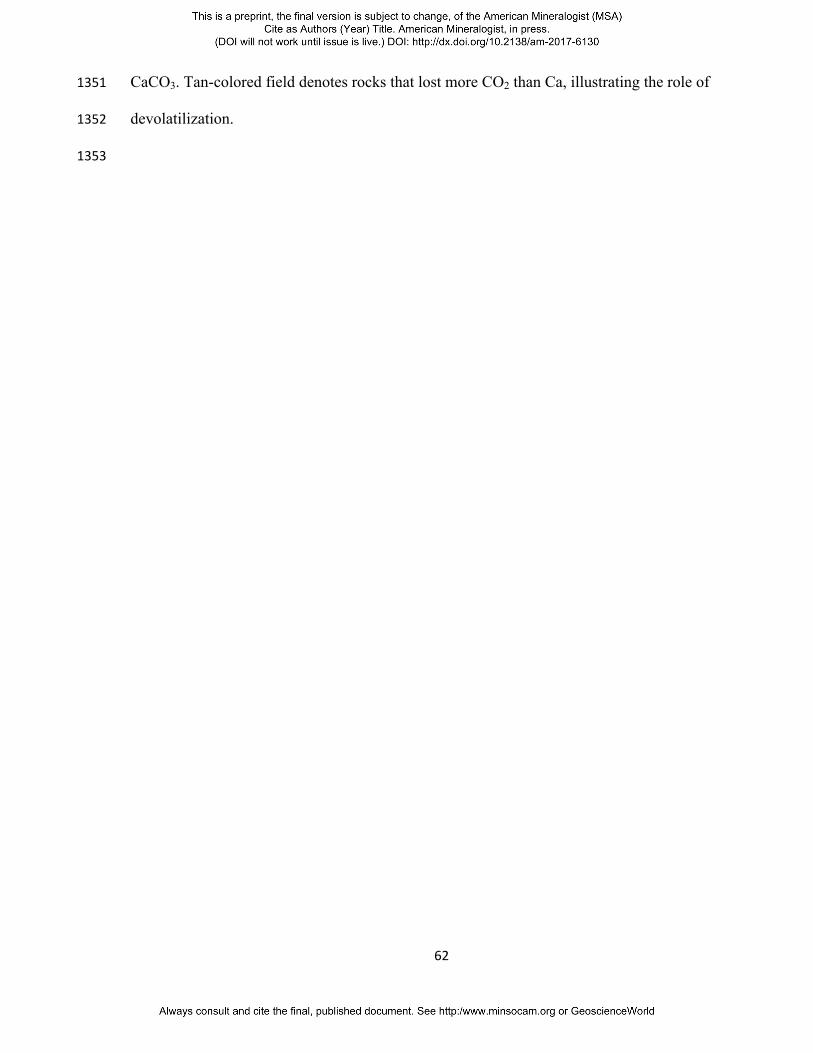
62
CaCO3. Tan-colored field denotes rocks that lost more CO2 than Ca, illustrating the role of 1351
devolatilization. 1352
1353
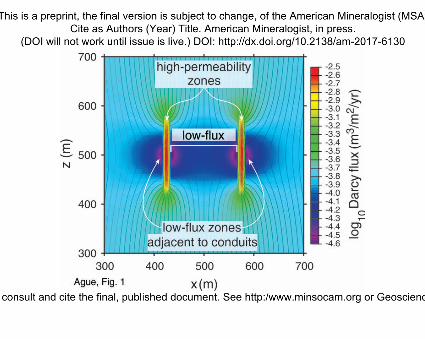
2
2
4
6
8
2
La Ce Pr Nd Sm Eu Tb Dy Ho Er Tm Yb Lu
Log
(Sam
ple/
Cho
ndrit
e)
Wallrock
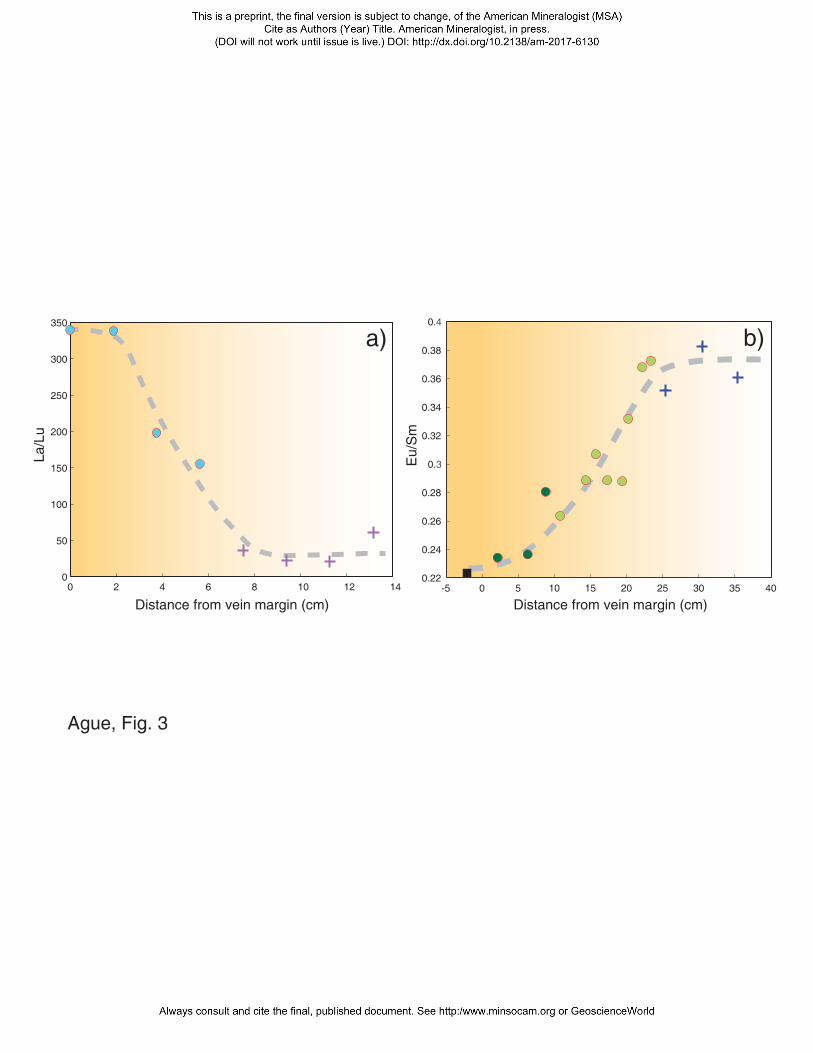
0 2 4 6 8 10 12 140
50
100
150
200
250
300
350
Distance from vein margin (cm)
La/L
u
-5 0 5 10 15 20 25 30 35 40
Distance from vein margin (cm)
0.22
0.24
0.26
0.28
0.3
0.32
0.34
0.36
0.38
0.4
Eu/
Sm
a) b)
Ague, Fig. 3
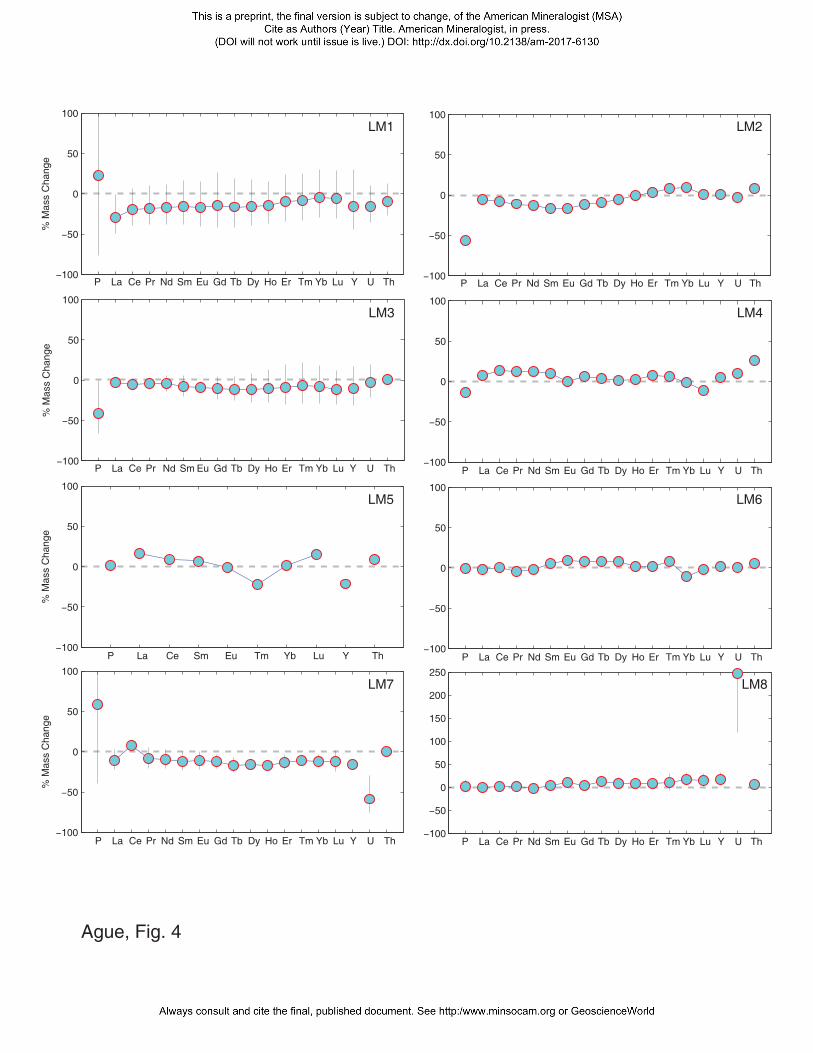
P La Ce Pr Nd Sm Eu Gd Tb Dy Ho Er Tm Yb Lu Y U Th
% M
ass
Cha
nge
P La Ce Pr Nd Sm Eu Gd Tb Dy Ho Er Tm Yb Lu Y U Th
% M
ass
Cha
nge
P La Ce Pr Nd Sm Eu Gd Tb Dy Ho Er Tm Yb Lu Y U Th P La Ce Pr Nd Sm Eu Gd Tb Dy Ho Er Tm Yb Lu Y U Th
% M
ass
Cha
nge
P La Ce Sm Eu Tm Yb Lu Y Th P La Ce Pr Nd Sm Eu Gd Tb Dy Ho Er Tm Yb Lu Y U Th
% M
ass
Cha
nge
P La Ce Pr Nd Sm Eu Gd Tb Dy Ho Er Tm Yb Lu Y U Th P La Ce Pr Nd Sm Eu Gd Tb Dy Ho Er Tm Yb Lu Y U Th
LM2
LM3 LM4
LM6
LM7 LM8
Ague, Fig. 4
% M
ass
Cha
nge
P La Ce Pr Nd Sm Eu Gd Tb Dy Ho Er Tm Yb Lu Y U Th
% M
ass
Cha
nge
P La Ce Pr Nd Sm Eu Gd Tb Dy Ho Er Tm Yb Lu Y U Th P La Ce Pr Nd Sm Eu Gd Tb Dy Ho Er Tm Yb Lu Y U Th
P La Ce Pr Nd Sm Eu Gd Tb Dy Ho Er Tm Yb Lu Y U Th
% M
ass
Cha
nge
P La Ce Pr Nd Sm Eu Gd Tb Dy Ho Er Yb Lu Y U Th
LM9
Ague, Fig. 4, continued
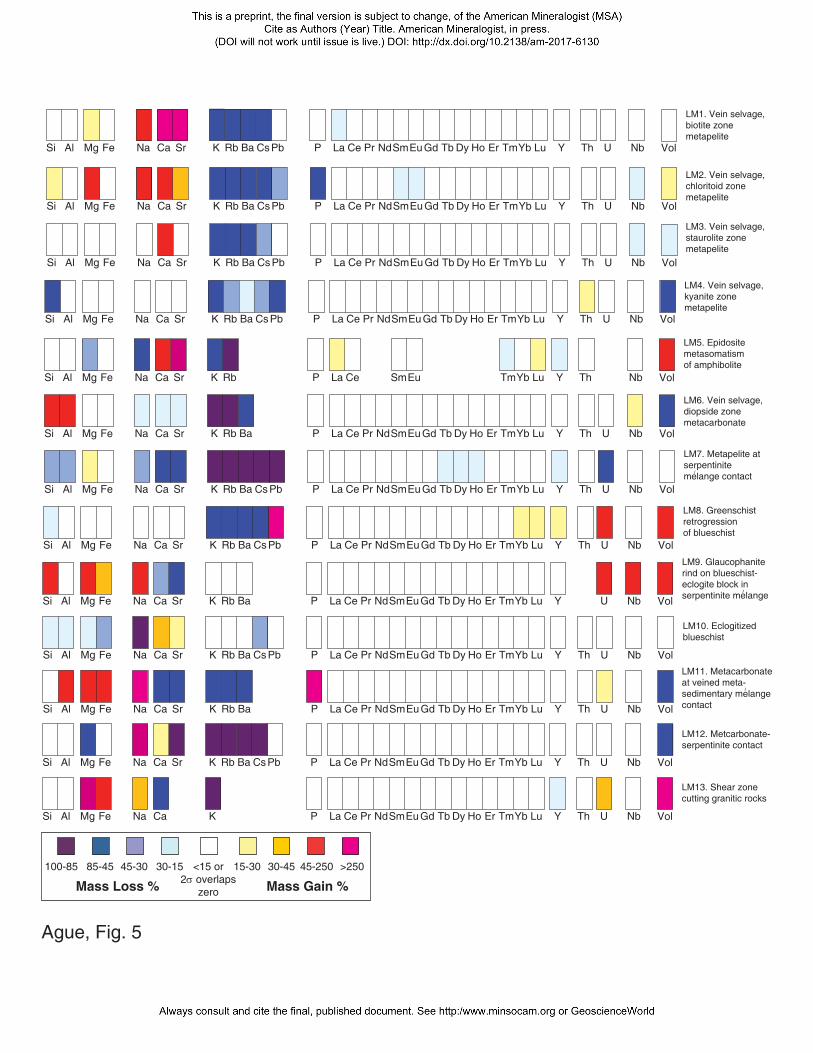
Ca SrNa K Rb Ba Pb P La Ce Pr NdSmEu Gd Tb Dy Ho Er TmYb Lu Y Th U NbCsMg FeSi Al
LM2. Vein selvage, chloritoid zone metapelite
Ca SrNa K Rb Ba Pb P La Ce Pr NdSmEu Gd Tb Dy Ho Er TmYb Lu Y Th U NbCsMg FeSi Al
LM1. Vein selvage, biotite zone metapelite
Ca SrNa K Rb Ba Pb P La Ce Pr NdSmEu Gd Tb Dy Ho Er TmYb Lu Y Th U NbCsMg FeSi Al
Ca SrNa K Rb Ba Pb P La Ce Pr NdSmEu Gd Tb Dy Ho Er TmYb Lu Y Th U NbCsMg FeSi Al
LM3. Vein selvage, staurolite zone metapelite
Ca SrNa K Rb Ba P La Ce Pr NdSmEu Gd Tb Dy Ho Er TmYb Lu Y Th U NbMg FeSi Al
LM10. Eclogitized blueschist
Ca SrNa K Rb Ba Pb P La Ce Pr NdSmEu Gd Tb Dy Ho Er TmYb Lu Y Th U NbCsMg FeSi Al
Ca SrNa K Rb Ba Pb P La Ce Pr NdSmEu Gd Tb Dy Ho Er TmYb Lu Y Th U NbCsMg FeSi Al
LM8. Greenschist retrogression of blueschist
Ca SrNa K Rb P La Ce SmEu TmYb Lu Y Th NbMg FeSi Al
LM5. Epidosite metasomatism of amphibolite
Ca SrNa K Rb Ba P La Ce Pr NdSmEu Gd Tb Dy Ho Er TmYb Lu Y Th U NbMg FeSi Al
LM6. Vein selvage, diopside zone metacarbonate
Ca SrNa K Rb Ba Pb P La Ce Pr NdSmEu Gd Tb Dy Ho Er TmYb Lu Y Th U NbCsMg FeSi Al
LM4. Vein selvage, kyanite zone metapelite
Ca SrNa K Rb Ba P La Ce Pr NdSmEu Gd Tb Dy Ho Er TmYb Lu Y U NbMg FeSi Al
Vol
Vol
Vol
Vol
Vol
Vol
Vol
Vol
Vol
Vol
Vol
>25045-25030-4515-3030-1545-3085-45100-85 <15 or2 overlaps
zeroMass Loss % Mass Gain %
CaNa K P La Ce Pr NdSmEu Gd Tb Dy Ho Er TmYb Lu Y Th U NbMg FeSi Al Vol
LM13. Shear zonecutting granitic rocks
Ca SrNa K Rb Ba Pb P La Ce Pr NdSmEu Gd Tb Dy Ho Er TmYb Lu Y Th U NbCsMg FeSi Al
LM12. Metcarbonate-serpentinite contact
Vol
LM9. Glaucophanite rind on blueschist-eclogite block in serpentinite melange
/
LM7. Metapelite at serpentinite melange contact
/
LM11. Metacarbonate at veined meta-sedimentary melange contact
/
Ague, Fig. 5
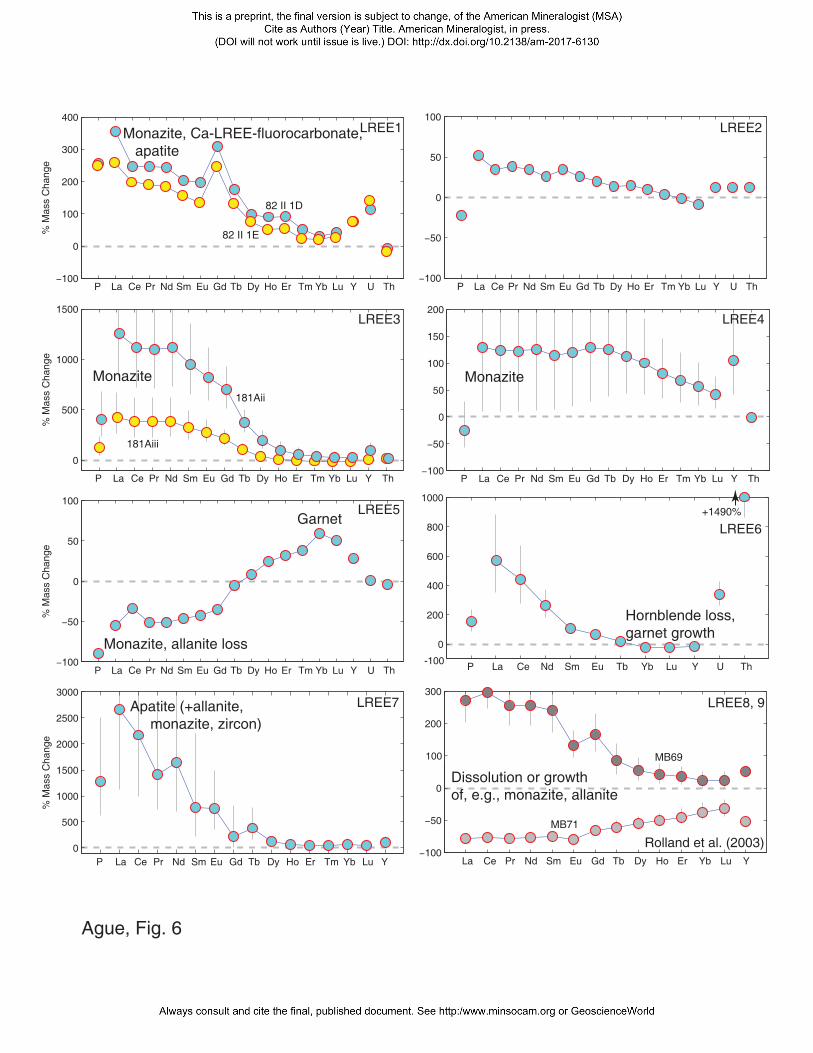
% M
ass
Cha
nge
P La Ce Pr Nd Sm Eu Gd Tb Dy Ho Er Tm Yb Lu Y U Th P La Ce Pr Nd Sm Eu Gd Tb Dy Ho Er Tm Yb Lu Y U Th
% M
ass
Cha
nge
P La Ce Pr Nd Sm Eu Gd Tb Dy Ho Er Tm Yb Lu Y Th P La Ce Pr Nd Sm Eu Gd Tb Dy Ho Er Tm Yb Lu Y Th
% M
ass
Cha
nge
P La Ce Pr Nd Sm Eu Gd Tb Dy Ho Er Tm Yb Lu Y U Th P La Ce Nd Sm Eu Tb Yb Lu Y U Th
% M
ass
Cha
nge
P La Ce Pr Nd Sm Eu Gd Tb Dy Ho Er Tm Yb Lu Y
Monazite, Ca-LREE-fluorocarbonate, apatite
Monazite Monazite
Garnet
Monazite, allanite loss
Apatite (+allanite, monazite, zircon)
Hornblende loss,garnet growth
LREE2
LREE3 LREE4
LREE6
LREE7
La Ce Pr Nd Sm Eu Gd Tb Dy Ho Er Yb Lu Y
Dissolution or growth of, e.g., monazite, allanite
Ague, Fig. 6
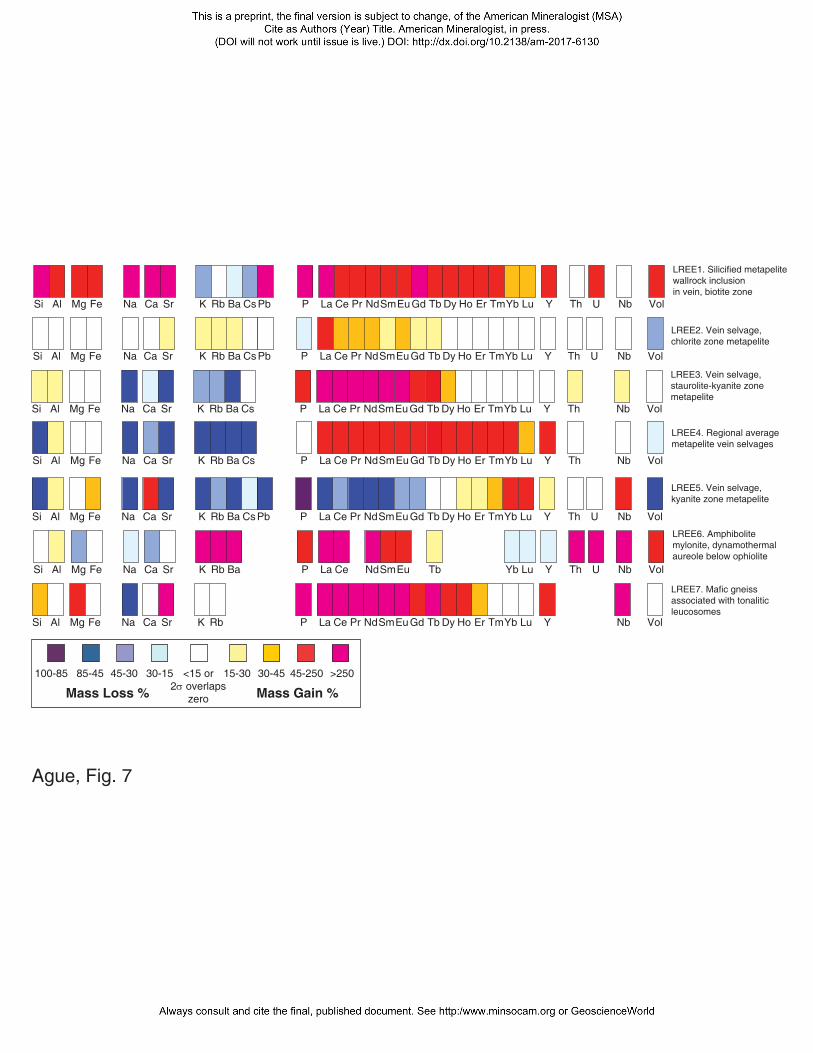
Ca SrNa K Rb Ba VolP La Ce NdSmEu Tb Yb Lu Y Th U NbMg FeSi Al
Ca SrNa K Rb VolP La Ce Pr NdSmEu Gd Tb Dy Ho Er TmYb Lu Y NbMg FeSi Al
Ca SrNa K Rb Ba Pb VolP La Ce Pr NdSmEu Gd Tb Dy Ho Er TmYb Lu Y Th U NbCsMg FeSi Al
Ca SrNa K Rb Ba VolP La Ce Pr NdSmEu Gd Tb Dy Ho Er TmYb Lu Y Th NbCsMg FeSi Al
LREE6. Amphibolite mylonite, dynamothermalaureole below ophiolite
LREE7. Mafic gneiss associated with tonaliticleucosomes
LREE1. Silicified metapelitewallrock inclusion in vein, biotite zone
LREE3. Vein selvage, staurolite-kyanite zonemetapelite
Ca SrNa K Rb Ba VolP La Ce Pr NdSmEu Gd Tb Dy Ho Er TmYb Lu Y Th NbCsMg FeSi Al
LREE4. Regional averagemetapelite vein selvages
>25045-25030-4515-3030-1545-3085-45100-85 <15 or2 overlaps
zeroMass Loss % Mass Gain %
Ca SrNa K Rb Ba Pb P La Ce Pr NdSmEu Gd Tb Dy Ho Er TmYb Lu Y Th U NbCsMg FeSi Al Vol
LREE2. Vein selvage, chlorite zone metapelite
LREE5. Vein selvage, kyanite zone metapelite
Ca SrNa K Rb Ba Pb P La Ce Pr NdSmEu Gd Tb Dy Ho Er TmYb Lu Y Th U NbCsMg FeSi Al Vol
Ague, Fig. 7
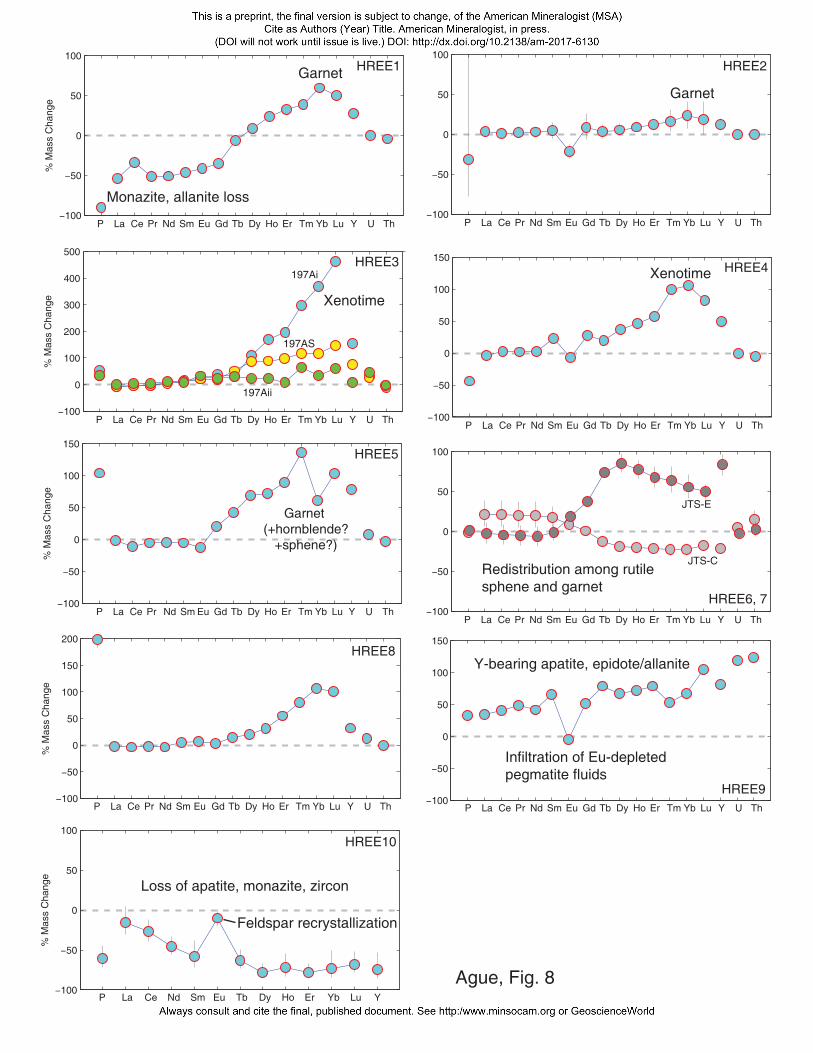
% M
ass
Cha
nge
P La Ce Pr Nd Sm Eu Gd Tb Dy Ho Er Tm Yb Lu Y U Th P La Ce Pr Nd Sm Eu Gd Tb Dy Ho Er Tm Yb Lu Y U Th
% M
ass
Cha
nge
P La Ce Pr Nd Sm Eu Gd Tb Dy Ho Er Tm Yb Lu Y U Th P La Ce Pr Nd Sm Eu Gd Tb Dy Ho Er Tm Yb Lu Y U Th
% M
ass
Cha
nge
P La Ce Pr Nd Sm Eu Gd Tb Dy Ho Er Tm Yb Lu Y U ThP La Ce Pr Nd Sm Eu Gd Tb Dy Ho Er Tm Yb Lu Y U Th
% M
ass
Cha
nge
P La Ce Pr Nd Sm Eu Gd Tb Dy Ho Er Tm Yb Lu Y U Th P La Ce Pr Nd Sm Eu Gd Tb Dy Ho Er Tm Yb Lu Y U Th
% M
ass
Cha
nge
P La Ce Nd Sm Eu Tb Dy Ho Er Yb Lu Y
Garnet
Monazite, allanite loss
Garnet
Xenotime
Garnet (+hornblende?
+sphene?)
Redistribution among rutilesphene and garnet
Loss of apatite, monazite, zircon
Feldspar recrystallization
Infiltration of Eu-depleted pegmatite fluids
HREE2
HREE3 HREE4
HREE6, 7
HREE8
HREE9
Y-bearing apatite, epidote/allanite
Xenotime
JTS-C
JTS-E
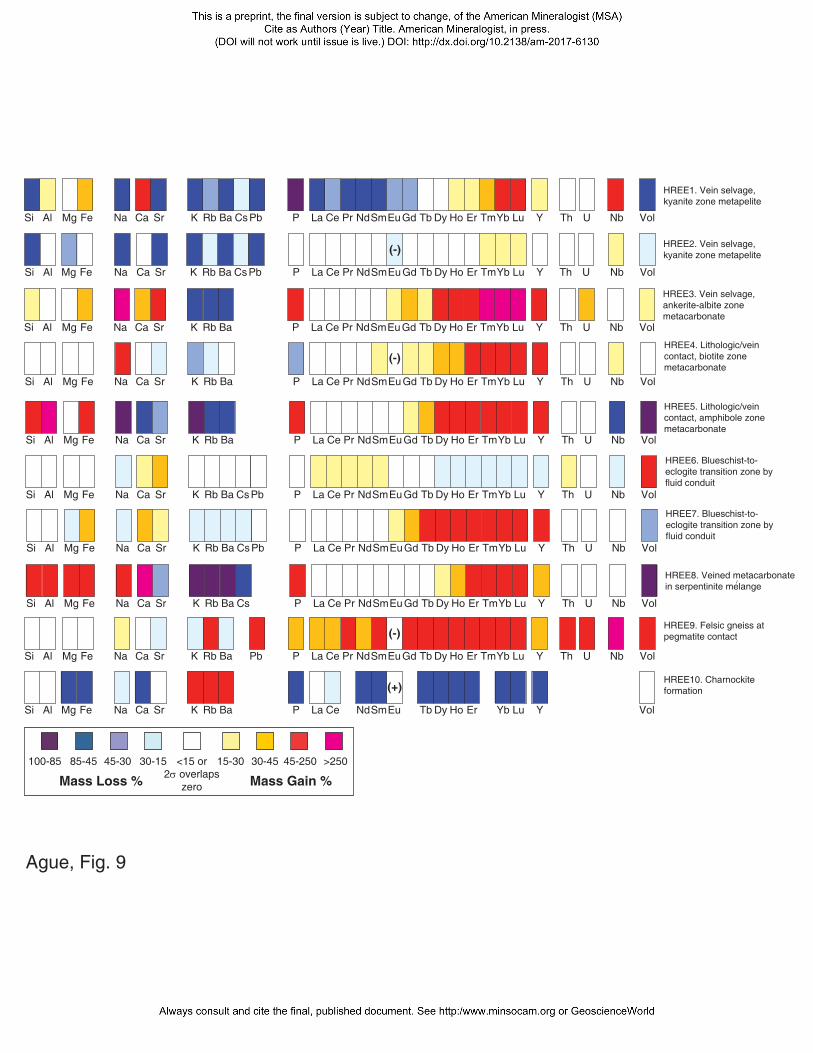
HREE4. Lithologic/vein contact, biotite zone metacarbonate
Ca SrNa K Rb Ba P La Ce Pr NdSmEu Gd Tb Dy Ho Er TmYb Lu Y Th U NbMg FeSi Al
HREE5. Lithologic/vein contact, amphibole zone metacarbonate
Ca SrNa K Rb Ba P La Ce Pr NdSmEu Gd Tb Dy Ho Er TmYb Lu Y Th U NbMg FeSi Al
HREE3. Vein selvage, ankerite-albite zone metacarbonate
Ca SrNa K Rb Ba P La Ce Pr NdSmEu Gd Tb Dy Ho Er TmYb Lu Y Th U NbMg FeSi Al
Ca SrNa K Rb Ba P La Ce Pr NdSmEu Gd Tb Dy Ho Er TmYb Lu Y Th U NbCsMg FeSi Al
HREE9. Felsic gneiss at pegmatite contact
Ca SrNa K Rb Ba Pb P La Ce Pr NdSmEu Gd Tb Dy Ho Er TmYb Lu Y Th U NbMg FeSi Al
Vol
Vol
Vol
Vol
Vol
HREE7. Blueschist-to-eclogite transition zone byfluid conduit
Ca SrNa K Rb Ba Pb P La Ce Pr NdSmEu Gd Tb Dy Ho Er TmYb Lu Y Th U NbCsMg FeSi Al Vol
>25045-25030-4515-3030-1545-3085-45100-85 <15 or2 overlaps
zeroMass Loss % Mass Gain %
(-)
(-)
HREE6. Blueschist-to-eclogite transition zone byfluid conduit
Ca SrNa K Rb Ba Pb P La Ce Pr NdSmEu Gd Tb Dy Ho Er TmYb Lu Y Th U NbCsMg FeSi Al Vol
HREE1. Vein selvage, kyanite zone metapelite
Ca SrNa K Rb Ba Pb P La Ce Pr NdSmEu Gd Tb Dy Ho Er TmYb Lu Y Th U NbCsMg FeSi Al Vol
HREE2. Vein selvage, kyanite zone metapelite
Ca SrNa K Rb Ba Pb P La Ce Pr NdSmEu Gd Tb Dy Ho Er TmYb Lu Y Th U NbCsMg FeSi Al
(-)
Vol
HREE10. Charnockite formation
Ca SrNa K Rb Ba P La Ce NdSmEu Tb Dy Ho Er Yb Lu YMg FeSi Al Vol
(+)
HREE8. Veined metacarbonate in serpentinite melange
/
Ague, Fig. 9
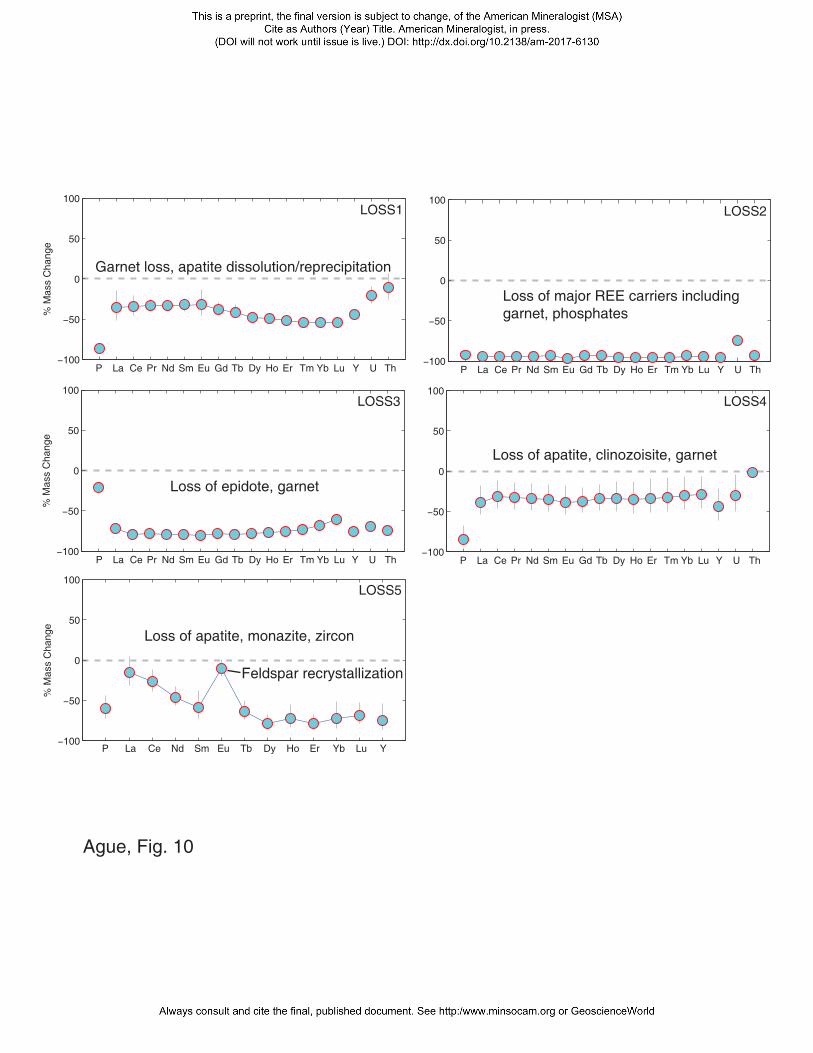
% M
ass
Cha
nge
P La Ce Pr Nd Sm Eu Gd Tb Dy Ho Er Tm Yb Lu Y U Th P La Ce Pr Nd Sm Eu Gd Tb Dy Ho Er Tm Yb Lu Y U Th
% M
ass
Cha
nge
P La Ce Pr Nd Sm Eu Gd Tb Dy Ho Er Tm Yb Lu Y U Th P La Ce Pr Nd Sm Eu Gd Tb Dy Ho Er Tm Yb Lu Y U Th
% M
ass
Cha
nge
P La Ce Nd Sm Eu Tb Dy Ho Er Yb Lu Y
Loss of apatite, monazite, zircon
Feldspar recrystallization
Loss of epidote, garnet
Loss of apatite, clinozoisite, garnet
Garnet loss, apatite dissolution/reprecipitation
Loss of major REE carriers includinggarnet, phosphates
LOSS2
LOSS3 LOSS4
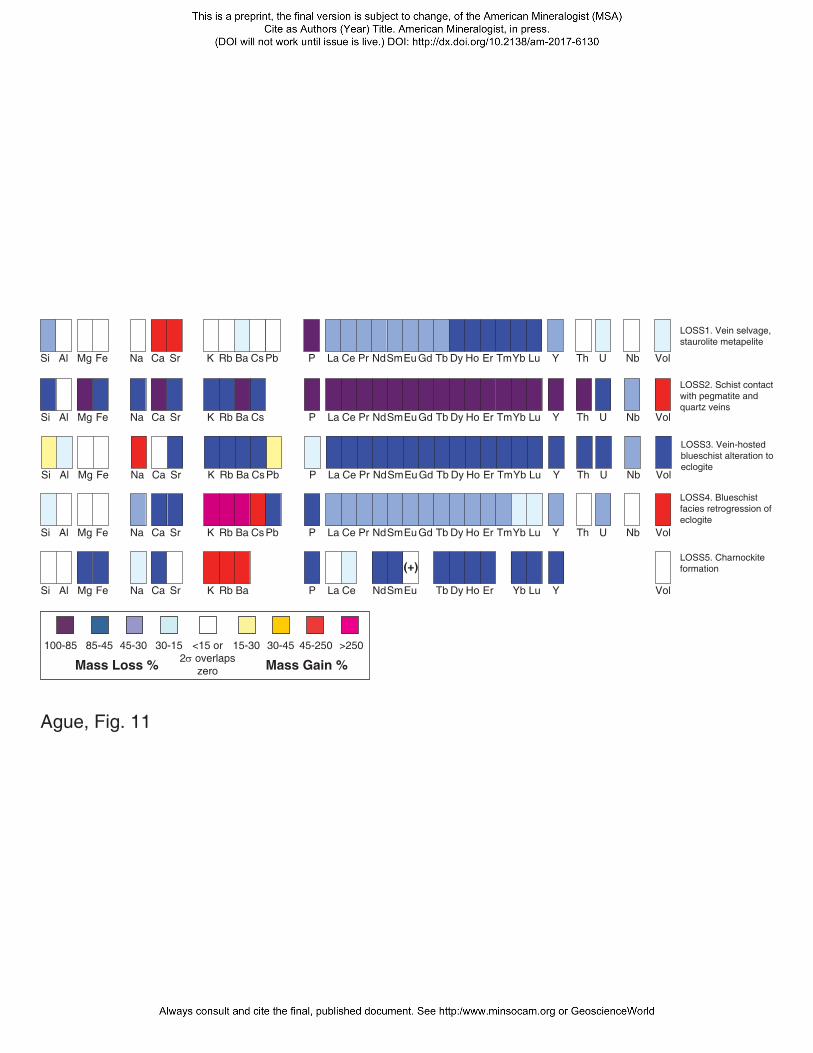
LOSS1. Vein selvage, staurolite metapelite
Ca SrNa K Rb Ba Pb P La Ce Pr NdSmEu Gd Tb Dy Ho Er TmYb Lu Y Th U NbCsMg FeSi Al
LOSS3. Vein-hostedblueschist alteration to eclogite
Ca SrNa K Rb Ba Pb P La Ce Pr NdSmEu Gd Tb Dy Ho Er TmYb Lu Y Th U NbCsMg FeSi Al
LOSS4. Blueschist facies retrogression of eclogite
Ca SrNa K Rb Ba Pb P La Ce Pr NdSmEu Gd Tb Dy Ho Er TmYb Lu Y Th U NbCsMg FeSi Al
LOSS5. Charnockite formation
Ca SrNa K Rb Ba P La Ce NdSmEu Tb Dy Ho Er Yb Lu YMg FeSi Al
LOSS2. Schist contact with pegmatite andquartz veins
Ca SrNa K Rb Ba P La Ce Pr NdSmEu Gd Tb Dy Ho Er TmYb Lu Y Th U NbCsMg FeSi Al
Vol
Vol
Vol
Vol
Vol
>25045-25030-4515-3030-1545-3085-45100-85 <15 or2 overlaps
zeroMass Loss % Mass Gain %
(+)
Ague, Fig. 11
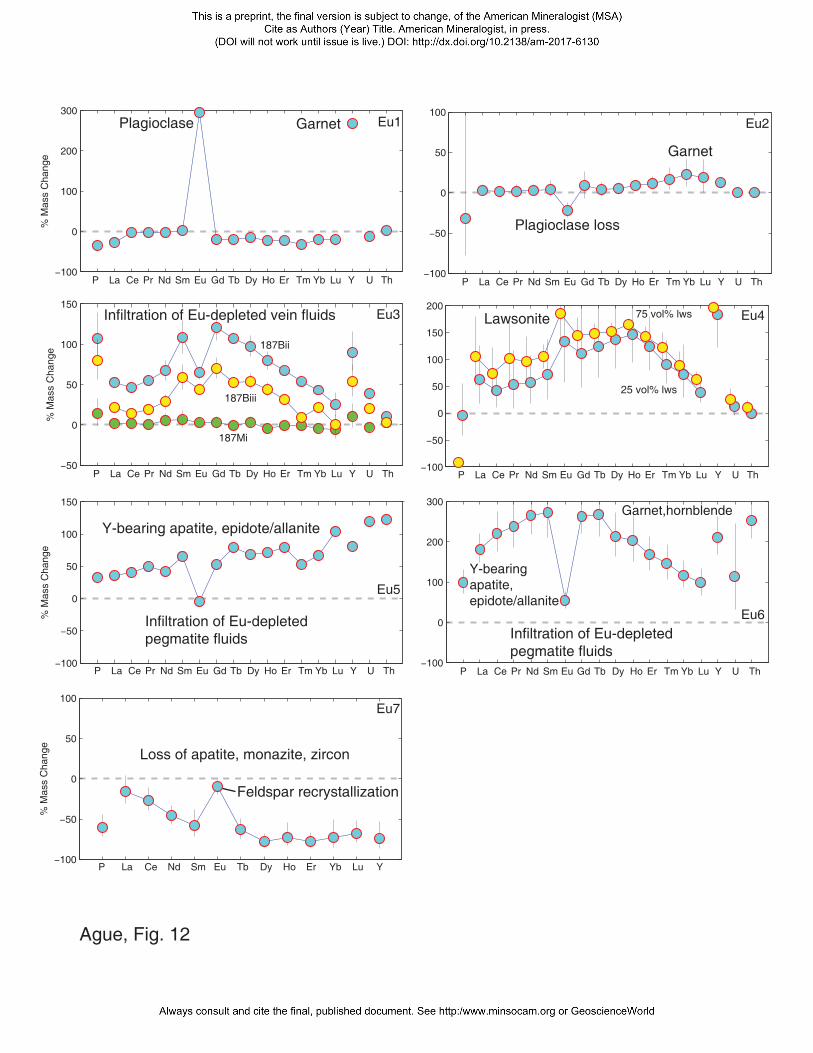
% M
ass
Cha
nge
P La Ce Pr Nd Sm Eu Gd Tb Dy Ho Er Tm Yb Lu Y U Th P La Ce Pr Nd Sm Eu Gd Tb Dy Ho Er Tm Yb Lu Y U Th
% M
ass
Cha
nge
P La Ce Pr Nd Sm Eu Gd Tb Dy Ho Er Tm Yb Lu Y U Th P La Ce Pr Nd Sm Eu Gd Tb Dy Ho Er Tm Yb Lu Y U Th
% M
ass
Cha
nge
P La Ce Pr Nd Sm Eu Gd Tb Dy Ho Er Tm Yb Lu Y U Th P La Ce Pr Nd Sm Eu Gd Tb Dy Ho Er Tm Yb Lu Y U Th
% M
ass
Cha
nge
P La Ce Nd Sm Eu Tb Dy Ho Er Yb Lu Y
Infiltration of Eu-depleted pegmatite fluids Infiltration of Eu-depleted
pegmatite fluids
LawsoniteInfiltration of Eu-depleted vein fluids
Loss of apatite, monazite, zircon
Feldspar recrystallization
Plagioclase Garnet
Plagioclase loss
Eu2
Eu3 Eu4
Eu6
Eu7
Garnet,hornblende
Y-bearing apatite, epidote/allanite
Y-bearing apatite, epidote/allanite
Garnet
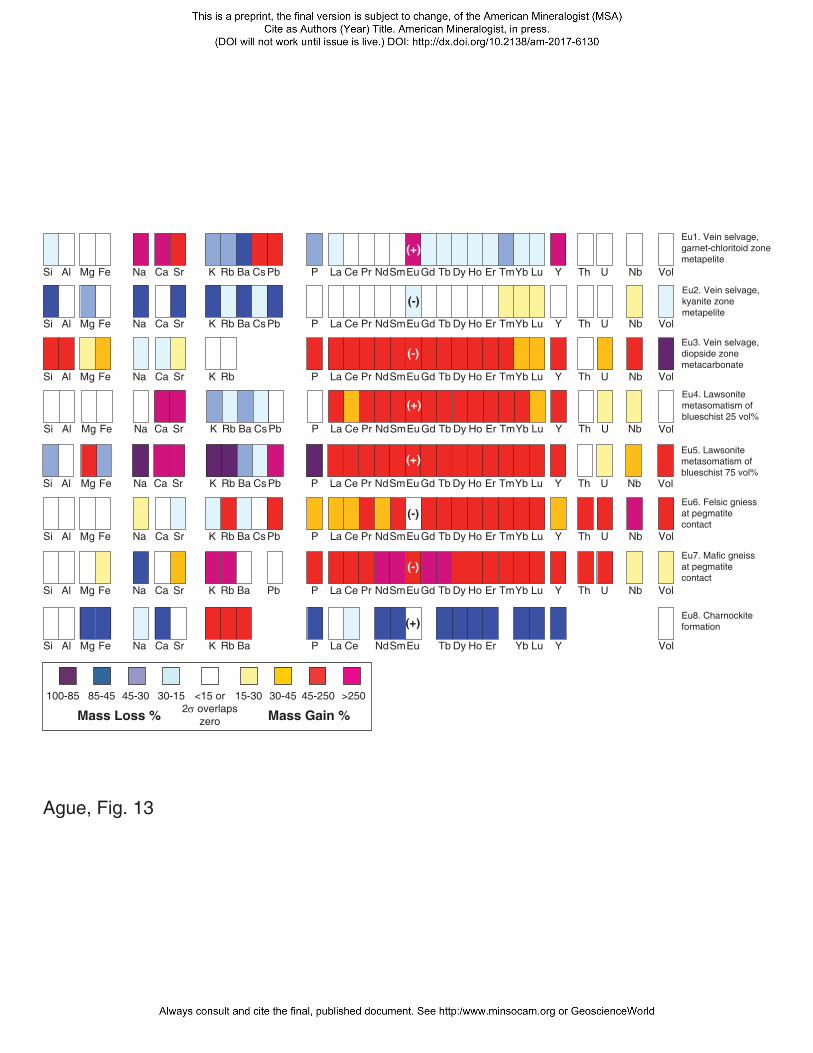
Ca SrNa K Rb Ba Pb P La Ce Pr NdSmEu Gd Tb Dy Ho Er TmYb Lu Y Th U NbCsMg FeSi Al
Eu1. Vein selvage, garnet-chloritoid zone metapelite
Eu7. Mafic gneiss at pegmatite contact
Ca SrNa K Rb Ba Pb P La Ce Pr NdSmEu Gd Tb Dy Ho Er TmYb Lu Y Th U NbMg FeSi Al
Eu6. Felsic gniess at pegmatite contact
Ca SrNa K Rb Ba Pb P La Ce Pr NdSmEu Gd Tb Dy Ho Er TmYb Lu Y Th U NbCsMg FeSi Al
Eu8. Charnockite formation
Ca SrNa K Rb Ba P La Ce NdSmEu Tb Dy Ho Er Yb Lu YMg FeSi Al
(+)
(-)
(-)
(+)
Vol
Vol
Vol
Vol
>25045-25030-4515-3030-1545-3085-45100-85 <15 or2 overlaps
zeroMass Loss % Mass Gain %
Ca SrNa K Rb Ba Pb P La Ce Pr NdSmEu Gd Tb Dy Ho Er TmYb Lu Y Th U NbCsMg FeSi Al Vol
Eu4. Lawsonite metasomatism of blueschist 25 vol%
(+)
Ca SrNa K Rb Ba Pb P La Ce Pr NdSmEu Gd Tb Dy Ho Er TmYb Lu Y Th U NbCsMg FeSi Al Vol
Eu5. Lawsonite metasomatism ofblueschist 75 vol%
(+)
Eu2. Vein selvage, kyanite zone metapelite
Ca SrNa K Rb Ba Pb P La Ce Pr NdSmEu Gd Tb Dy Ho Er TmYb Lu Y Th U NbCsMg FeSi Al
(-)
Vol
Eu3. Vein selvage, diopside zone metacarbonate
Ca SrNa K Rb P La Ce Pr NdSmEu Gd Tb Dy Ho Er TmYb Lu Y Th U NbMg FeSi Al
(-)
Vol
Ague, Fig. 13
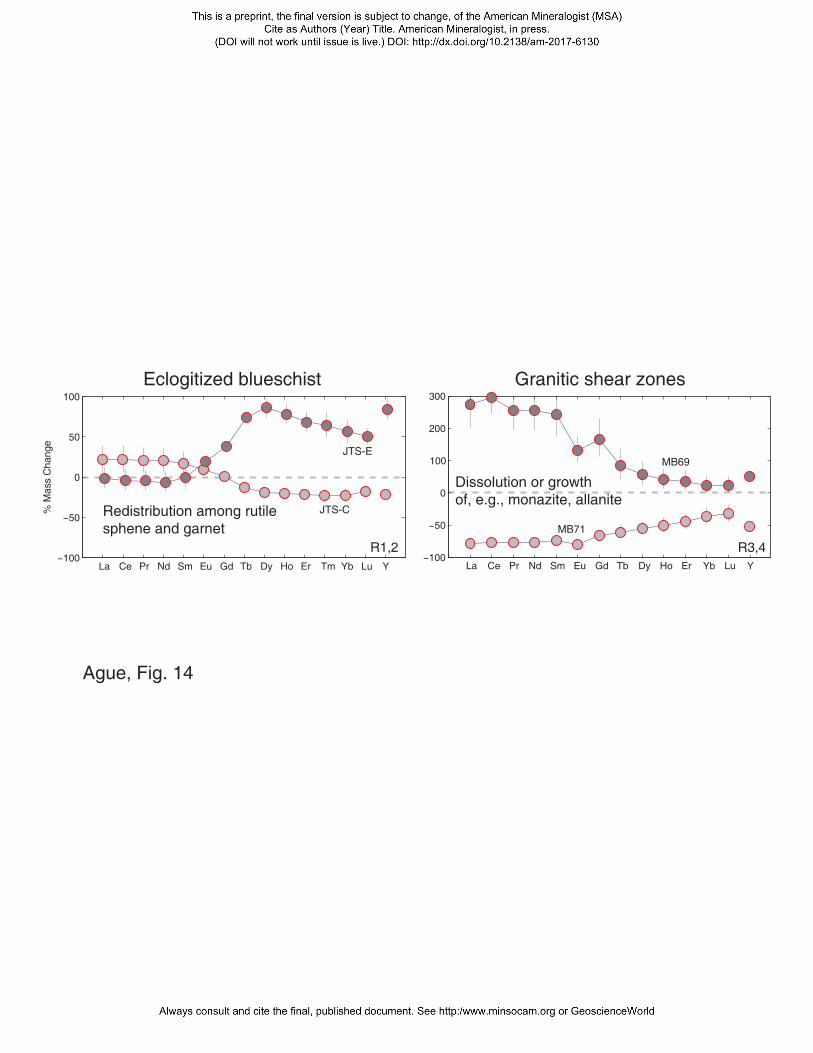
% M
ass
Cha
nge
La Ce Pr Nd Sm Eu Gd Tb Dy Ho Er Tm Yb Lu Y La Ce Pr Nd Sm Eu Gd Tb Dy Ho Er Yb Lu Y
Granitic shear zonesEclogitized blueschist
R3,4
Dissolution or growth of, e.g., monazite, allanite
Redistribution among rutilesphene and garnet
MB69
JTS-C
JTS-E
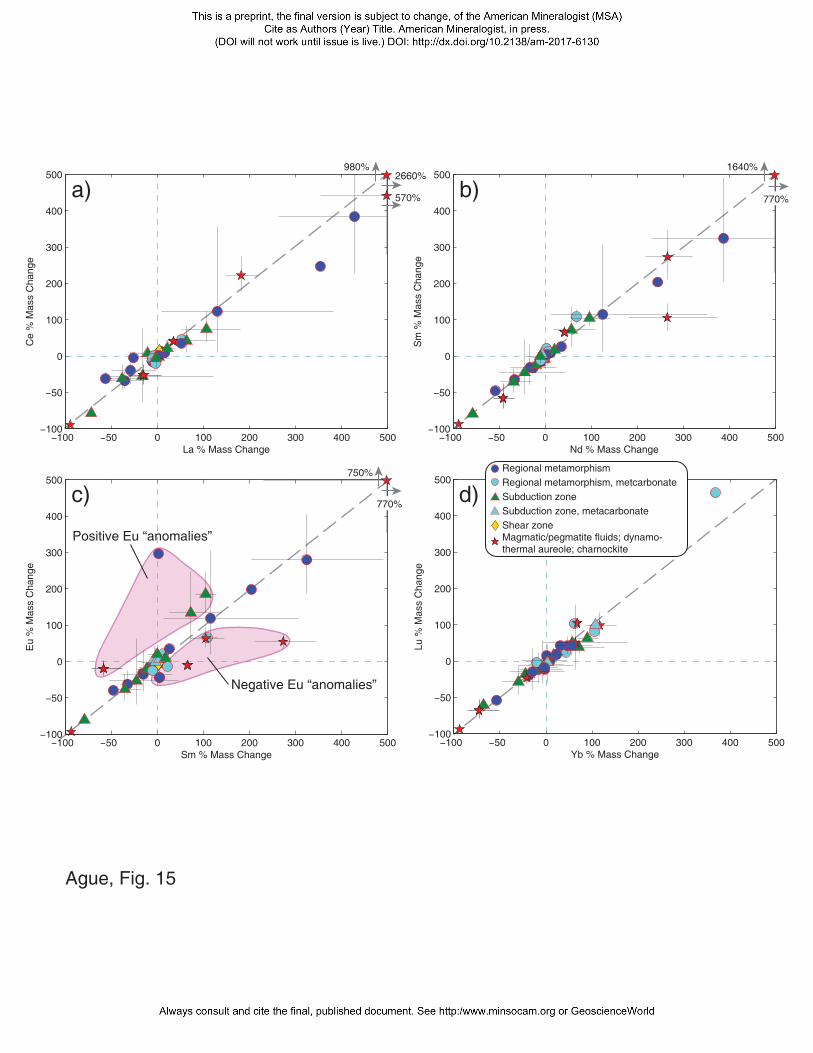
Ce
% M
ass
Cha
nge
La % Mass Change
Sm
% M
ass
Cha
nge
Nd % Mass Change
Eu
% M
ass
Cha
nge
Sm % Mass Change
Lu %
Mas
s C
hang
e
Yb % Mass Change
Regional metamorphismRegional metamorphism, metcarbonateSubduction zoneSubduction zone, metacarbonateShear zoneMagmatic/pegmatite fluids; dynamo-thermal aureole; charnockite
Positive Eu “anomalies”
Negative Eu “anomalies”
a) b)
c) d)
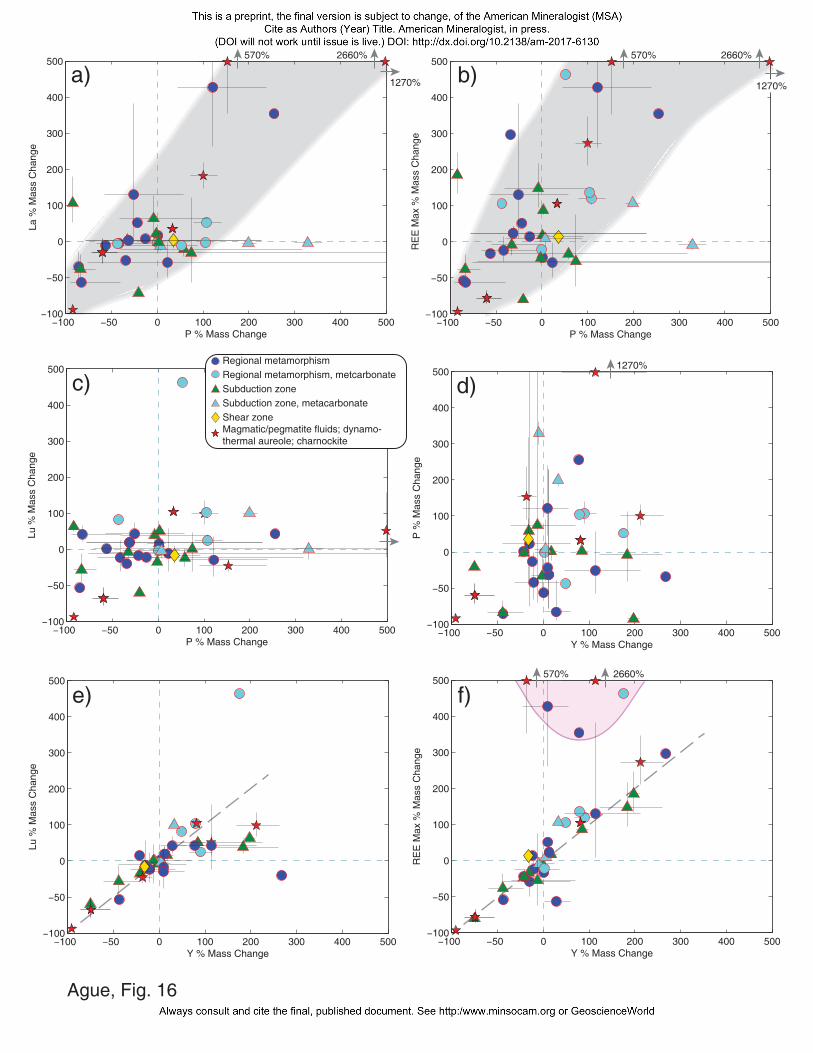
Lu %
Mas
s C
hang
e
Y % Mass Change
RE
E M
ax %
Mas
s C
hang
e
Y % Mass Change
RE
E M
ax %
Mas
s C
hang
e
P % Mass Change
P %
Mas
s C
hang
e
Y % Mass Change
La %
Mas
s C
hang
e
P % Mass Change
Lu %
Mas
s C
hang
e
P % Mass Change
b)a)
c) d)
e) f)
Regional metamorphismRegional metamorphism, metcarbonateSubduction zoneSubduction zone, metacarbonateShear zoneMagmatic/pegmatite fluids; dynamo-thermal aureole; charnockite
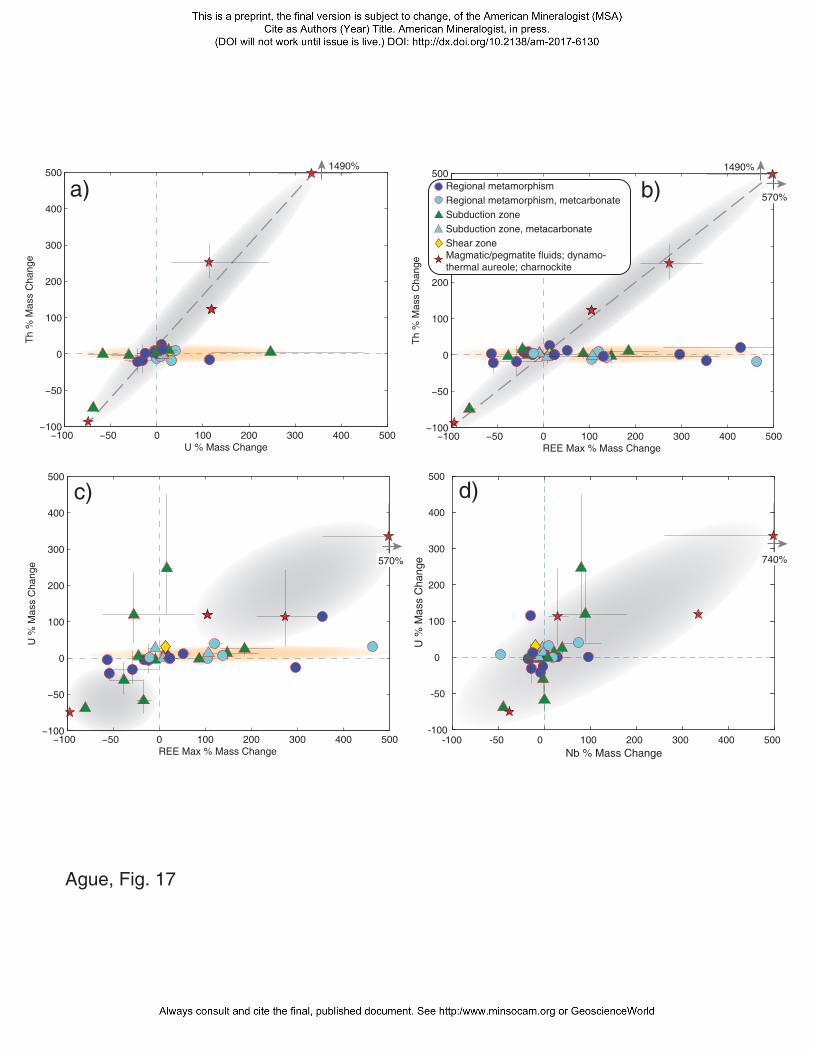
Th
% M
ass
Cha
nge
U % Mass Change
Th
% M
ass
Cha
nge
REE Max % Mass Change
U %
Mas
s C
hang
e
REE Max % Mass Change Nb % Mass Change
U %
Mas
s C
hang
e
Regional metamorphismRegional metamorphism, metcarbonateSubduction zoneSubduction zone, metacarbonateShear zoneMagmatic/pegmatite fluids; dynamo-thermal aureole; charnockite
a) b)
c) d)
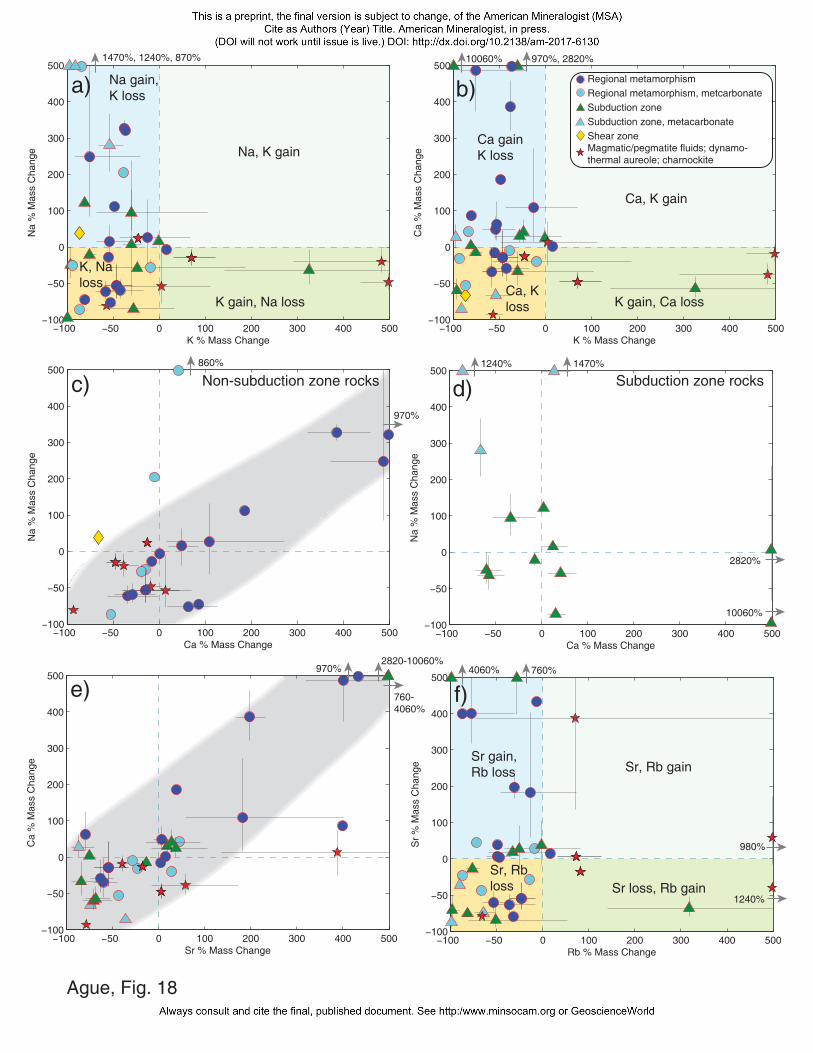
Na
% M
ass
Cha
nge
K % Mass Change
Ca
% M
ass
Cha
nge
K % Mass Change
Na
% M
ass
Cha
nge
Ca % Mass Change
Na
% M
ass
Cha
nge
Ca % Mass Change
Sr
% M
ass
Cha
nge
Rb % Mass Change
Ca
% M
ass
Cha
nge
Sr % Mass Change
K gain, Na loss
Na gain,K loss
K, Naloss
Na, K gain
Ca, K gain
K gain, Ca loss
Ca gainK loss
Ca, Kloss
Sr, Rb gain
Sr loss, Rb gain
Sr gain,Rb loss
Sr, Rbloss
Subduction zone rocksNon-subduction zone rocks
Regional metamorphismRegional metamorphism, metcarbonateSubduction zoneSubduction zone, metacarbonateShear zoneMagmatic/pegmatite fluids; dynamo-thermal aureole; charnockite
a) b)
c) d)
e) f)
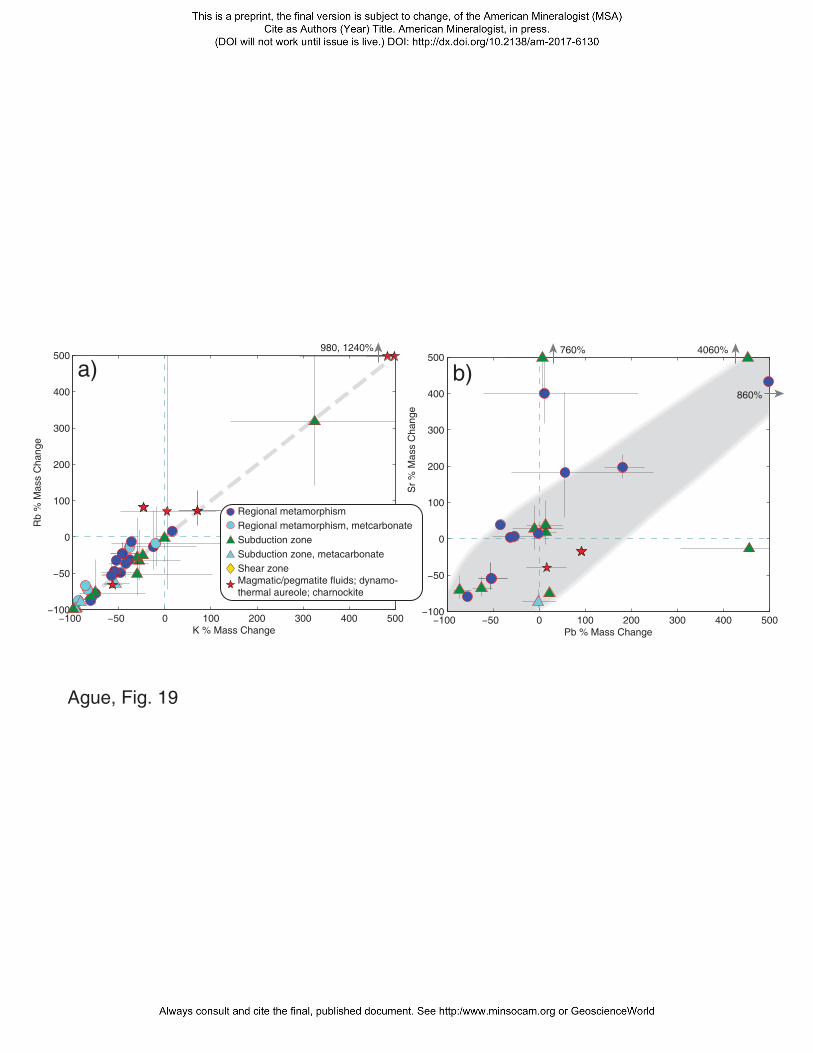
Rb
% M
ass
Cha
nge
K % Mass Change
Sr
% M
ass
Cha
nge
Pb % Mass Change
a) b)
Regional metamorphismRegional metamorphism, metcarbonateSubduction zoneSubduction zone, metacarbonateShear zoneMagmatic/pegmatite fluids; dynamo-thermal aureole; charnockite
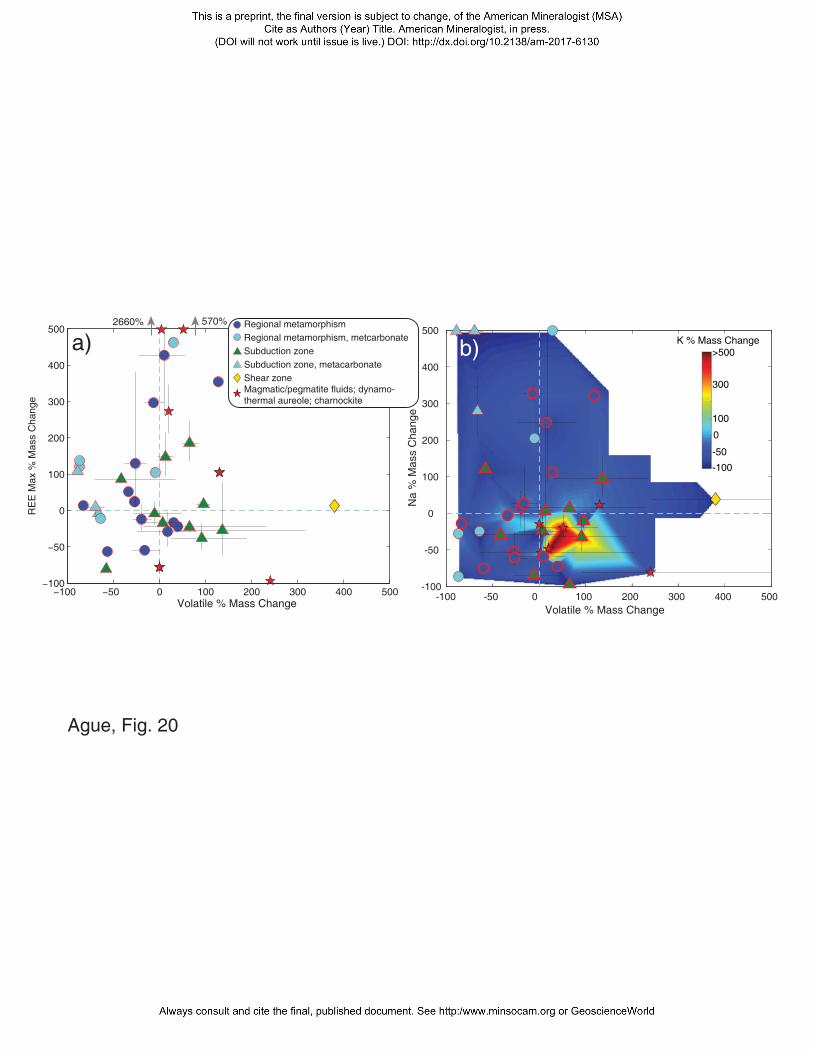
-100 -50 0 100 200 300 400 500 Volatile % Mass Change
-100
-50
0
100
200
300
400
500
Na
% M
ass
Cha
nge
K % Mass Change
-100
-50
0
100
300
>500
0 100 200 300 400 500
0
100
200
300
400
500
RE
E M
ax %
Mas
s C
hang
e
Volatile % Mass Change
570%2660%
a) b)Regional metamorphismRegional metamorphism, metcarbonateSubduction zoneSubduction zone, metacarbonateShear zoneMagmatic/pegmatite fluids; dynamo-thermal aureole; charnockite
Ague, Fig. 20
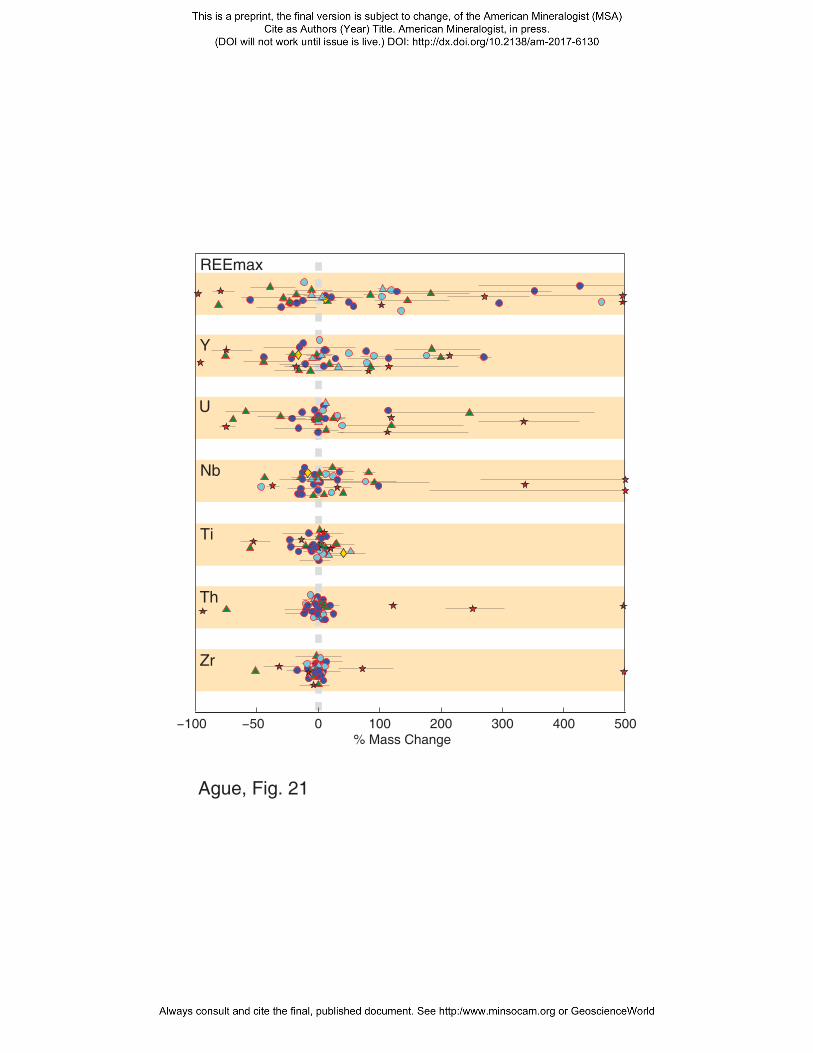
% Mass Change
Y
Ti
Nb
U
Th
Zr
REEmax
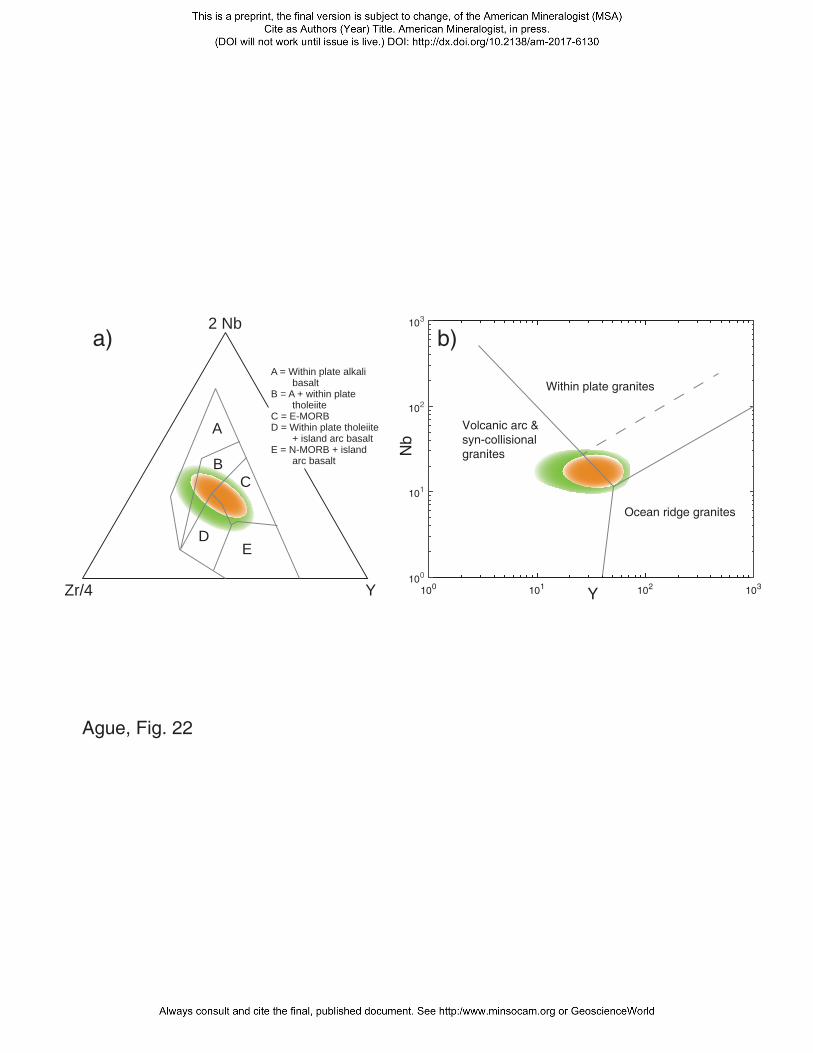
2 Nb
Zr/4 Y
A
BC
DE
A = Within plate alkali basalt
B = A + within plate tholeiite
C = E-MORBD = Within plate tholeiite
+ island arc basaltE = N-MORB + island
arc basalt
100 101 102 103Y
100
101
102
103
Nb
Volcanic arc &syn-collisionalgranites
Ocean ridge granites
Within plate granites
a) b)
Ague, Fig. 22
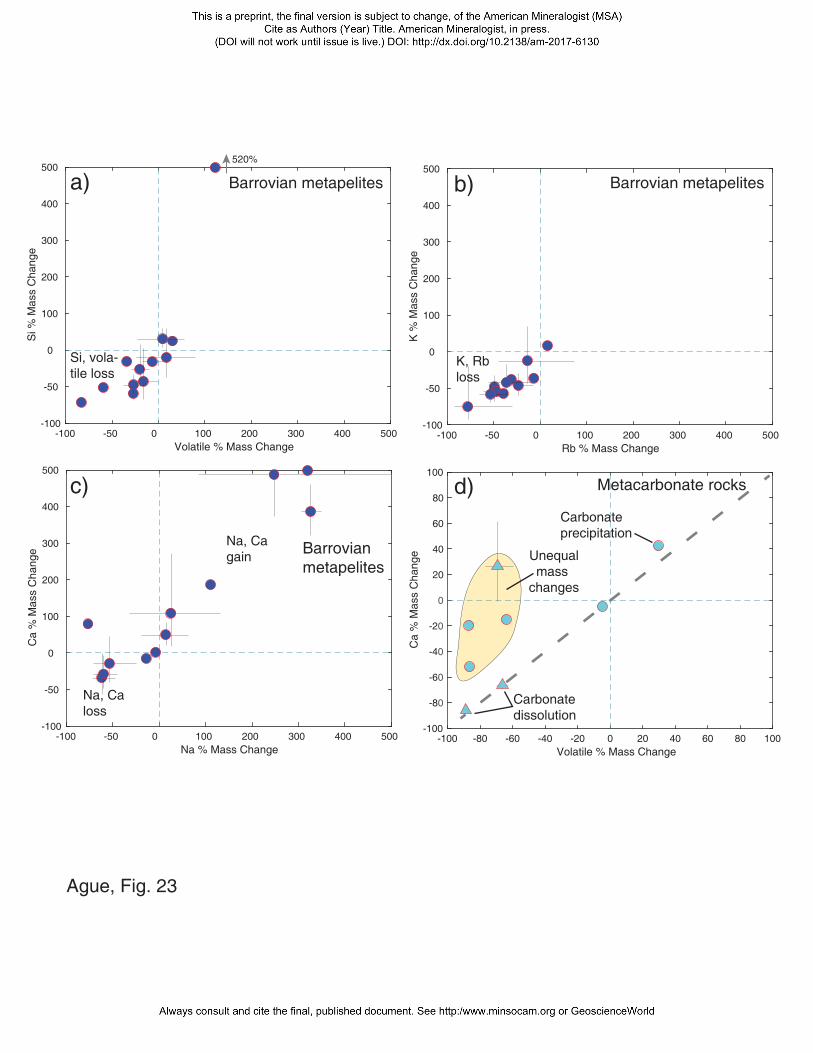
-100 -80 -60 -40 -20 0 20 40 60 80 100Volatile % Mass Change
-100
-80
-60
-40
-20
0
20
40
60
80
100
Ca
% M
ass
Cha
nge
-100 -50 0 100 200 300 400 500 Rb % Mass Change
-100
-50
0
100
200
300
400
500
K %
Mas
s C
hang
e
-100 -50 0 100 200 300 400 500 Volatile % Mass Change
-100
-50
0
100
200
300
400
500
Si %
Mas
s C
hang
e
-100 -50 0 100 200 300 400 500 Na % Mass Change
-100
-50
0
100
200
300
400
500
Ca
% M
ass
Cha
nge
Carbonatedissolution
Carbonateprecipitation
Unequalmass
changes
Barrovian metapelites Barrovian metapelites
Barrovian metapelites
Metacarbonate rocks
Si, vola-tile loss
K, Rbloss
Na, Caloss
Na, Cagain
a) b)
c) d)
520%
Ague, Fig. 23
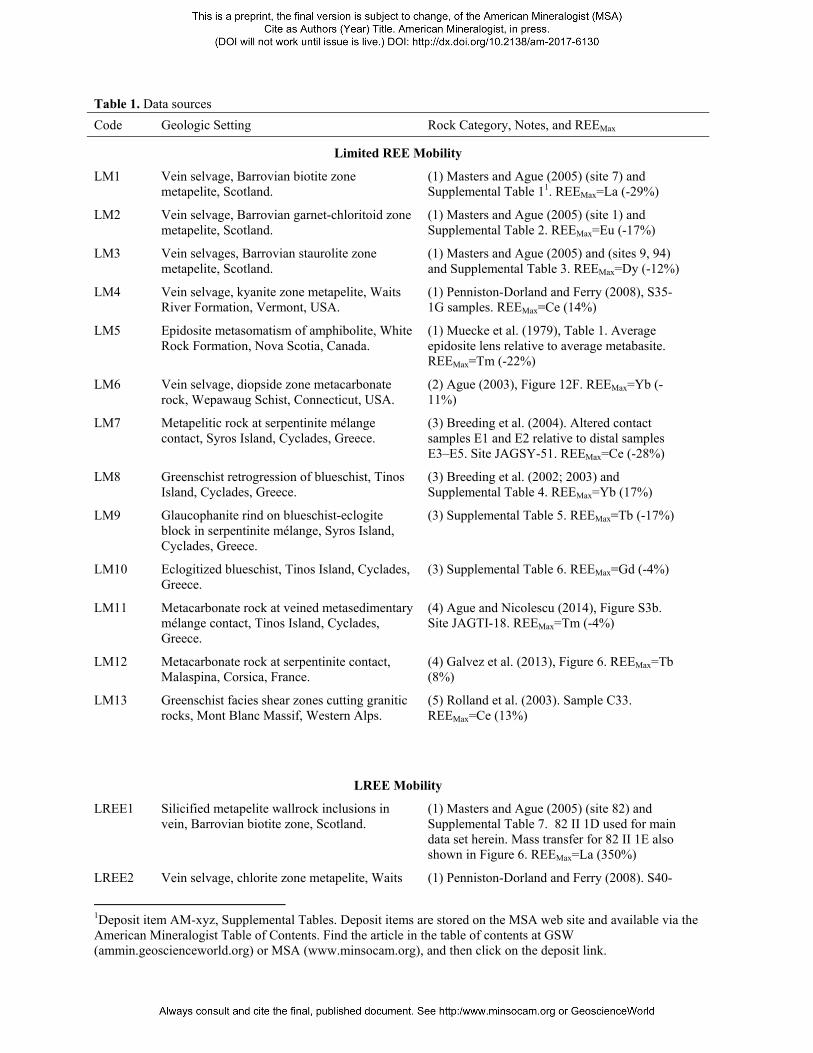
Table 1. Data sources Code Geologic Setting Rock Category, Notes, and REEMax
Limited REE Mobility
LM1 Vein selvage, Barrovian biotite zone metapelite, Scotland.
(1) Masters and Ague (2005) (site 7) and Supplemental Table 11. REEMax=La (-29%)
LM2 Vein selvage, Barrovian garnet-chloritoid zone metapelite, Scotland.
(1) Masters and Ague (2005) (site 1) and Supplemental Table 2. REEMax=Eu (-17%)
LM3 Vein selvages, Barrovian staurolite zone metapelite, Scotland.
(1) Masters and Ague (2005) and (sites 9, 94) and Supplemental Table 3. REEMax=Dy (-12%)
LM4 Vein selvage, kyanite zone metapelite, Waits River Formation, Vermont, USA.
(1) Penniston-Dorland and Ferry (2008), S35-1G samples. REEMax=Ce (14%)
LM5 Epidosite metasomatism of amphibolite, White Rock Formation, Nova Scotia, Canada.
(1) Muecke et al. (1979), Table 1. Average epidosite lens relative to average metabasite. REEMax=Tm (-22%)
LM6 Vein selvage, diopside zone metacarbonate rock, Wepawaug Schist, Connecticut, USA.
(2) Ague (2003), Figure 12F. REEMax=Yb (-11%)
LM7 Metapelitic rock at serpentinite mélange contact, Syros Island, Cyclades, Greece.
(3) Breeding et al. (2004). Altered contact samples E1 and E2 relative to distal samples E3–E5. Site JAGSY-51. REEMax=Ce (-28%)
LM8 Greenschist retrogression of blueschist, Tinos Island, Cyclades, Greece.
(3) Breeding et al. (2002; 2003) and Supplemental Table 4. REEMax=Yb (17%)
LM9 Glaucophanite rind on blueschist-eclogite block in serpentinite mélange, Syros Island, Cyclades, Greece.
(3) Supplemental Table 5. REEMax=Tb (-17%)
LM10 Eclogitized blueschist, Tinos Island, Cyclades, Greece.
(3) Supplemental Table 6. REEMax=Gd (-4%)
LM11 Metacarbonate rock at veined metasedimentary mélange contact, Tinos Island, Cyclades, Greece.
(4) Ague and Nicolescu (2014), Figure S3b. Site JAGTI-18. REEMax=Tm (-4%)
LM12 Metacarbonate rock at serpentinite contact, Malaspina, Corsica, France.
(4) Galvez et al. (2013), Figure 6. REEMax=Tb (8%)
LM13 Greenschist facies shear zones cutting granitic rocks, Mont Blanc Massif, Western Alps.
(5) Rolland et al. (2003). Sample C33. REEMax=Ce (13%)
LREE Mobility LREE1 Silicified metapelite wallrock inclusions in
vein, Barrovian biotite zone, Scotland. (1) Masters and Ague (2005) (site 82) and Supplemental Table 7. 82 II 1D used for main data set herein. Mass transfer for 82 II 1E also shown in Figure 6. REEMax=La (350%)
LREE2 Vein selvage, chlorite zone metapelite, Waits (1) Penniston-Dorland and Ferry (2008). S40-
1Deposit item AM-xyz, Supplemental Tables. Deposit items are stored on the MSA web site and available via the American Mineralogist Table of Contents. Find the article in the table of contents at GSW (ammin.geoscienceworld.org) or MSA (www.minsocam.org), and then click on the deposit link.
River Formation, Vermont, USA. 1D samples. REEMax=La (51%)
LREE3 Vein selvage, staurolite-kyanite zone, Unst, Shetland Islands, Scotland.
(1) Bucholz and Ague (2010) (site 181). 181Aiii selvage relative to less altered samples 181B, C, D, and E used in main data set herein. 181Aii selvage relations also shown in Figure 6. REEMax=La (430%)
LREE4 Regional vein selvage average, Unst, Shetland Islands, Scotland.
(1) Bucholz and Ague (2010), Figure 6. REEMax=La (130%)
LREE5& HREE1
Vein selvage, kyanite zone metapelite, Wepawaug Schist, Connecticut, USA.
(1) Ague (2011). Sample JAW-114i selvage margin relative to most distal sample 114vi. REEMax=Yb (59%); Pr loss has comparable absolute value (-51%)
LREE6 Biotite amphibolite, mylonite shear zone in dynamothermal aureole below an ophiolite remnant.
(6) Dostal et al. (1980). Epidote and quartz amphibolite used as precursors. REEMax=La (570%)
LREE7 Clino- and orthopyroxene reaction zones, margins of mafic gneiss lenses/layers associated with tonalitic leucosomes.
(6) Pan and Fleet (1996). REEMax=La (2660%)
LREE8 & R3
Shear zones cutting granitic rocks, Mont Blanc Massif, Western Alps.
(5) Rolland et al. (2003). Sample MB69. REEMax=Ce (300%)
LREE9 & R4
Shear zones cutting granitic rocks, Mont Blanc Massif, Western Alps.
(5) Rolland et al. (2003). Sample MB71. REEMax=Eu (-81%)
HREE Mobility HREE1 Vein selvage, kyanite zone metapelite,
Wepawaug Schist, Connecticut, USA. (1) Ague (2011). Sample JAW-114i selvage margin relative to most distal sample 114vi. REEMax=Yb (59%); Pr loss has comparable absolute value (-51%)
HREE2 Average vein selvage, kyanite zone metapelite, Wepawaug Schist, Connecticut, USA.
(1) Ague (2011). Site JAW-165A, south profile. REEMax=Yb (23%)
HREE3 Vein selvage, metacarbonate rock, metacarbonate ankerite-albite zone, Wepwaug Schist, Connecticut, USA
(2) Ague (2003), Figure 6A. JAW-197Ai selvage relations used for main data set herein. Selvage mass transfer for samples 197AS and 197Aii also shown in Figure 8. REEMax=Lu (460%)
HREE4 Metacarbonate rock at contact with metapelite, metacarbonate biotite zone, Wepawaug Schist, Connecticut, USA.
(2) Ague (2003), Figure 8A. JAW-171A. REEMax=Yb (105%)
HREE5 Metacarbonate rock at veined lithologic contact, metacarbonate amphibole zone, Wepawaug Schist, Connecticut, USA.
(2) Ague (2003), Figure 10C. JAW-181Rii. REEMax=Tm (140%)
HREE6 Eclogitized blueschist adjacent to fluid conduit, Tian Shan, China.
(3) Beinlich et al. (2010). Blueschist-eclogite transition zone sample C relative to blueschist hosts A and B. REEMax=Tm (-23%)
HREE7 Eclogitized blueschist adjacent to fluid (3) Beinlich et al. (2010). Blueschist-eclogite transition zone sample E relative to blueschist
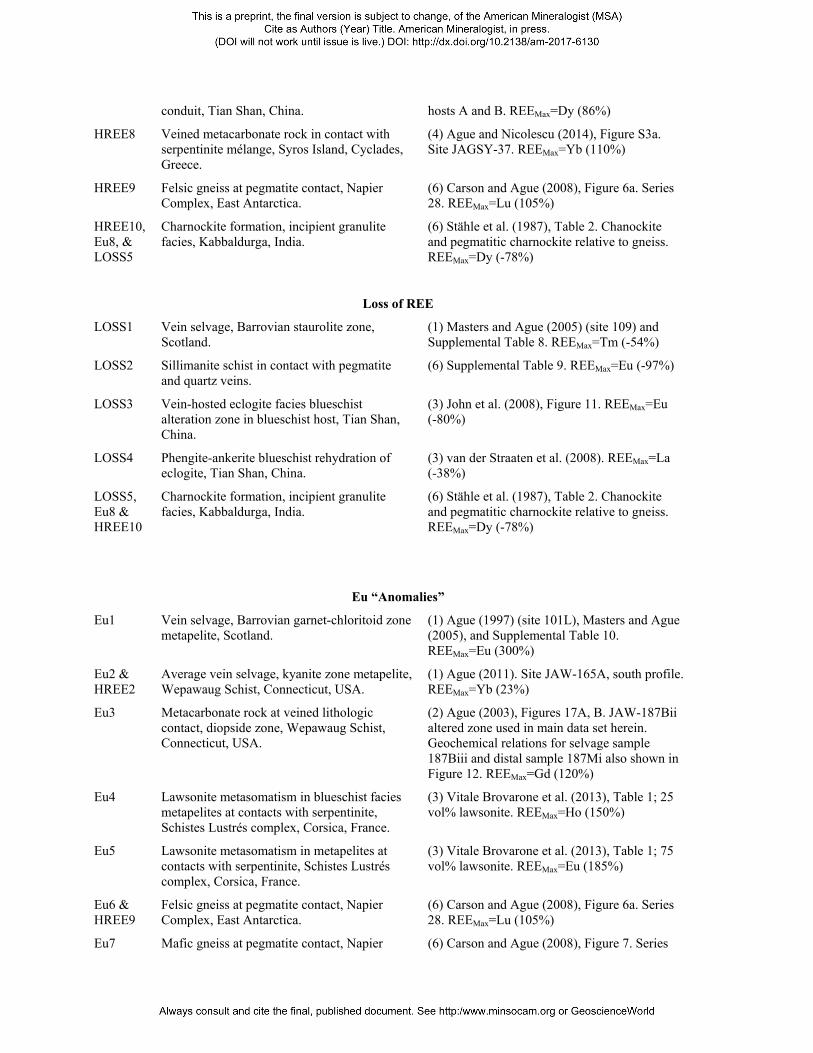
conduit, Tian Shan, China. hosts A and B. REEMax=Dy (86%)
HREE8 Veined metacarbonate rock in contact with serpentinite mélange, Syros Island, Cyclades, Greece.
(4) Ague and Nicolescu (2014), Figure S3a. Site JAGSY-37. REEMax=Yb (110%)
HREE9 Felsic gneiss at pegmatite contact, Napier Complex, East Antarctica.
(6) Carson and Ague (2008), Figure 6a. Series 28. REEMax=Lu (105%)
HREE10, Eu8, & LOSS5
Charnockite formation, incipient granulite facies, Kabbaldurga, India.
(6) Stähle et al. (1987), Table 2. Chanockite and pegmatitic charnockite relative to gneiss. REEMax=Dy (-78%)
Loss of REE LOSS1 Vein selvage, Barrovian staurolite zone,
Scotland. (1) Masters and Ague (2005) (site 109) and Supplemental Table 8. REEMax=Tm (-54%)
LOSS2 Sillimanite schist in contact with pegmatite and quartz veins.
(6) Supplemental Table 9. REEMax=Eu (-97%)
LOSS3 Vein-hosted eclogite facies blueschist alteration zone in blueschist host, Tian Shan, China.
(3) John et al. (2008), Figure 11. REEMax=Eu (-80%)
LOSS4 Phengite-ankerite blueschist rehydration of eclogite, Tian Shan, China.
(3) van der Straaten et al. (2008). REEMax=La (-38%)
LOSS5, Eu8 & HREE10
Charnockite formation, incipient granulite facies, Kabbaldurga, India.
(6) Stähle et al. (1987), Table 2. Chanockite and pegmatitic charnockite relative to gneiss. REEMax=Dy (-78%)
Eu “Anomalies”
Eu1 Vein selvage, Barrovian garnet-chloritoid zone metapelite, Scotland.
(1) Ague (1997) (site 101L), Masters and Ague (2005), and Supplemental Table 10. REEMax=Eu (300%)
Eu2 & HREE2
Average vein selvage, kyanite zone metapelite, Wepawaug Schist, Connecticut, USA.
(1) Ague (2011). Site JAW-165A, south profile. REEMax=Yb (23%)
Eu3 Metacarbonate rock at veined lithologic contact, diopside zone, Wepawaug Schist, Connecticut, USA.
(2) Ague (2003), Figures 17A, B. JAW-187Bii altered zone used in main data set herein. Geochemical relations for selvage sample 187Biii and distal sample 187Mi also shown in Figure 12. REEMax=Gd (120%)
Eu4 Lawsonite metasomatism in blueschist facies metapelites at contacts with serpentinite, Schistes Lustrés complex, Corsica, France.
(3) Vitale Brovarone et al. (2013), Table 1; 25 vol% lawsonite. REEMax=Ho (150%)
Eu5 Lawsonite metasomatism in metapelites at contacts with serpentinite, Schistes Lustrés complex, Corsica, France.
(3) Vitale Brovarone et al. (2013), Table 1; 75 vol% lawsonite. REEMax=Eu (185%)
Eu6 & HREE9
Felsic gneiss at pegmatite contact, Napier Complex, East Antarctica.
(6) Carson and Ague (2008), Figure 6a. Series 28. REEMax=Lu (105%)
Eu7 Mafic gneiss at pegmatite contact, Napier (6) Carson and Ague (2008), Figure 7. Series
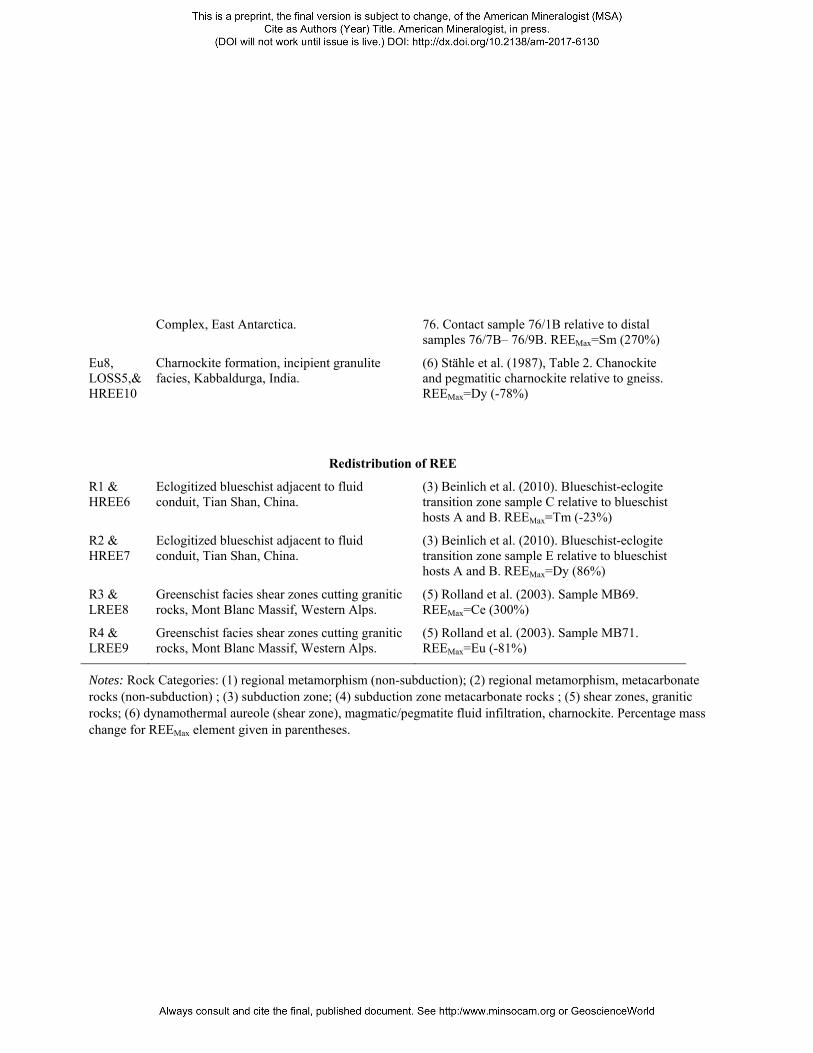
Complex, East Antarctica. 76. Contact sample 76/1B relative to distal samples 76/7B– 76/9B. REEMax=Sm (270%)
Eu8, LOSS5,& HREE10
Charnockite formation, incipient granulite facies, Kabbaldurga, India.
(6) Stähle et al. (1987), Table 2. Chanockite and pegmatitic charnockite relative to gneiss. REEMax=Dy (-78%)
Redistribution of REE R1 & HREE6
Eclogitized blueschist adjacent to fluid conduit, Tian Shan, China.
(3) Beinlich et al. (2010). Blueschist-eclogite transition zone sample C relative to blueschist hosts A and B. REEMax=Tm (-23%)
R2 & HREE7
Eclogitized blueschist adjacent to fluid conduit, Tian Shan, China.
(3) Beinlich et al. (2010). Blueschist-eclogite transition zone sample E relative to blueschist hosts A and B. REEMax=Dy (86%)
R3 & LREE8
Greenschist facies shear zones cutting granitic rocks, Mont Blanc Massif, Western Alps.
(5) Rolland et al. (2003). Sample MB69. REEMax=Ce (300%)
R4 & LREE9
Greenschist facies shear zones cutting granitic rocks, Mont Blanc Massif, Western Alps.
(5) Rolland et al. (2003). Sample MB71. REEMax=Eu (-81%)
Notes: Rock Categories: (1) regional metamorphism (non-subduction); (2) regional metamorphism, metacarbonate rocks (non-subduction) ; (3) subduction zone; (4) subduction zone metacarbonate rocks ; (5) shear zones, granitic rocks; (6) dynamothermal aureole (shear zone), magmatic/pegmatite fluid infiltration, charnockite. Percentage mass change for REEMax element given in parentheses.