Embed Size (px)
Citation preview

1
Literacy, Numeracy and Opportunity in the Knowledge
Economy: What we know
T. Scott MurrayWelfare to work: The next generation
Community services council of Newfoundland and LabradorSt. John’s, Newfoundland
November 16-17, 2003
Telephone: (613) 951-9035e-mail address: [email protected]
http://www.ets.org/all/
2
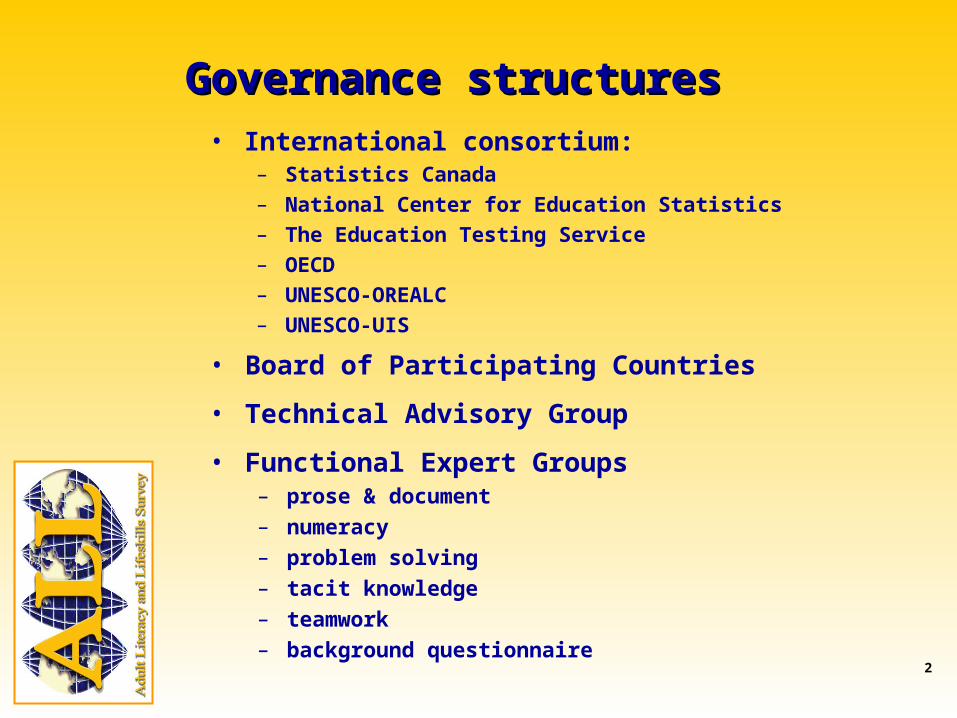
Governance structuresGovernance structures• International consortium:
– Statistics Canada
– National Center for Education Statistics
– The Education Testing Service
– OECD
– UNESCO-OREALC
– UNESCO-UIS
• Board of Participating Countries
• Technical Advisory Group
• Functional Expert Groups– prose & document
– numeracy
– problem solving
– tacit knowledge
– teamwork
– background questionnaire
3
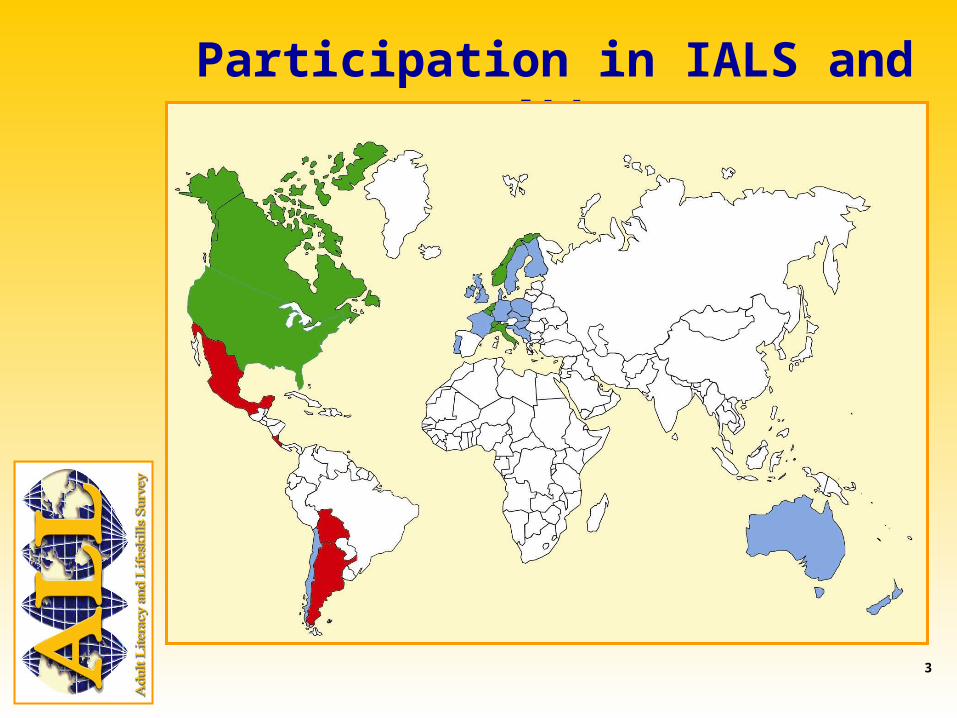
Participation in IALS and ALL
4
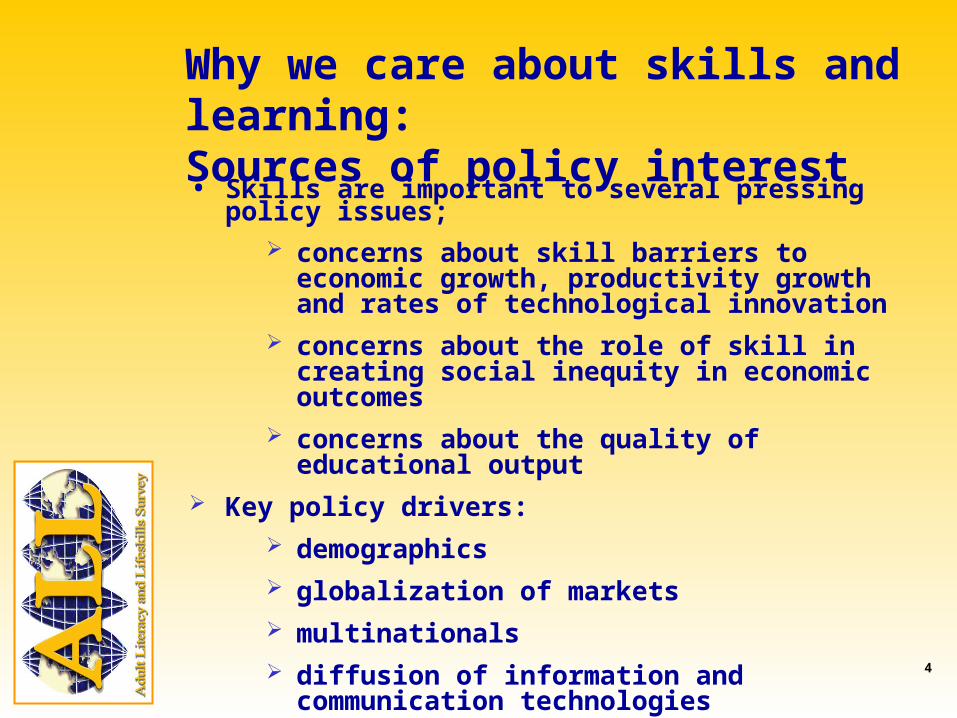
• Skills are important to several pressing policy issues; concerns about skill barriers to economic growth,
productivity growth and rates of technological innovation
concerns about the role of skill in creating social inequity in economic outcomes
concerns about the quality of educational output Key policy drivers:
demographics globalization of markets multinationals diffusion of information and communication
technologies competition from the developing world
Why we care about skills and learning:Sources of policy interest
5
Definitions of human and social capital
Human capital: the knowledge skills, competences and other attributes enbodied in individuals that are relevant to economic activity (OECD)
Social capital: networks, norms and trust that allow social agents and institutions to be more effective in achieving common objectives. (Coleman)
6
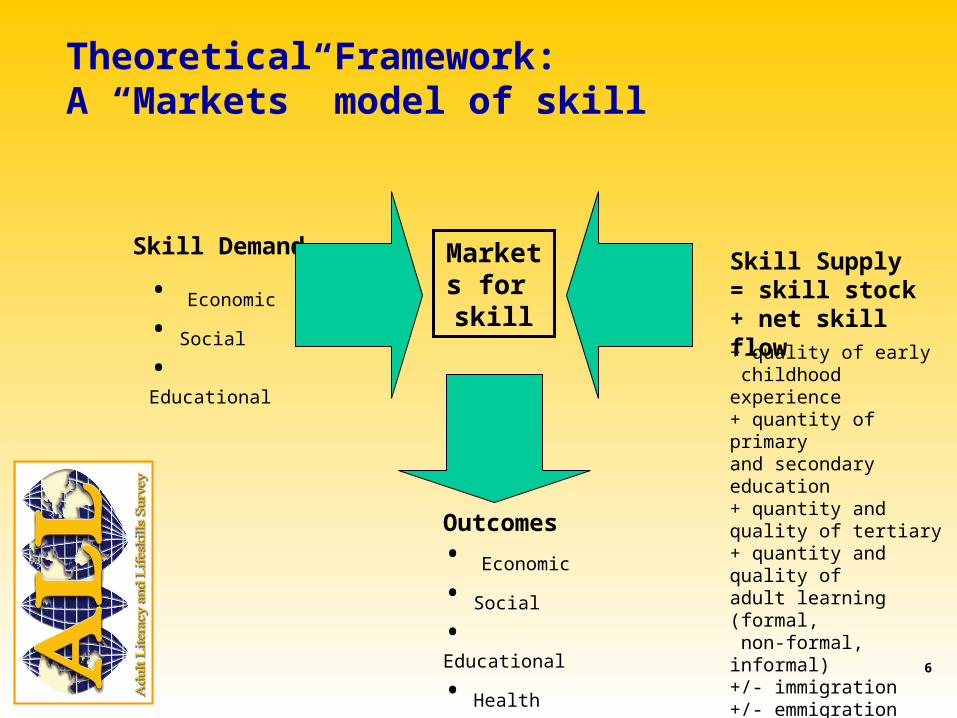
Theoretical Framework:A “Markets” model of skill
Markets for skill
Skill Supply = skill stock + net skill flow+ quality of early childhood experience+ quantity of primaryand secondary education+ quantity and quality of tertiary+ quantity and quality ofadult learning (formal, non-formal, informal)+/- immigration+/- emmigration- skill loss associated with insufficient demand+/- social demand for skill+/- economic demand forskill
Outcomes
Skill Demand
• Economic
• Social
• Educational
• Health
• Economic
• Social
• Educational
7
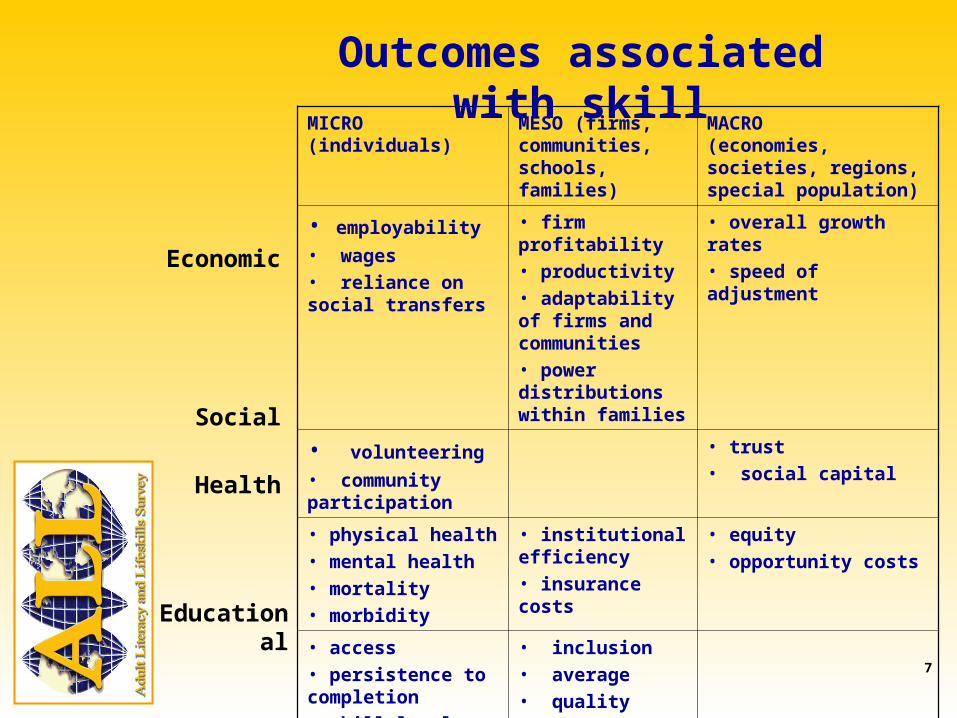
MICRO(individuals)
MESO (firms, communities, schools, families)
MACRO(economies, societies, regions, special population)
• employability
• wages• reliance on social transfers
• firm profitability• productivity• adaptability of firms and communities• power distributions within families
• overall growth rates• speed of adjustment
• volunteering
• community participation
• trust• social capital
• physical health• mental health• mortality• morbidity
• institutional efficiency• insurance costs
• equity• opportunity costs
• access• persistence to completion• skill level
• inclusion• average• quality
Economic
Social
Health
Educational
Outcomes associated with skill
8
– “Essential skills” are a set of skills that are used in virtually all occupations.
– Essential skills are also used throughout the activities of daily life: from shopping to food preparation, from recreational activities to community involvement.
– Essential Skills are enabling skills that:
• Help people perform the tasks required by their occupation and other activities of daily life
• Provide people with a foundation to learn other skills
• Enhance people’s ability to adapt to workplace and consumer change.
What Are Essential Skills
9
– Implicit theories: The view from the demand side
– Explicit theories: The view from inside the head
– Theory be damned: The empirical approach
Which Skills Are Essential?Three Approaches:
10
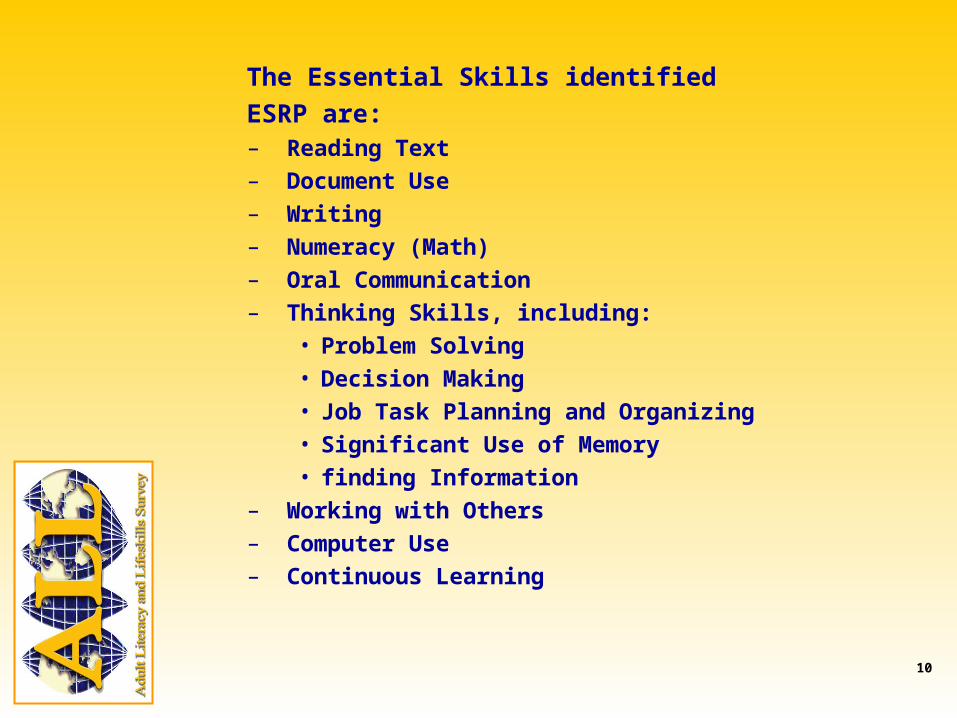
The Essential Skills identified
ESRP are:– Reading Text– Document Use– Writing– Numeracy (Math)– Oral Communication– Thinking Skills, including:
• Problem Solving• Decision Making• Job Task Planning and Organizing• Significant Use of Memory• finding Information
– Working with Others– Computer Use– Continuous Learning
11
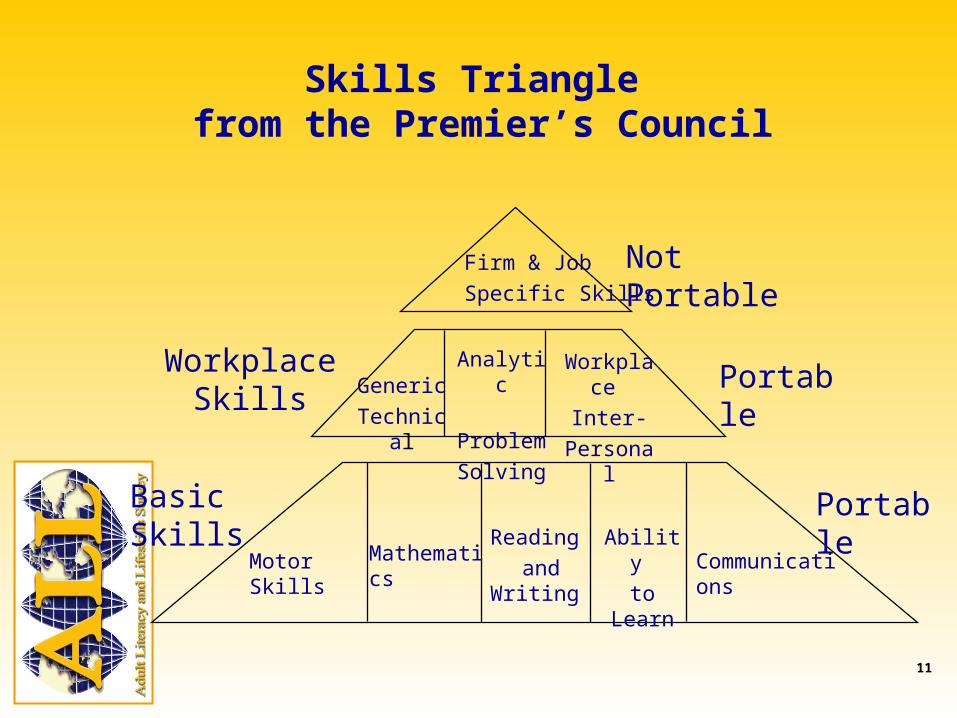
Skills Triangle from the Premier’s Council
Firm & Job Specific Skills
Not Portable
GenericTechnical
Analytic Problem Solving
Workplace Inter-
Personal
PortableWorkplace Skills
Motor Skills MathematicsReading
and WritingAbility
to Learn Communications
PortableBasic Skills
12
• Prose Literacy: the knowledge and skills needed to understand and use information from text including editorials, news stories, poems and fiction;
• Document Literacy: the knowledge and skills required to locate and use information contained in various format, including job applications, payroll forms, transportation schedules, maps, tables and graphics;
• Numeracy: the knowledge and skills required to understand, use, interpret and communicate mathematical information contained in different life situations.
Skills description
13
• Problem solving: the knowledge and skills required in elaborating projects, identifying relevant information in order to plan and analyze (e.g. finding an apartment, organizing an event, etc);
• Information, Communication and Technology Literacy (ICTL): measures of different technologies, computers and internet use in the work setting and in general, training and computer skills development, and attitude toward new technologies.
• Tacit knowledge, ICT, team work, speaking and listening.
Skills description
14
0.5 1.0 1.5 2.0 2.5 3.0 3.5 4.0 4.5
Other goods
Skilled goods
Service
Data m anipulation
Data
Managem ent
Knowledge
Standardized factor score (anchored at 2.5)
0 1 2 3 4
Skilled goods
Other goods
Data m anipulation
All occupations
Services
Managem ent
Knowledge
Data
Per cent
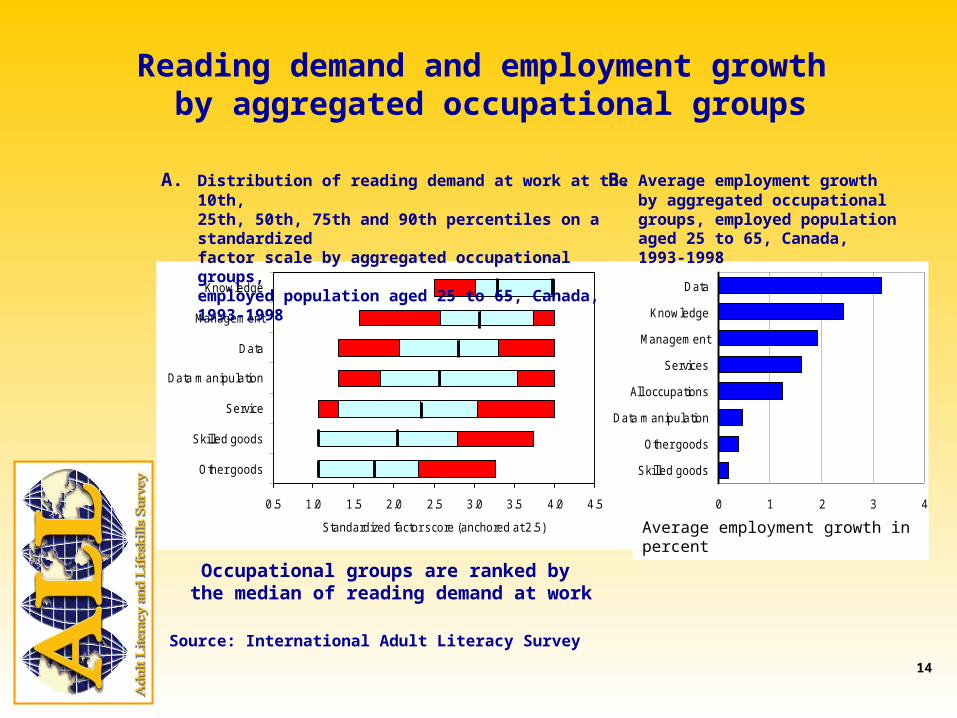
Reading demand and employment growth by aggregated occupational groups
Source: International Adult Literacy Survey
Occupational groups are ranked by the median of reading demand at work
A. Distribution of reading demand at work at the 10th, 25th, 50th, 75th and 90th percentiles on a standardized factor scale by aggregated occupational groups, employed population aged 25 to 65, Canada, 1993-1998
B. Average employment growth by aggregated occupational groups, employed population aged 25 to 65, Canada, 1993-1998
Average employment growth in percent
15
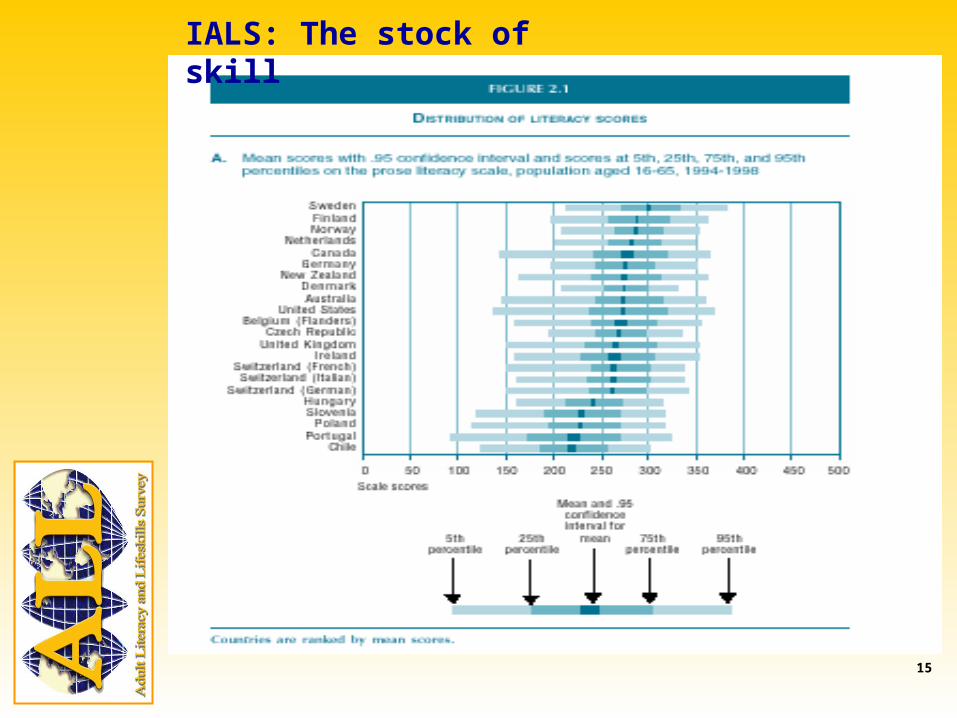
IALS: The stock of skill
16
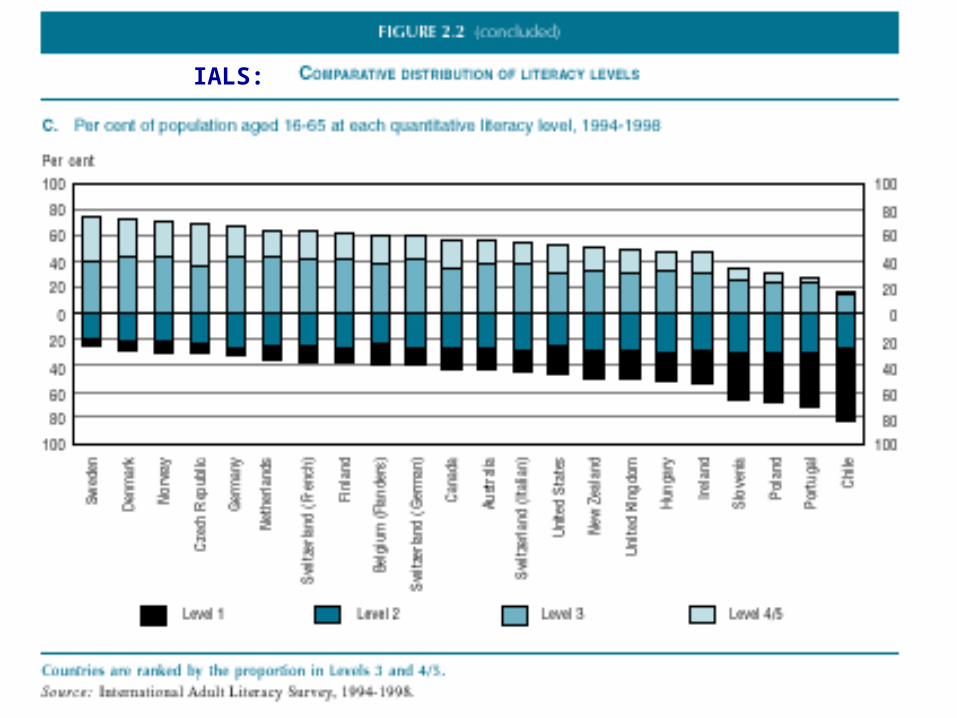
IALS:
17
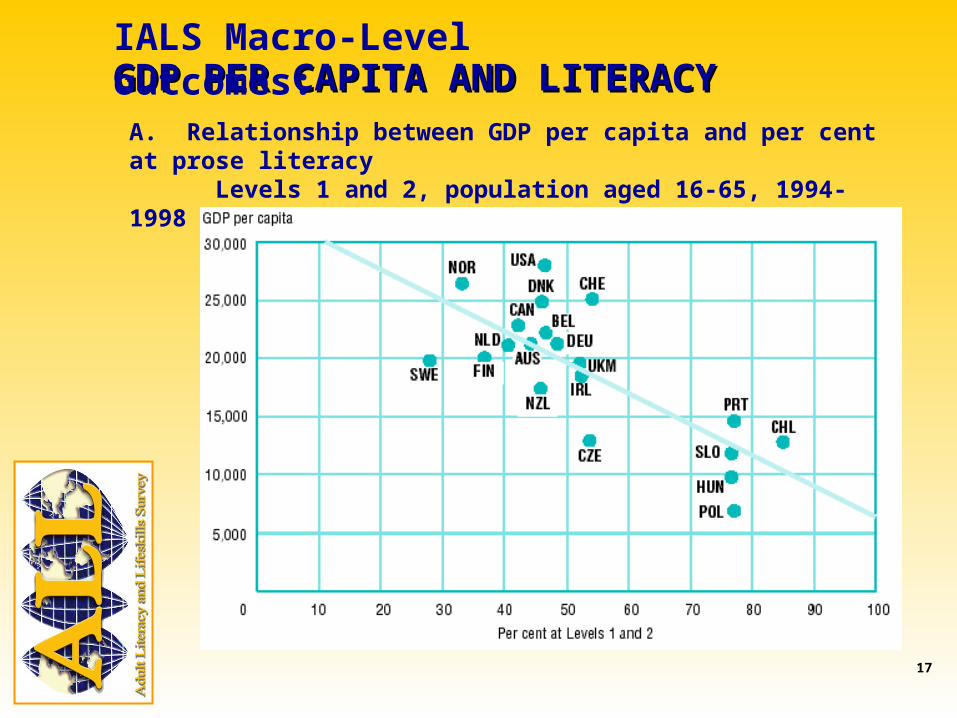
GDP PER CAPITA AND LITERACYGDP PER CAPITA AND LITERACYA. Relationship between GDP per capita and per cent at prose literacy Levels 1 and 2, population aged 16-65, 1994-1998
IALS Macro-Level outcomes:
18
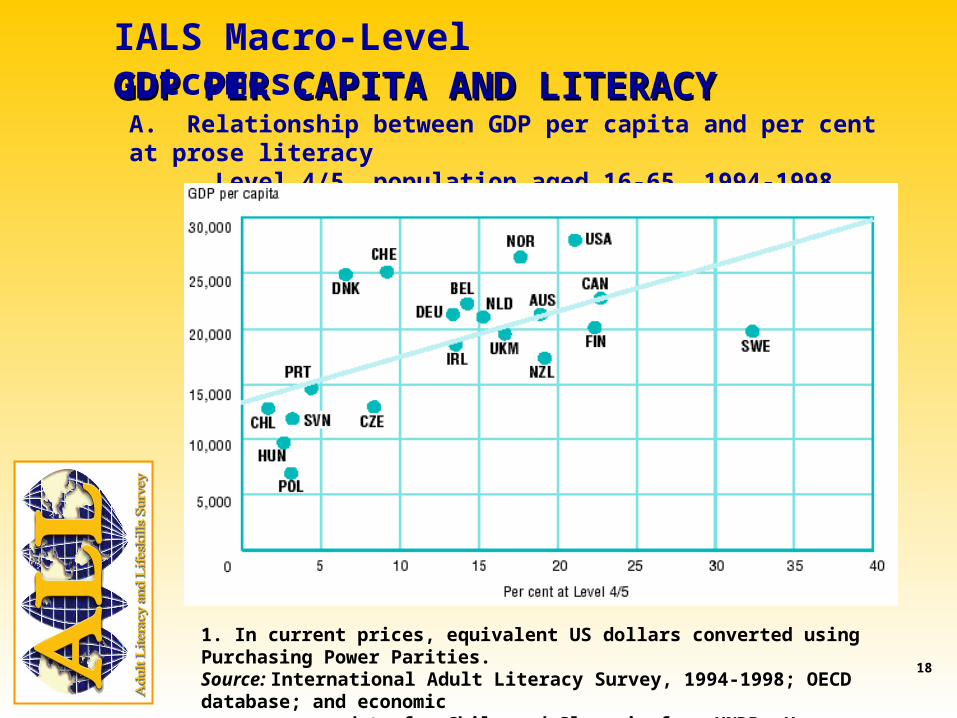
GDP PER CAPITA AND LITERACYGDP PER CAPITA AND LITERACYA. Relationship between GDP per capita and per cent at prose literacy Level 4/5, population aged 16-65, 1994-1998
1. In current prices, equivalent US dollars converted using Purchasing Power Parities.Source: International Adult Literacy Survey, 1994-1998; OECD database; and economic data for Chile and Slovenia from UNDP, Human Development Report 1999.
IALS Macro-Level outcomes:
19
0
20
40
60
80
100
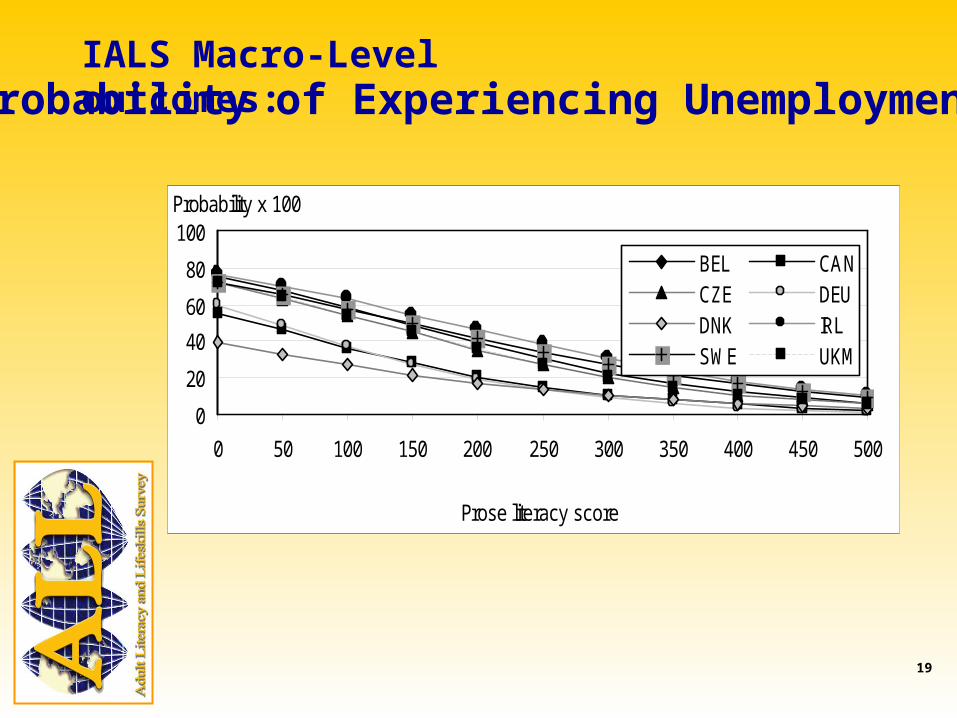
0 50 100 150 200 250 300 350 400 450 500
Prose literacy score
BEL CANCZE DEUDNK IRLSWE UKM
Probability x 100
Probability of Experiencing UnemploymentIALS Macro-Level outcomes:
20
0 10 20 30 40 50
Canada
Finland
United Kingdom
Norway
New Zealand
Australia
United States
Ireland
P ortugal
Hungary
Denmark
Slovenia
Netherlands
Belgium (Flanders)
Switzerland
Sweden
Chile
Czech Republic
Germany
P oland
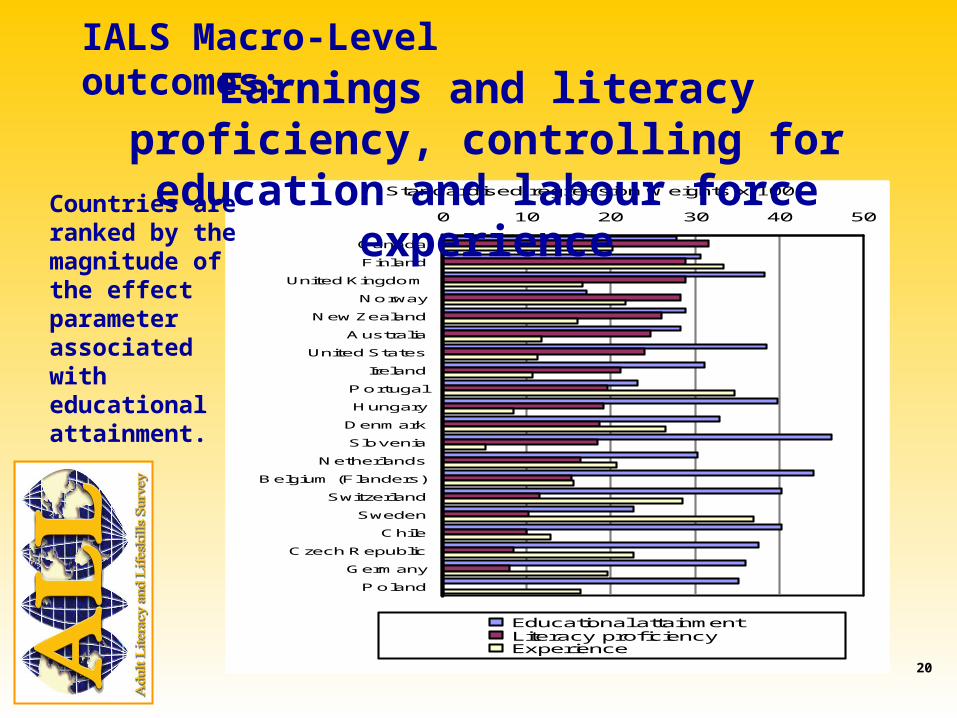
Educational attainmentLiteracy proficiencyExperience
Standardised regression w eights x 100
Earnings and literacy proficiency, controlling for education and labour force experience
Countries are ranked by the magnitude of the effect parameter associated with educational attainment.
IALS Macro-Level outcomes:
21
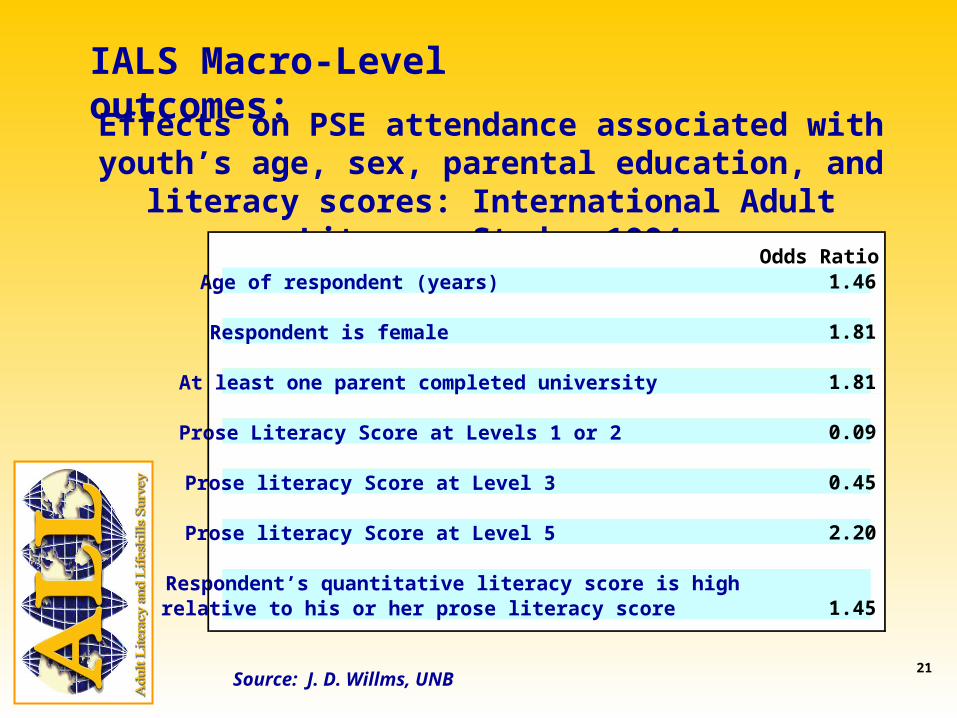
Effects on PSE attendance associated with youth’s age, sex, parental education, and literacy scores: International Adult
Literacy Study, 1994
Source: J. D. Willms, UNB
Odds RatioAge of respondent (years) 1.46
Respondent is female 1.81
At least one parent completed university 1.81
Prose Literacy Score at Levels 1 or 2 0.09
Prose literacy Score at Level 3 0.45
Prose literacy Score at Level 5 2.20
Respondent’s quantitative literacy score is highrelative to his or her prose literacy score 1.45
IALS Macro-Level outcomes:
22
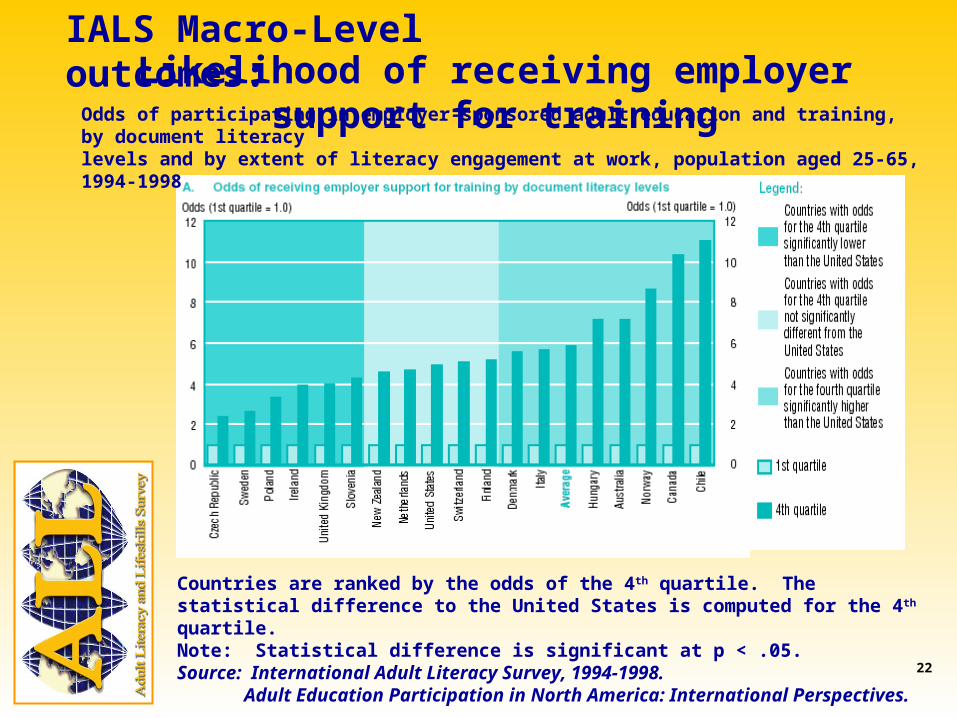
Odds of participating in employer-sponsored adult education and training, by document literacy levels and by extent of literacy engagement at work, population aged 25-65, 1994-1998
Likelihood of receiving employer support for training
Countries are ranked by the odds of the 4th quartile. The statistical difference to the United States is computed for the 4th quartile.Note: Statistical difference is significant at p < .05.Source: International Adult Literacy Survey, 1994-1998. Adult Education Participation in North America: International Perspectives.
IALS Macro-Level outcomes:
23
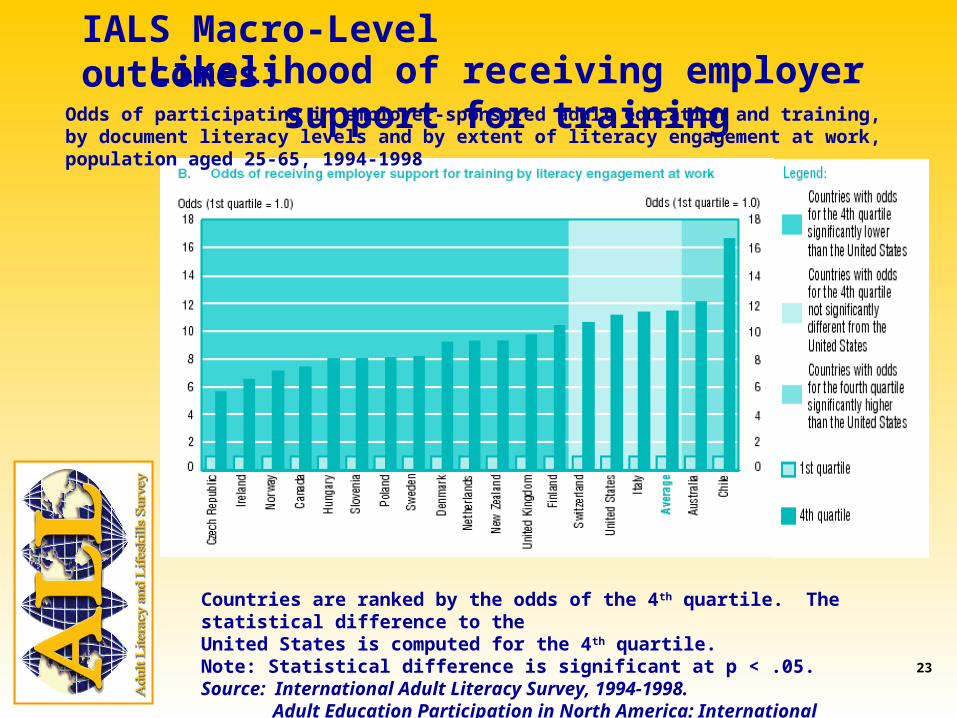
Likelihood of receiving employer support for trainingOdds of participating in employer-sponsored adult education and training, by document literacy levels and by extent of literacy engagement at work, population aged 25-65, 1994-1998
Countries are ranked by the odds of the 4th quartile. The statistical difference to the United States is computed for the 4th quartile.Note: Statistical difference is significant at p < .05.Source: International Adult Literacy Survey, 1994-1998. Adult Education Participation in North America: International Perspectives.
IALS Macro-Level outcomes:
24
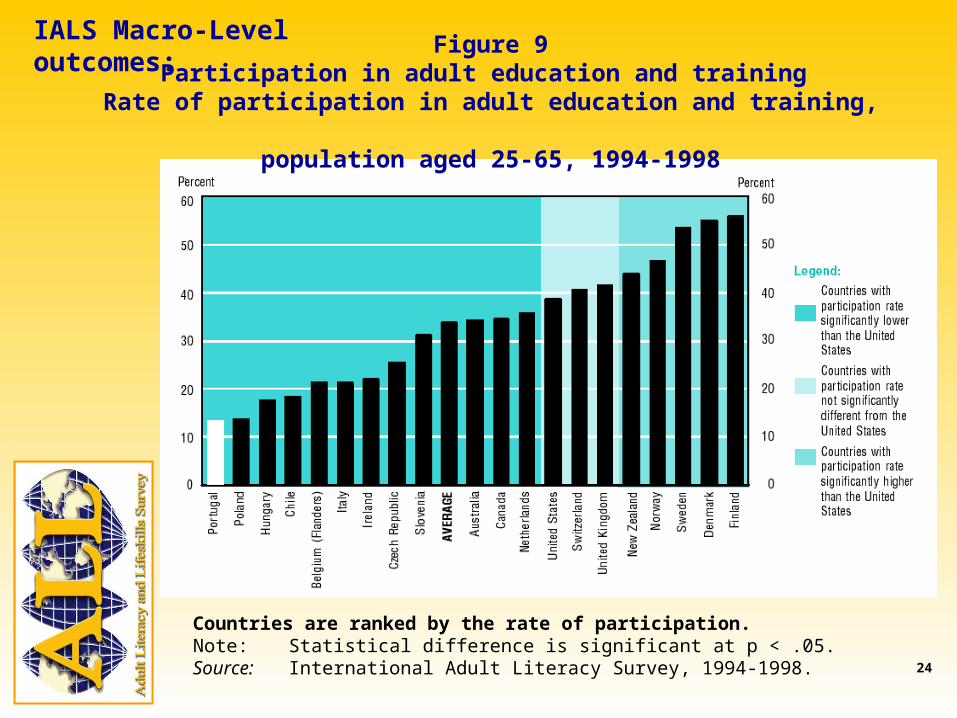
Countries are ranked by the rate of participation.Note: Statistical difference is significant at p < .05.Source: International Adult Literacy Survey, 1994-1998.
Figure 9Participation in adult education and training
Rate of participation in adult education and training, population aged 25-65, 1994-1998
IALS Macro-Level outcomes:
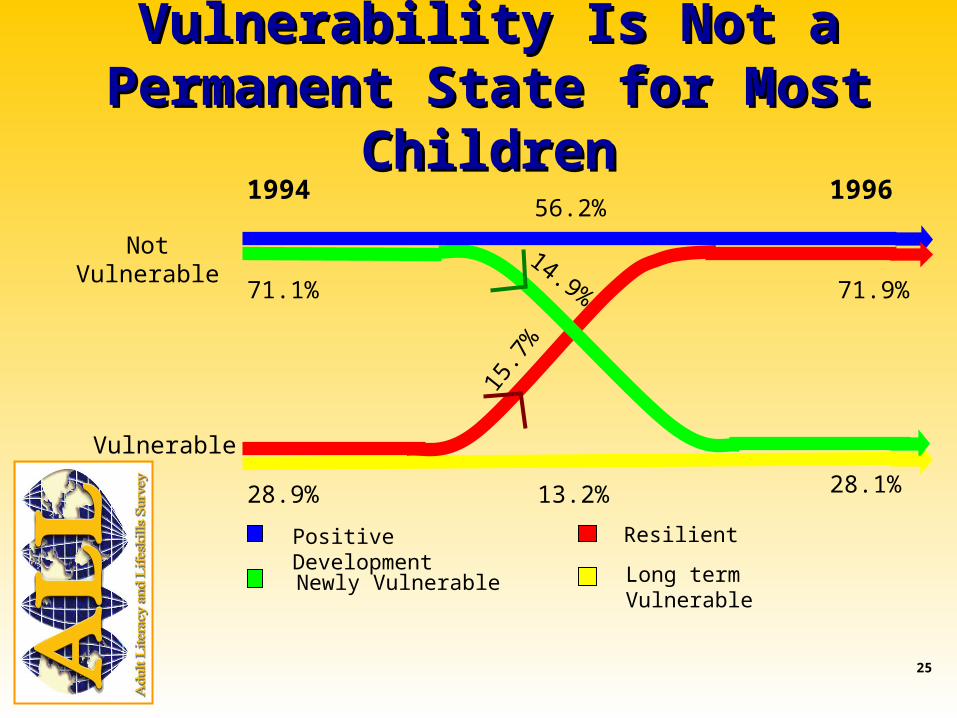
25
Vulnerable
1994 1996
71.1%
56.2%
71.9%
28.9% 28.1%
14.9%
15.7
%13.2%
Vulnerability Is Not a Permanent Vulnerability Is Not a Permanent State for Most ChildrenState for Most Children
Newly Vulnerable
Positive Development Resilient
Long term Vulnerable
Not Vulnerable
26
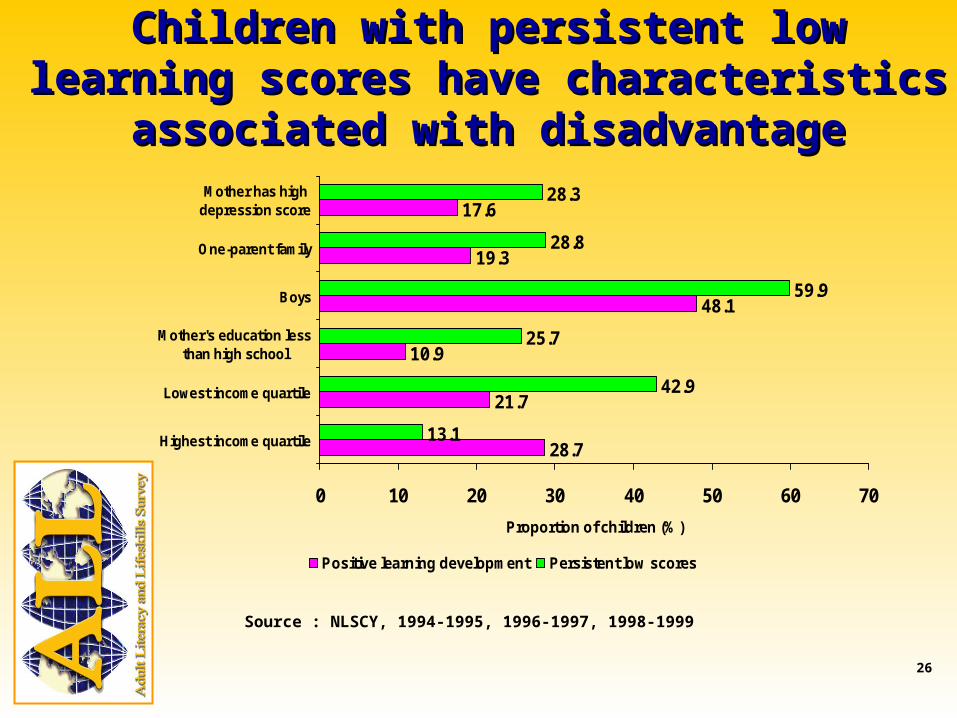
Children with persistent low learning scores have Children with persistent low learning scores have characteristics associated with disadvantagecharacteristics associated with disadvantage
28.7
21.7
10.9
48.1
19.3
17.6
13.1
42.9
25.7
59.9
28.8
28.3
0 10 20 30 40 50 60 70
Highest income quartile
Lowest income quartile
Mother's education lessthan high school
Boys
One-parent family
Mother has highdepression score
Proportion of children (%)
Positive learning development Persistent low scores
Source : NLSCY, 1994-1995, 1996-1997, 1998-1999
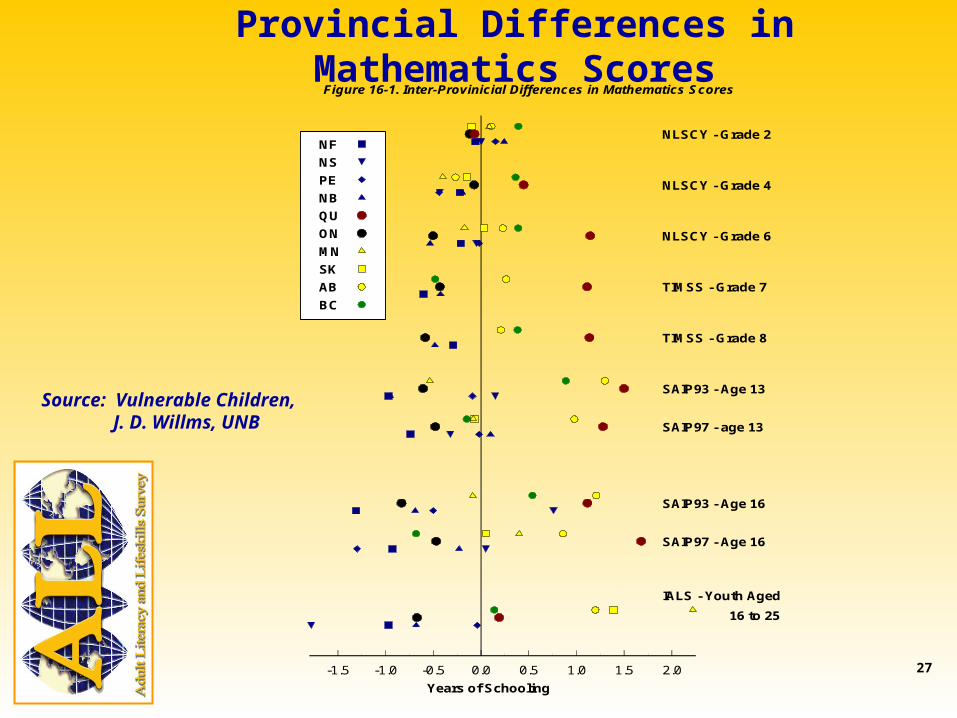
27-1.5 -1.0 -0.5 0.0 0.5 1.0 1.5 2.0
NLSCY - Grade 2
NLSCY - Grade 4
NLSCY - Grade 6
NLSCY - Grade 6
IALS - Youth Aged
16 to 25
TIMSS - Grade 7
TIMSS - Grade 8
SAIP93 - Age 13
SAIP97 - age 13
SAIP93 - Age 16
SAIP97 - Age 16
NF
NS
PE
NB
QU
ON
MN
SK
AB
BC
Figure 16-1. Inter-Provinicial Differences in Mathematics Scores
Years of Schooling
Provincial Differences in Mathematics Scores
Source: Vulnerable Children, J. D. Willms, UNB
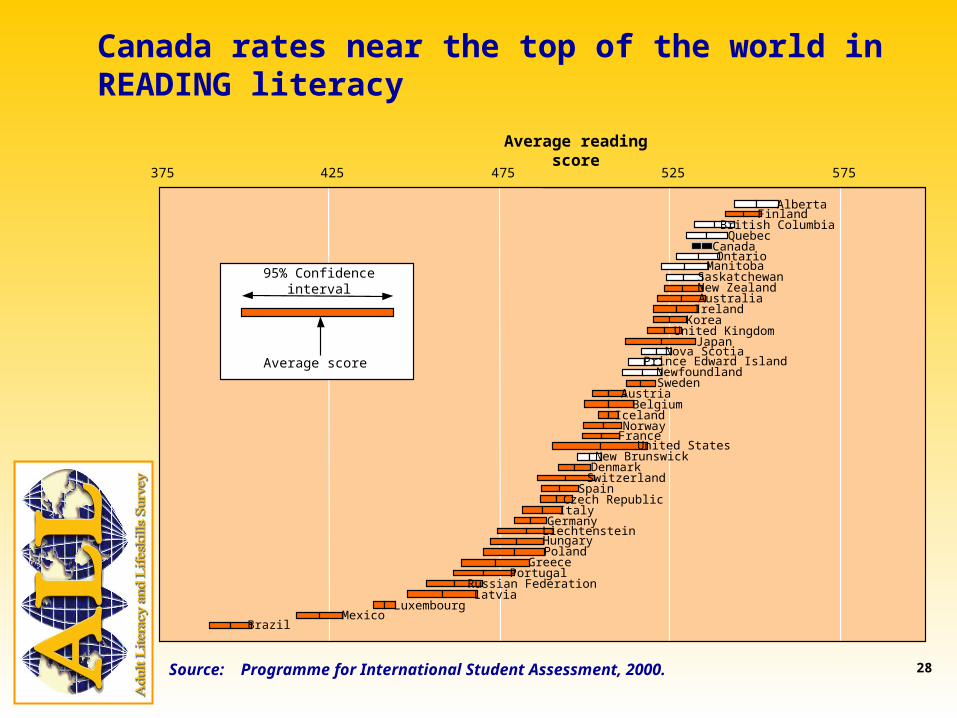
28Source: Programme for International Student Assessment, 2000.
Canada rates near the top of the world in READING literacy
FinlandBritish ColumbiaQuebec
CanadaOntario
ManitobaSaskatchewanNew ZealandAustralia
IrelandKorea
United KingdomJapan
Nova ScotiaPrince Edward IslandNewfoundlandSweden
AustriaBelgium
IcelandNorwayFrance
United StatesNew Brunswick
DenmarkSwitzerland
SpainCzech Republic
ItalyGermanyLiechtenstein
HungaryPoland
GreecePortugal
Russian FederationLatvia
LuxembourgMexico
Brazil
Alberta
375 425 475 525 575
95% Confidence interval
Average score
Average reading score
29
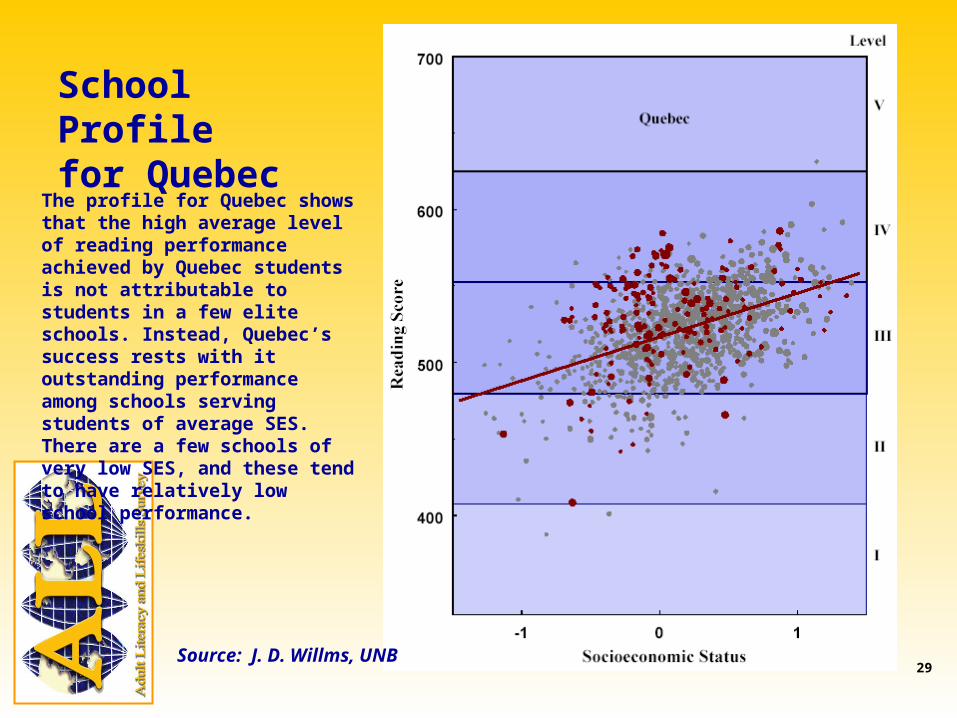
The profile for Quebec shows that the high average level of reading performance achieved by Quebec students is not attributable to students in a few elite schools. Instead, Quebec’s success rests with it outstanding performance among schools serving students of average SES. There are a few schools of very low SES, and these tend to have relatively low school performance.
School Profile for Quebec
Source: J. D. Willms, UNB
30
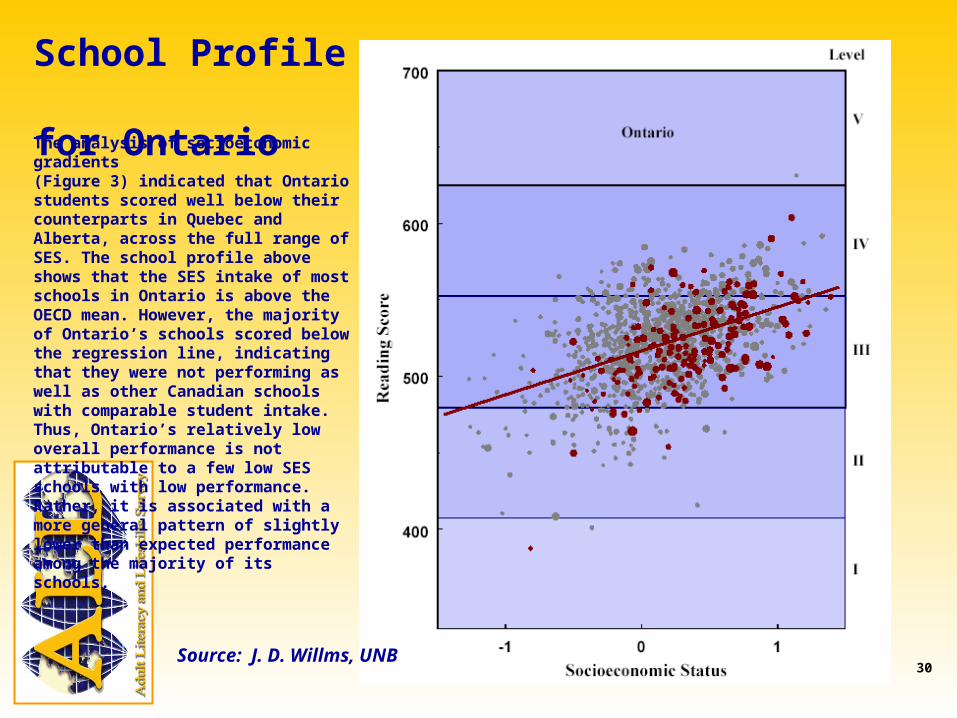
The analysis of socioeconomic gradients (Figure 3) indicated that Ontario students scored well below their counterparts in Quebec and Alberta, across the full range of SES. The school profile above shows that the SES intake of most schools in Ontario is above the OECD mean. However, the majority of Ontario’s schools scored below the regression line, indicating that they were not performing as well as other Canadian schools with comparable student intake. Thus, Ontario’s relatively low overall performance is not attributable to a few low SES schools with low performance. Rather, it is associated with a more general pattern of slightly lower than expected performance among the majority of its schools.
School Profile for Ontario
Source: J. D. Willms, UNB
31
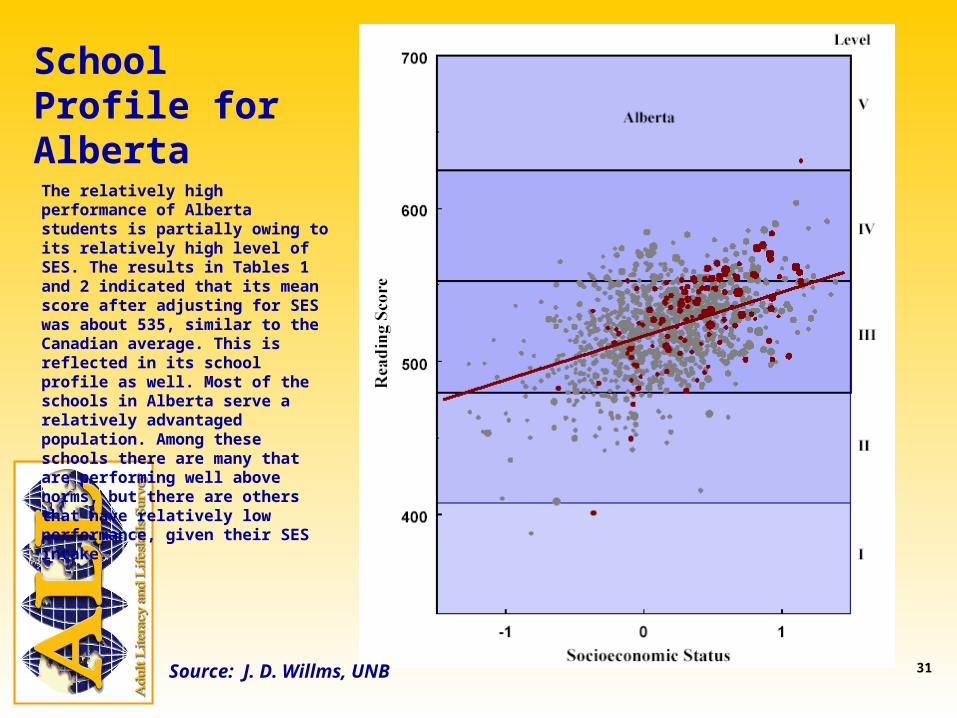
School Profile for Alberta
The relatively high performance of Alberta students is partially owing to its relatively high level of SES. The results in Tables 1 and 2 indicated that its mean score after adjusting for SES was about 535, similar to the Canadian average. This is reflected in its school profile as well. Most of the schools in Alberta serve a relatively advantaged population. Among these schools there are many that are performing well above norms, but there are others that have relatively low performance, given their SES intake.
Source: J. D. Willms, UNB
32
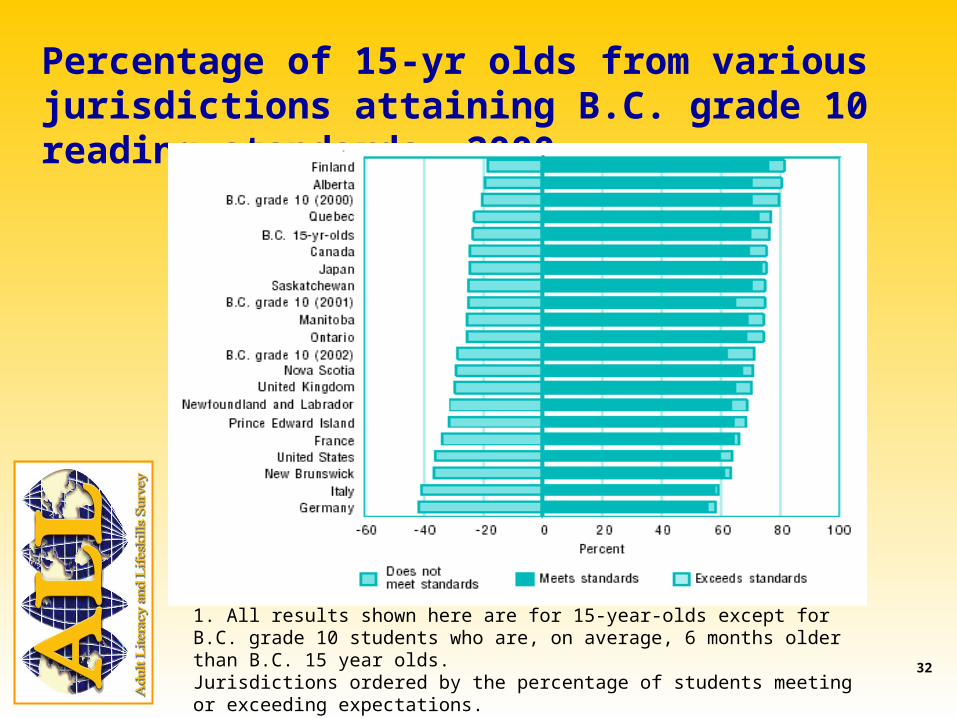
Percentage of 15-yr olds from various jurisdictions attaining B.C. grade 10 reading standards, 2000
1. All results shown here are for 15-year-olds except for B.C. grade 10 students who are, on average, 6 months older than B.C. 15 year olds.Jurisdictions ordered by the percentage of students meeting or exceeding expectations.Source: Table 6
33
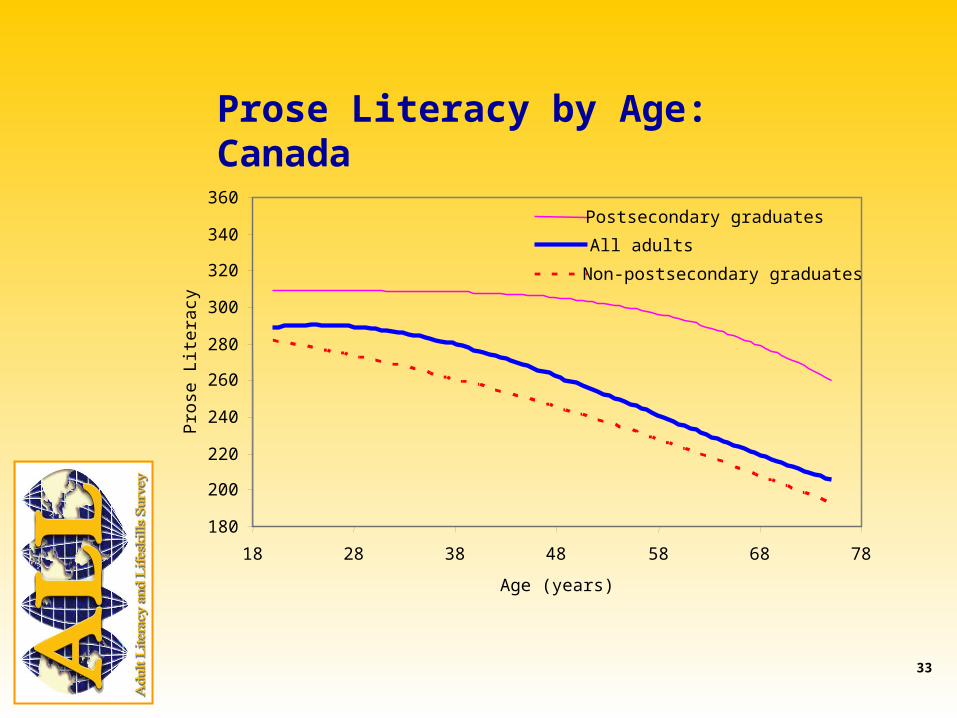
Prose Literacy by Age: Canada
180
200
220
240
260
280
300
320
340
360
18 28 38 48 58 68 78
Age (years)
Pro
se L
itera
cy
Postsecondary graduates
All adults
Non-postsecondary graduates
34
Products
• International comparative results December, 2004
• National report with provincial results June, 2005
• Thematic monographs on official language – minorities, immigrants, aboriginals, impact on individual and macro-economic performance model-based
• Literacy and numeracy estimates for small geographic areas (i.e. CSD’s and FEDS)
• Web-based tools for individual placement and diagnosis of learning needs
35
• Battery of clinical assessments administered to sub-sample of Level 1, Level 2 respondents:– PPVT (receptive vocabulary)
– TOWRE (word recognition)
– RAN (alphabetic awareness)
– PhonePass (speaking and listening)
– Digit Span (short term memory)
The ALL Level 1 studyThe ALL Level 1 study
• Designed to define clusters of problems and associated demographic profiles
• US data reveal interesting patterns of deficit
• Need $1,200,000 in 2004/05

36
The WES-Skill StudyThe WES-Skill Study
• Sample of firms selected to reflect different technologies of production, capital intensity and exposure to completion
• Document and numeracy test administered to sub-sample of workers in Workplace and Employees Survey
• Will reveal how firm characteristics interact with worker characteristics and skill to yield wage premia
• $3,800,000 required in 2004/05 or 2005/06
37
The IALS Locator TestThe IALS Locator Test
• Computer – administered and scored
• Places individuals at Level 1, 2 or 3+ on each of IALS scales
• Ideal for program triage
• $10/use