Embed Size (px)
Citation preview
1
LearnMet: Learning a Domain-Specific
Distance Metric for Graph MiningAparna S. Varde
Update on Ph.D. Research
CommitteeProf. Elke Rundensteiner (Advisor)
Prof. David Brown
Prof. Carolina Ruiz
Prof. Neil Heffernan
Prof. Richard Sisson Jr., CHTE (External Member)
2
Goal: To learn a distance metric for mining 2-D graphs incorporating domain semantics.
Purpose: To perform computational estimation.
Estimate graph obtained as a result of a scientific experiment given its input conditions and vice versa.
Assumptions: Training Set: Correct clusters of graphs in the domain over a subset of the data.
Some additional input from domain experts.
Introduction: Dissertation Sub-Problem
3
Domain Semantics in Graphs
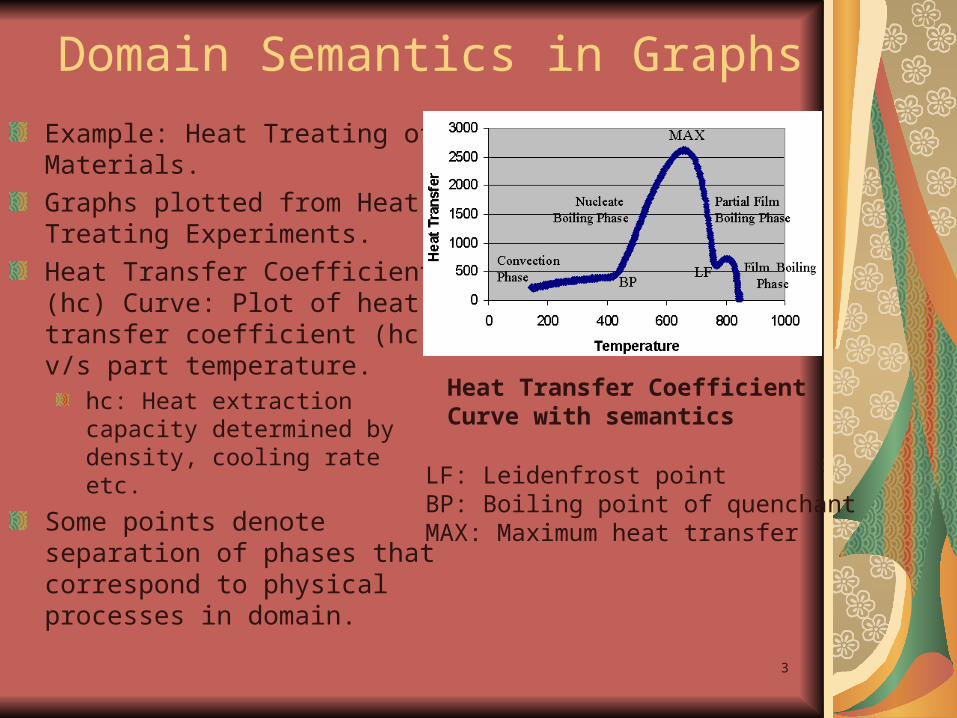
Example: Heat Treating of Materials.
Graphs plotted from Heat Treating Experiments.
Heat Transfer Coefficient (hc) Curve: Plot of heat transfer coefficient (hc) v/s part temperature.
hc: Heat extraction capacity determined by density, cooling rate etc.
Some points denote separation of phases that correspond to physical processes in domain.
Heat Transfer Coefficient Curve with semantics
LF: Leidenfrost pointBP: Boiling point of quenchantMAX: Maximum heat transfer
4
Motivation for Metric Learning
Notion of Similarity for Graphs:Distance between points.Default: Euclidean distance.May not accurately represent semantics.
Need to learn Distance Metric:To capture domain semantics in graphs for mining (clustering, building representatives, similarity searching).
5
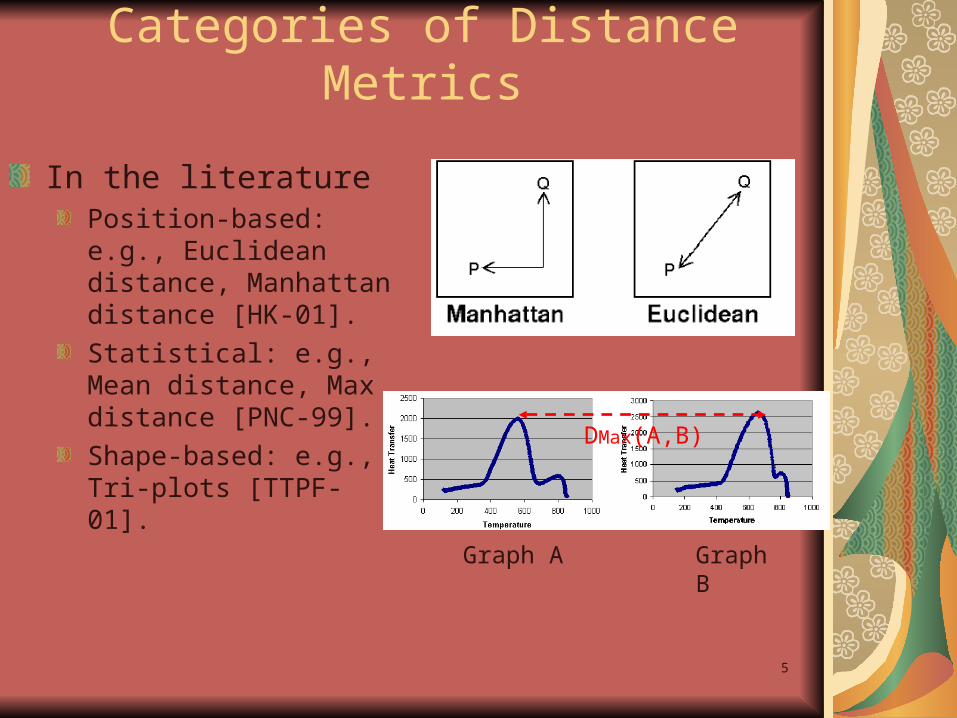
Categories of Distance Metrics
In the literaturePosition-based: e.g., Euclidean distance, Manhattan distance [HK-01].
Statistical: e.g., Mean distance, Max distance [PNC-99].
Shape-based: e.g., Tri-plots [TTPF-01].
DMax(A,B)
Graph A Graph B
6
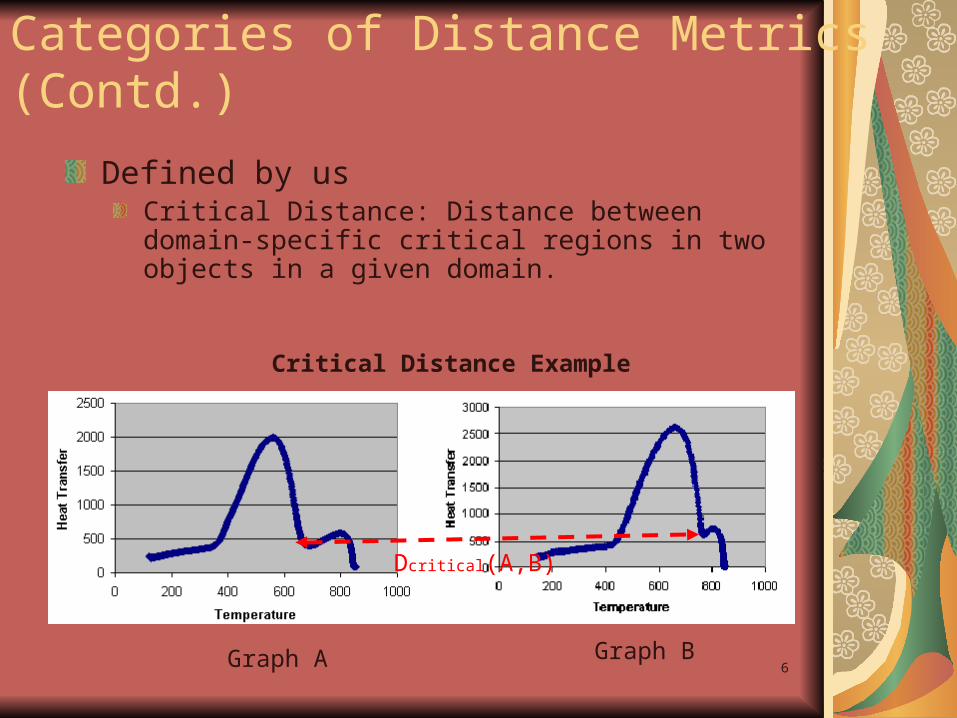
Categories of Distance Metrics (Contd.)
Defined by usCritical Distance: Distance between domain-specific critical regions in two objects in a given domain.
Dcritical(A,B)
Graph A Graph B
Critical Distance Example
7
Proposed Approach: LearnMet
Make intelligent guess for initial metric, use this as distance in clustering.
Keep refining metric after every round of clustering to minimize error in next round.
Stopping criterion: metric that corresponds to minimal error
in clustering, i.e., gives best clusters.
8
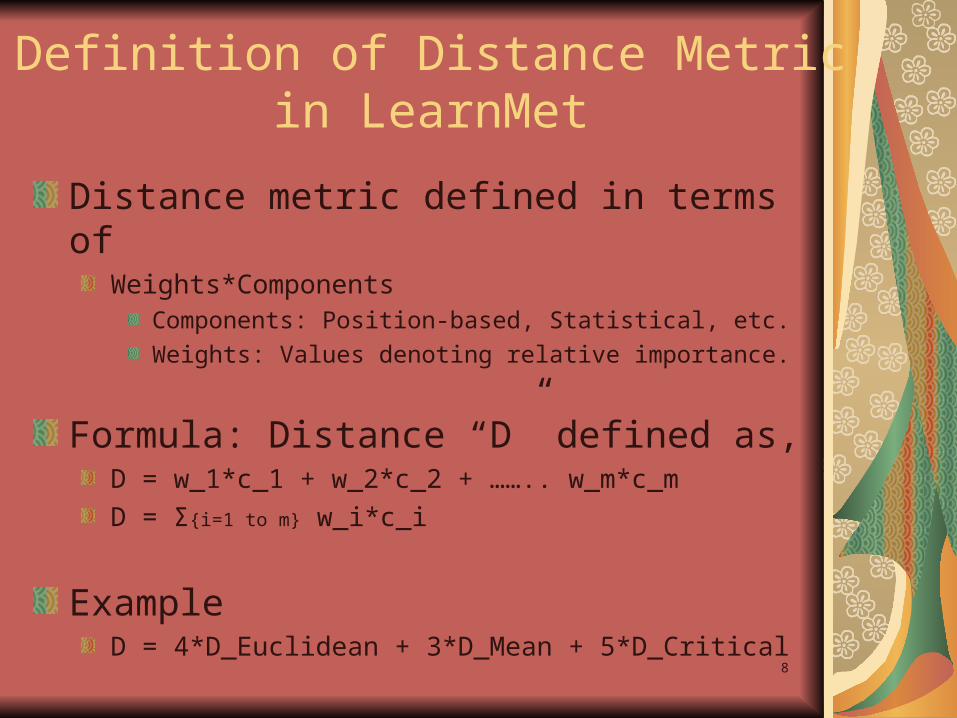
Distance metric defined in terms ofWeights*Components
Components: Position-based, Statistical, etc.
Weights: Values denoting relative importance.
Formula: Distance “D” defined as,D = w_1*c_1 + w_2*c_2 + …….. w_m*c_m
D = Σ{i=1 to m} w_i*c_i
ExampleD = 4*D_Euclidean + 3*D_Mean + 5*D_Critical
Definition of Distance Metric in LearnMet
9
Steps of LearnMet
1. Guess Initial Metric
2. Do Clustering with Metric
3. Evaluate Cluster Accuracy
4. Adjust and Re-execute Clustering/ Halt
5. Output Final Metric
10
1. Guess Initial MetricDomain-Specific Input:
Accept input from domain experts about:Distance Types applicable to the domain.
– E.g.: Euclidean, Mean, Critical.
Relative Importance of each type (subjective notion).– E.g., Critical distance more important than Mean distance.
Heuristic: Assign initial components based on distance types applicable to the domain.If additional input about relative importance of components available then use that to assign weights.Else assign equal weights to all components.
Thus guess the initial metric, D = 5*D_Euclidean + 3*D_Mean + 4*D_Critical
11
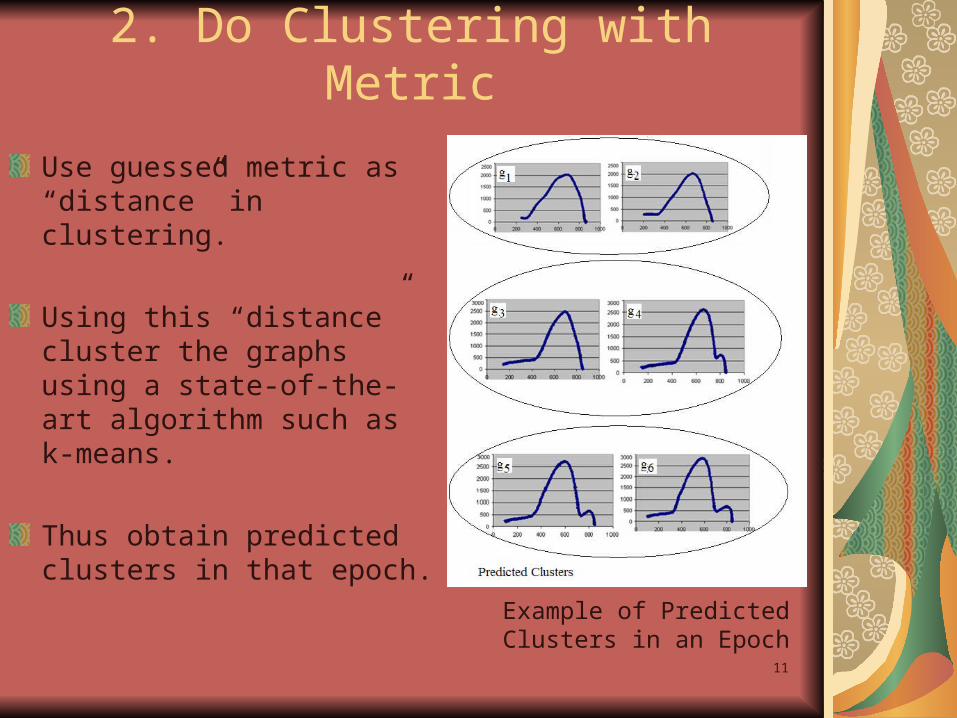
2. Do Clustering with Metric
Use guessed metric as “distance” in clustering.
Using this “distance” cluster the graphs using a state-of-the-art algorithm such as k-means.
Thus obtain predicted clusters in that epoch.
Example of Predicted Clusters in an Epoch
12
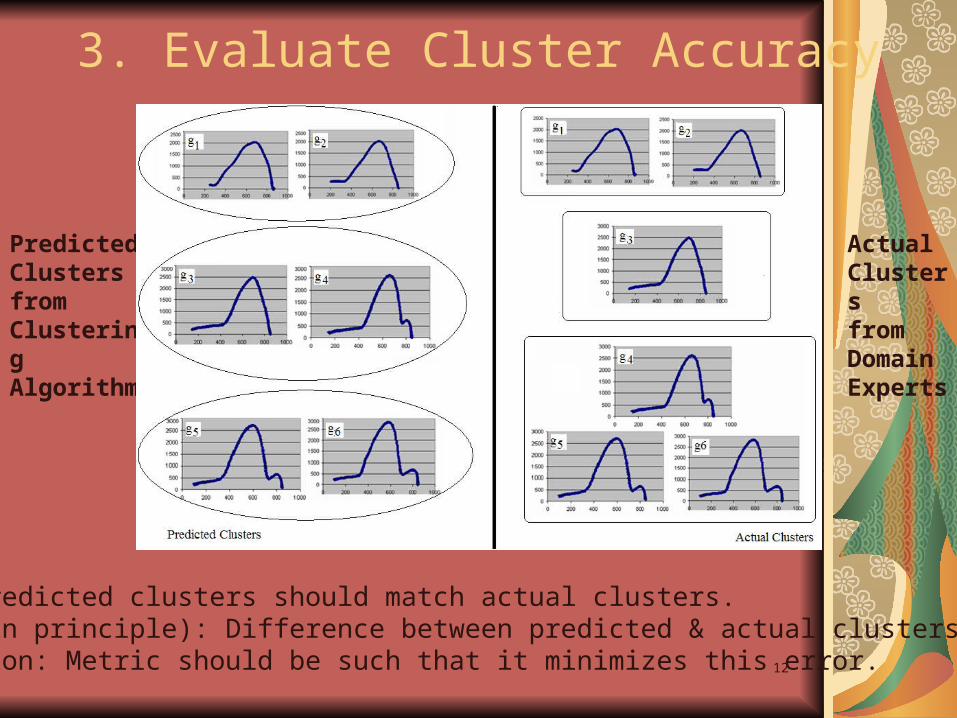
3. Evaluate Cluster Accuracy
PredictedClustersfromClusteringAlgorithm
Actual Clustersfrom Domain Experts
• Goal: Predicted clusters should match actual clusters.• Error (in principle): Difference between predicted & actual clusters.• Evaluation: Metric should be such that it minimizes this error.
13
3. Evaluate Cluster Accuracy (Contd.)
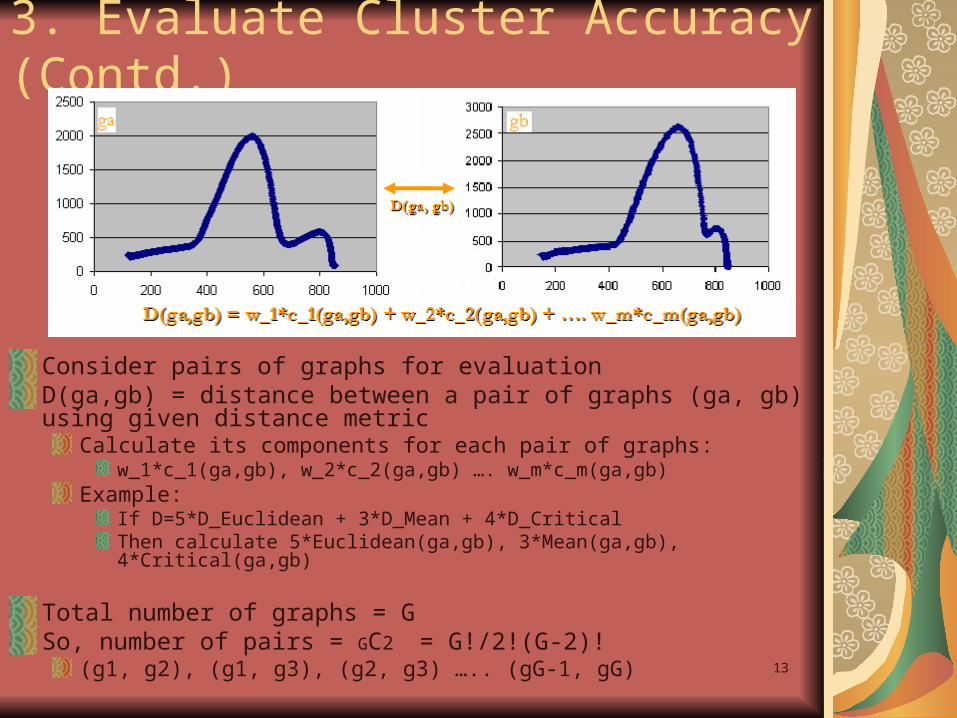
Consider pairs of graphs for evaluationD(ga,gb) = distance between a pair of graphs (ga, gb) using given distance metric
Calculate its components for each pair of graphs: w_1*c_1(ga,gb), w_2*c_2(ga,gb) …. w_m*c_m(ga,gb)
Example: If D=5*D_Euclidean + 3*D_Mean + 4*D_Critical Then calculate 5*Euclidean(ga,gb), 3*Mean(ga,gb), 4*Critical(ga,gb)
Total number of graphs = GSo, number of pairs = GC2 = G!/2!(G-2)!
(g1, g2), (g1, g3), (g2, g3) ….. (gG-1, gG)
14
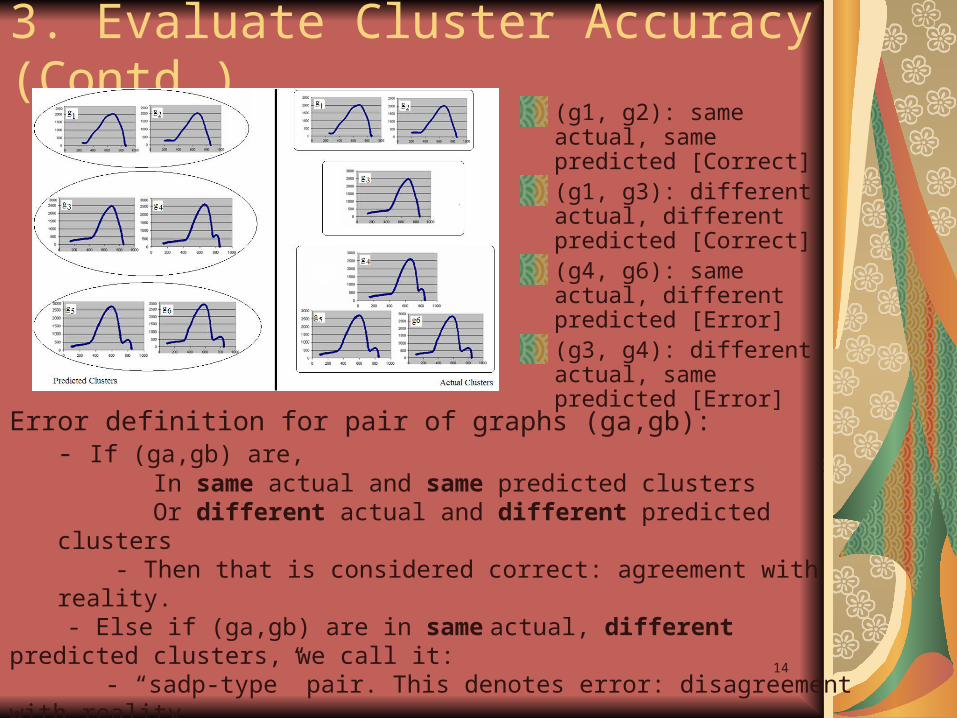
3. Evaluate Cluster Accuracy (Contd.)(g1, g2): same actual, same predicted [Correct](g1, g3): different actual, different predicted [Correct](g4, g6): same actual, different predicted [Error](g3, g4): different actual, same predicted [Error]
Error definition for pair of graphs (ga,gb): - If (ga,gb) are,
In same actual and same predicted clustersOr different actual and different predicted clusters
- Then that is considered correct: agreement with reality. - Else if (ga,gb) are in same actual, different predicted clusters, we call it:
- “sadp-type” pair. This denotes error: disagreement with reality. - Else if (ga,gb) are in different actual, same predicted clusters, we call it:
- “dasp-type” pair. This denotes error: disagreement with reality.
15
3. Evaluate Cluster Accuracy (Contd.)
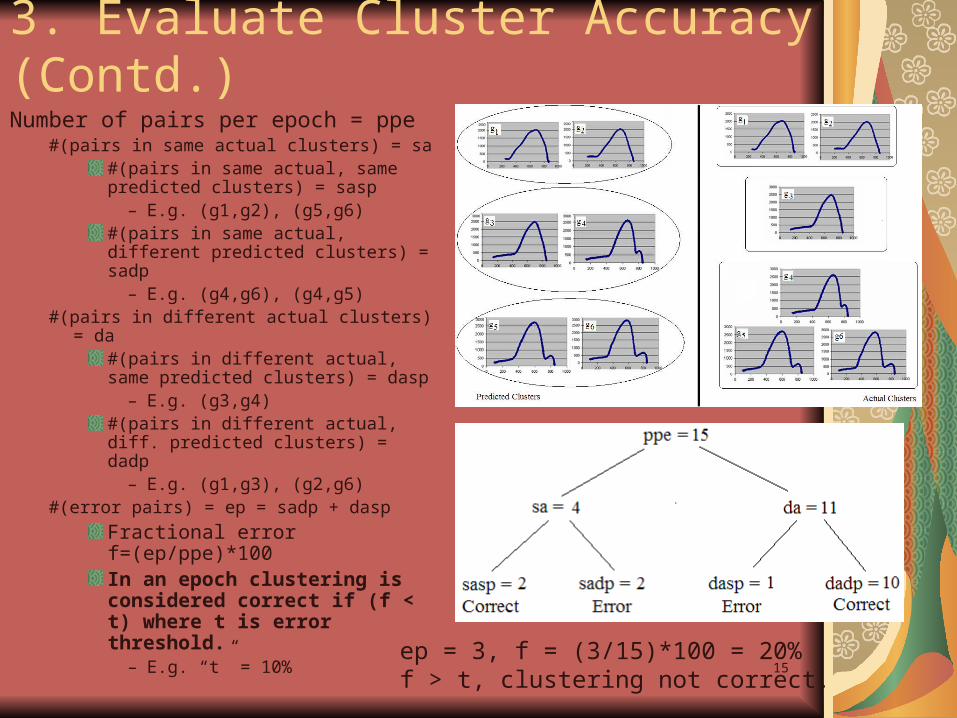
Number of pairs per epoch = ppe#(pairs in same actual clusters) = sa
#(pairs in same actual, same predicted clusters) = sasp
– E.g. (g1,g2), (g5,g6)#(pairs in same actual, different predicted clusters) = sadp
– E.g. (g4,g6), (g4,g5)#(pairs in different actual clusters) = da
#(pairs in different actual, same predicted clusters) = dasp
– E.g. (g3,g4)#(pairs in different actual, diff. predicted clusters) = dadp
– E.g. (g1,g3), (g2,g6)#(error pairs) = ep = sadp + dasp
Fractional error f=(ep/ppe)*100In an epoch clustering is considered correct if (f < t) where t is error threshold.
– E.g. “t” = 10%
ep = 3, f = (3/15)*100 = 20%f > t, clustering not correct.
16
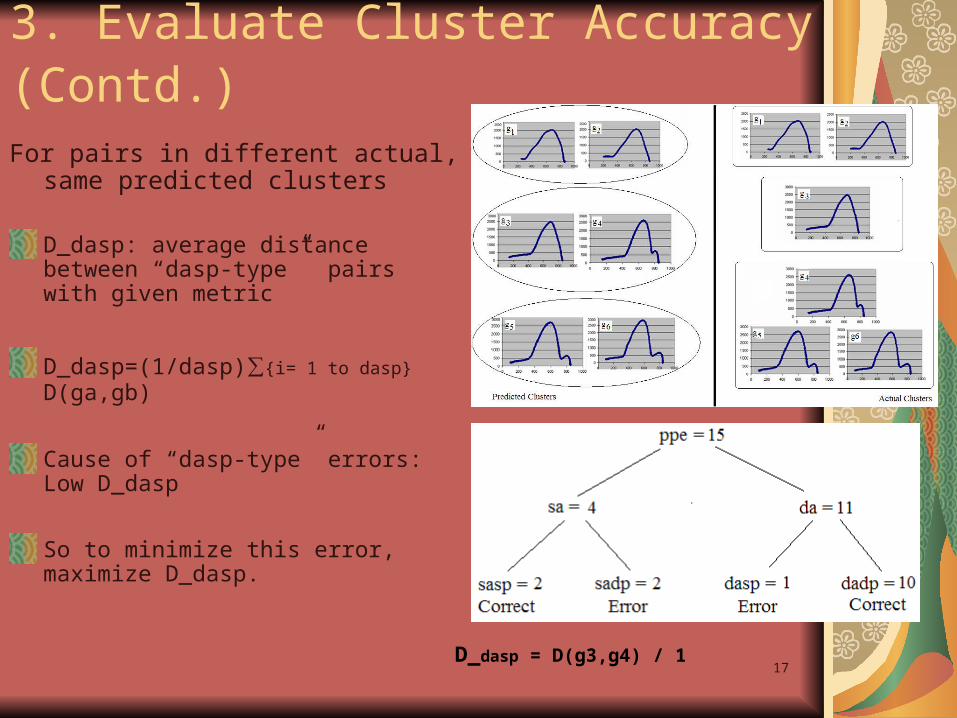
3. Evaluate Cluster Accuracy (Contd.)
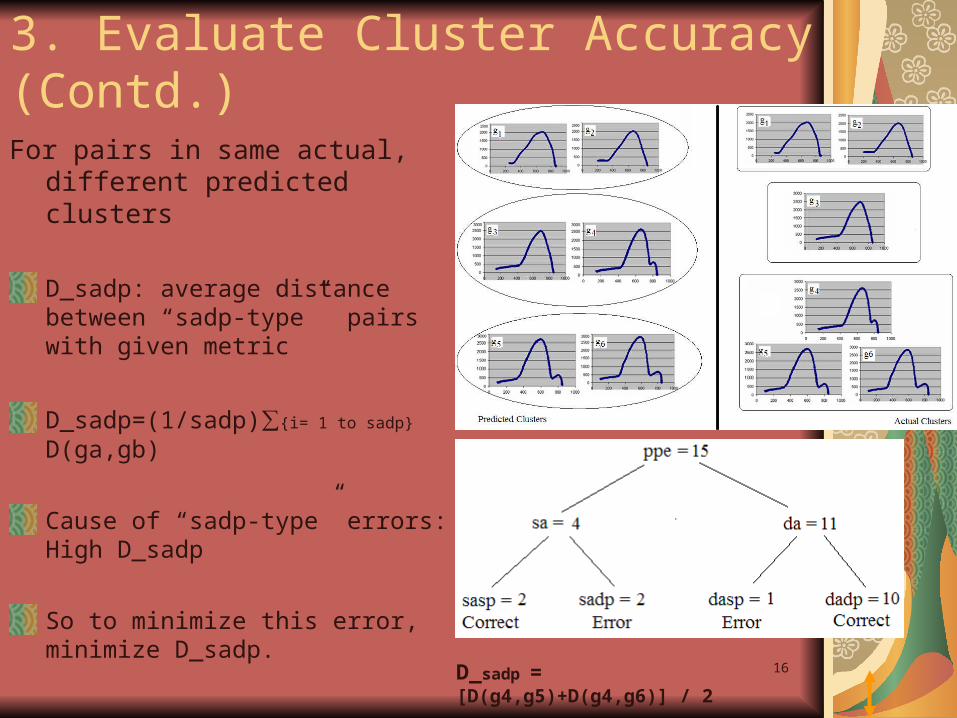
For pairs in same actual, different predicted clusters
D_sadp: average distance between “sadp-type” pairs with given metric
D_sadp=(1/sadp)∑{i= 1 to sadp} D(ga,gb)
Cause of “sadp-type” errors: High D_sadp
So to minimize this error, minimize D_sadp.
D_sadp = [D(g4,g5)+D(g4,g6)] / 2
17
3. Evaluate Cluster Accuracy (Contd.)
For pairs in different actual, same predicted clusters
D_dasp: average distance between “dasp-type” pairs with given metric
D_dasp=(1/dasp)∑{i= 1 to dasp} D(ga,gb)
Cause of “dasp-type” errors: Low D_dasp
So to minimize this error, maximize D_dasp.
D_dasp = D(g3,g4) / 1
18
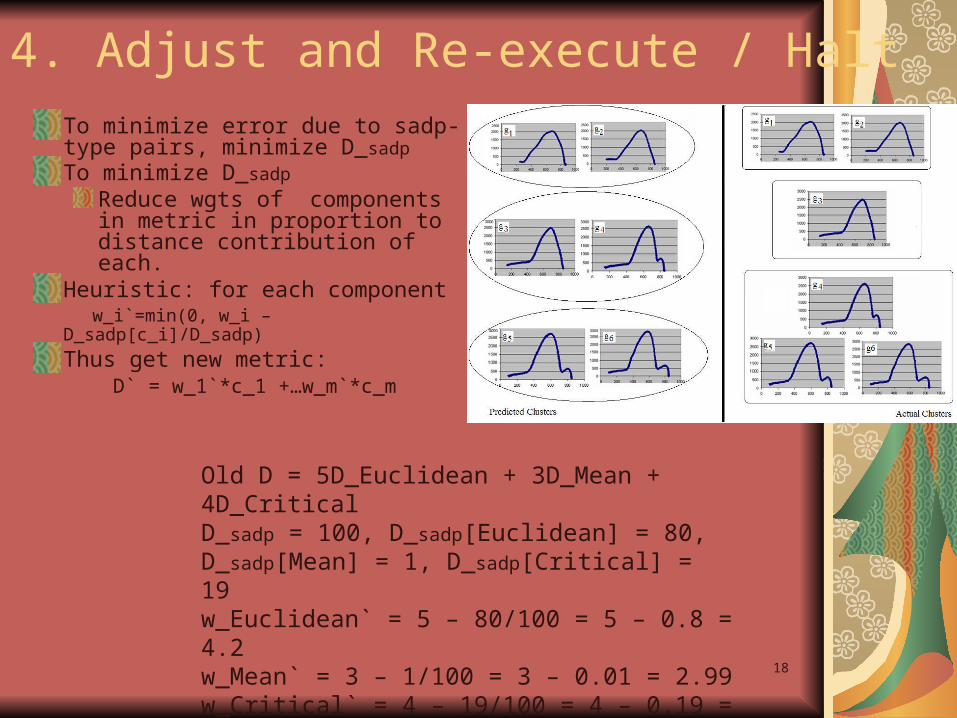
4. Adjust and Re-execute / Halt
To minimize error due to sadp-type pairs, minimize D_sadp
To minimize D_sadp
Reduce wgts of components in metric in proportion to distance contribution of each.
Heuristic: for each component w_i`=min(0, w_i – D_sadp[c_i]/D_sadp)
Thus get new metric: D` = w_1`*c_1 +…w_m`*c_m
Old D = 5D_Euclidean + 3D_Mean + 4D_CriticalD_sadp = 100, D_sadp[Euclidean] = 80, D_sadp[Mean] = 1, D_sadp[Critical] = 19w_Euclidean` = 5 – 80/100 = 5 – 0.8 = 4.2w_Mean` = 3 – 1/100 = 3 – 0.01 = 2.99w_Critical` = 4 – 19/100 = 4 – 0.19 = 3.81 D`=4.2D_Euclidean+2.99D_Mean+3.81D_Critical
19
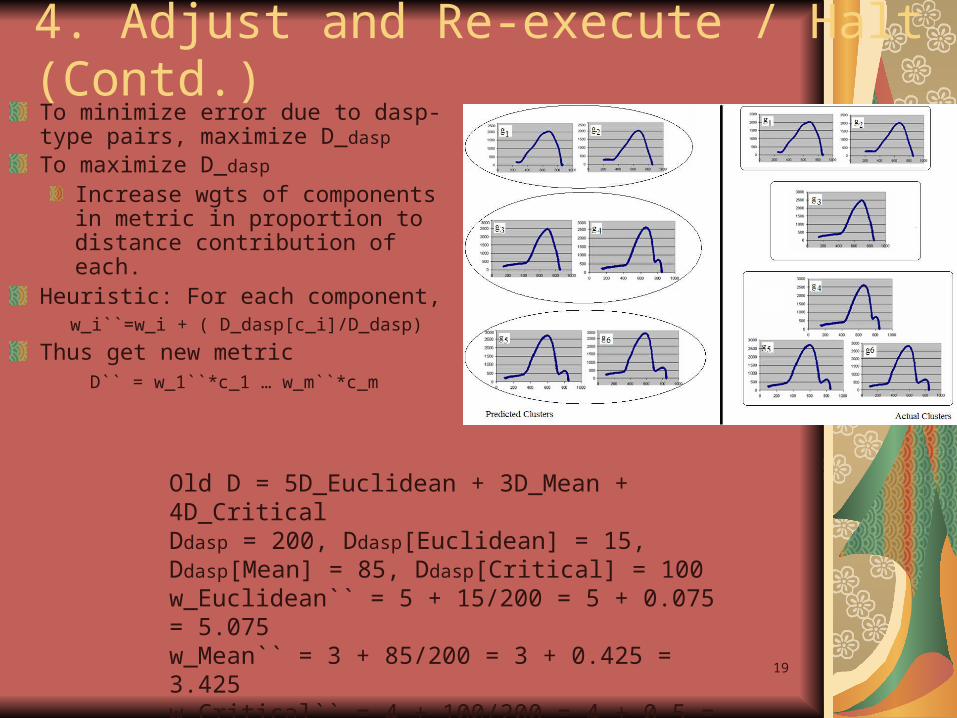
4. Adjust and Re-execute / Halt (Contd.)To minimize error due to dasp-type pairs, maximize D_dasp
To maximize D_dasp
Increase wgts of components in metric in proportion to distance contribution of each.
Heuristic: For each component, w_i``=w_i + ( D_dasp[c_i]/D_dasp)
Thus get new metric D`` = w_1``*c_1 … w_m``*c_m
Old D = 5D_Euclidean + 3D_Mean + 4D_CriticalDdasp = 200, Ddasp[Euclidean] = 15, Ddasp[Mean] = 85, Ddasp[Critical] = 100w_Euclidean`` = 5 + 15/200 = 5 + 0.075 = 5.075w_Mean`` = 3 + 85/200 = 3 + 0.425 = 3.425w_Critical`` = 4 + 100/200 = 4 + 0.5 = 4.5D``=5.075D_Euclidean+3.425D_Mean+4.5D_Critical
20
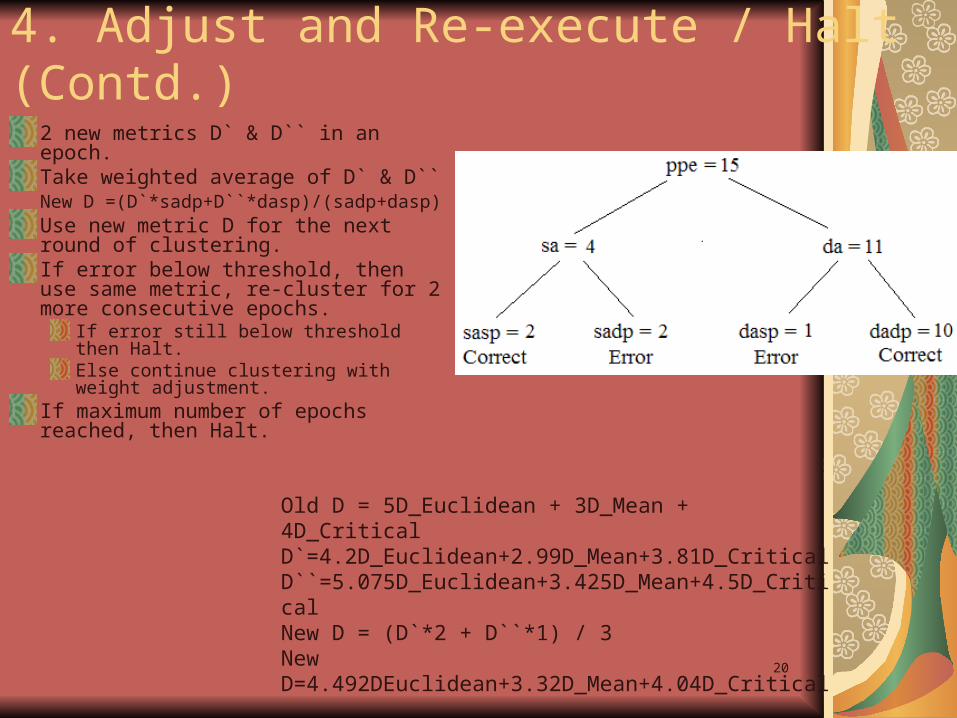
4. Adjust and Re-execute / Halt (Contd.)
2 new metrics D` & D`` in an epoch.Take weighted average of D` & D``New D =(D`*sadp+D``*dasp)/(sadp+dasp)Use new metric D for the next round of clustering.If error below threshold, then use same metric, re-cluster for 2 more consecutive epochs.
If error still below threshold then Halt.Else continue clustering with weight adjustment.
If maximum number of epochs reached, then Halt.
Old D = 5D_Euclidean + 3D_Mean + 4D_Critical D`=4.2D_Euclidean+2.99D_Mean+3.81D_CriticalD``=5.075D_Euclidean+3.425D_Mean+4.5D_CriticalNew D = (D`*2 + D``*1) / 3New D=4.492DEuclidean+3.32D_Mean+4.04D_Critical
21
5. Output Final Metric
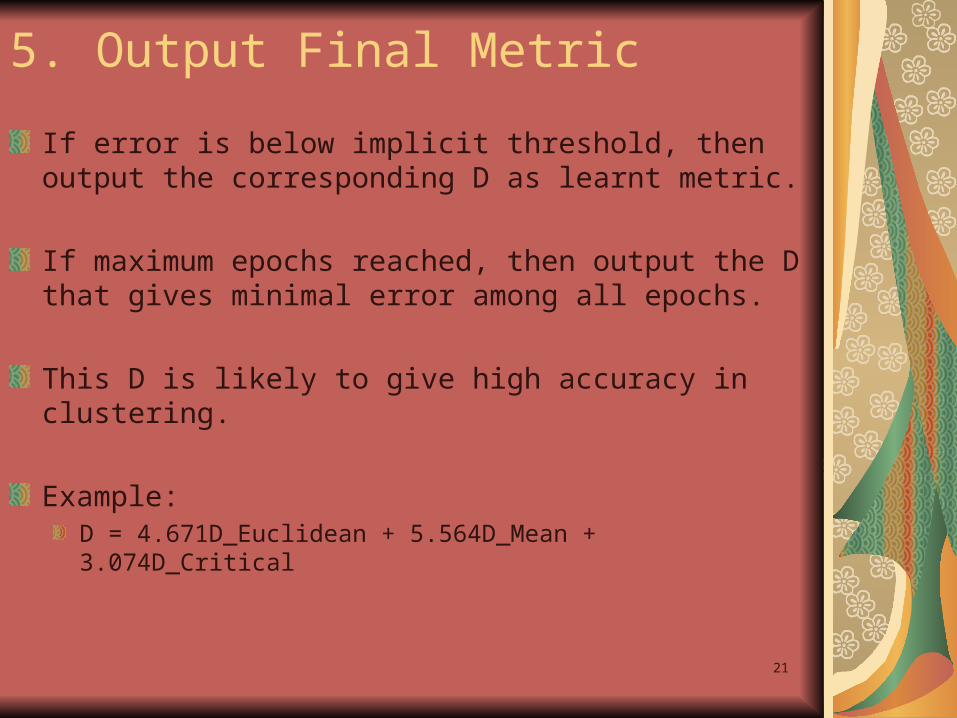
If error is below implicit threshold, then output the corresponding D as learnt metric.
If maximum epochs reached, then output the D that gives minimal error among all epochs.
This D is likely to give high accuracy in clustering.
Example: D = 4.671D_Euclidean + 5.564D_Mean + 3.074D_Critical
22
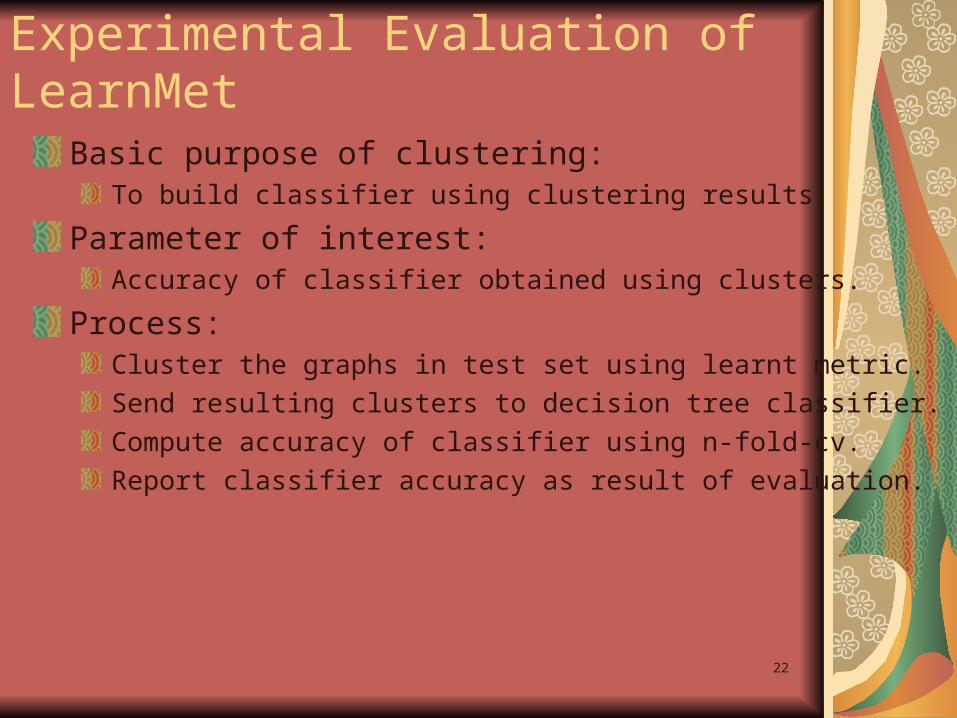
Experimental Evaluation of LearnMet
Basic purpose of clustering: To build classifier using clustering results.
Parameter of interest: Accuracy of classifier obtained using clusters.
Process:Cluster the graphs in test set using learnt metric.
Send resulting clusters to decision tree classifier.
Compute accuracy of classifier using n-fold-cv.
Report classifier accuracy as result of evaluation.
23
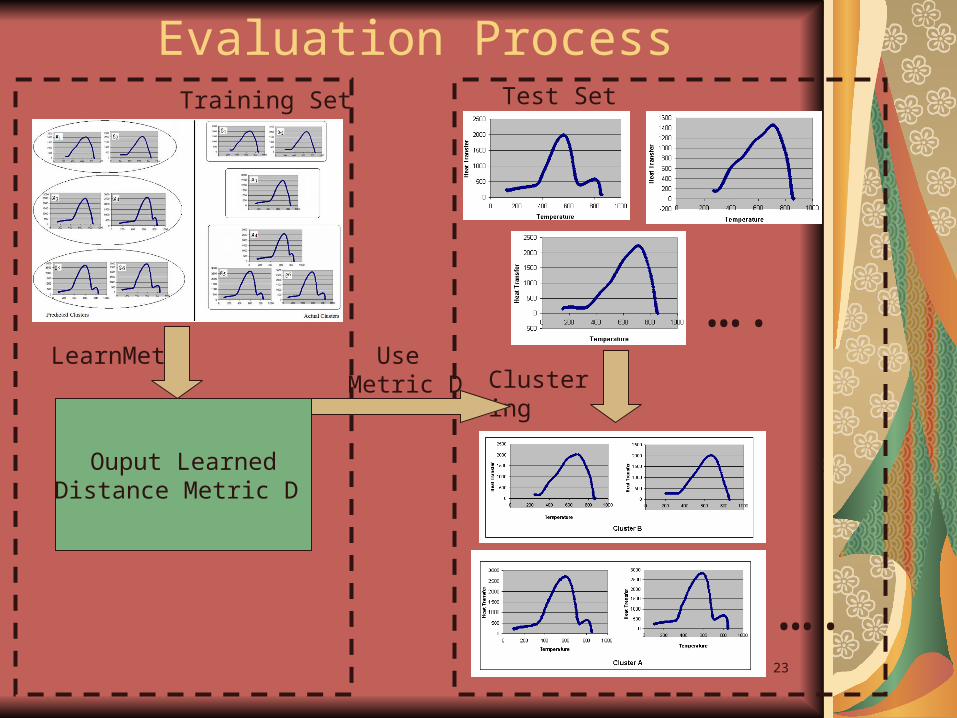
Evaluation Process
Clustering
….
Ouput LearnedDistance Metric D
LearnMet
Training Set
Use Metric D
Test Set
….
24
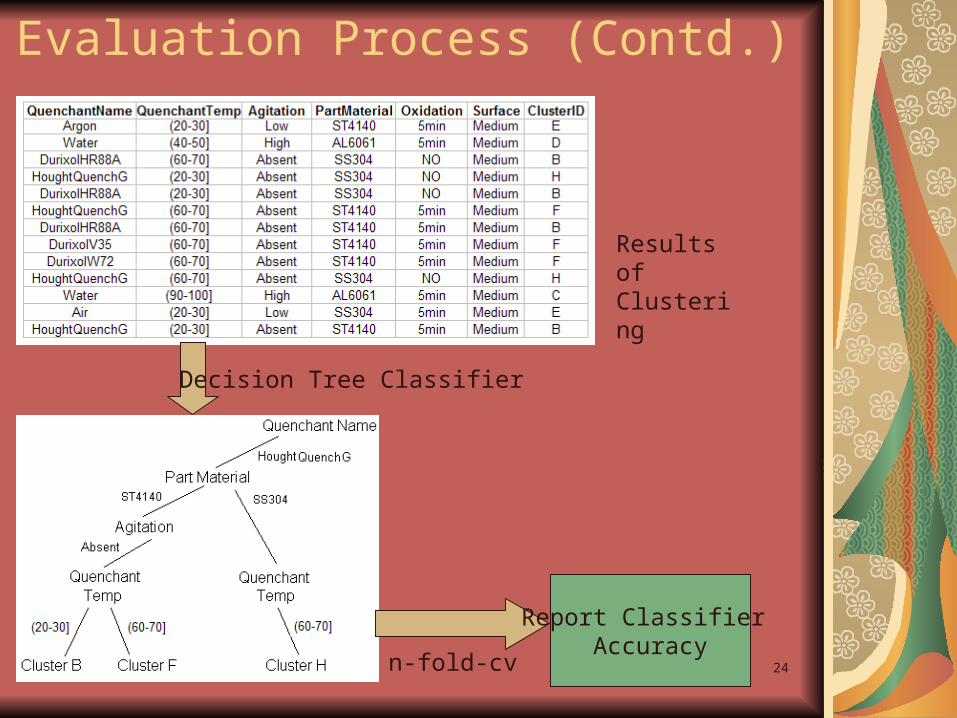
Evaluation Process (Contd.)
Results of Clustering
Decision Tree Classifier
Report Classifier Accuracy
n-fold-cv
25
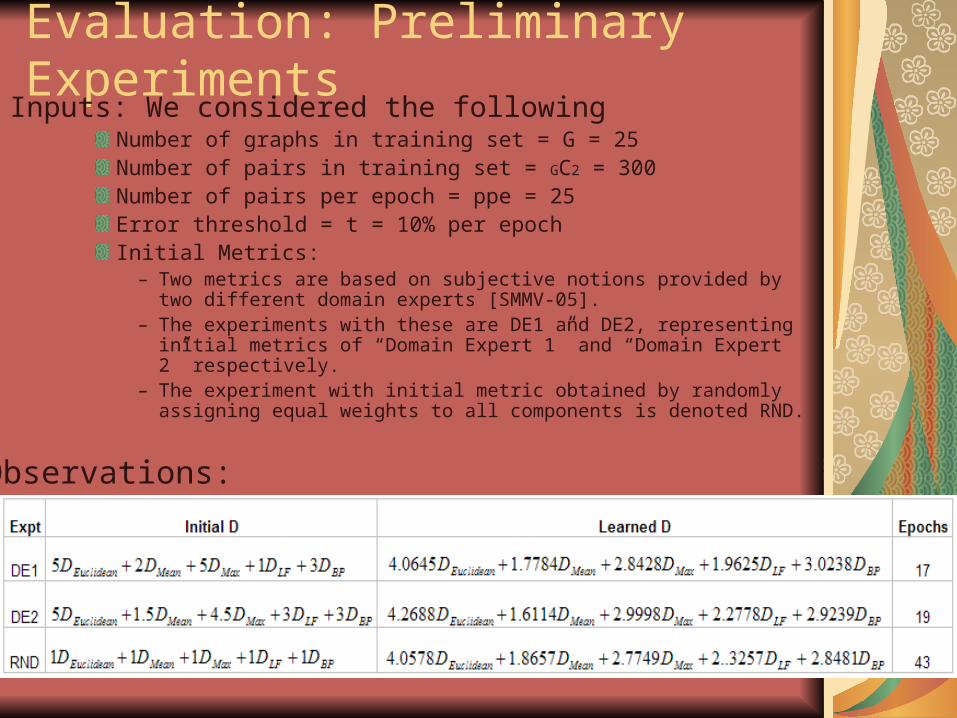
Evaluation: Preliminary ExperimentsInputs: We considered the following
Number of graphs in training set = G = 25Number of pairs in training set = GC2 = 300Number of pairs per epoch = ppe = 25Error threshold = t = 10% per epochInitial Metrics:
– Two metrics are based on subjective notions provided by two different domain experts [SMMV-05].
– The experiments with these are DE1 and DE2, representing initial metrics of “Domain Expert 1” and “Domain Expert 2” respectively.
– The experiment with initial metric obtained by randomly assigning equal weights to all components is denoted RND.
Observations:
26
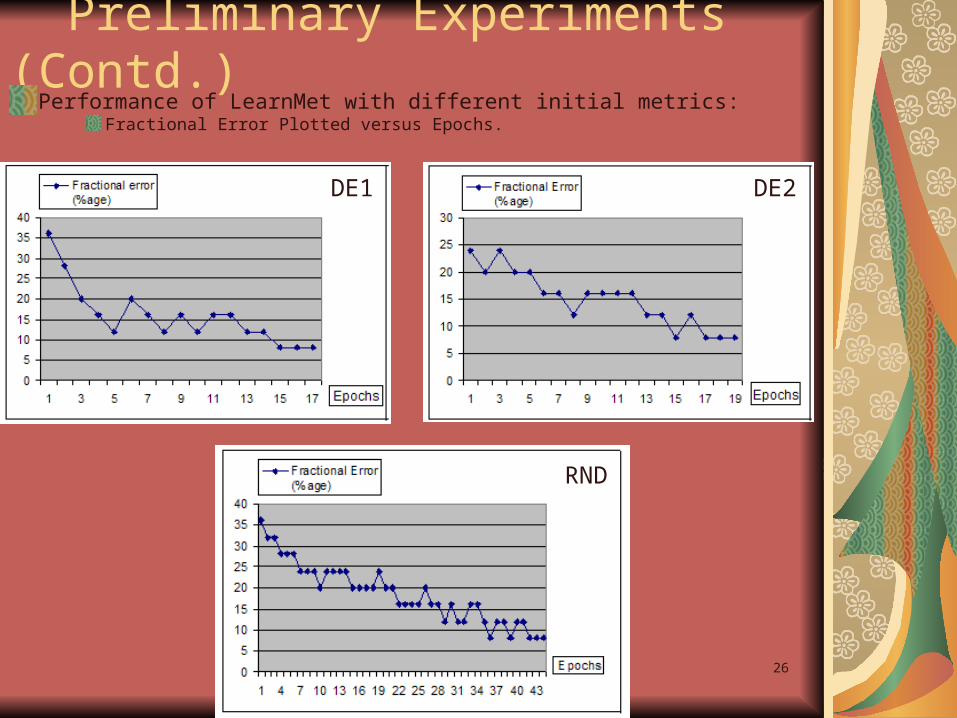
Preliminary Experiments (Contd.)Performance of LearnMet with different initial metrics:
Fractional Error Plotted versus Epochs.
DE1 DE2
RND
27
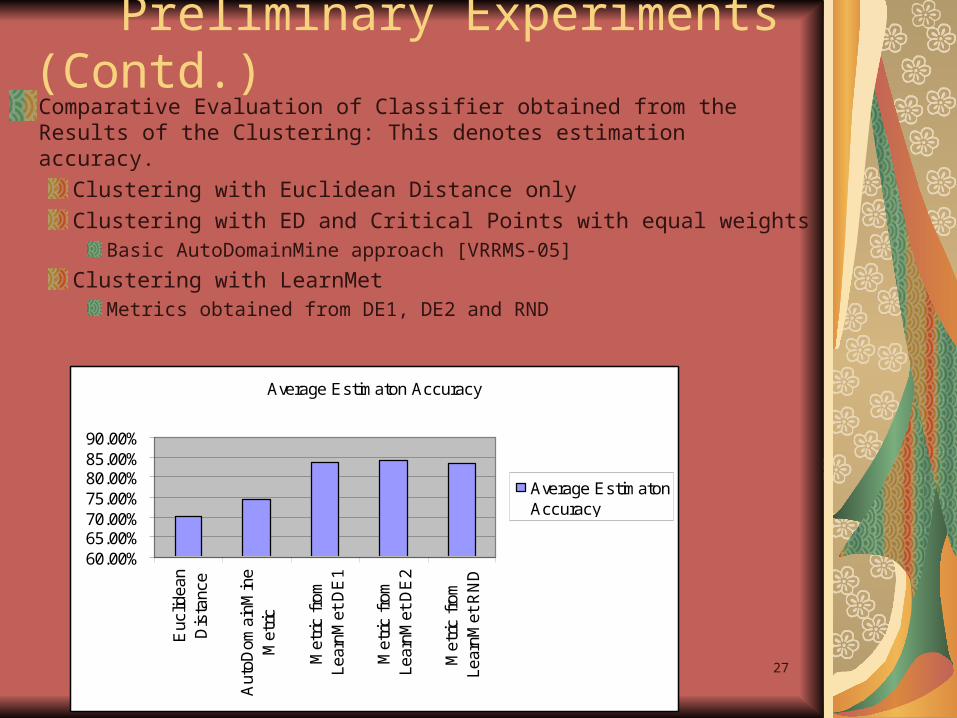
Preliminary Experiments (Contd.)Comparative Evaluation of Classifier obtained from the Results of the Clustering: This denotes estimation accuracy.
Clustering with Euclidean Distance only
Clustering with ED and Critical Points with equal weights Basic AutoDomainMine approach [VRRMS-05]
Clustering with LearnMet Metrics obtained from DE1, DE2 and RND
Average Estimaton Accuracy
60.00%65.00%70.00%75.00%80.00%85.00%90.00%
Euc
lidea
nD
ista
nce
Aut
oDom
ainM
ine
Met
ric
Met
ric f
rom
Lear
nMet
DE
1
Met
ric f
rom
Lear
nMet
DE
2
Met
ric f
rom
Lear
nMet
RN
DAverage EstimatonAccuracy
28
Ongoing Research
Effect of pairs per epochTo determine a good value for “ppe” that maximizes accuracy and efficiency of learning.
Effect of number of componentsIf domain experts do not specify which components are applicable to the graph, find the combinations of components that would be best to use in the metric.
Effect of scaling factors in weight adjustmentConsider different scaling factors for different components depending on distance type.
This is likely to enhance weight adjustment for better performance.
29
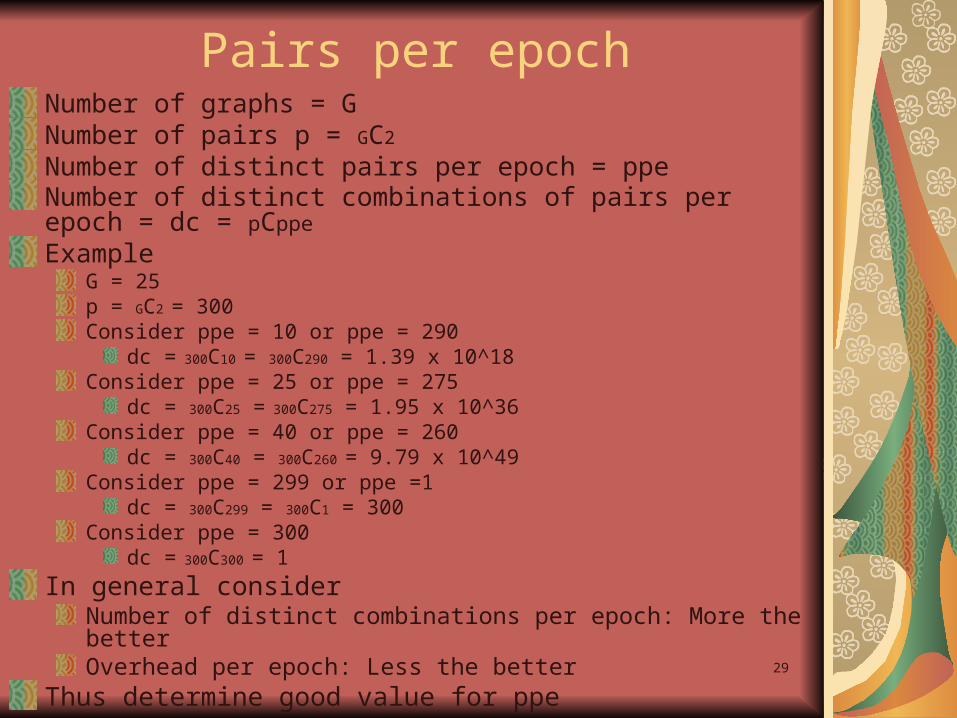
Pairs per epochNumber of graphs = GNumber of pairs p = GC2 Number of distinct pairs per epoch = ppeNumber of distinct combinations of pairs per epoch = dc = pCppe
ExampleG = 25p = GC2 = 300Consider ppe = 10 or ppe = 290
dc = 300C10 = 300C290 = 1.39 x 10^18Consider ppe = 25 or ppe = 275
dc = 300C25 = 300C275 = 1.95 x 10^36Consider ppe = 40 or ppe = 260
dc = 300C40 = 300C260 = 9.79 x 10^49Consider ppe = 299 or ppe =1
dc = 300C299 = 300C1 = 300Consider ppe = 300
dc = 300C300 = 1
In general considerNumber of distinct combinations per epoch: More the betterOverhead per epoch: Less the better
Thus determine good value for ppe
30
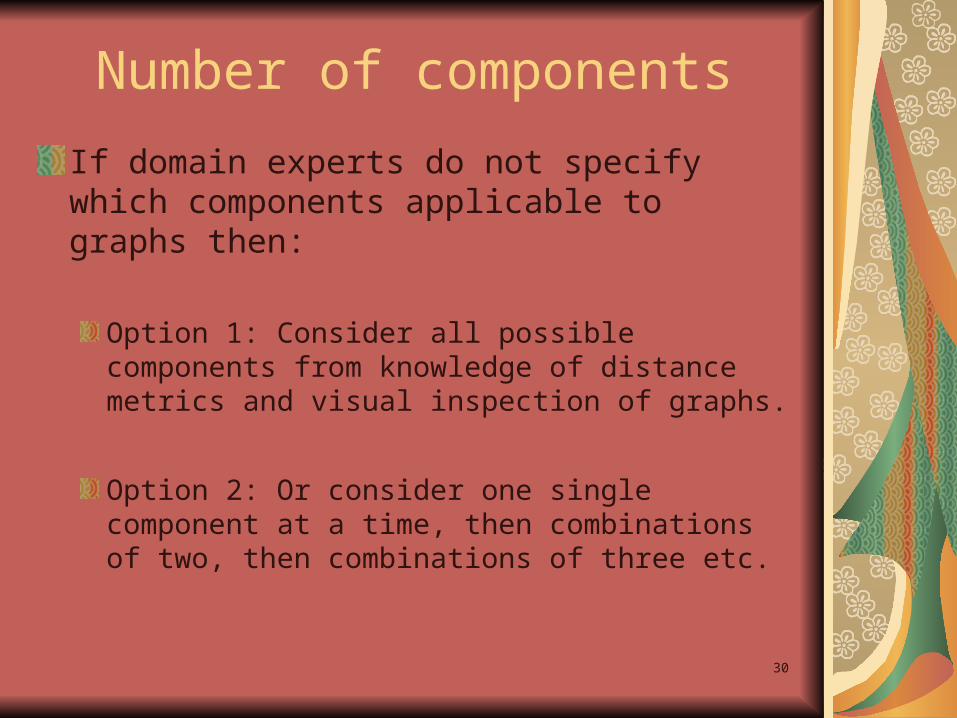
Number of components
If domain experts do not specify which components applicable to graphs then:
Option 1: Consider all possible components from knowledge of distance metrics and visual inspection of graphs.
Option 2: Or consider one single component at a time, then combinations of two, then combinations of three etc.
31
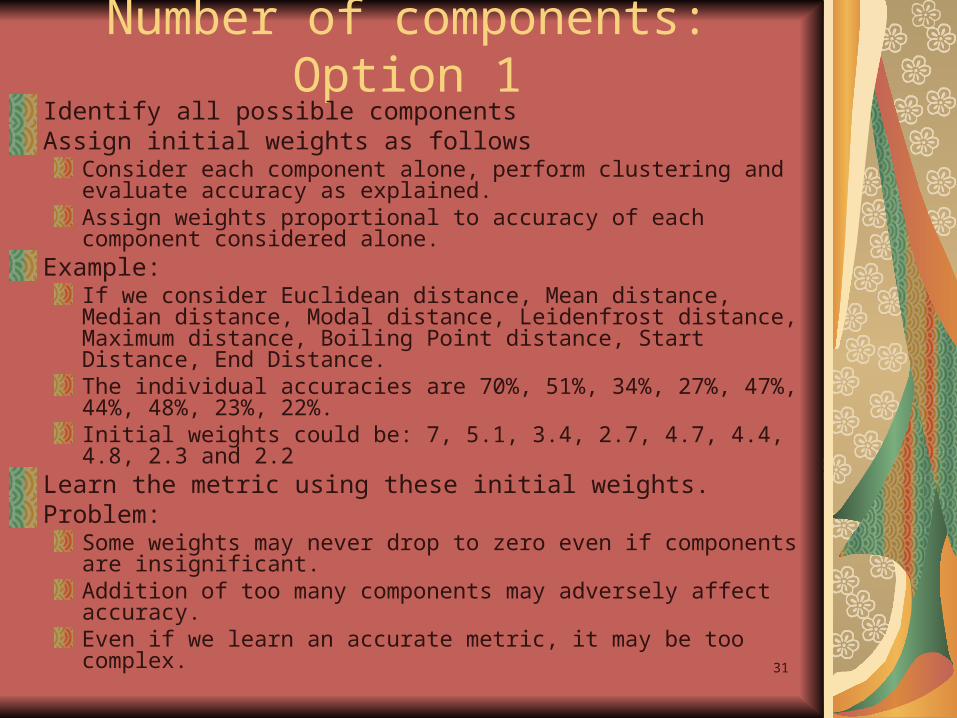
Number of components: Option 1Identify all possible componentsAssign initial weights as follows
Consider each component alone, perform clustering and evaluate accuracy as explained.Assign weights proportional to accuracy of each component considered alone.
Example: If we consider Euclidean distance, Mean distance, Median distance, Modal distance, Leidenfrost distance, Maximum distance, Boiling Point distance, Start Distance, End Distance. The individual accuracies are 70%, 51%, 34%, 27%, 47%, 44%, 48%, 23%, 22%. Initial weights could be: 7, 5.1, 3.4, 2.7, 4.7, 4.4, 4.8, 2.3 and 2.2
Learn the metric using these initial weights.Problem:
Some weights may never drop to zero even if components are insignificant. Addition of too many components may adversely affect accuracy. Even if we learn an accurate metric, it may be too complex.
32
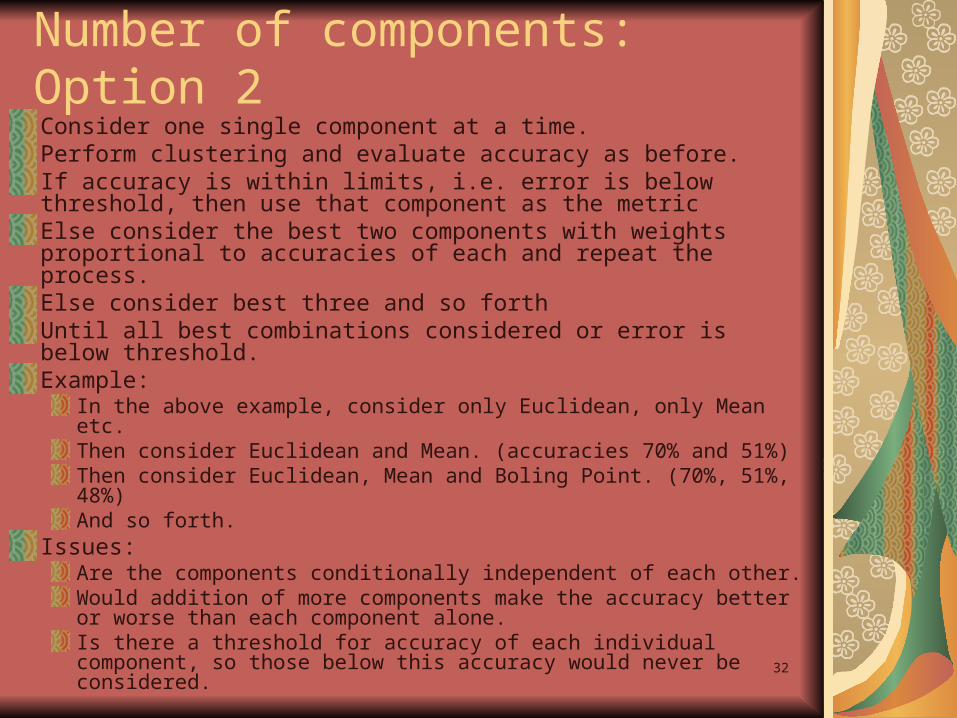
Number of components: Option 2Consider one single component at a time.Perform clustering and evaluate accuracy as before.If accuracy is within limits, i.e. error is below threshold, then use that component as the metricElse consider the best two components with weights proportional to accuracies of each and repeat the process.Else consider best three and so forthUntil all best combinations considered or error is below threshold.Example:
In the above example, consider only Euclidean, only Mean etc.Then consider Euclidean and Mean. (accuracies 70% and 51%)Then consider Euclidean, Mean and Boling Point. (70%, 51%, 48%)And so forth.
Issues: Are the components conditionally independent of each other. Would addition of more components make the accuracy better or worse than each component alone. Is there a threshold for accuracy of each individual component, so those below this accuracy would never be considered.
33
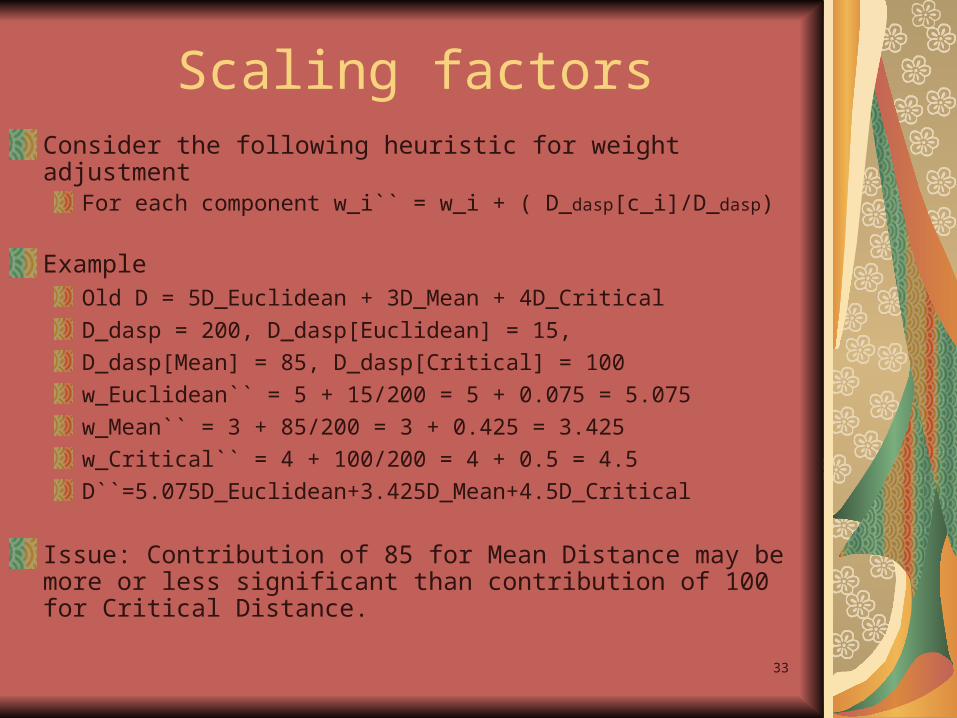
Scaling factorsConsider the following heuristic for weight adjustment
For each component w_i`` = w_i + ( D_dasp[c_i]/D_dasp)
ExampleOld D = 5D_Euclidean + 3D_Mean + 4D_Critical
D_dasp = 200, D_dasp[Euclidean] = 15,
D_dasp[Mean] = 85, D_dasp[Critical] = 100
w_Euclidean`` = 5 + 15/200 = 5 + 0.075 = 5.075
w_Mean`` = 3 + 85/200 = 3 + 0.425 = 3.425
w_Critical`` = 4 + 100/200 = 4 + 0.5 = 4.5
D``=5.075D_Euclidean+3.425D_Mean+4.5D_Critical
Issue: Contribution of 85 for Mean Distance may be more or less significant than contribution of 100 for Critical Distance.
34
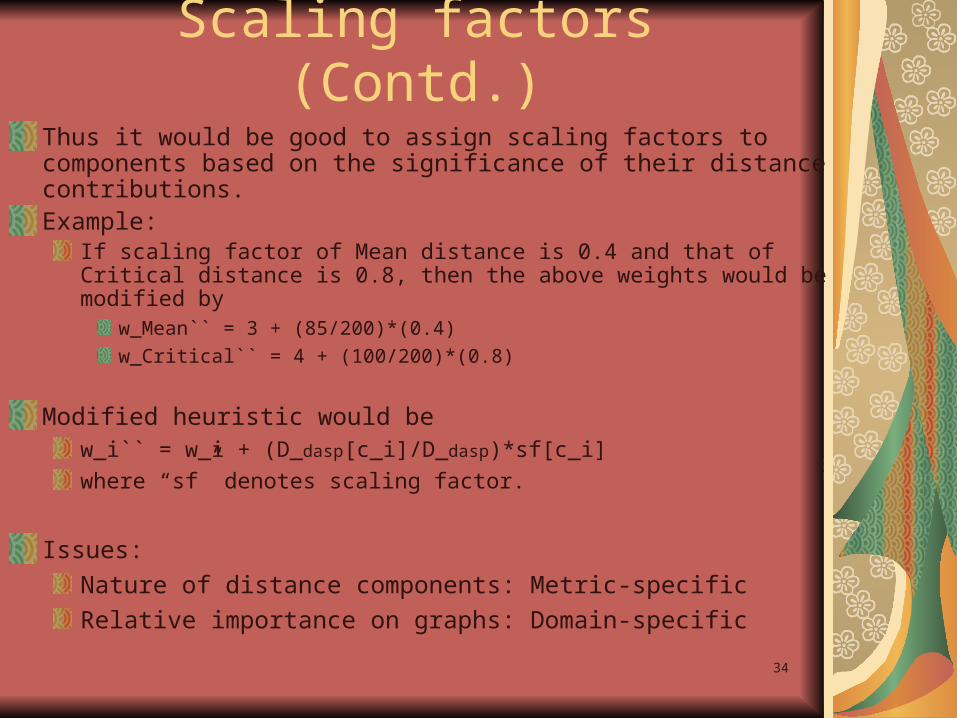
Scaling factors (Contd.)
Thus it would be good to assign scaling factors to components based on the significance of their distance contributions. Example:
If scaling factor of Mean distance is 0.4 and that of Critical distance is 0.8, then the above weights would be modified by
w_Mean`` = 3 + (85/200)*(0.4)
w_Critical`` = 4 + (100/200)*(0.8)
Modified heuristic would be w_i`` = w_i + (D_dasp[c_i]/D_dasp)*sf[c_i]
where “sf” denotes scaling factor.
Issues:
Nature of distance components: Metric-specific
Relative importance on graphs: Domain-specific
35
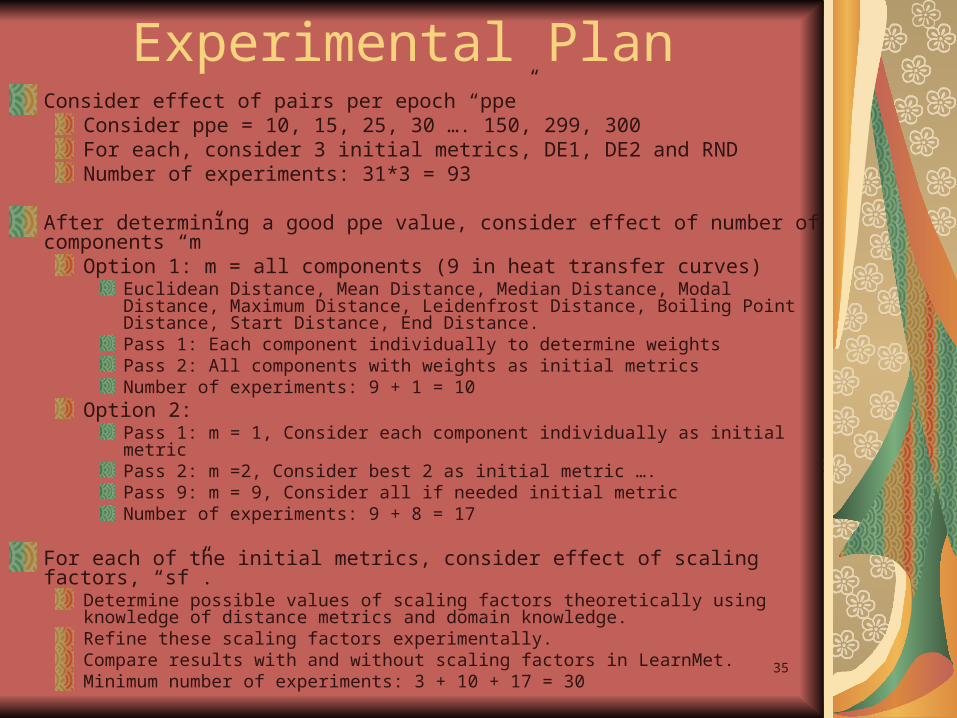
Experimental PlanConsider effect of pairs per epoch “ppe”
Consider ppe = 10, 15, 25, 30 …. 150, 299, 300For each, consider 3 initial metrics, DE1, DE2 and RNDNumber of experiments: 31*3 = 93
After determining a good ppe value, consider effect of number of components “m”Option 1: m = all components (9 in heat transfer curves)
Euclidean Distance, Mean Distance, Median Distance, Modal Distance, Maximum Distance, Leidenfrost Distance, Boiling Point Distance, Start Distance, End Distance.Pass 1: Each component individually to determine weightsPass 2: All components with weights as initial metricsNumber of experiments: 9 + 1 = 10
Option 2: Pass 1: m = 1, Consider each component individually as initial metric Pass 2: m =2, Consider best 2 as initial metric …. Pass 9: m = 9, Consider all if needed initial metricNumber of experiments: 9 + 8 = 17
For each of the initial metrics, consider effect of scaling factors, “sf”.Determine possible values of scaling factors theoretically using knowledge of distance metrics and domain knowledge.Refine these scaling factors experimentally.Compare results with and without scaling factors in LearnMet.Minimum number of experiments: 3 + 10 + 17 = 30
36
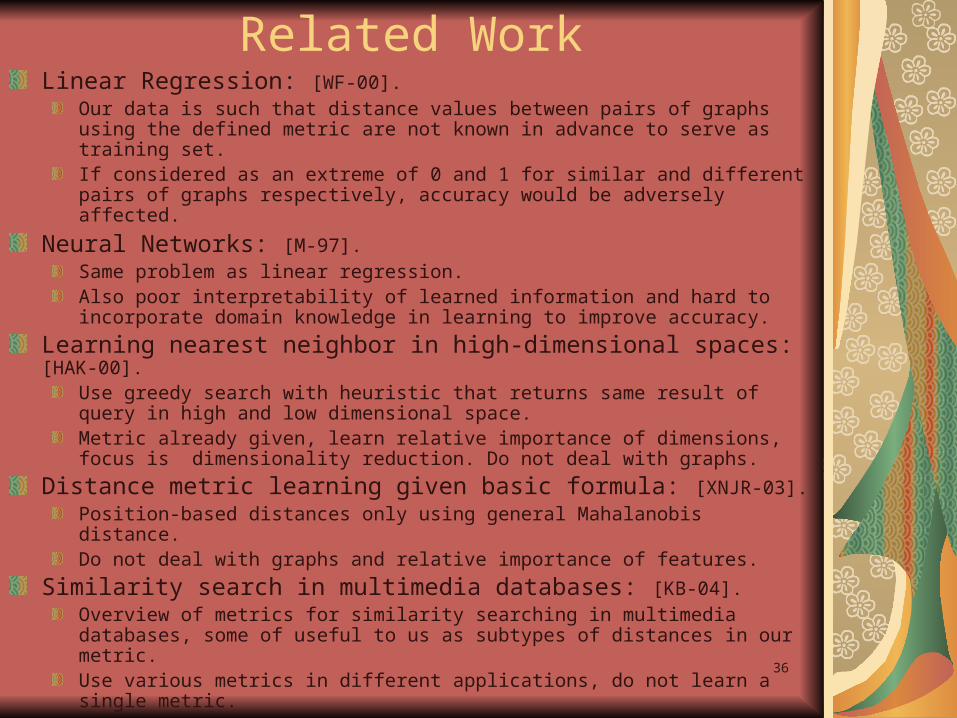
Related WorkLinear Regression: [WF-00].
Our data is such that distance values between pairs of graphs using the defined metric are not known in advance to serve as training set. If considered as an extreme of 0 and 1 for similar and different pairs of graphs respectively, accuracy would be adversely affected.
Neural Networks: [M-97]. Same problem as linear regression.Also poor interpretability of learned information and hard to incorporate domain knowledge in learning to improve accuracy.
Learning nearest neighbor in high-dimensional spaces: [HAK-00].Use greedy search with heuristic that returns same result of query in high and low dimensional space. Metric already given, learn relative importance of dimensions, focus is dimensionality reduction. Do not deal with graphs.
Distance metric learning given basic formula: [XNJR-03].Position-based distances only using general Mahalanobis distance.Do not deal with graphs and relative importance of features.
Similarity search in multimedia databases: [KB-04]. Overview of metrics for similarity searching in multimedia databases, some of useful to us as subtypes of distances in our metric. Use various metrics in different applications, do not learn a single metric.
37
Conclusions
LearnMet proposed as an approach to learn a domain-specific distance metric for graphs.
Principle: Minimize error between predicted clusters and actual clusters of graphs.
Ongoing Work: Maximizing accuracy of LearnMetFinding a good value for number of pairs per epoch.
Selecting components in metric in absence of input from domain experts.
Defining weight adjustment strategies based on scaling factors for different components.


![Aparna Kumar.doc[1]](https://img.pdfslide.us/doc/110x75/577d26681a28ab4e1ea11f5b/aparna-kumardoc1.jpg)