Embed Size (px)
Citation preview

11
Graphical Data Mining for Graphical Data Mining for Computational Estimation in Computational Estimation in
Materials Science ApplicationsMaterials Science ApplicationsAparna VardeAparna Varde
Ph.D. Dissertation Ph.D. Dissertation
August 15, 2006August 15, 2006
Committee MembersCommittee Members
Prof. Elke Rundensteiner (Advisor)Prof. Elke Rundensteiner (Advisor)
Prof. Carolina Ruiz Prof. Carolina Ruiz
Prof. David BrownProf. David Brown
Prof. Neil Heffernan Prof. Neil Heffernan
Prof. Richard Sisson Jr. (Head of Materials Science, WPI)Prof. Richard Sisson Jr. (Head of Materials Science, WPI)This work is supported by the Center for Heat Treating Excellence and
by Department of Energy Award DE-FC-07-01ID14197

22
IntroductionIntroduction
Scientific domains: Experiments conducted with given Scientific domains: Experiments conducted with given input conditions input conditions
Results plotted as graphs: Good visual depictionsResults plotted as graphs: Good visual depictions
Experimental results help in analysis: Assist decision-Experimental results help in analysis: Assist decision-makingmaking
Performing experiment: Consumes time and resourcesPerforming experiment: Consumes time and resources

33
Motivating ExampleMotivating Example Heat Treating of MaterialsHeat Treating of Materials
• Controlled heating & cooling of Controlled heating & cooling of materials to achieve mechanical & materials to achieve mechanical & thermal propertiesthermal properties
Performing experiments Performing experiments involvesinvolves• One time cost: $1000sOne time cost: $1000s• Recurrent costs: $100sRecurrent costs: $100s• Time: 5 to 6 hoursTime: 5 to 6 hours• Human labor Human labor
Desirable to estimateDesirable to estimate • Graphs given input conditionsGraphs given input conditions• Conditions to achieve given graphConditions to achieve given graph
Pneum atic cylinder
Furnace
O il beaker
Pneum atic on/offsw itch
K-type therm ocouple
Probe tip
C onnecting rod
C om puter w ith D ataAcquisition C ard
Therm ocouple for O il tem p.
CHTE Experimental Setup

44
Problem DefinitionProblem Definition To develop an estimation technique with following To develop an estimation technique with following
goals:goals:1. Given input conditions in an experiment, estimate resulting graph
2. Given desired graph in an experiment, estimate conditions to obtain it

55
Proposed Estimation Approach: Proposed Estimation Approach: AutoDomainMineAutoDomainMine

66
Knowledge Discovery in AutoDomainMine

77
Estimation of Graph in AutoDomainMine

88
Estimation of Conditions in AutoDomainMine

99
Main TasksMain Tasks
Task 1AutoDomainMine Learning Strategy
of Integrating Clustering and Classification
[AAAI-06 Poster, ACM SIGART’s ICICIS-05]
Task 2Learning Domain-Specific
Distance Metrics for Graphs
[ACM KDD’s MDM-05, MTAP-06 Journal]
Task 3Designing Semantics-Preserving
Representatives for Clusters
[ACM SIGMOD’S IQIS-06,ACM CIKM-06]

1010
Task 2: Task 2: Learning Domain-Specific Learning Domain-Specific
Distance Metrics for Distance Metrics for Graphs Graphs

1111
Motivation
Various distance Various distance metrics metrics • Absolute position of pointsAbsolute position of points• Statistical observationsStatistical observations• Critical features Critical features
IssuesIssues• Not known what metrics Not known what metrics
apply apply • Multiple metrics may be Multiple metrics may be
relevantrelevant
Need for distance Need for distance metric learning in metric learning in graphsgraphs
Example of domain-specific problem

1212
Proposed Distance Metric Learning Approach: LearnMet
GivenGiven• Training set with Training set with
actual clusters of actual clusters of graphsgraphs
Additional InputAdditional Input• Components: Components:
distance metrics distance metrics applicable to applicable to graphsgraphs
LearnMet Metric • D = ∑wiDi

1313
Evaluate Accuracy
Use pairs of graphsUse pairs of graphs A pair (gA pair (gaa,g,gbb) is) is
TP - same predicted, TP - same predicted, same actual cluster: same actual cluster: (g(g11, g, g22))
TN - different TN - different predicted, different predicted, different actual clusters: (gactual clusters: (g22,g,g33))
FP -FP - same predicted same predicted cluster, different cluster, different actual clusters: (gactual clusters: (g33,g,g44))
FN - different FN - different predicted, same predicted, same actual clusters: (gactual clusters: (g44,g,g55))

1414
Evaluate Accuracy (Contd.)
How do we compute error for whole set of graphs?How do we compute error for whole set of graphs?• For all pairsFor all pairs
Error MeasureError Measure• Failure Rate FR Failure Rate FR • FR = (FP+FN) / (TP+TN+FP+FN)FR = (FP+FN) / (TP+TN+FP+FN)
Error Threshold (t)Error Threshold (t)• Extent of FR allowed Extent of FR allowed • If (FR < t) then clustering is accurate If (FR < t) then clustering is accurate

1515
Adjust the Metric
Weight Adjustment Heuristic: for each DWeight Adjustment Heuristic: for each Dii
• New wNew wii = w = wi i – sf– sfi i (DFN(DFNii/DFN + DFP/DFN + DFPii/DFP) [KDD’s MDM-05]/DFP) [KDD’s MDM-05]

1616
Evaluation of LearnMet Details: MTAP-06 Details: MTAP-06 Effect of pairs per Effect of pairs per
epoch (ppe)epoch (ppe)• G = number of graphs, G = number of graphs,
e.g., = 25e.g., = 25
• GGCC2 2 = total number of = total number of pairs, e.g., = 300pairs, e.g., = 300
• Select subset of Select subset of GGCC22 pairs per epochpairs per epoch
ObservationsObservations• Highest accuracy with Highest accuracy with
middle range of ppemiddle range of ppe• Learning efficiency Learning efficiency
best with low ppebest with low ppe• Average accuracy with Average accuracy with
LearnMet 86%LearnMet 86%
Accuracy of Learned Metrics over Test Set
Learning Efficiency over Training Set

1717
Task 3: Designing Task 3: Designing Semantics-Preserving Semantics-Preserving Representatives for Representatives for
ClustersClusters

1818
Motivation
Different combinations Different combinations of conditions could lead of conditions could lead to a single clusterto a single cluster
Graphs in a cluster could Graphs in a cluster could have variationshave variations
Need for designing Need for designing representatives thatrepresentatives that• Incorporate semanticsIncorporate semantics• Avoid visual clutterAvoid visual clutter• Cater to various usersCater to various users

1919
Proposed Approach for Designing Representatives:
DesRept

2020
Candidates for Conditions
Return set of conditions closest to all others in Return set of conditions closest to all others in clustercluster
Notion of distance: Domain-specific distance metric Notion of distance: Domain-specific distance metric from decision tree paths [CIKM-06]from decision tree paths [CIKM-06]
Set of conditions in Cluster A
Nearest Representative for Cluster A
1. Nearest Representative

2121
Candidates for Conditions (Contd.)
Build sub-clusters of Build sub-clusters of condition using condition using domain knowledgedomain knowledge
Return nearest sub-Return nearest sub-cluster cluster representativesrepresentatives
Sort themSort them
Summarized Representative for Cluster
Cluster A
Sub-clusters within the Cluster A
2. Summarized Representative

2222
Candidates for Conditions (Contd.)
Return all sets of conditionsReturn all sets of conditions Sort them in ascending order Sort them in ascending order
Cluster A
Combined Representative for Cluster A
3. Combined Representative

2323
Candidates for Graphs
Select graph that is nearest neighbor for all othersSelect graph that is nearest neighbor for all others Notion of distance: Domain-specific metric from LearnMetNotion of distance: Domain-specific metric from LearnMet
1. Nearest Representative

2424
Candidates for Graphs (Contd.)
Select graph closest to average of all graphs Select graph closest to average of all graphs Average of y-coordinate values since x-coordinates are same Average of y-coordinate values since x-coordinates are same
2. Medoid Representative

2525
Candidates for Graphs (Contd.)
Construct average graph with prediction limitsConstruct average graph with prediction limits Average: centroid, Prediction limits: domain-specific thresholdsAverage: centroid, Prediction limits: domain-specific thresholds
3. Summarized Representative

2626
Candidates for Graphs (Contd.)
Construct superimposed graph of all graphs in clusterConstruct superimposed graph of all graphs in cluster Same x-values, so plot y-values on a common x-axisSame x-values, so plot y-values on a common x-axis
3. Combined Representative

2727
Effectiveness Measure for Candidates
Minimum Description Length PrincipleMinimum Description Length Principle• Theory: Representative, Examples: all items in clusterTheory: Representative, Examples: all items in cluster
Representative: Measure Complexity (ease of interpretation) Representative: Measure Complexity (ease of interpretation) Complexity = logComplexity = log22 N for graphs, log N for graphs, log22 AV for conditions, AV for conditions,
• N = number of points to store representative graphN = number of points to store representative graph• A = number of attributes for conditions, A = number of attributes for conditions, • V = number of values in representative set of conditionsV = number of values in representative set of conditions
Examples: Measure distance of items from representative Examples: Measure distance of items from representative (information loss)(information loss)Distance for graphs = logDistance for graphs = log2 2 (1/G)∑ (1/G)∑{i=1 to G} {i=1 to G} D(r,gD(r,gii) )
• D: distance using domain-specific metricD: distance using domain-specific metric• G: total number of graphs in cluster G: total number of graphs in cluster • ggii: each graph: each graph• r: representative graphr: representative graph
Encoding [SIGMOD IQIS-06]Encoding [SIGMOD IQIS-06]Effectiveness= UBC*Complexity + UBD*DistanceEffectiveness= UBC*Complexity + UBD*Distance
• UBC, UBD: User bias % weights for complexity and distanceUBC, UBD: User bias % weights for complexity and distance

2828
Evaluation of DesRept: Conditions
DetailsDetails• Data Set Size = 400, Number of Clusters = 20Data Set Size = 400, Number of Clusters = 20
ObservationsObservations• Overall winner is Overall winner is Summarized Summarized • As weight for complexity increases, As weight for complexity increases, NearestNearest wins wins• Designed better than RandomDesigned better than Random

2929
Evaluation of DesRept: Graphs
DetailsDetails• Data Set Size = 400, Number of Clusters = 20Data Set Size = 400, Number of Clusters = 20
ObservationsObservations• Overall winner is Overall winner is SummarizedSummarized• As weight for complexity increases, As weight for complexity increases, Nearest / MedoidNearest / Medoid
winswins• Designed better than RandomDesigned better than Random

3030
User Evaluation of AutoDomainMine System
Formal user surveys Formal user surveys in different in different applicationsapplications
Evaluation ProcessEvaluation Process• Compare estimation Compare estimation
with real data in test with real data in test setset
• If they match If they match estimation is accurateestimation is accurate
ObservationsObservations• Estimation Accuracy Estimation Accuracy
around 90 to 95 %around 90 to 95 %
Accuracy: Estimating Graphs
Accuracy: Estimating Conditions

3131
Related WorkRelated Work Similarity Search [HK-01, WF-00]Similarity Search [HK-01, WF-00]
• Non-matching conditions could be significant Non-matching conditions could be significant Mathematical Modeling [M-95, S-60]Mathematical Modeling [M-95, S-60]
• Existing models not applicable under certain situationsExisting models not applicable under certain situations Case-based Reasoning [K-93, AP-03]Case-based Reasoning [K-93, AP-03]
• Adaptation of cases not feasible with graphsAdaptation of cases not feasible with graphs
Learning nearest neighbor in high-dimensional spaces: [HAK-00]Learning nearest neighbor in high-dimensional spaces: [HAK-00]• Focus is dimensionality reduction, do not deal with graphsFocus is dimensionality reduction, do not deal with graphs
Distance metric learning given basic formula: [XNJR-03]Distance metric learning given basic formula: [XNJR-03]• Deal with position-based distances for points, no graphs involvedDeal with position-based distances for points, no graphs involved
Similarity search in multimedia databases [KB-04] Similarity search in multimedia databases [KB-04] • Use various metrics in different applications, do not learn a single Use various metrics in different applications, do not learn a single
metricmetric
Image Rating: [HH-01]Image Rating: [HH-01]• User intervention involved in manual ratingUser intervention involved in manual rating
Semantic Fish Eye Views: [JP-04] Semantic Fish Eye Views: [JP-04] • Display multiple objects in small space, no representativesDisplay multiple objects in small space, no representatives
PDA Displays in Levels of Detail: [BGMP-01]PDA Displays in Levels of Detail: [BGMP-01]• Do not evaluate different types of representativesDo not evaluate different types of representatives

3232
SummarySummary Dissertation ContributionsDissertation Contributions
• AutoDomainMine: Integrating Clustering and AutoDomainMine: Integrating Clustering and Classification for Estimation [AAAI-06 Poster, ACM Classification for Estimation [AAAI-06 Poster, ACM SIGART’s ICICIS-05]SIGART’s ICICIS-05]
• LearnMet: Learning Domain-Specific Distance Metrics for LearnMet: Learning Domain-Specific Distance Metrics for Graphs [ACM KDD’s MDM-05, MTAP-06 Journal]Graphs [ACM KDD’s MDM-05, MTAP-06 Journal]
• DesRept: Designing Semantics-Preserving DesRept: Designing Semantics-Preserving Representatives for Clusters [ACM SIGMOD’s IQIS-06, Representatives for Clusters [ACM SIGMOD’s IQIS-06, ACM CIKM-06]ACM CIKM-06]
• Trademarked Tool for Computational Estimation in Trademarked Tool for Computational Estimation in Materials Science [ASM HTS-05, ASM HTS-03]Materials Science [ASM HTS-05, ASM HTS-03]
Future WorkFuture Work• Image Mining, e.g., Comparing NanostructuresImage Mining, e.g., Comparing Nanostructures• Data Stream Matching, e.g., Stock Market Analysis Data Stream Matching, e.g., Stock Market Analysis • Visual Displays, e.g., Summarizing Web Information Visual Displays, e.g., Summarizing Web Information
3333
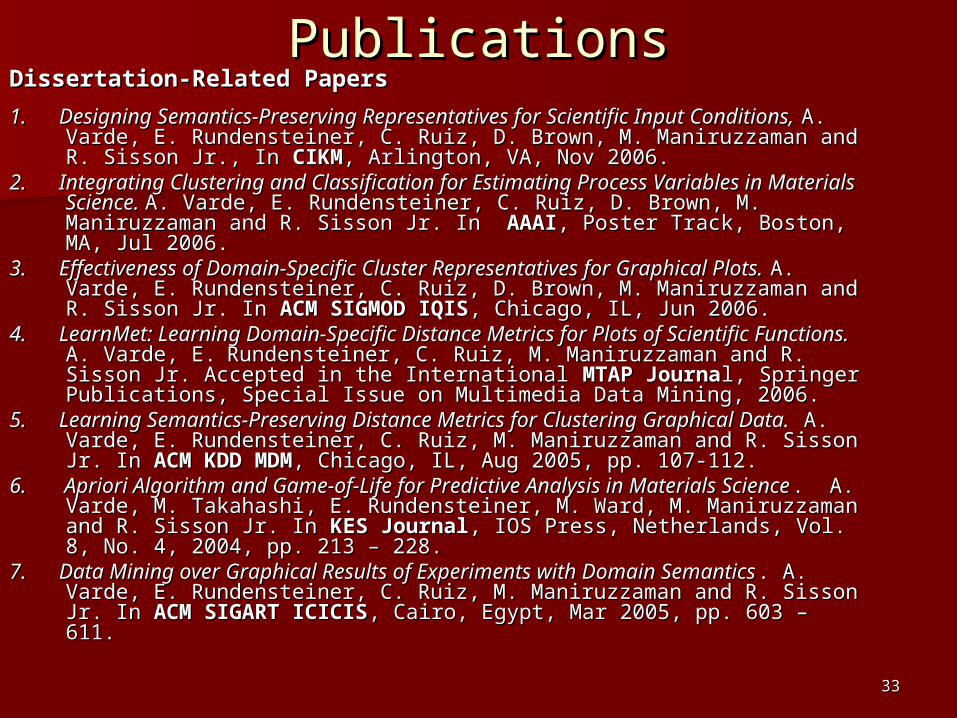
PublicationsPublicationsDissertation-Related PapersDissertation-Related Papers
1. Designing Semantics-Preserving Representatives for Scientific Input 1. Designing Semantics-Preserving Representatives for Scientific Input Conditions, Conditions, A. Varde, E. Rundensteiner, C. Ruiz, D. Brown, M. A. Varde, E. Rundensteiner, C. Ruiz, D. Brown, M. Maniruzzaman and R. Sisson Jr., In Maniruzzaman and R. Sisson Jr., In CIKMCIKM, Arlington, VA, Nov 2006., Arlington, VA, Nov 2006.
2. Integrating Clustering and Classification for Estimating Process Variables 2. Integrating Clustering and Classification for Estimating Process Variables in Materials Science. in Materials Science. A. Varde, E. Rundensteiner, C. Ruiz, D. Brown, M. A. Varde, E. Rundensteiner, C. Ruiz, D. Brown, M. Maniruzzaman and R. Sisson Jr. In Maniruzzaman and R. Sisson Jr. In AAAIAAAI, Poster Track, Boston, MA, Jul , Poster Track, Boston, MA, Jul 2006.2006.
3. Effectiveness of Domain-Specific Cluster Representatives for Graphical 3. Effectiveness of Domain-Specific Cluster Representatives for Graphical Plots. Plots. A. Varde, E. Rundensteiner, C. Ruiz, D. Brown, M. Maniruzzaman A. Varde, E. Rundensteiner, C. Ruiz, D. Brown, M. Maniruzzaman and R. Sisson Jr. In and R. Sisson Jr. In ACM SIGMOD IQISACM SIGMOD IQIS, Chicago, IL, Jun 2006. , Chicago, IL, Jun 2006.
4. LearnMet: Learning Domain-Specific Distance Metrics for Plots of 4. LearnMet: Learning Domain-Specific Distance Metrics for Plots of Scientific Functions. Scientific Functions. A. Varde, E.A. Varde, E. Rundensteiner, C. Ruiz, M. Rundensteiner, C. Ruiz, M. Maniruzzaman and R. Sisson Jr. Accepted in the International Maniruzzaman and R. Sisson Jr. Accepted in the International MTAP MTAP JournaJournal, Springer Publications, Special Issue on Multimedia Data Mining, l, Springer Publications, Special Issue on Multimedia Data Mining, 2006. 2006.
5. Learning Semantics-Preserving Distance Metrics for Clustering Graphical 5. Learning Semantics-Preserving Distance Metrics for Clustering Graphical Data.Data. A. Varde, E. Rundensteiner, C. Ruiz, M. Maniruzzaman and R. A. Varde, E. Rundensteiner, C. Ruiz, M. Maniruzzaman and R. Sisson Jr. In Sisson Jr. In ACM KDDACM KDD MDMMDM, Chicago, IL, Aug 2005, pp. 107-112., Chicago, IL, Aug 2005, pp. 107-112.
6. Apriori Algorithm and Game-of-Life for Predictive Analysis in Materials 6. Apriori Algorithm and Game-of-Life for Predictive Analysis in Materials ScienceScience. A. Varde, M. Takahashi, E. Rundensteiner, M. Ward, M. . A. Varde, M. Takahashi, E. Rundensteiner, M. Ward, M. Maniruzzaman and R. Sisson Jr. In Maniruzzaman and R. Sisson Jr. In KES JournalKES Journal, IOS Press, Netherlands, , IOS Press, Netherlands, Vol. 8, No. 4, 2004, pp. 213 – 228.Vol. 8, No. 4, 2004, pp. 213 – 228.
7. Data Mining over Graphical Results of Experiments with Domain 7. Data Mining over Graphical Results of Experiments with Domain SemanticsSemantics. A. Varde, E. Rundensteiner, C. Ruiz, M. Maniruzzaman and R. . A. Varde, E. Rundensteiner, C. Ruiz, M. Maniruzzaman and R. Sisson Jr. In Sisson Jr. In ACM SIGART ICICISACM SIGART ICICIS, Cairo, Egypt, Mar 2005, pp. 603 – 611., Cairo, Egypt, Mar 2005, pp. 603 – 611.

3434
Publications (Contd.)Publications (Contd.)8. QuenchMiner: Decision Support for Optimization of Heat Treating 8. QuenchMiner: Decision Support for Optimization of Heat Treating
ProcessesProcesses. A. Varde, M. Takahashi, E. Rundensteiner, M. Ward, M. . A. Varde, M. Takahashi, E. Rundensteiner, M. Ward, M. Maniruzzaman and R. Sisson Jr. In Maniruzzaman and R. Sisson Jr. In IEEE IICAIIEEE IICAI, Hyderabad, India, , Hyderabad, India, Dec 2003, pp. 993 – 1003. Dec 2003, pp. 993 – 1003.
9. Estimating Heat Transfer Coefficients as a Function of 9. Estimating Heat Transfer Coefficients as a Function of Temperature by Data Mining. Temperature by Data Mining. A. Varde, E. Rundensteiner, M. A. Varde, E. Rundensteiner, M. Maniruzzaman and R. Sisson Jr. In Maniruzzaman and R. Sisson Jr. In ASM HTSASM HTS, Pittsburgh, PA, Sep , Pittsburgh, PA, Sep 2005.2005.
10 . The QuenchMiner Expert System for Quenching and Distortion 10 . The QuenchMiner Expert System for Quenching and Distortion ControlControl. A. Varde, E. Rundensteiner, M. Maniruzzaman and R. . A. Varde, E. Rundensteiner, M. Maniruzzaman and R. Sisson Jr. In Sisson Jr. In ASM HTS,ASM HTS, Indianapolis, IN, Sep 2003, pp. 174 – 183. Indianapolis, IN, Sep 2003, pp. 174 – 183.
Other PapersOther Papers
11.11. MEDWRAP: Consistent View Maintenance over Distributed Multi-MEDWRAP: Consistent View Maintenance over Distributed Multi-Relation SourcesRelation Sources. A. Varde and E. Rundensteiner. In . A. Varde and E. Rundensteiner. In DEXADEXA. Aix-en-. Aix-en-Provence, France, Sep 2002, pp. 341 – 350.Provence, France, Sep 2002, pp. 341 – 350.
12. SWECCA for Data Warehouse Maintenance12. SWECCA for Data Warehouse Maintenance. A. Varde and E. . A. Varde and E. Rundensteiner. In Rundensteiner. In SCISCI, Orlando, FL, Jul 2002, Vol. 5, pp. 352 – 357., Orlando, FL, Jul 2002, Vol. 5, pp. 352 – 357.
13. MatML: XML for Information Exchange with Materials Property Data13. MatML: XML for Information Exchange with Materials Property Data, , A. Varde, E. Begley, S. Fahrenholz-Mann. In ACM A. Varde, E. Begley, S. Fahrenholz-Mann. In ACM KDD DM-SPP,KDD DM-SPP, Philadelphia, PA, Aug 2006. Philadelphia, PA, Aug 2006.
14. Semantic Extensions to Domain-Specific Markup Languages14. Semantic Extensions to Domain-Specific Markup Languages. A. . A. Varde, E. Rundensteiner, M. Mani, M. Maniruzzaman and R. Sisson Varde, E. Rundensteiner, M. Mani, M. Maniruzzaman and R. Sisson Jr. In Jr. In IEEE CCCT,IEEE CCCT, Austin, TX, Aug 2004, Vol. 2, pp. 55 – 60. Austin, TX, Aug 2004, Vol. 2, pp. 55 – 60.

3535
AcknowledgmentsAcknowledgments First of all, my Advisor: Prof. Elke RundensteinerFirst of all, my Advisor: Prof. Elke Rundensteiner Committee: Prof. Carolina Ruiz,Prof. David Brown, Prof Neil Committee: Prof. Carolina Ruiz,Prof. David Brown, Prof Neil
HeffernanHeffernan External Member: Prof. Richard D. Sisson Jr., Head of Materials External Member: Prof. Richard D. Sisson Jr., Head of Materials
ProgramProgram Director of Metal Processing Institute: Prof. Diran ApelianDirector of Metal Processing Institute: Prof. Diran Apelian Domain Expert: Dr. Mohammed ManiruzzamanDomain Expert: Dr. Mohammed Maniruzzaman Members of Center for Heat Treating ExcellenceMembers of Center for Heat Treating Excellence CS Department Head: Prof. Michael Gennert CS Department Head: Prof. Michael Gennert Former CS Department Head: Prof. Micha HofriFormer CS Department Head: Prof. Micha Hofri WPI Administration (CS, Materials): In particular Mrs. Rita ShilanskyWPI Administration (CS, Materials): In particular Mrs. Rita Shilansky Reviewers of Conferences and Journals where my papers got Reviewers of Conferences and Journals where my papers got
acceptedaccepted Members of DSRG, AIRG, KDDRG and Quenching Research GroupMembers of DSRG, AIRG, KDDRG and Quenching Research Group Colleagues and Friends: Shuhui, Sujoy, Viren, Olly, Mariana, Colleagues and Friends: Shuhui, Sujoy, Viren, Olly, Mariana,
Rimma, Maged, Bin, Lydia, Shimin and others…Rimma, Maged, Bin, Lydia, Shimin and others… Great Thanks to my Family: Parents Dr. Sharad Varde and Dr. Great Thanks to my Family: Parents Dr. Sharad Varde and Dr.
(Mrs.) Varsha Varde, Grandparents Mr. D.A. Varde and Mrs. Vimal (Mrs.) Varsha Varde, Grandparents Mr. D.A. Varde and Mrs. Vimal Varde, Brother Ameya Varde and Sister-in-law Deepa VardeVarde, Brother Ameya Varde and Sister-in-law Deepa Varde
All the attendees of my Ph.D. DefenseAll the attendees of my Ph.D. Defense Finally, God for guiding me throughout my doctoral journeyFinally, God for guiding me throughout my doctoral journey

3636
Thank YouThank You


![Aparna Kumar.doc[1]](https://img.pdfslide.us/doc/110x75/577d26681a28ab4e1ea11f5b/aparna-kumardoc1.jpg)