Embed Size (px)
Citation preview
1 January 25th, 2006
Innovative Solutions for Protein Biomarker Discovery and Validation
© 2006 Applera Corperation and MDS, Inc.
Courtesy of PPD, Inc.
Indications in green = Live content
Indications in black = Edit in master
Indications in white = Locked elementsTemplate release: Date
Presentation title:
28 pt. Arial Regular, light orange
Presenter’s name and title:
20 pt. Arial Regular, white
Applied Biosystems logo must not be moved, added to, or altered in any way.
Background shouldnot be modified.
Courtesy of PPD, Inc.
Biomarker Discovery using iTRAQTM
Reagents
Brian Williamson, Ph.D.
January 2006
3 January 25th, 2006
Innovative Solutions for Protein Biomarker Discovery and Validation
© 2006 Applera Corperation and MDS, Inc.
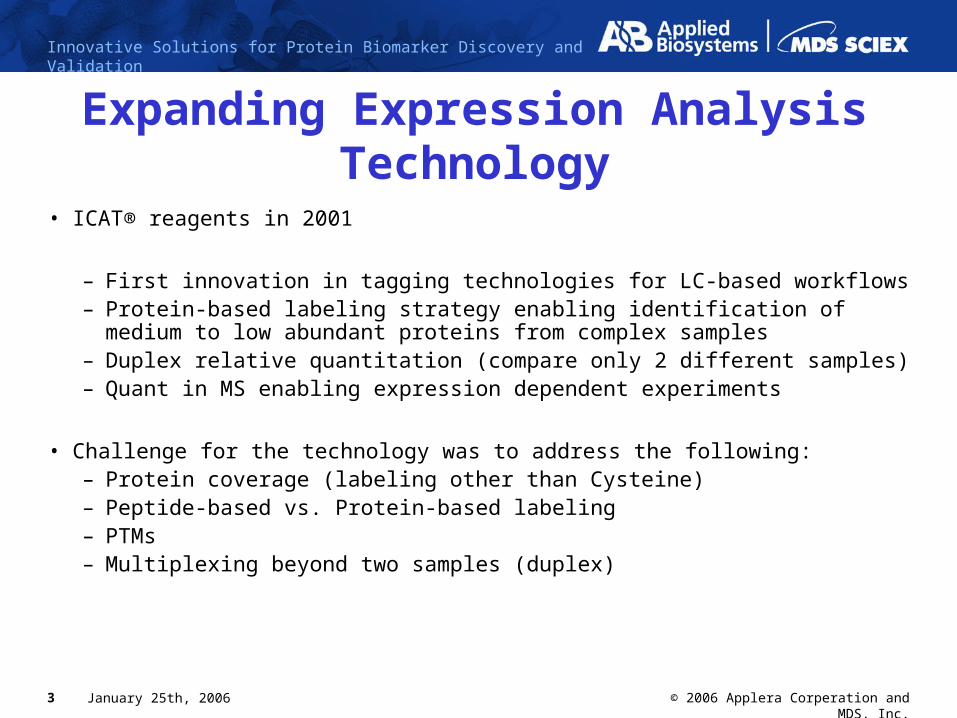
Expanding Expression Analysis Technology
• ICAT® reagents in 2001
– First innovation in tagging technologies for LC-based workflows– Protein-based labeling strategy enabling identification of medium to low
abundant proteins from complex samples– Duplex relative quantitation (compare only 2 different samples)– Quant in MS enabling expression dependent experiments
• Challenge for the technology was to address the following: – Protein coverage (labeling other than Cysteine)– Peptide-based vs. Protein-based labeling– PTMs – Multiplexing beyond two samples (duplex)
4 January 25th, 2006
Innovative Solutions for Protein Biomarker Discovery and Validation
© 2006 Applera Corperation and MDS, Inc.
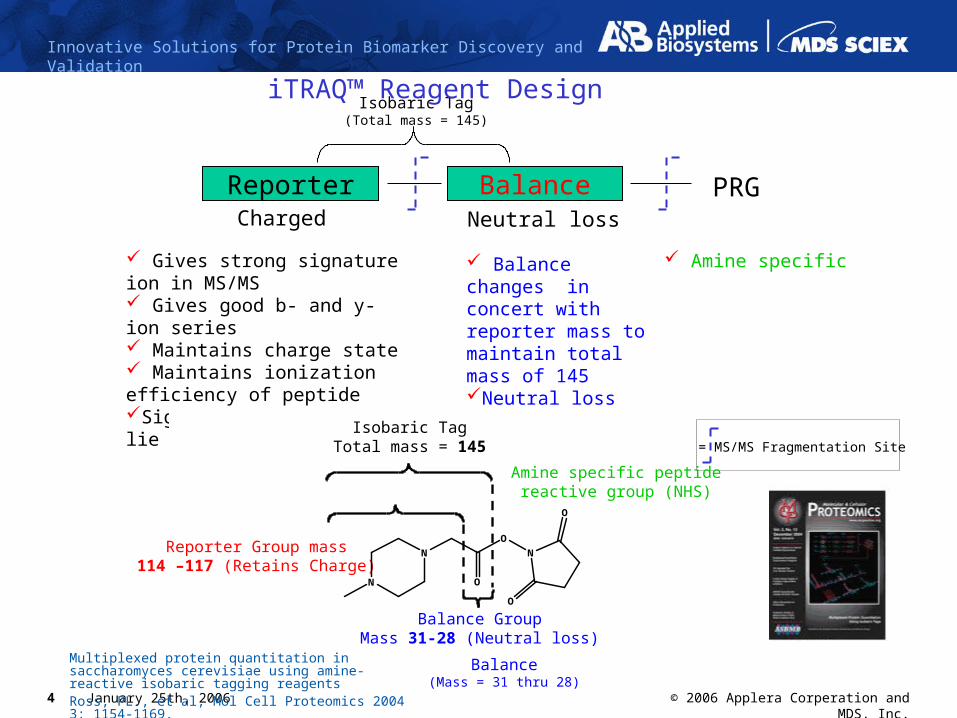
Amine specific
PRG
Peptide Reactive Group
Charged Neutral loss
Isobaric Tag(Total mass = 145)
Reporter Balance PRG
Gives strong signature ion in MS/MS Gives good b- and y-ion series Maintains charge state Maintains ionization efficiency of peptideSignature ion masses lie in quiet region
Reporter(Mass = 114 thru 117)
Balance changes in concert with reporter mass to maintain total mass of 145Neutral loss in MS/MS
Balance(Mass = 31 thru 28)
Isobaric Tag(Total mass = 145)
= MS/MS Fragmentation Site
Isobaric TagTotal mass = 145
Reporter Group mass114 –117 (Retains Charge)
Balance GroupMass 31-28 (Neutral loss)
Amine specific peptidereactive group (NHS)
N
N
O
O
N
O
O
Multiplexed protein quantitation in saccharomyces cerevisiae using amine-reactive isobaric tagging reagents Ross, PL., et al, Mol Cell Proteomics 2004 3: 1154-1169.
iTRAQ™ Reagent Design
5 January 25th, 2006
Innovative Solutions for Protein Biomarker Discovery and Validation
© 2006 Applera Corperation and MDS, Inc.
1347.0 1349.6 1352.2 1354.8 1357.4 1360.0
Mass (m/z)
1352.84
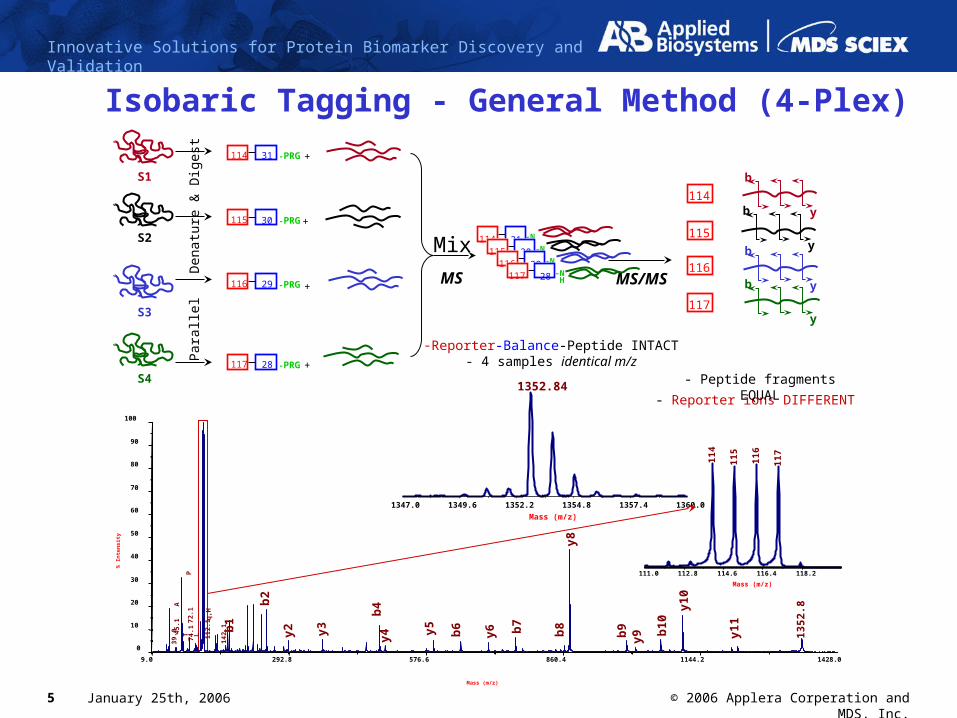
-Reporter-Balance-Peptide INTACT- 4 samples identical m/z
114
115
116
117
111.0 112.8 114.6 116.4 118.2
Mass (m/z)
114
116
115
117
- Reporter ions DIFFERENT
MS
Mix-N H114 31
-N H115 30
-N H116 29
-N H117 28
9.0 292.8 576.6 860.4 1144.2 1428.0
Mass (m/z)
0
10
20
30
40
50
60
70
80
90
100
% In
ten
sity y8
P
A b2
y1
0
q,H
72.1 b4
b1
45.1
b7
LT 112.
1
y3
b1
0
y5
b9
y2 b6
74.1 13
52.8
y6
142.
1
39.0 y4 b8
y9 y1
1
- Peptide fragments EQUAL
MS/MS b
y
b
yb
yb
y
+
+
+
+
-PRG114 31
-PRG115 30
-PRG116 29
-PRG117 28
S1
S2
S3
S4
Par
alle
l D
enat
ure
& D
iges
t
Isobaric Tagging - General Method (4-Plex)
6 January 25th, 2006
Innovative Solutions for Protein Biomarker Discovery and Validation
© 2006 Applera Corperation and MDS, Inc.
111.0 112.8 114.6 116.4 118.2 120.0
Mass (m/z)
5186.0
0
10
20
30
40
50
60
70
80
90
100
% In
ten
sity
Xrn
1
wt
Up
f1
SP
T =
0
T =
60
T =
30
T =
120
Tes
t
C2
C1
C3
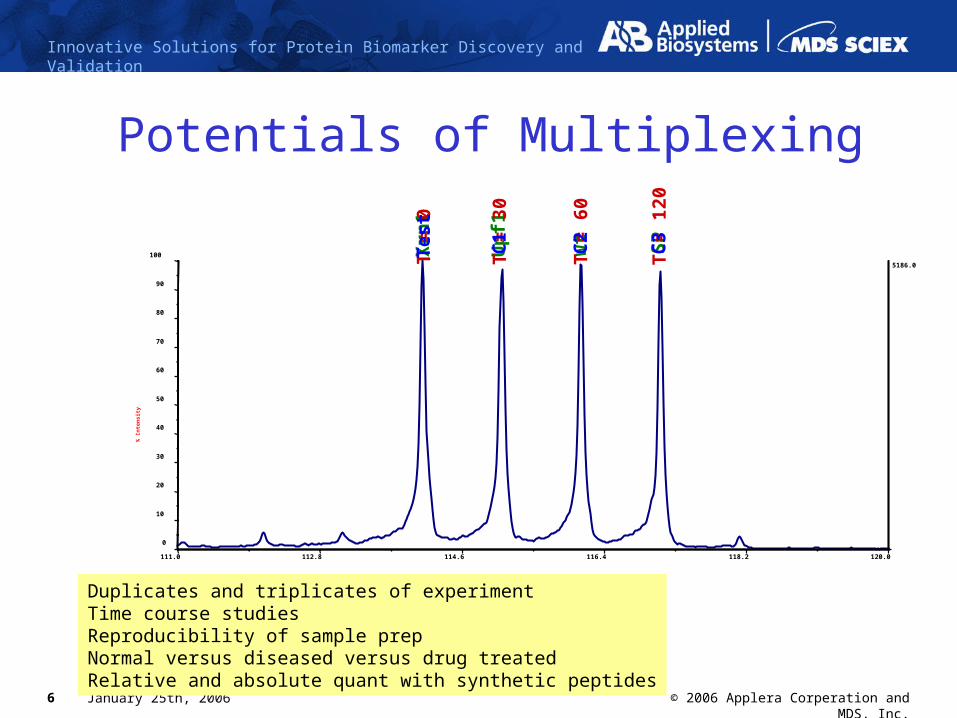
Potentials of Multiplexing
Duplicates and triplicates of experimentTime course studiesReproducibility of sample prepNormal versus diseased versus drug treatedRelative and absolute quant with synthetic peptides
7 January 25th, 2006
Innovative Solutions for Protein Biomarker Discovery and Validation
© 2006 Applera Corperation and MDS, Inc.
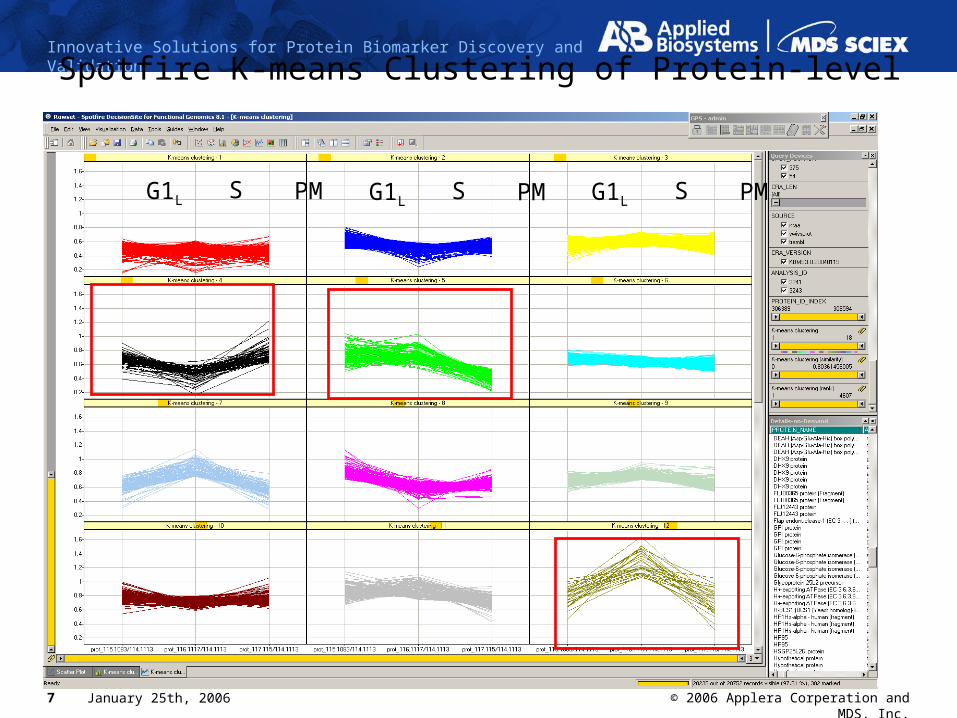
Spotfire K-means Clustering of Protein-level Ratios
G1L S PM G1L S PM G1L S PM
8 January 25th, 2006
Innovative Solutions for Protein Biomarker Discovery and Validation
© 2006 Applera Corperation and MDS, Inc.
9.0 292.8 576.6 860.4 1144.2 1428.0
Mass (m/z)
8396.7
0
10
20
30
40
50
60
70
80
90
100
% In
ten
sity
y8
P
A b2
y1
0
q,H
72.1 b4
b1
45.1
b7
LT 112.
1
y3
b1
0
y5
b9
y2 b6
74.1 13
52.8
y6
142.
1
39.0 y4 b8
y9 y1
1
869 871 873 875 877 879
Mass (m/z)
y8
757 759 761 763 765 767
Mass (m/z)
b7
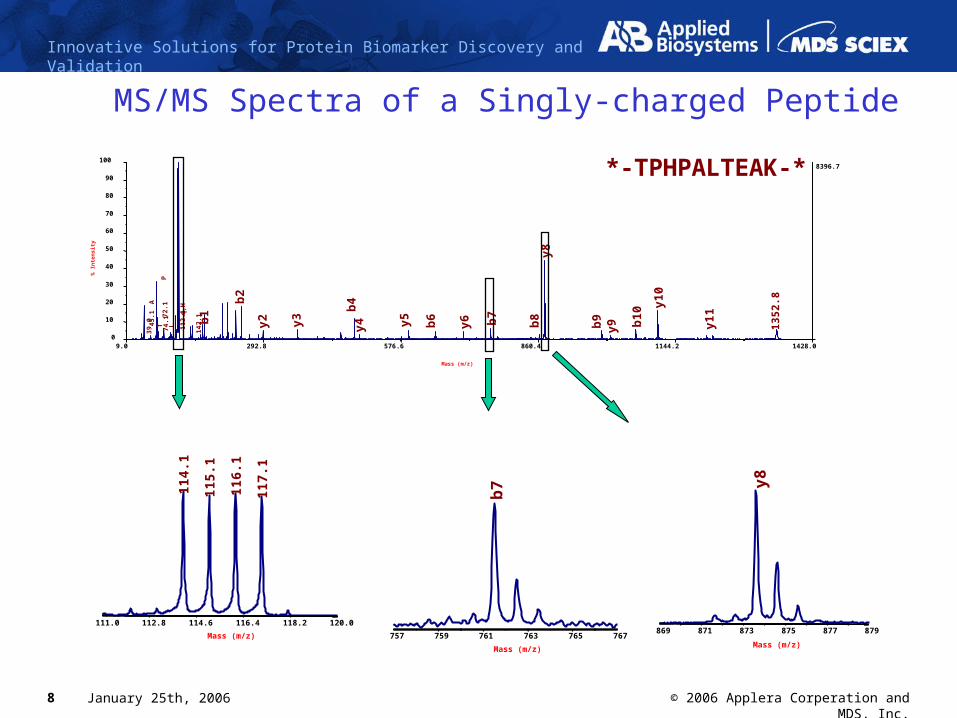
*-TPHPALTEAK-*
111.0 112.8 114.6 116.4 118.2 120.0
Mass (m/z)
114.
1
116.
1
115.
1
117.
1
MS/MS Spectra of a Singly-charged Peptide
9 January 25th, 2006
Innovative Solutions for Protein Biomarker Discovery and Validation
© 2006 Applera Corperation and MDS, Inc.
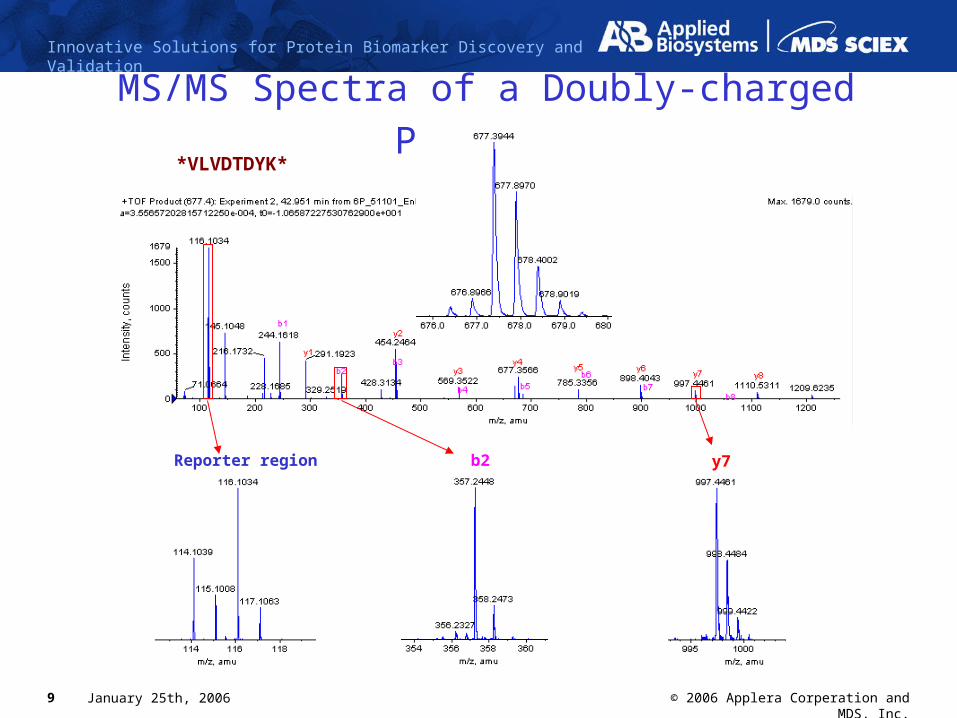
MS/MS Spectra of a Doubly-charged Peptide
y7b2Reporter region
*VLVDTDYK*
10 January 25th, 2006
Innovative Solutions for Protein Biomarker Discovery and Validation
© 2006 Applera Corperation and MDS, Inc.
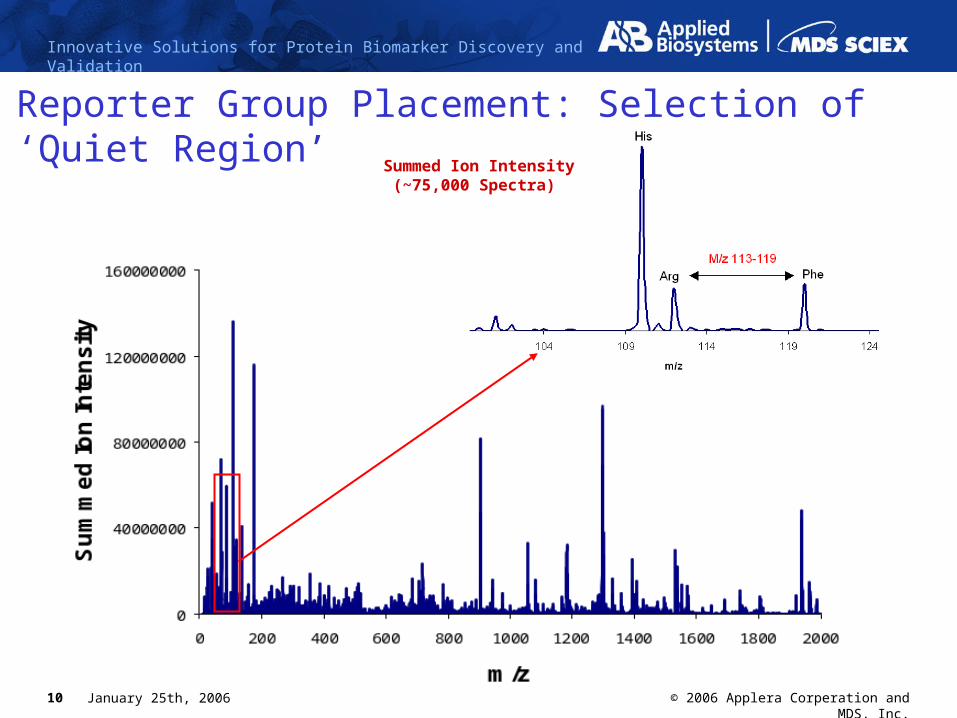
Summed Ion Intensity (~75,000 Spectra)
Reporter Group Placement: Selection of ‘Quiet Region’

11 January 25th, 2006
Innovative Solutions for Protein Biomarker Discovery and Validation
© 2006 Applera Corperation and MDS, Inc.
Control
Example: Time course labeling
Test 1 Test 2 Test 3
Trypsin Digestion
MIX
LC MS/MS Analysis
Simplified Workflow: (One extra step)
SCXID and
MS/MS
Label with iTRAQ™ Reagents114 115 116 117
1 hr, RT,Single addition
Single 2D LC analysis for combined samples (4-plex)
Quant

12 January 25th, 2006
Innovative Solutions for Protein Biomarker Discovery and Validation
© 2006 Applera Corperation and MDS, Inc.Data courtesy of Michael Siu, York University, Toronto
Discovery and Identification of Protein Markers in Endometrial Carcinoma
• Over 5% of all cancers in women
• Challenge in Screening• Pap test
• low sensitivity
• No biochemical markers available to monitor or screen disease
• Invasive techniques available in advanced stages of disease
• Yet high risk groups are recognized• Diabetic, hypertensive, Tamoxifen treatment
13 January 25th, 2006
Innovative Solutions for Protein Biomarker Discovery and Validation
© 2006 Applera Corperation and MDS, Inc.
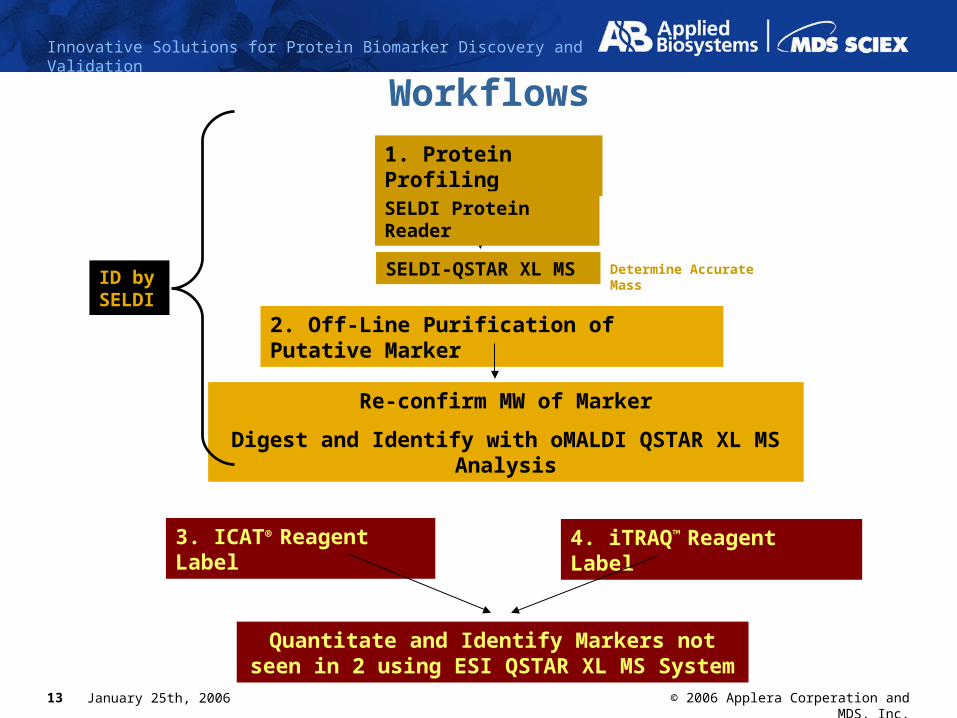
Workflows
1. Protein Profiling
SELDI Protein Reader
SELDI-QSTAR XL MS Determine Accurate Mass
2. Off-Line Purification of Putative Marker
Re-confirm MW of Marker
Digest and Identify with oMALDI QSTAR XL MS Analysis
3. ICAT® Reagent Label
Quantitate and Identify Markers not seen in 2 using ESI QSTAR XL MS System
4. iTRAQ™ Reagent Label
ID by SELDI
14 January 25th, 2006
Innovative Solutions for Protein Biomarker Discovery and Validation
© 2006 Applera Corperation and MDS, Inc.
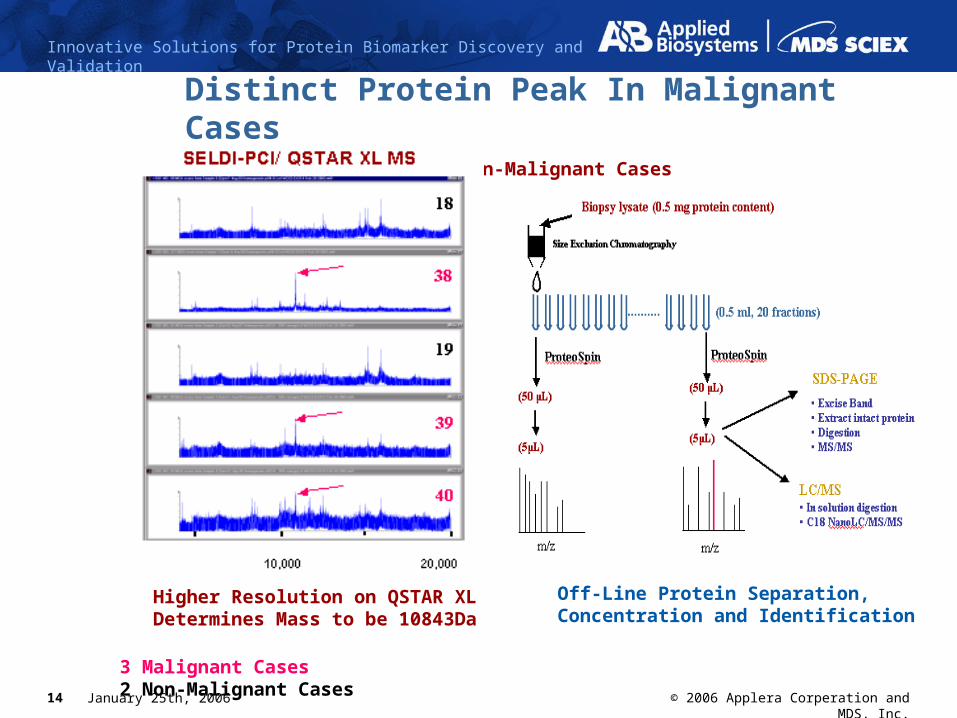
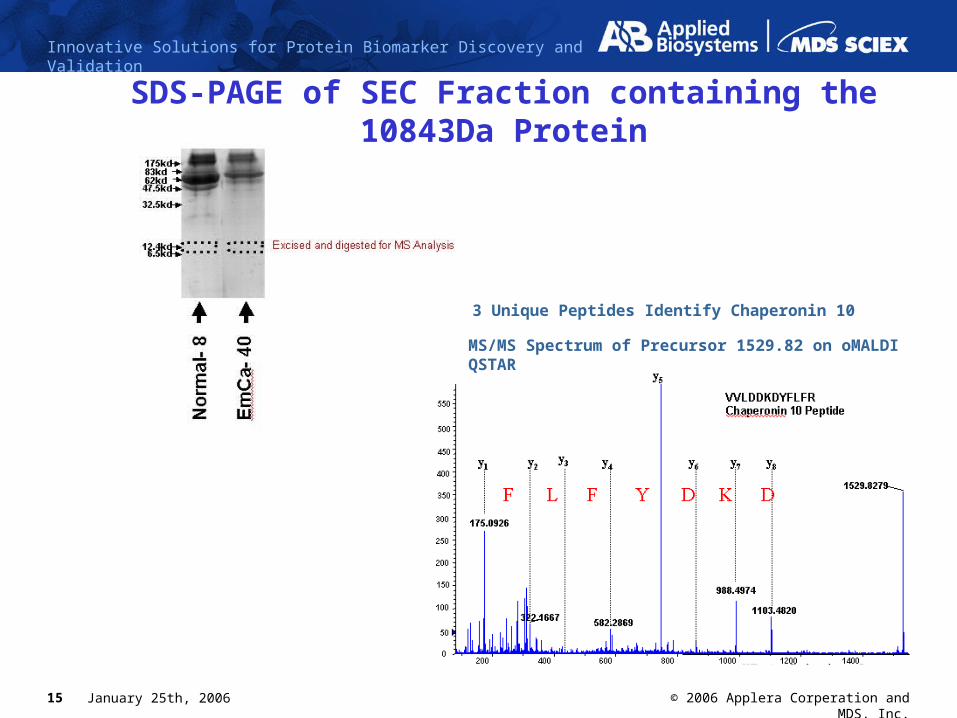
3 Malignant Cases2 Non-Malignant Cases
Distinct Protein Peak In Malignant CasesLow in Non-Malignant Cases
Higher Resolution on QSTAR XL Determines Mass to be 10843Da
Off-Line Protein Separation, Concentration and Identification
15 January 25th, 2006
Innovative Solutions for Protein Biomarker Discovery and Validation
© 2006 Applera Corperation and MDS, Inc.
SDS-PAGE of SEC Fraction containing the 10843Da Protein
MS/MS Spectrum of Precursor 1529.82 on oMALDI QSTAR
3 Unique Peptides Identify Chaperonin 10
16 January 25th, 2006
Innovative Solutions for Protein Biomarker Discovery and Validation
© 2006 Applera Corperation and MDS, Inc.
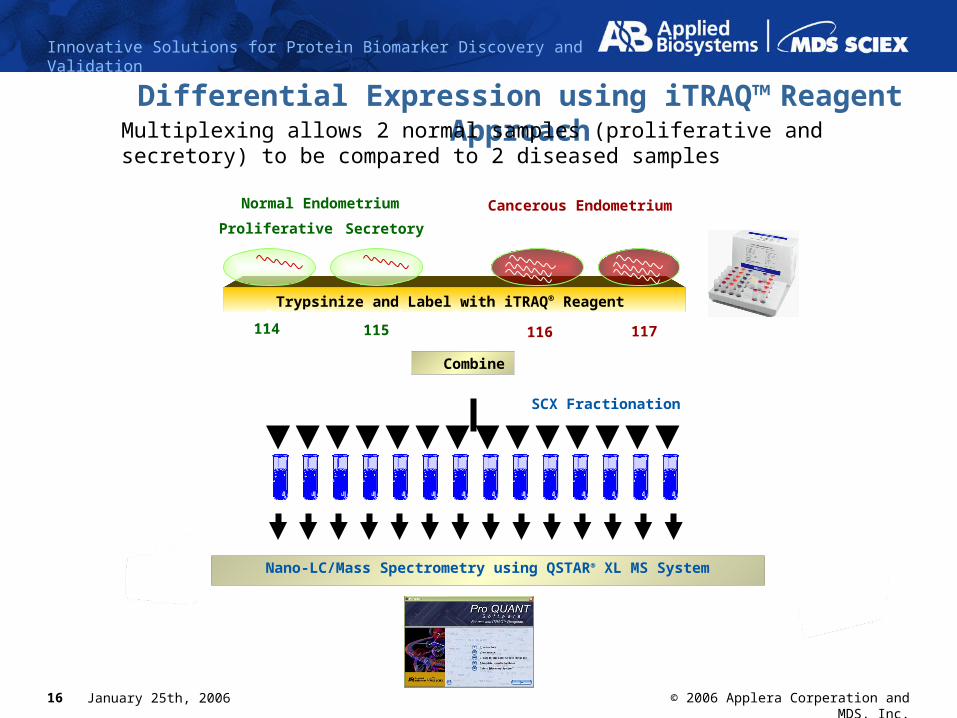
Differential Expression using iTRAQ™ Reagent ApproachMultiplexing allows 2 normal samples (proliferative and secretory) to be compared to 2 diseased samples
Trypsinize and Label with iTRAQ® Reagent
Normal Endometrium Cancerous Endometrium
114
SCX Fractionation
Nano-LC/Mass Spectrometry using QSTAR® XL MS System
115 116 117
Combine
Parallel Digestion and Labeling
Proliferative Secretory
17 January 25th, 2006
Innovative Solutions for Protein Biomarker Discovery and Validation
© 2006 Applera Corperation and MDS, Inc.
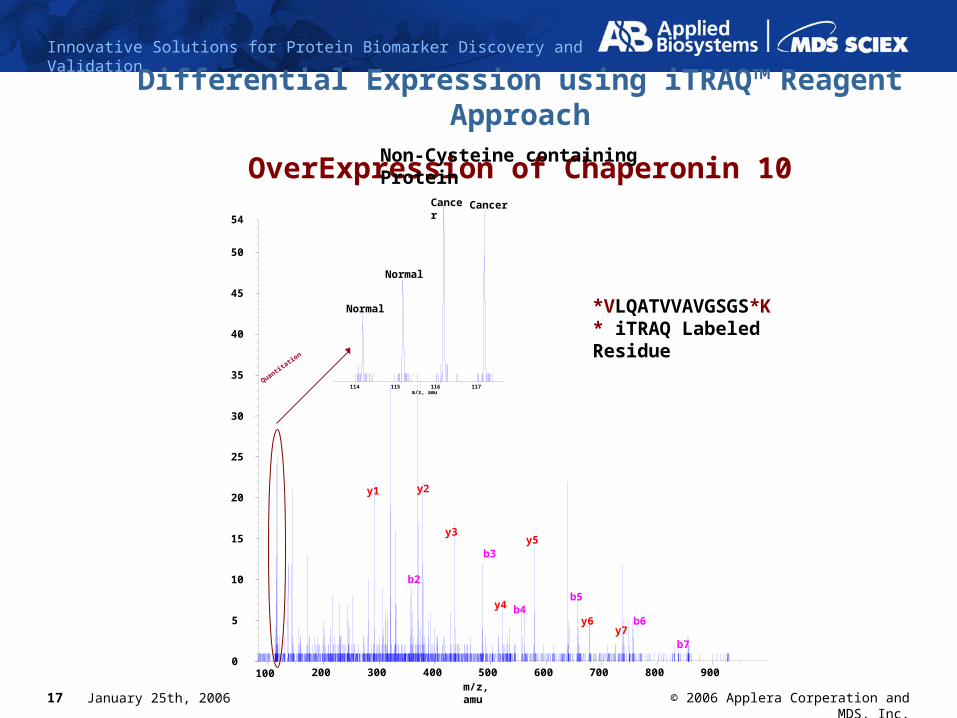
Differential Expression using iTRAQ™ Reagent Approach
OverExpression of Chaperonin 10Non-Cysteine containing Protein
Quantitatio
n
100 200 300 400 500 600 700 800 900m/z, amu
0
5
10
15
20
25
30
35
40
45
50
54
b2
b3
b4 b5
b6 b7
y7 y6
y5
y4
y3
y2 y1
114 115 116 117m/z, amu
Normal
Normal
Cancer Cancer
*VLQATVVAVGSGS*K* iTRAQ Labeled Residue
18 January 25th, 2006
Innovative Solutions for Protein Biomarker Discovery and Validation
© 2006 Applera Corperation and MDS, Inc.
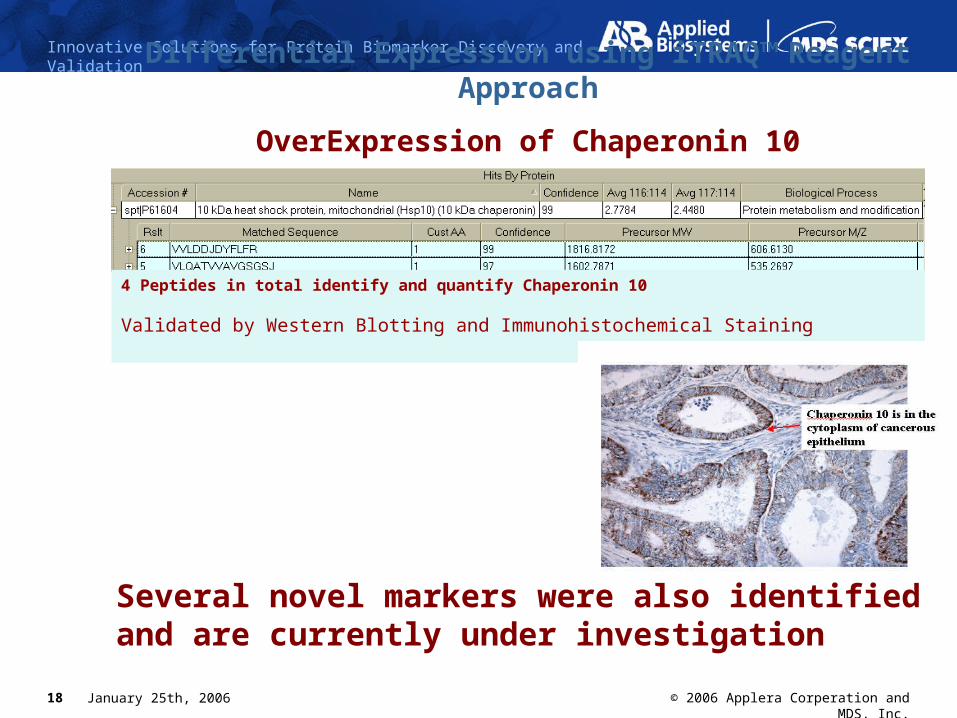
Differential Expression using iTRAQ™ Reagent Approach
OverExpression of Chaperonin 10
Several novel markers were also identified and are currently under investigation
4 Peptides in total identify and quantify Chaperonin 10
Validated by Western Blotting and Immunohistochemical Staining
19 January 25th, 2006
Innovative Solutions for Protein Biomarker Discovery and Validation
© 2006 Applera Corperation and MDS, Inc.
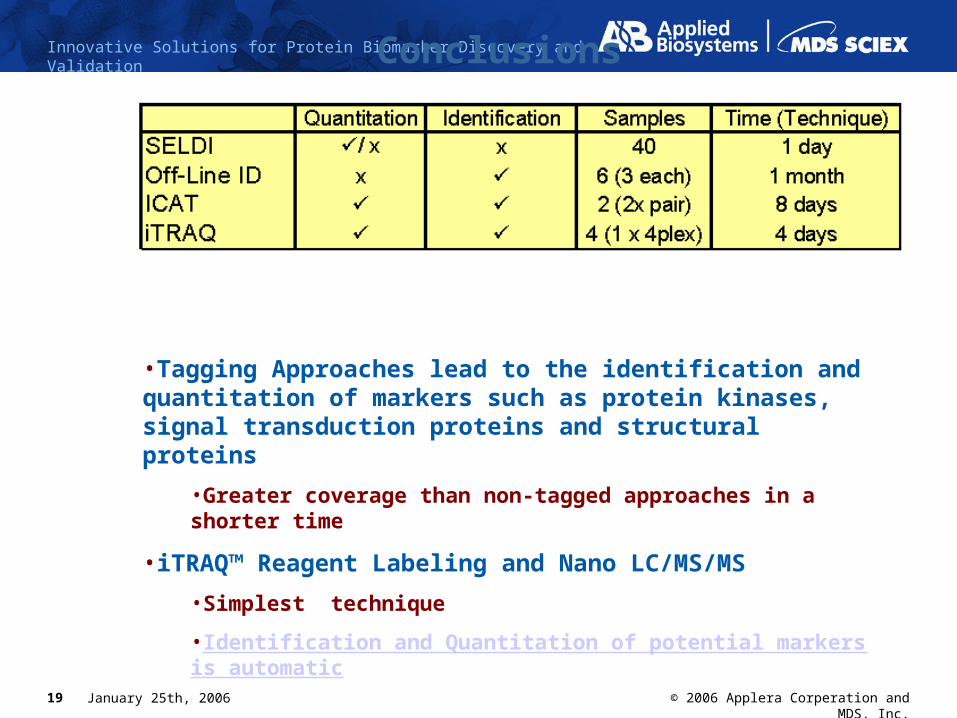
•Tagging Approaches lead to the identification and quantitation of markers such as protein kinases, signal transduction proteins and structural proteins
•Greater coverage than non-tagged approaches in a shorter time
•iTRAQ™ Reagent Labeling and Nano LC/MS/MS
•Simplest technique
•Identification and Quantitation of potential markers is automatic
Conclusions
20 January 25th, 2006
Innovative Solutions for Protein Biomarker Discovery and Validation
© 2006 Applera Corperation and MDS, Inc.
Discovery of Putative Biomarkers for Anaplastic Oligodendrogliomas in
Human Brain Tissue using iTRAQ™ Reagents and the 4800 MALDI
TOF/TOF™ Analyzer
21 January 25th, 2006
Innovative Solutions for Protein Biomarker Discovery and Validation
© 2006 Applera Corperation and MDS, Inc.
•Aggressive form of brain tumors
•Account for 5% of brain tumors in the US
•Treated by surgery followed by radiation therapy
•Current detailed study of these tumors is currently being investigated using pathological, proteomic and genomic data to gain a greater understanding of this disease.
What are Anaplastic Oligodendrogliomas?
22 January 25th, 2006
Innovative Solutions for Protein Biomarker Discovery and Validation
© 2006 Applera Corperation and MDS, Inc.
Identify putative protein markers that:
1.Differentiate the tumor tissue from normal brain tissue
2.Differentiate different tumor types
using the 4800 MALDI TOF/TOF™ Analyzer and iTRAQ™ Reagents.
Research Objectives
24 January 25th, 2006
Innovative Solutions for Protein Biomarker Discovery and Validation
© 2006 Applera Corperation and MDS, Inc.
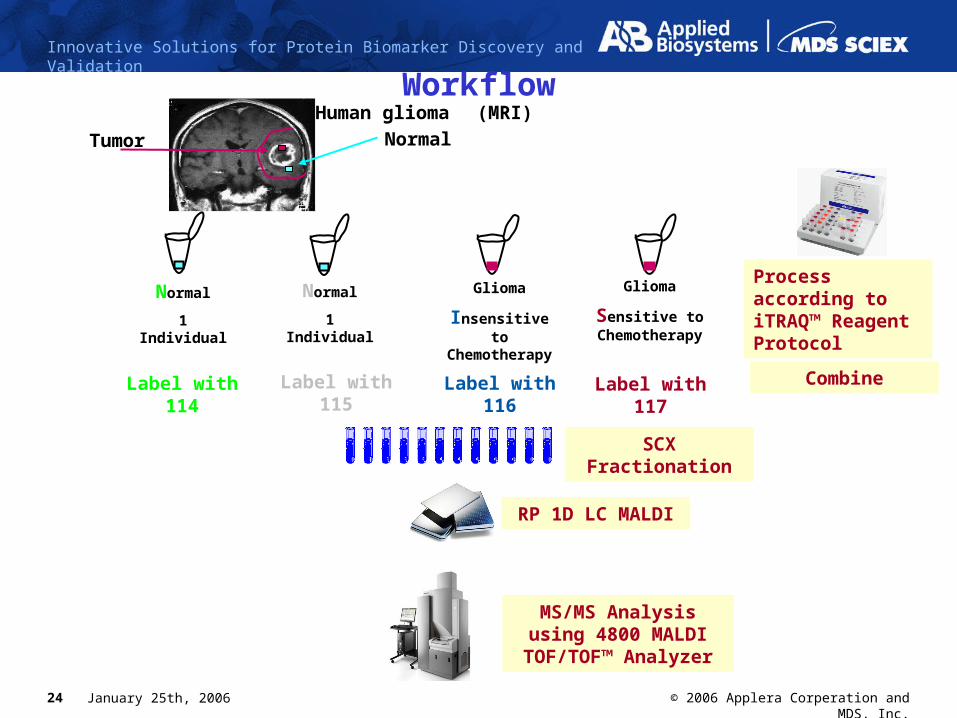
WorkflowHuman glioma (MRI)
Tumor Normal
Normal
1 Individual
Normal
1 Individual
Glioma
Insensitive to Chemotherapy
Glioma
Sensitive to Chemotherapy
Label with 117
Process according to iTRAQ™ Reagent Protocol
Label with 116Label with 115Label with 114 Combine
Parallel Digestion and Labeling
SCX Fractionation
RP 1D LC MALDI
MS/MS Analysis using 4800 MALDI TOF/TOF™
Analyzer
25 January 25th, 2006
Innovative Solutions for Protein Biomarker Discovery and Validation
© 2006 Applera Corperation and MDS, Inc.
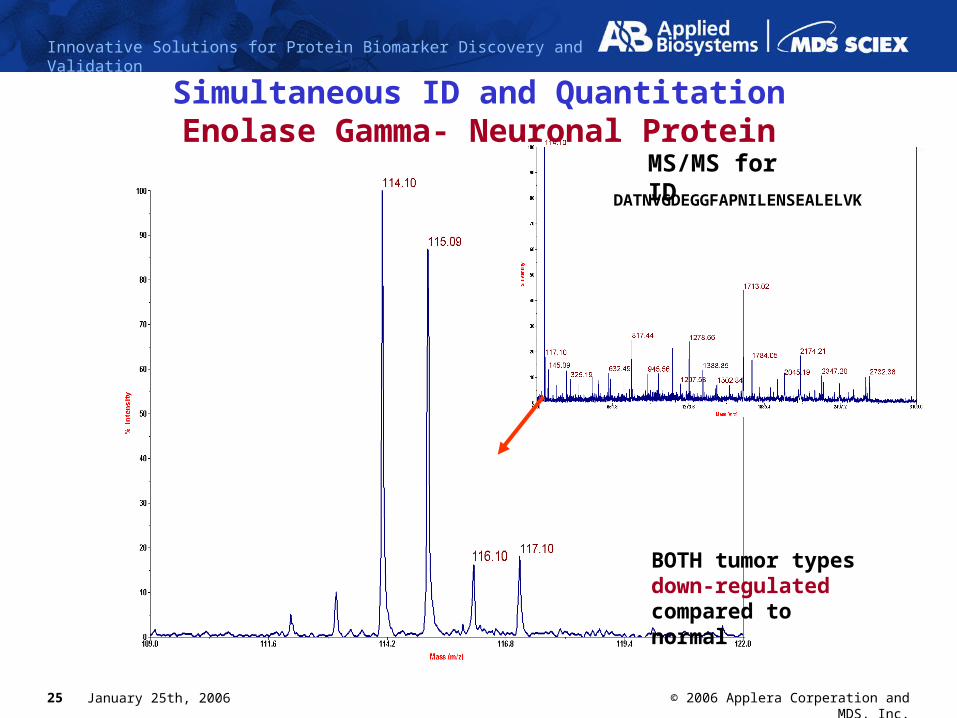
Simultaneous ID and QuantitationEnolase Gamma- Neuronal Protein
MS/MS for ID
BOTH tumor types down-regulated compared to normal
DATNVGDEGGFAPNILENSEALELVK

26 January 25th, 2006
Innovative Solutions for Protein Biomarker Discovery and Validation
© 2006 Applera Corperation and MDS, Inc.
Simultaneous ID and QuantitationCaldesmon
BOTH tumor types up-regulated compared to normal
MS/MS Spectrum for consistency
YEIEETETVTK
27 January 25th, 2006
Innovative Solutions for Protein Biomarker Discovery and Validation
© 2006 Applera Corperation and MDS, Inc.
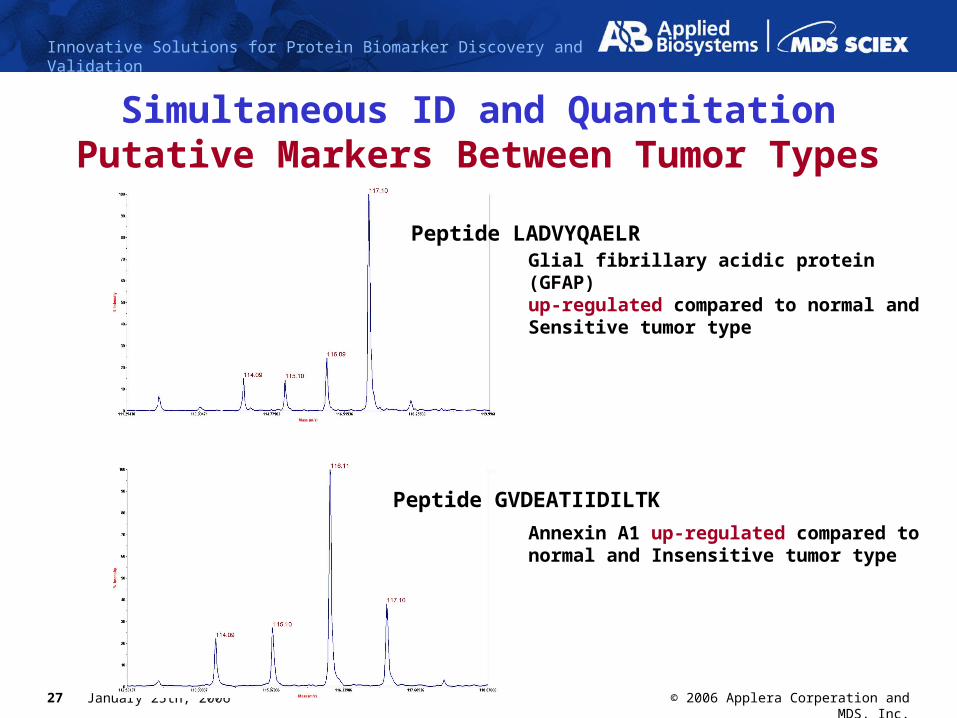
Simultaneous ID and QuantitationPutative Markers Between Tumor Types
Glial fibrillary acidic protein (GFAP)up-regulated compared to normal and Sensitive tumor type
Annexin A1 up-regulated compared to normal and Insensitive tumor type
Peptide LADVYQAELR
Peptide GVDEATIIDILTK
28 January 25th, 2006
Innovative Solutions for Protein Biomarker Discovery and Validation
© 2006 Applera Corperation and MDS, Inc.
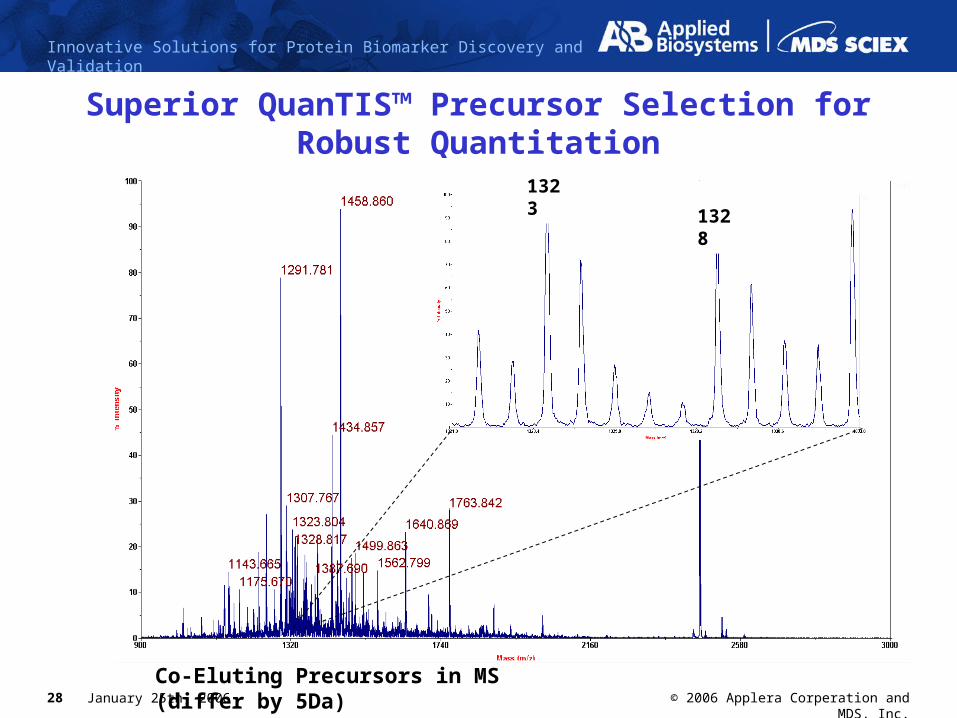
Superior QuanTIS™ Precursor Selection for Robust Quantitation
Co-Eluting Precursors in MS (differ by 5Da)
1323
1328
29 January 25th, 2006
Innovative Solutions for Protein Biomarker Discovery and Validation
© 2006 Applera Corperation and MDS, Inc.
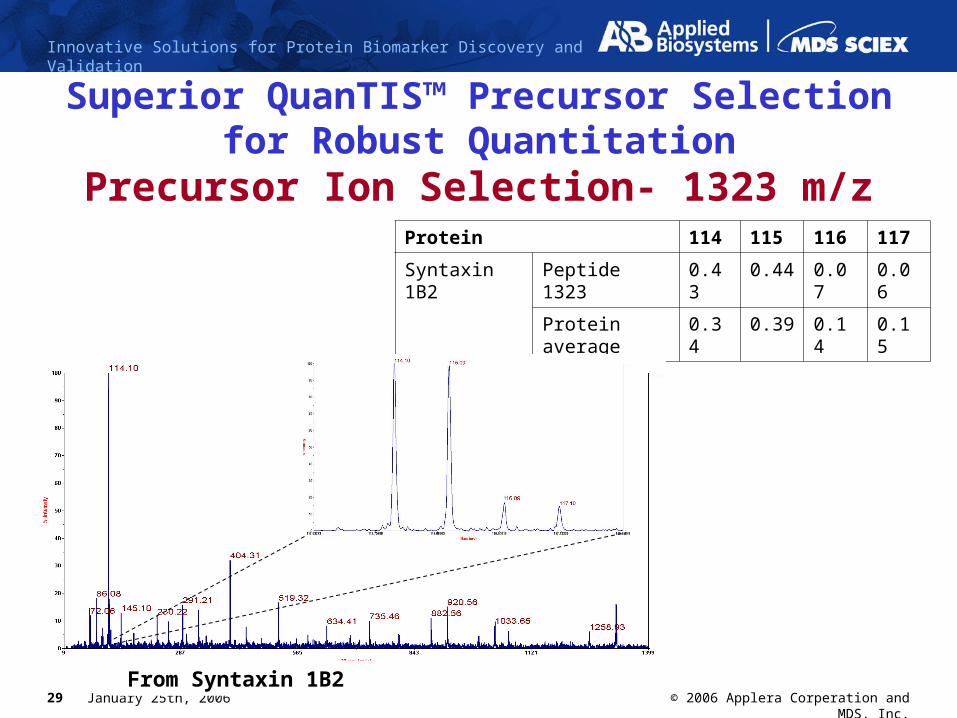
Superior QuanTIS™ Precursor Selection for Robust Quantitation
Precursor Ion Selection- 1323 m/zProtein 114 115 116 117
Syntaxin 1B2 Peptide 1323 0.43 0.44 0.07 0.06
Protein average 0.34 0.39 0.14 0.15
From Syntaxin 1B2
30 January 25th, 2006
Innovative Solutions for Protein Biomarker Discovery and Validation
© 2006 Applera Corperation and MDS, Inc.
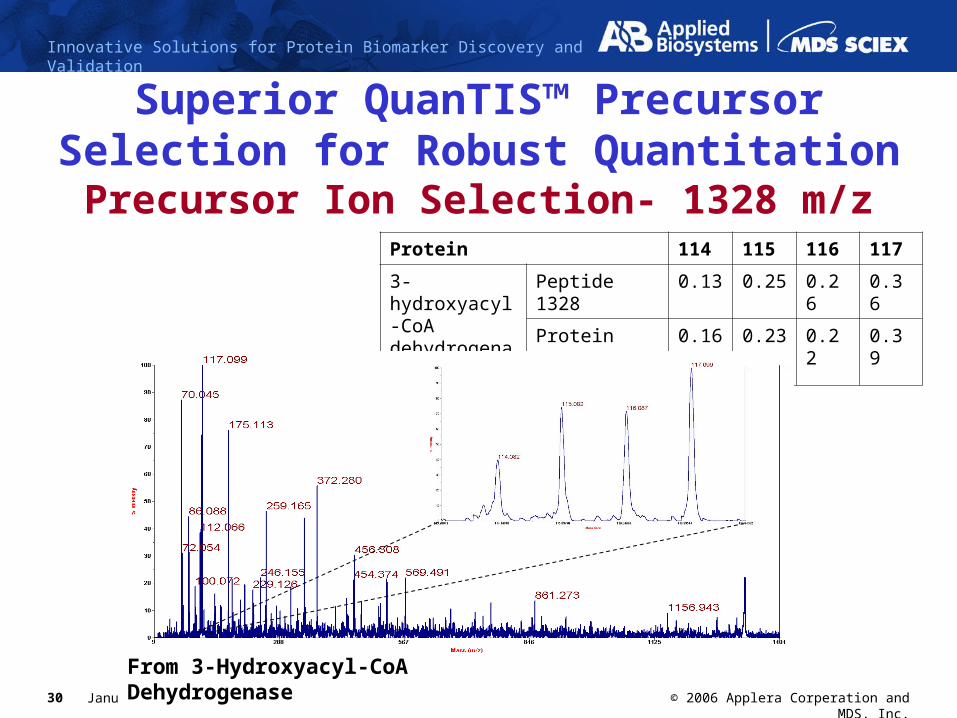
Superior QuanTIS™ Precursor Selection for Robust Quantitation
Precursor Ion Selection- 1328 m/zProtein 114 115 116 117
3-hydroxyacyl-CoA dehydrogenase
Peptide 1328 0.13 0.25 0.26 0.36
Protein average 0.16 0.23 0.22 0.39
From 3-Hydroxyacyl-CoA Dehydrogenase
31 January 25th, 2006
Innovative Solutions for Protein Biomarker Discovery and Validation
© 2006 Applera Corperation and MDS, Inc.
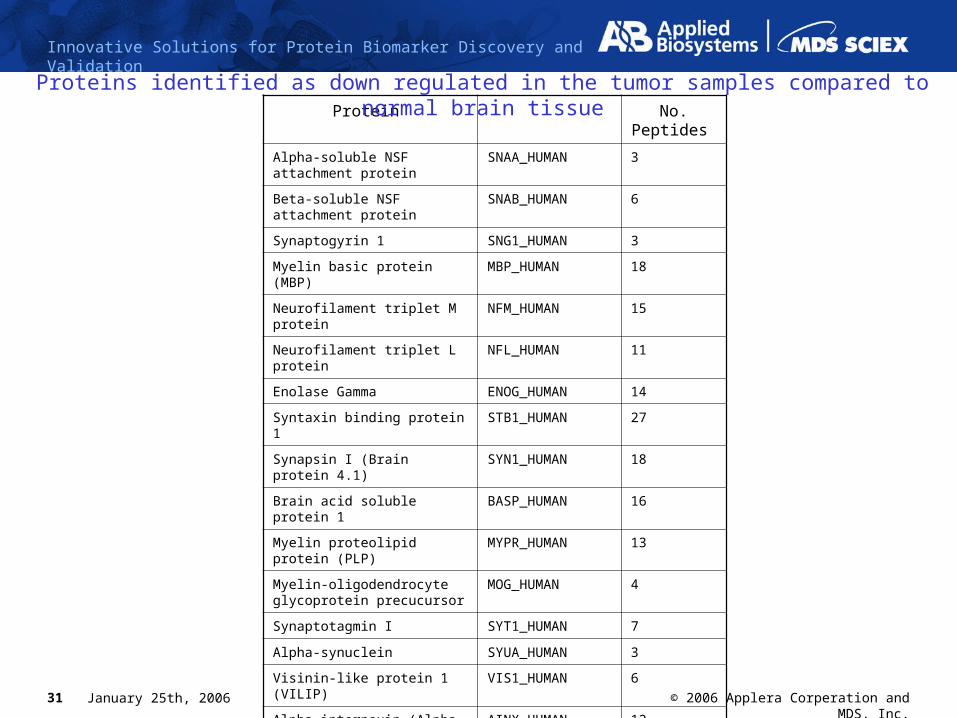
Protein No. Peptides
Alpha-soluble NSF attachment protein
SNAA_HUMAN 3
Beta-soluble NSF attachment protein
SNAB_HUMAN 6
Synaptogyrin 1 SNG1_HUMAN 3
Myelin basic protein (MBP) MBP_HUMAN 18
Neurofilament triplet M protein NFM_HUMAN 15
Neurofilament triplet L protein NFL_HUMAN 11
Enolase Gamma ENOG_HUMAN 14
Syntaxin binding protein 1 STB1_HUMAN 27
Synapsin I (Brain protein 4.1) SYN1_HUMAN 18
Brain acid soluble protein 1 BASP_HUMAN 16
Myelin proteolipid protein (PLP) MYPR_HUMAN 13
Myelin-oligodendrocyte glycoprotein precucursor
MOG_HUMAN 4
Synaptotagmin I SYT1_HUMAN 7
Alpha-synuclein SYUA_HUMAN 3
Visinin-like protein 1 (VILIP) VIS1_HUMAN 6
Alpha-internexin (Alpha-Inx) AINX_HUMAN 12
Neuromodulin NEUM_HUMAN 8
Synaptosomal-associated protein 25
SN25_HUMAN 10
Syntaxin 1B2 ST1C_HUMAN 6
Proteins identified as down regulated in the tumor samples compared to normal brain tissue
32 January 25th, 2006
Innovative Solutions for Protein Biomarker Discovery and Validation
© 2006 Applera Corperation and MDS, Inc.
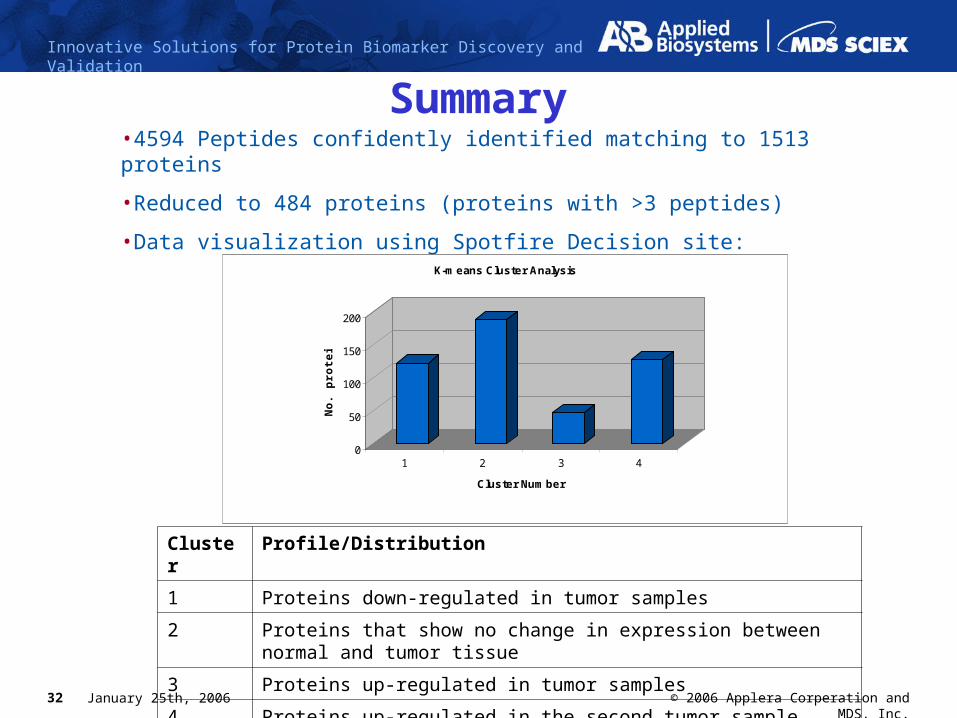
Summary•4594 Peptides confidently identified matching to 1513 proteins
•Reduced to 484 proteins (proteins with >3 peptides)
•Data visualization using Spotfire Decision site:
Cluster Profile/Distribution
1 Proteins down-regulated in tumor samples
2 Proteins that show no change in expression between normal and tumor tissue
3 Proteins up-regulated in tumor samples
4 Proteins up-regulated in the second tumor sample only
0
50
100
150
200N
o. p
rote
ins
1 2 3 4
Cluster Number
K-means Cluster Analysis
33 January 25th, 2006
Innovative Solutions for Protein Biomarker Discovery and Validation
© 2006 Applera Corperation and MDS, Inc.
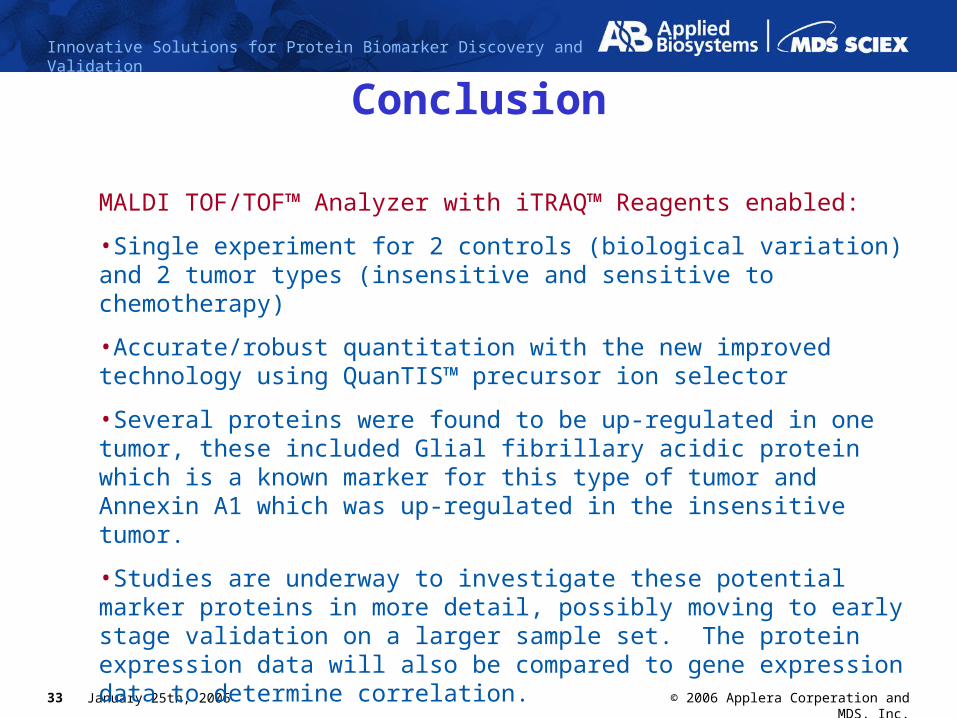
Conclusion
MALDI TOF/TOF™ Analyzer with iTRAQ™ Reagents enabled:
•Single experiment for 2 controls (biological variation) and 2 tumor types (insensitive and sensitive to chemotherapy)
•Accurate/robust quantitation with the new improved technology using QuanTIS™ precursor ion selector
•Several proteins were found to be up-regulated in one tumor, these included Glial fibrillary acidic protein which is a known marker for this type of tumor and Annexin A1 which was up-regulated in the insensitive tumor.
•Studies are underway to investigate these potential marker proteins in more detail, possibly moving to early stage validation on a larger sample set. The protein expression data will also be compared to gene expression data to determine correlation.
34 January 25th, 2006
Innovative Solutions for Protein Biomarker Discovery and Validation
© 2006 Applera Corperation and MDS, Inc.
Biomarker Discovery with a Multiplex Quantitative
Proteomics Platform in Human Cerebral Spinal Fluid of Patients with Various Neurodegenerative
Diseases
Fadi Abdi, Ph.D.
October 14th 2005
35 January 25th, 2006
Innovative Solutions for Protein Biomarker Discovery and Validation
© 2006 Applera Corperation and MDS, Inc.
DLB
label each with 117
Direct spotting onto MALDI
target
MS and MS/MS
Analysis
4800 TOFTOF Analyzer
Organic Fractionation
Normal AD PD
Parallel reduction, alkylation, digestion for each fraction
Strong Cation Fractionation
Combine all Fraction 1s, Fraction 2s and Fraction 3s
RP LC-MALDI for each fraction
Organic Fractionation Organic Fractionation Organic Fractionation
1 2 3 1 2 3
label each with 114
label each with 115
label each with 116
1 2 3
1 2 3 1 2 3 1 2 3 1 2 3
1 2 3 1 2 3
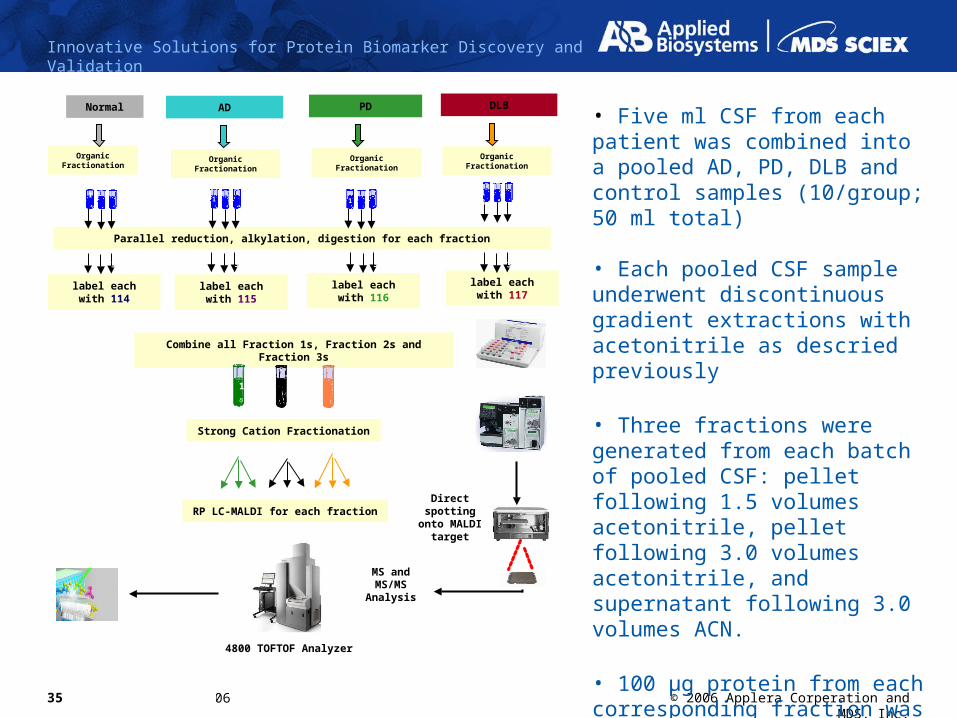
• Five ml CSF from each patient was combined into a pooled AD, PD, DLB and control samples (10/group; 50 ml total) • Each pooled CSF sample underwent discontinuous gradient extractions with acetonitrile as descried previously
• Three fractions were generated from each batch of pooled CSF: pellet following 1.5 volumes acetonitrile, pellet following 3.0 volumes acetonitrile, and supernatant following 3.0 volumes ACN.
• 100 μg protein from each corresponding fraction was digested with trypsin and then labeled with one of the four iTRAQTM reagents
36 January 25th, 2006
Innovative Solutions for Protein Biomarker Discovery and Validation
© 2006 Applera Corperation and MDS, Inc.
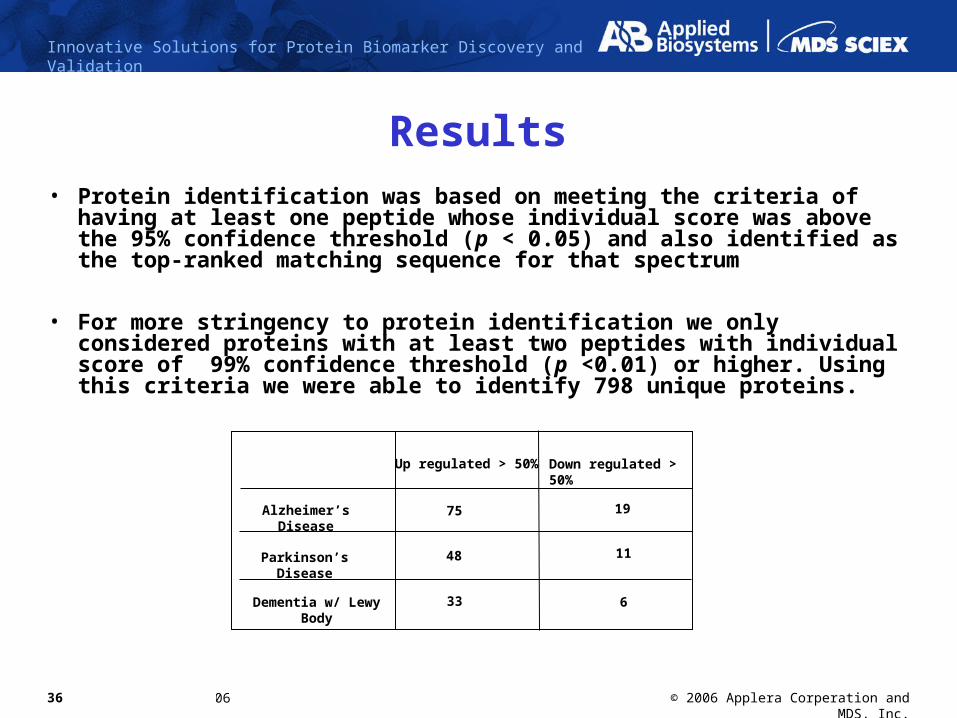
Down regulated > 50%Up regulated > 50%
Alzheimer’s Disease
Parkinson’s Disease
Dementia w/ Lewy Body
75
48
33
19
11
6
Results• Protein identification was based on meeting the criteria of having at least one
peptide whose individual score was above the 95% confidence threshold (p < 0.05) and also identified as the top-ranked matching sequence for that spectrum
• For more stringency to protein identification we only considered proteins with at least two peptides with individual score of 99% confidence threshold (p <0.01) or higher. Using this criteria we were able to identify 798 unique proteins.
37 January 25th, 2006
Innovative Solutions for Protein Biomarker Discovery and Validation
© 2006 Applera Corperation and MDS, Inc.
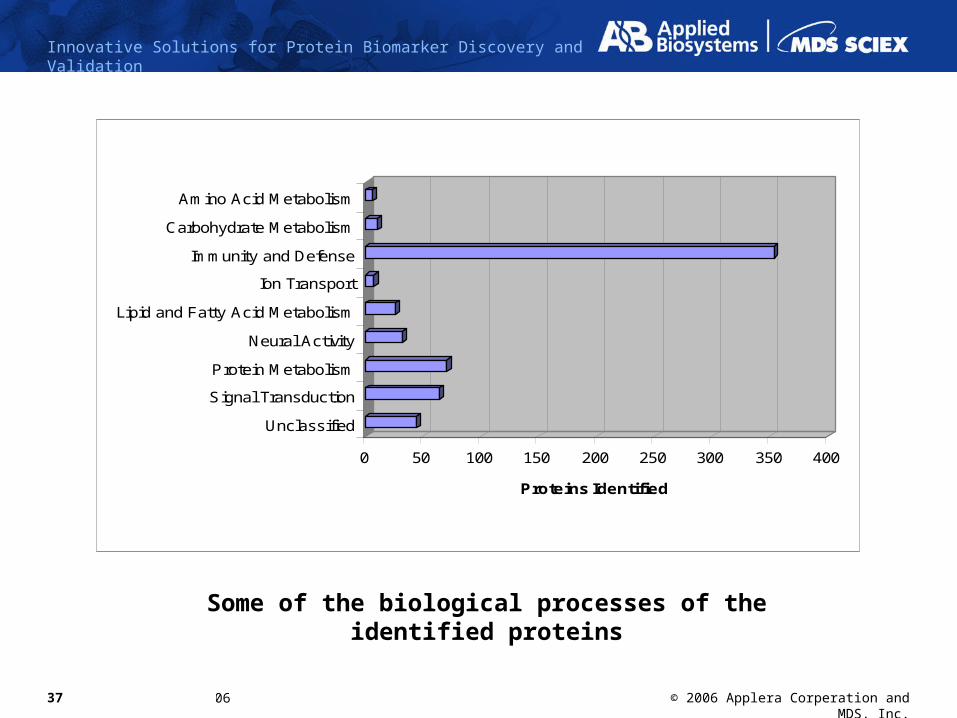
0 50 100 150 200 250 300 350 400
Proteins Identified
Unclassified
Signal Transduction
Protein Metabolism
Neural Activity
Lipid and Fatty Acid Metabolism
Ion Transport
Immunity and Defense
Carbohydrate Metabolism
Amino Acid Metabolism
Some of the biological processes of the identified proteins
38 January 25th, 2006
Innovative Solutions for Protein Biomarker Discovery and Validation
© 2006 Applera Corperation and MDS, Inc.
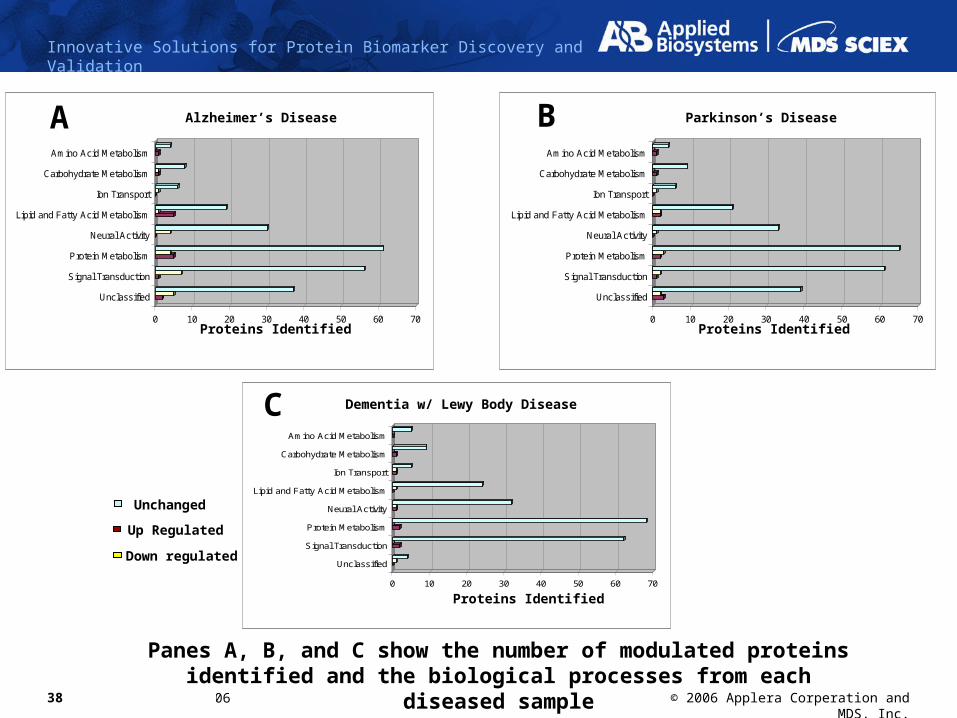
0 10 20 30 40 50 60 70
Unclassified
Signal Transduction
Protein Metabolism
Neural Activity
Lipid and Fatty Acid Metabolism
Ion Transport
Carbohydrate Metabolism
Amino Acid Metabolism
Unchanged
Up Regulated
Down regulated
Dementia w/ Lewy Body Disease
Proteins Identified
0 10 20 30 40 50 60 70
Unclassified
Signal Transduction
Protein Metabolism
Neural Activity
Lipid and Fatty Acid Metabolism
Ion Transport
Carbohydrate Metabolism
Amino Acid Metabolism
Parkinson’s Disease
Proteins Identified0 10 20 30 40 50 60 70
Unclassified
Signal Transduction
Protein Metabolism
Neural Activity
Lipid and Fatty Acid Metabolism
Ion Transport
Carbohydrate Metabolism
Amino Acid Metabolism
Alzheimer’s Disease
Proteins Identified
Panes A, B, and C show the number of modulated proteins identified and the biological processes from each diseased sample
A B
C
39 January 25th, 2006
Innovative Solutions for Protein Biomarker Discovery and Validation
© 2006 Applera Corperation and MDS, Inc.
Conclusions• This approach identified more than 1,000 proteins in human CSF • The majority of identified proteins were involved in cell immunity and
defense, cell signaling, and synaptic transmissions.• Among >1,000 proteins identified, numerous proteins appeared to be
unique to patients with AD, PD and DLB. • Proteins from the Apolipoproteins family were identified in all three
diseases and were modulated when compared to healthy individuals.• Several proteins involved in neural activities and synaptic
transmissions were also identified and seem to be modulated in all three diseases.
• Several of these putative biomarkers have been validated using specific antibodies against CSF samples from individual patients.