Embed Size (px)
Citation preview
J. Adhesion Sci. Technol., Vol. 19, No. 2, pp. 109–141 (2005) VSP 2005.Also available online - www.vsppub.com
Measurement of the mechanical properties of structuraladhesives in tension and shear over a wide rangeof temperatures
LUCAS F. M. DA SILVA 1 and R. D. ADAMS 2,∗1 Department of Mechanical Engineering and Industrial Management, University of Porto,
Rua Dr. Roberto Frias, 4200-465 Porto, Portugal2 Department of Mechanical Engineering, University of Bristol, Queen’s Building, University Walk,
Bristol BS8 1TR, UK
Received in final form 11 December 2004
Abstract—The aim of this study was to select suitable adhesives for use in a mixed adhesive jointand to measure their mechanical properties over a wide range of temperatures. Three adhesives wereselected: a bismaleimide adhesive (Redux 326) for high temperatures and two paste-form epoxies(Hysol EA 9359.3 and Supreme 10HT) for low temperatures. The mechanical properties in tension(dogbone specimens) and in shear (thick adherend shear test) are presented from −55 to 200◦Cfor all three adhesives. Dynamic tests were also carried out to confirm the static modulus results.The correlations between the tensile and the shear properties are reasonable in terms of stiffnessand strength but are poor in terms of ductility. In a single-lap joint, Redux 326 is stronger at hightemperatures as it becomes more ductile. However, it is very stiff and brittle until 100◦C. Supreme10HT has very good performance up to 100◦C. The combination of Redux 326 and Supreme 10HTformed a joint that had a good load carrying capacity from −55 to 200◦C.
Keywords: Epoxy; high temperature adhesives; dynamic mechanical analysis; lap-shear; mechanicalproperties of adhesives.
NOMENCLATURE
E Young’s modulus
f natural frequency
G shear modulus
I second moment of area
∗To whom correspondence should be addressed. Tel.: (44-117) 928-7743. Fax: (44-117) 929-4423.E-mail: [email protected]
110 L. F. M. da Silva and R. D. Adams
k geometric factor
l length
R universal gas constant
T temperature
t thickness
Tg glass transition temperature
Vf fibre volume fraction
w width
�H activation energy
�EI flexural rigidity
Greek
ε Tensile strain
γ Shear strain
λ ratio of yield stress in compression to the yield stress in tension
ν Poisson’s ratio
ρ density
σ tensile stress
τ Shear stress
Subscripts
a adhesive
al aluminium
c compound
ref reference material
s steel
spec specimen
1. INTRODUCTION
Adhesive joints used in supersonic aircraft need to withstand low temperatures(down to −55◦C) when travelling subsonically at high altitude and high temper-atures (200◦C or so) when travelling at Mach 2 or above [1]. Adhesives suitablefor high temperatures are generally very brittle at low temperatures. On the otherhand, adhesives for low temperature use are too weak or degrade at high tempera-tures. Current commercial adhesives, therefore, are by no means ideal from −55◦Cto 200◦C. Therefore, a solution would be a suitably-designed joint with a combina-tion of a low-temperature adhesive and a high-temperature adhesive.
Effect of temperature on mechanical properties of adhesives 111
At high temperatures, the low-temperature adhesive may be very ductile andcreep, but it must not degrade. If the high-temperature adhesive fails at lowtemperatures, then it cannot carry any load at high temperatures. There is anuncertainty for each adhesive outside its range of application. Therefore, themechanical properties need to be measured, from low to high temperatures, for bothtypes of adhesives in order for a suitable joint to be designed.
Below the glass transition temperature (Tg), as the temperature decreases, boththe modulus and strength increase while the ductility decreases. The lap shearstrength increases with the adhesive ductility up to the best compromise betweenductility, strength and stiffness. At Tg there is a rapid reduction in both the modulusand strength as the temperature increases, and the adhesive can no longer carrya substantial load. An optimal joint for both low and high temperatures can beobtained as long as the adhesive is loaded in the temperature range for which it hasbeen designed. By reducing the peak stresses and choosing the right adhesive ora mixture of adhesives, it may be possible to overcome the problem. The mixedmodulus concept described by Hart-Smith [2] is that at high temperatures, a brittleadhesive (high modulus) in the middle of the joint retains the strength and transfersthe entire load, while at low temperatures a ductile adhesive at the ends of theoverlap (low modulus) is the load-bearing component, making the high-temperatureadhesive relatively lightly stressed.
The optimisation of the geometry is carried out by finite element analysis (FEA)to make sure that the joint performs well at both low and high temperatures, as wellas at intermediate temperatures. This analytical evaluation needs the mechanicalproperties of the proposed adhesives for both low and high temperatures. FEA is awell-established technique [3], but is still being developed and refined [4–10].
2. EXPERIMENTAL
2.1. Adhesives selected
For high-temperature applications (above 200◦C), the adhesives used are eitherbismaleimides or polyimides, and are generally supplied as films. Film adhesivescan be supported, i.e., with a carrier, or be unsupported, i.e., without a carrier.In general, carriers can be of nylon, polyester or glass (usually preferable at hightemperatures) fibres and their structure can be non-woven, woven or knitted. Thecarrier enables the film to be handled, cut to shape and laid up easily. The carrieralso serves as a bondline thickness limiting device and also controls the adhesiveflow during the cure phase. Although polyimides have good high-temperatureproperties, bismaleimides offer advantages such as the fact that they do not generatevolatiles during cure, thus resulting in less porosity.
The low-temperature adhesive must be ductile and have a higher modulus thanthe high-temperature adhesive, so that the load is transferred mainly through thelow-temperature adhesive. If this is not possible, then the joint can be designed to
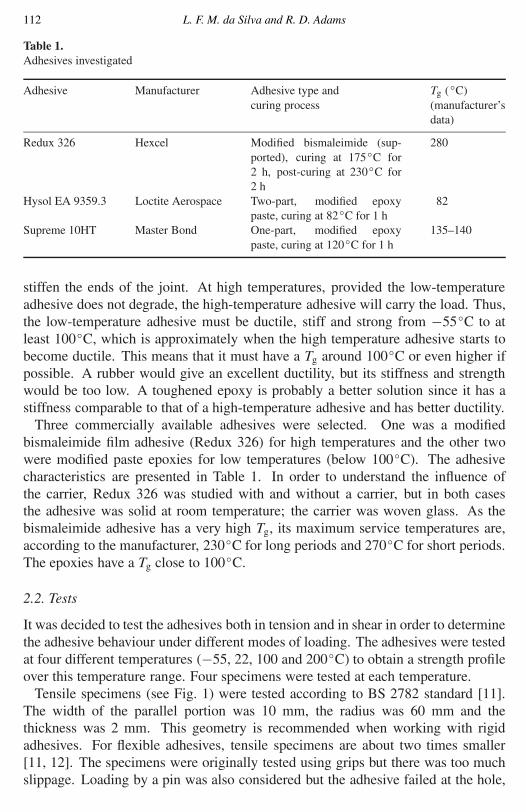
112 L. F. M. da Silva and R. D. Adams
Table 1.Adhesives investigated
Adhesive Manufacturer Adhesive type and Tg (◦C)curing process (manufacturer’s
data)
Redux 326 Hexcel Modified bismaleimide (sup-ported), curing at 175◦C for2 h, post-curing at 230◦C for2 h
280
Hysol EA 9359.3 Loctite Aerospace Two-part, modified epoxypaste, curing at 82◦C for 1 h
82
Supreme 10HT Master Bond One-part, modified epoxypaste, curing at 120◦C for 1 h
135–140
stiffen the ends of the joint. At high temperatures, provided the low-temperatureadhesive does not degrade, the high-temperature adhesive will carry the load. Thus,the low-temperature adhesive must be ductile, stiff and strong from −55◦C to atleast 100◦C, which is approximately when the high temperature adhesive starts tobecome ductile. This means that it must have a Tg around 100◦C or even higher ifpossible. A rubber would give an excellent ductility, but its stiffness and strengthwould be too low. A toughened epoxy is probably a better solution since it has astiffness comparable to that of a high-temperature adhesive and has better ductility.
Three commercially available adhesives were selected. One was a modifiedbismaleimide film adhesive (Redux 326) for high temperatures and the other twowere modified paste epoxies for low temperatures (below 100◦C). The adhesivecharacteristics are presented in Table 1. In order to understand the influence ofthe carrier, Redux 326 was studied with and without a carrier, but in both casesthe adhesive was solid at room temperature; the carrier was woven glass. As thebismaleimide adhesive has a very high Tg, its maximum service temperatures are,according to the manufacturer, 230◦C for long periods and 270◦C for short periods.The epoxies have a Tg close to 100◦C.
2.2. Tests
It was decided to test the adhesives both in tension and in shear in order to determinethe adhesive behaviour under different modes of loading. The adhesives were testedat four different temperatures (−55, 22, 100 and 200◦C) to obtain a strength profileover this temperature range. Four specimens were tested at each temperature.
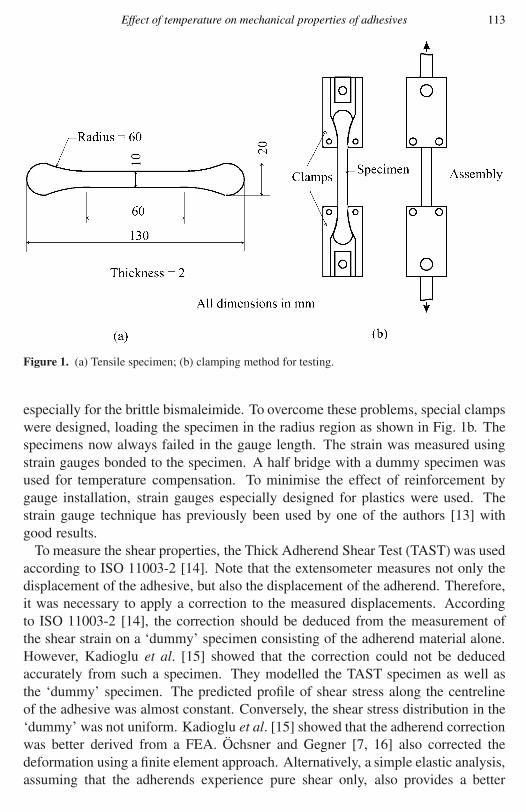
Tensile specimens (see Fig. 1) were tested according to BS 2782 standard [11].The width of the parallel portion was 10 mm, the radius was 60 mm and thethickness was 2 mm. This geometry is recommended when working with rigidadhesives. For flexible adhesives, tensile specimens are about two times smaller[11, 12]. The specimens were originally tested using grips but there was too muchslippage. Loading by a pin was also considered but the adhesive failed at the hole,
Effect of temperature on mechanical properties of adhesives 113
Figure 1. (a) Tensile specimen; (b) clamping method for testing.
especially for the brittle bismaleimide. To overcome these problems, special clampswere designed, loading the specimen in the radius region as shown in Fig. 1b. Thespecimens now always failed in the gauge length. The strain was measured usingstrain gauges bonded to the specimen. A half bridge with a dummy specimen wasused for temperature compensation. To minimise the effect of reinforcement bygauge installation, strain gauges especially designed for plastics were used. Thestrain gauge technique has previously been used by one of the authors [13] withgood results.
To measure the shear properties, the Thick Adherend Shear Test (TAST) was usedaccording to ISO 11003-2 [14]. Note that the extensometer measures not only thedisplacement of the adhesive, but also the displacement of the adherend. Therefore,it was necessary to apply a correction to the measured displacements. Accordingto ISO 11003-2 [14], the correction should be deduced from the measurement ofthe shear strain on a ‘dummy’ specimen consisting of the adherend material alone.However, Kadioglu et al. [15] showed that the correction could not be deducedaccurately from such a specimen. They modelled the TAST specimen as well asthe ‘dummy’ specimen. The predicted profile of shear stress along the centrelineof the adhesive was almost constant. Conversely, the shear stress distribution in the‘dummy’ was not uniform. Kadioglu et al. [15] showed that the adherend correctionwas better derived from a FEA. Öchsner and Gegner [7, 16] also corrected thedeformation using a finite element approach. Alternatively, a simple elastic analysis,assuming that the adherends experience pure shear only, also provides a better
114 L. F. M. da Silva and R. D. Adams
correction than a dummy specimen [15]. This method was used here. The bondlinethickness was nominally 0.5 mm.
As regards the specimen fabrication, ISO 11003-2 [14] recommends machining(cutting) the specimens from two plates bonded together. Kadioglu et al. [15]proposed that a better solution is to machine the adherends to the correct dimensionsbefore bonding, which enables the reuse of the adherends and avoids riskingdamaging the adhesive by machining. A specially built jig was used for aligning andholding the specimens. To control the adhesive fillet, steel shims were inserted intothe gaps once the adherends had been brought together. The shims were inserted atthe ends of the bond and, after the adhesive was cured, the shims were removed bygently tapping them out of the gap, leaving an accurate termination of the adhesivein the overlap with no fillet.
In addition, single-lap joints (SLJs) were fabricated and tested to assess theadhesive performance in a joint. Hard steel adherends were used. The width was25 mm, the overlap 12.5 mm and the bondline thickness 0.12 mm.
Dynamic tests to assess the tensile and shear moduli were also performed toconfirm the static results. Their description is presented at a later stage in this paper.
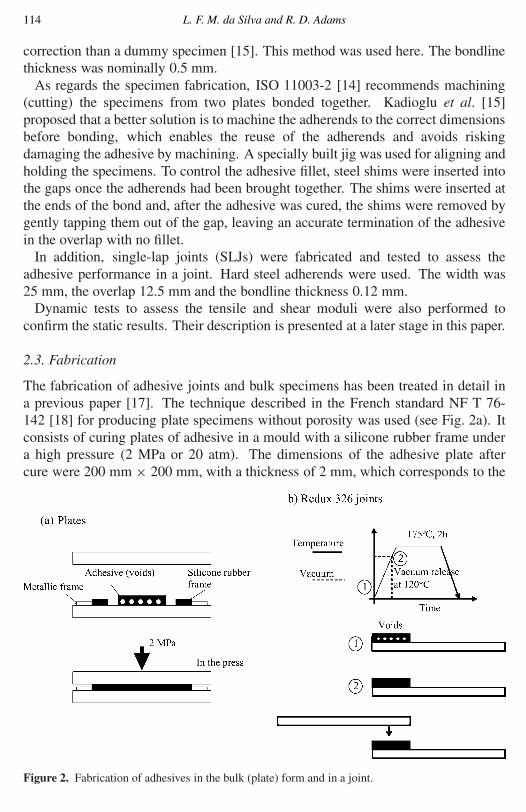
2.3. Fabrication
The fabrication of adhesive joints and bulk specimens has been treated in detail ina previous paper [17]. The technique described in the French standard NF T 76-142 [18] for producing plate specimens without porosity was used (see Fig. 2a). Itconsists of curing plates of adhesive in a mould with a silicone rubber frame undera high pressure (2 MPa or 20 atm). The dimensions of the adhesive plate aftercure were 200 mm × 200 mm, with a thickness of 2 mm, which corresponds to the
Figure 2. Fabrication of adhesives in the bulk (plate) form and in a joint.
Effect of temperature on mechanical properties of adhesives 115
internal dimensions of the silicone rubber frame. A quantity of adhesive slightlygreater than the volume corresponding to the internal part of the silicone rubberframe is first placed in the centre part of the mould. There is a gap, initially, betweenthe adhesive and the silicone rubber frame. At the moment of the application ofpressure, this gap enables the adhesive to be displaced, so as to avoid air entrapment.The lid eventually touches the silicone rubber frame and subjects the adhesive toa high pressure because the mould is perfectly sealed. The high pressure causesthe remaining voids to be compressed and also gives a good surface finish. Thespecimens were then cut to shape.
As regards the bismaleimide joints, the first joints we produced contained manyvoids. To fabricate joints free of voids, the vacuum release technique proposed byBascom and Cottington [19] was modified and adopted (see Fig. 2b). The joint wasplaced in an oven under vacuum without the upper adherend (point 1 in Fig. 2b).The temperature was increased to a point at which the adhesive was most fluid,so that when the vacuum was released the voids collapsed to a negligible volume(point 2 in Fig. 2b). The vacuum release technique was applied without the upperadherend to facilitate the evacuation of air. After the vacuum had been released,the adhesive was largely free of voids and at its most fluid state so that it could wetthe upper adherend adequately. The upper adherend was then placed on top and thejoint allowed to cure.
3. RESULTS AND DISCUSSION
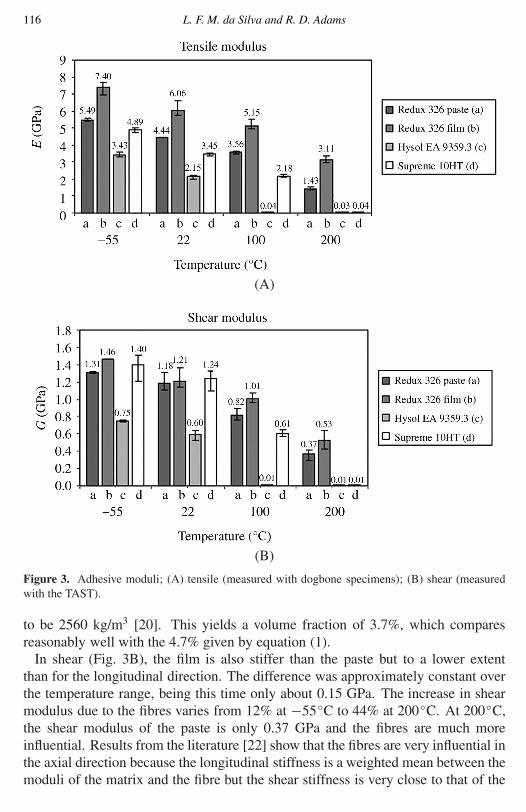
3.1. Stiffness
3.1.1. Static results. The results are presented in Fig. 3. In tension (Fig. 3A),the bismaleimide in the supported film form is stiffer than in the paste form. Thedifference between the film tensile modulus and the matrix tensile modulus isapproximately constant over the temperature range, being about 1.8 GPa. Thisdifference is due to the presence of the glass carrier. The increase in Young’smodulus due to the fibres varies from 35% at −55◦C to 118% at 200◦C. At200◦C the Young’s modulus of the paste is only 1.43 GPa and the fibres are muchmore influential. The modulus of a fibrous composite when loaded along the fibredirection is a linear combination of that of the fibres and the matrix [20]:
Efilm = VfEglass + (1 − Vf)Epaste, (1)
where E is the Young’s modulus and Vf the fibre volume fraction. However, thecarrier is a cross-weave of fibres, so that the actual volume fraction is twice thatused in equation (1). Supposing that the modulus of glass is 76 GPa [20], the valuegiven by equation (1) multiplied by two gives a volume fraction of 4.7%. The fibrevolume fraction can also be estimated by the density measurement method [21]. Thedensity of the Redux 326 supported film was found to be 1330 kg/m3, the densityof the Redux 326 paste 1280 kg/m3 and the density of the glass fibre was taken
116 L. F. M. da Silva and R. D. Adams
(A)
(B)
Figure 3. Adhesive moduli; (A) tensile (measured with dogbone specimens); (B) shear (measuredwith the TAST).
to be 2560 kg/m3 [20]. This yields a volume fraction of 3.7%, which comparesreasonably well with the 4.7% given by equation (1).
In shear (Fig. 3B), the film is also stiffer than the paste but to a lower extentthan for the longitudinal direction. The difference was approximately constant overthe temperature range, being this time only about 0.15 GPa. The increase in shearmodulus due to the fibres varies from 12% at −55◦C to 44% at 200◦C. At 200◦C,the shear modulus of the paste is only 0.37 GPa and the fibres are much moreinfluential. Results from the literature [22] show that the fibres are very influential inthe axial direction because the longitudinal stiffness is a weighted mean between themoduli of the matrix and the fibre but the shear stiffness is very close to that of the
Effect of temperature on mechanical properties of adhesives 117
matrix up to a relatively high volume fraction. This is in accordance with the resultspresented here, when the matrix is relatively stiff at −55◦C (Epaste = 5.49 GPa),22◦C (Epaste = 4.44 GPa) and 100◦C (Epaste = 3.56 GPa). But at 200◦C(Epaste = 1.43 GPa), where the adhesive has a low stiffness, the fibres give aparticularly high increase even in shear. Hysol EA 9359.3 is stiff up to 22◦C, butthere is a dramatic drop in stiffness at 100◦C as it is above its Tg (82◦C). Supreme10HT has a reasonable stiffness at 100◦C (2.2 GPa in tension) but at 200◦C themodulus is very low because the adhesive is in its rubbery state (Tg is 135◦C).
The tensile modulus trend given by the static results contains only four points.To confirm and complete these results, dynamic tests were performed under flexurefrom −55 to 200◦C. These results are presented in the next section.
3.1.2. Dynamic results.
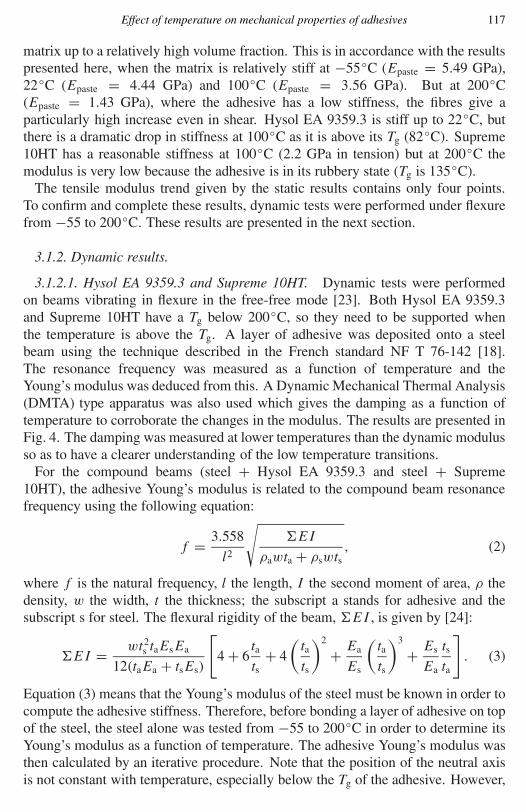
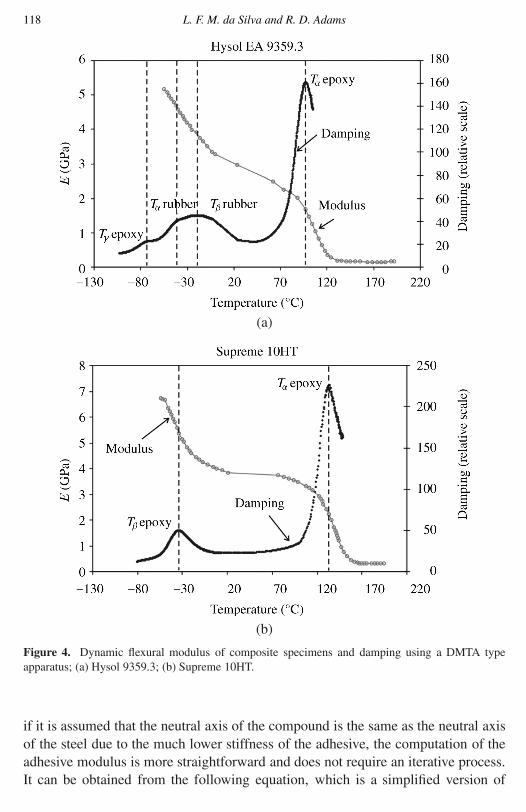
3.1.2.1. Hysol EA 9359.3 and Supreme 10HT. Dynamic tests were performedon beams vibrating in flexure in the free-free mode [23]. Both Hysol EA 9359.3and Supreme 10HT have a Tg below 200◦C, so they need to be supported whenthe temperature is above the Tg. A layer of adhesive was deposited onto a steelbeam using the technique described in the French standard NF T 76-142 [18].The resonance frequency was measured as a function of temperature and theYoung’s modulus was deduced from this. A Dynamic Mechanical Thermal Analysis(DMTA) type apparatus was also used which gives the damping as a function oftemperature to corroborate the changes in the modulus. The results are presented inFig. 4. The damping was measured at lower temperatures than the dynamic modulusso as to have a clearer understanding of the low temperature transitions.
For the compound beams (steel + Hysol EA 9359.3 and steel + Supreme10HT), the adhesive Young’s modulus is related to the compound beam resonancefrequency using the following equation:
f = 3.558
l2
√�EI
ρawta + ρswts, (2)
where f is the natural frequency, l the length, I the second moment of area, ρ thedensity, w the width, t the thickness; the subscript a stands for adhesive and thesubscript s for steel. The flexural rigidity of the beam, �EI , is given by [24]:
�EI = wt2s taEsEa
12(taEa + tsEs)
[4 + 6
ta
ts+ 4
(ta
ts
)2
+ Ea
Es
(ta
ts
)3
+ Es
Ea
ts
ta
]. (3)
Equation (3) means that the Young’s modulus of the steel must be known in order tocompute the adhesive stiffness. Therefore, before bonding a layer of adhesive on topof the steel, the steel alone was tested from −55 to 200◦C in order to determine itsYoung’s modulus as a function of temperature. The adhesive Young’s modulus wasthen calculated by an iterative procedure. Note that the position of the neutral axisis not constant with temperature, especially below the Tg of the adhesive. However,
118 L. F. M. da Silva and R. D. Adams
(a)
(b)
Figure 4. Dynamic flexural modulus of composite specimens and damping using a DMTA typeapparatus; (a) Hysol 9359.3; (b) Supreme 10HT.
if it is assumed that the neutral axis of the compound is the same as the neutral axisof the steel due to the much lower stiffness of the adhesive, the computation of theadhesive modulus is more straightforward and does not require an iterative process.It can be obtained from the following equation, which is a simplified version of
Effect of temperature on mechanical properties of adhesives 119
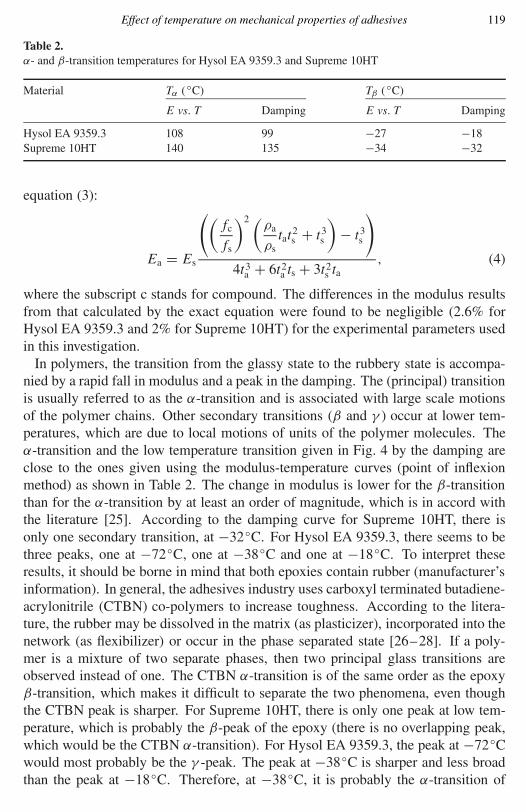
Table 2.α- and β-transition temperatures for Hysol EA 9359.3 and Supreme 10HT
Material Tα (◦C) Tβ (◦C)
E vs. T Damping E vs. T Damping
Hysol EA 9359.3 108 99 −27 −18Supreme 10HT 140 135 −34 −32
equation (3):
Ea = Es
((fc
fs
)2 (ρa
ρstat
2s + t3
s
)− t3
s
)
4t3a + 6t2
a ts + 3t2s ta
, (4)
where the subscript c stands for compound. The differences in the modulus resultsfrom that calculated by the exact equation were found to be negligible (2.6% forHysol EA 9359.3 and 2% for Supreme 10HT) for the experimental parameters usedin this investigation.
In polymers, the transition from the glassy state to the rubbery state is accompa-nied by a rapid fall in modulus and a peak in the damping. The (principal) transitionis usually referred to as the α-transition and is associated with large scale motionsof the polymer chains. Other secondary transitions (β and γ ) occur at lower tem-peratures, which are due to local motions of units of the polymer molecules. Theα-transition and the low temperature transition given in Fig. 4 by the damping areclose to the ones given using the modulus-temperature curves (point of inflexionmethod) as shown in Table 2. The change in modulus is lower for the β-transitionthan for the α-transition by at least an order of magnitude, which is in accord withthe literature [25]. According to the damping curve for Supreme 10HT, there isonly one secondary transition, at −32◦C. For Hysol EA 9359.3, there seems to bethree peaks, one at −72◦C, one at −38◦C and one at −18◦C. To interpret theseresults, it should be borne in mind that both epoxies contain rubber (manufacturer’sinformation). In general, the adhesives industry uses carboxyl terminated butadiene-acrylonitrile (CTBN) co-polymers to increase toughness. According to the litera-ture, the rubber may be dissolved in the matrix (as plasticizer), incorporated into thenetwork (as flexibilizer) or occur in the phase separated state [26–28]. If a poly-mer is a mixture of two separate phases, then two principal glass transitions areobserved instead of one. The CTBN α-transition is of the same order as the epoxyβ-transition, which makes it difficult to separate the two phenomena, even thoughthe CTBN peak is sharper. For Supreme 10HT, there is only one peak at low tem-perature, which is probably the β-peak of the epoxy (there is no overlapping peak,which would be the CTBN α-transition). For Hysol EA 9359.3, the peak at −72◦Cwould most probably be the γ -peak. The peak at −38◦C is sharper and less broadthan the peak at −18◦C. Therefore, at −38◦C, it is probably the α-transition of
120 L. F. M. da Silva and R. D. Adams
(a)
(b)
Figure 5. SEM micrographs of fracture surfaces of dogbone specimens tested in tension at roomtemperature. (a) Supreme 10HT (×5000) and (b) Hysol 9359.3 (×5000).
Effect of temperature on mechanical properties of adhesives 121
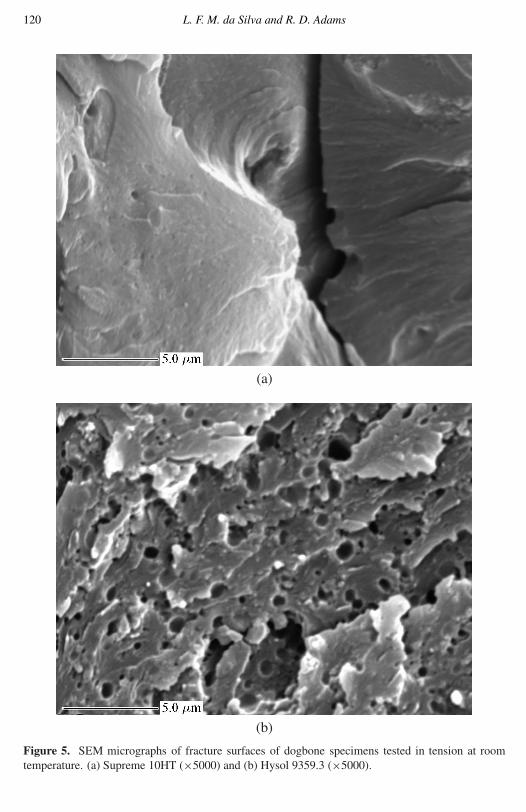
the rubber and at −18◦C it is the β-transition of the epoxy. The Hysol EA 9359.3tensile specimens showed a large amount of whitening when stressed to beyond itselastic limit, which could be due to cavitation caused by the rubber particles. Thiswas not apparent for Supreme 10HT. The rubber in Supreme 10HT would, there-fore, seem to be acting as a plasticizer or a flexibilizer. To support the dampingresults, the fracture surface of a dogbone specimen tested at room temperature wasobserved in a scanning electronic microscope (SEM) in order to check for the rub-ber particles. Supreme 10HT (Fig. 5a) shows no evidence of holes, whereas HysolEA 9359.3 (Fig. 5b) has many holes, corresponding to the rubber particles.
3.1.2.2. Redux 326. The manufacturer’s value for the α-transition of Redux 326is 280◦C, so a plain beam was used in this case for testing both the film and pasteforms of the adhesive.
The Young’s modulus calculation from the frequency is quite straightforward. Thefrequency is related to the adhesive modulus by the following equation (23):
f = 1.027w
l2
√Ea
ρa. (5)
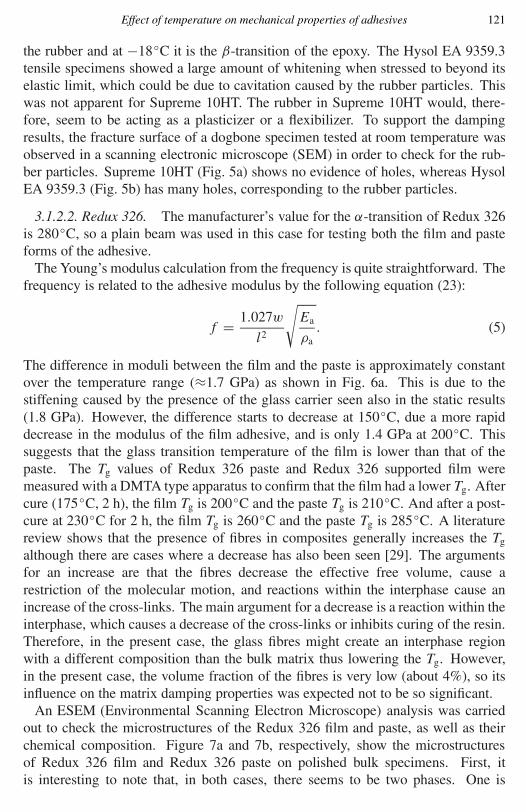
The difference in moduli between the film and the paste is approximately constantover the temperature range (≈1.7 GPa) as shown in Fig. 6a. This is due to thestiffening caused by the presence of the glass carrier seen also in the static results(1.8 GPa). However, the difference starts to decrease at 150◦C, due a more rapiddecrease in the modulus of the film adhesive, and is only 1.4 GPa at 200◦C. Thissuggests that the glass transition temperature of the film is lower than that of thepaste. The Tg values of Redux 326 paste and Redux 326 supported film weremeasured with a DMTA type apparatus to confirm that the film had a lower Tg. Aftercure (175◦C, 2 h), the film Tg is 200◦C and the paste Tg is 210◦C. And after a post-cure at 230◦C for 2 h, the film Tg is 260◦C and the paste Tg is 285◦C. A literaturereview shows that the presence of fibres in composites generally increases the Tg
although there are cases where a decrease has also been seen [29]. The argumentsfor an increase are that the fibres decrease the effective free volume, cause arestriction of the molecular motion, and reactions within the interphase cause anincrease of the cross-links. The main argument for a decrease is a reaction within theinterphase, which causes a decrease of the cross-links or inhibits curing of the resin.Therefore, in the present case, the glass fibres might create an interphase regionwith a different composition than the bulk matrix thus lowering the Tg. However,in the present case, the volume fraction of the fibres is very low (about 4%), so itsinfluence on the matrix damping properties was expected not to be so significant.
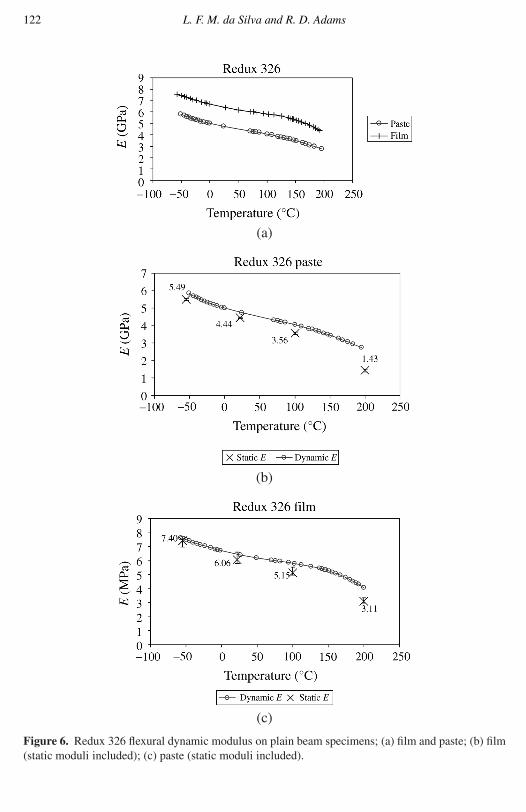
An ESEM (Environmental Scanning Electron Microscope) analysis was carriedout to check the microstructures of the Redux 326 film and paste, as well as theirchemical composition. Figure 7a and 7b, respectively, show the microstructuresof Redux 326 film and Redux 326 paste on polished bulk specimens. First, itis interesting to note that, in both cases, there seems to be two phases. One is
122 L. F. M. da Silva and R. D. Adams
(a)
(b)
(c)
Figure 6. Redux 326 flexural dynamic modulus on plain beam specimens; (a) film and paste; (b) film(static moduli included); (c) paste (static moduli included).
Effect of temperature on mechanical properties of adhesives 123
(a)
(b)
Figure 7. Microstructures of polished specimens of (a) Redux 326 supported film (×175) and(b) Redux 326 paste (×1000) (ESEM).
124 L. F. M. da Silva and R. D. Adams
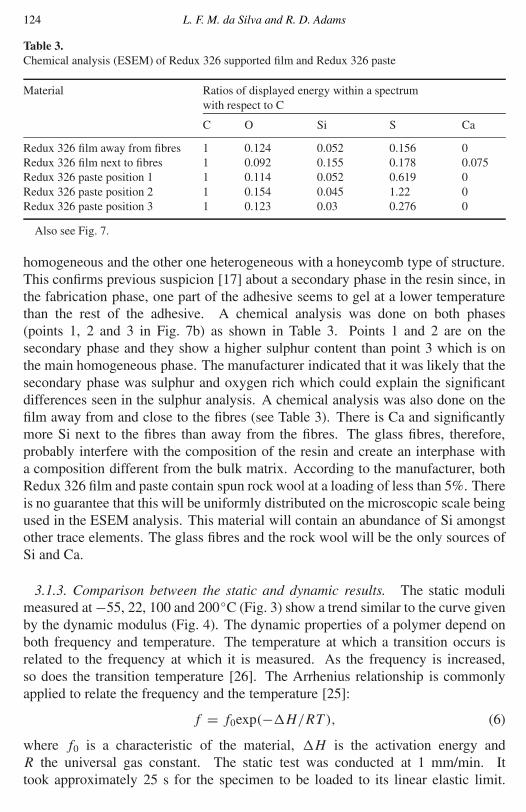
Table 3.Chemical analysis (ESEM) of Redux 326 supported film and Redux 326 paste
Material Ratios of displayed energy within a spectrumwith respect to C
C O Si S Ca
Redux 326 film away from fibres 1 0.124 0.052 0.156 0Redux 326 film next to fibres 1 0.092 0.155 0.178 0.075Redux 326 paste position 1 1 0.114 0.052 0.619 0Redux 326 paste position 2 1 0.154 0.045 1.22 0Redux 326 paste position 3 1 0.123 0.03 0.276 0
Also see Fig. 7.
homogeneous and the other one heterogeneous with a honeycomb type of structure.This confirms previous suspicion [17] about a secondary phase in the resin since, inthe fabrication phase, one part of the adhesive seems to gel at a lower temperaturethan the rest of the adhesive. A chemical analysis was done on both phases(points 1, 2 and 3 in Fig. 7b) as shown in Table 3. Points 1 and 2 are on thesecondary phase and they show a higher sulphur content than point 3 which is onthe main homogeneous phase. The manufacturer indicated that it was likely that thesecondary phase was sulphur and oxygen rich which could explain the significantdifferences seen in the sulphur analysis. A chemical analysis was also done on thefilm away from and close to the fibres (see Table 3). There is Ca and significantlymore Si next to the fibres than away from the fibres. The glass fibres, therefore,probably interfere with the composition of the resin and create an interphase witha composition different from the bulk matrix. According to the manufacturer, bothRedux 326 film and paste contain spun rock wool at a loading of less than 5%. Thereis no guarantee that this will be uniformly distributed on the microscopic scale beingused in the ESEM analysis. This material will contain an abundance of Si amongstother trace elements. The glass fibres and the rock wool will be the only sources ofSi and Ca.
3.1.3. Comparison between the static and dynamic results. The static modulimeasured at −55, 22, 100 and 200◦C (Fig. 3) show a trend similar to the curve givenby the dynamic modulus (Fig. 4). The dynamic properties of a polymer depend onboth frequency and temperature. The temperature at which a transition occurs isrelated to the frequency at which it is measured. As the frequency is increased,so does the transition temperature [26]. The Arrhenius relationship is commonlyapplied to relate the frequency and the temperature [25]:
f = f0exp(−�H/RT ), (6)
where f0 is a characteristic of the material, �H is the activation energy andR the universal gas constant. The static test was conducted at 1 mm/min. Ittook approximately 25 s for the specimen to be loaded to its linear elastic limit.
Effect of temperature on mechanical properties of adhesives 125
Table 4.Static α- and β-transition temperatures prediction of Hysol EA 9359.3 and Supreme 10HT from thedynamic E vs. T curve measured on steel/adhesive composite beams, using the Arrhenius relationship
Hysol SupremeEA 9359.3 10HT
α-transition Dynamic f1 (Hz) 369.4 360.5T1 (◦C) 108 140
Static f2 (Hz) 0.01 0.01T2 (◦C) 80 107
�T (T1 − T2) 28 33
β-transition Dynamic f1 (Hz) 384.8 383.3T1 (◦C) −27 −34
Static f2 (Hz) 0.01 0.01T2 (◦C) −78 −82
�T (T1 − T2) 51 48
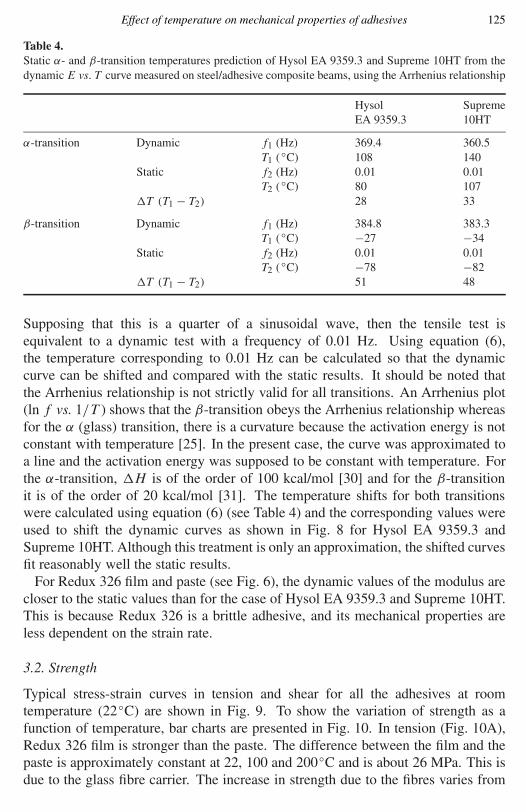
Supposing that this is a quarter of a sinusoidal wave, then the tensile test isequivalent to a dynamic test with a frequency of 0.01 Hz. Using equation (6),the temperature corresponding to 0.01 Hz can be calculated so that the dynamiccurve can be shifted and compared with the static results. It should be noted thatthe Arrhenius relationship is not strictly valid for all transitions. An Arrhenius plot(ln f vs. 1/T ) shows that the β-transition obeys the Arrhenius relationship whereasfor the α (glass) transition, there is a curvature because the activation energy is notconstant with temperature [25]. In the present case, the curve was approximated toa line and the activation energy was supposed to be constant with temperature. Forthe α-transition, �H is of the order of 100 kcal/mol [30] and for the β-transitionit is of the order of 20 kcal/mol [31]. The temperature shifts for both transitionswere calculated using equation (6) (see Table 4) and the corresponding values wereused to shift the dynamic curves as shown in Fig. 8 for Hysol EA 9359.3 andSupreme 10HT. Although this treatment is only an approximation, the shifted curvesfit reasonably well the static results.
For Redux 326 film and paste (see Fig. 6), the dynamic values of the modulus arecloser to the static values than for the case of Hysol EA 9359.3 and Supreme 10HT.This is because Redux 326 is a brittle adhesive, and its mechanical properties areless dependent on the strain rate.
3.2. Strength
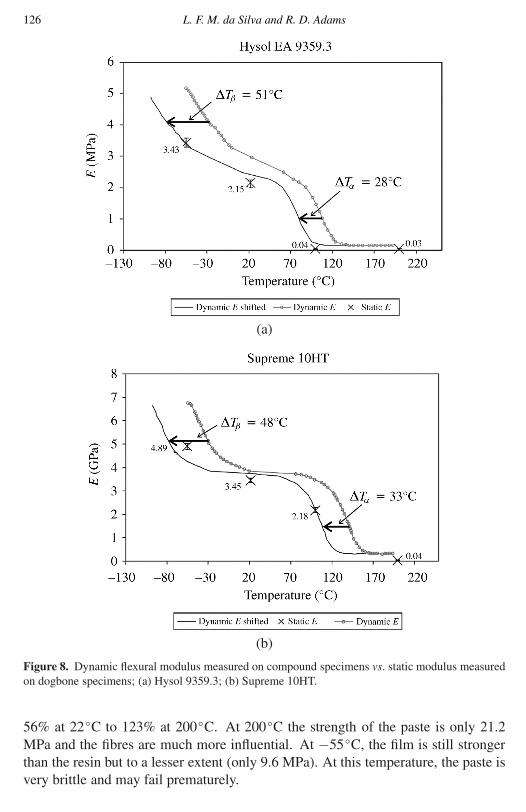
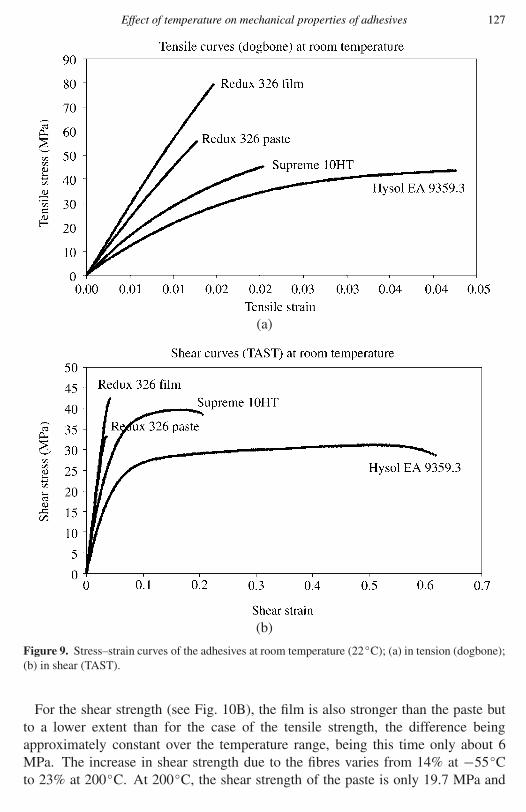
Typical stress-strain curves in tension and shear for all the adhesives at roomtemperature (22◦C) are shown in Fig. 9. To show the variation of strength as afunction of temperature, bar charts are presented in Fig. 10. In tension (Fig. 10A),Redux 326 film is stronger than the paste. The difference between the film and thepaste is approximately constant at 22, 100 and 200◦C and is about 26 MPa. This isdue to the glass fibre carrier. The increase in strength due to the fibres varies from
126 L. F. M. da Silva and R. D. Adams
(a)
(b)
Figure 8. Dynamic flexural modulus measured on compound specimens vs. static modulus measuredon dogbone specimens; (a) Hysol 9359.3; (b) Supreme 10HT.
56% at 22◦C to 123% at 200◦C. At 200◦C the strength of the paste is only 21.2MPa and the fibres are much more influential. At −55◦C, the film is still strongerthan the resin but to a lesser extent (only 9.6 MPa). At this temperature, the paste isvery brittle and may fail prematurely.
Effect of temperature on mechanical properties of adhesives 127
(a)
(b)
Figure 9. Stress–strain curves of the adhesives at room temperature (22◦C); (a) in tension (dogbone);(b) in shear (TAST).
For the shear strength (see Fig. 10B), the film is also stronger than the paste butto a lower extent than for the case of the tensile strength, the difference beingapproximately constant over the temperature range, being this time only about 6MPa. The increase in shear strength due to the fibres varies from 14% at −55◦Cto 23% at 200◦C. At 200◦C, the shear strength of the paste is only 19.7 MPa and
128 L. F. M. da Silva and R. D. Adams
the fibres are much more influential. Similar comments can be made for the filmbehaviour in terms of stiffness as for the strength. The glass fibre carrier is veryinfluential in the longitudinal direction but has very little effect in shear. The axialstrength follows the rule of mixtures, whereas the shear strength is quite close to thatof the matrix, unless the fibre volume fraction is very high [20]. However, when theTg is approached, the adhesive modulus and strength reduce and the fibres becomemore influential, even in shear.
The strength trend for Hysol EA 9359.3 and Supreme 10HT (see Fig. 10) is thesame as for the stiffness. At 100◦C, Hysol EA 9359.3 has very little strength,
(A)
(B)
Figure 10. Adhesive strengths; (A) tensile strength (measured with dogbone specimens); (B) shearstrength (measured with the TAST).
Effect of temperature on mechanical properties of adhesives 129
whereas Supreme 10HT is still relatively strong. At 200◦C, both adhesives are veryweak. These results are in accord with the Tg values. Below the Tg, the adhesivesare stiff and strong; above the Tg, they are very soft and cannot carry a substantialload. The Tg of Supreme 10HT is higher than that of Hysol EA 9359.3, and itwill, therefore, be able to carry the load to a higher temperature than when used incombination with Redux 326.
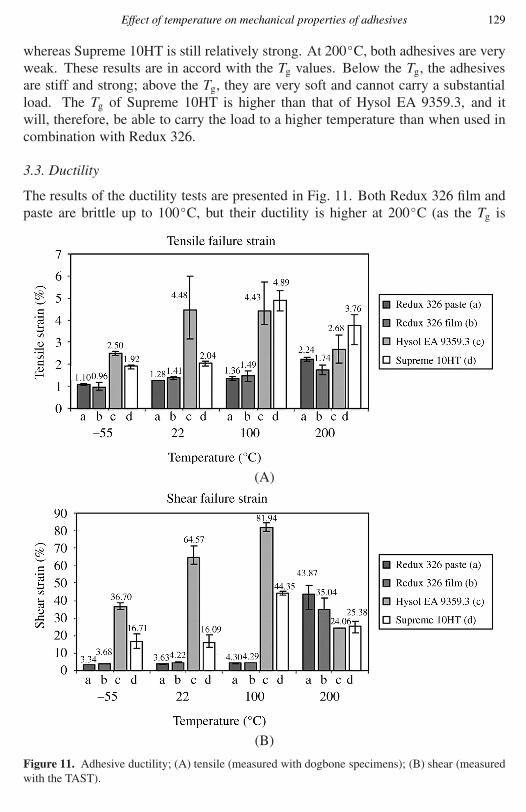
3.3. Ductility
The results of the ductility tests are presented in Fig. 11. Both Redux 326 film andpaste are brittle up to 100◦C, but their ductility is higher at 200◦C (as the Tg is
(A)
(B)
Figure 11. Adhesive ductility; (A) tensile (measured with dogbone specimens); (B) shear (measuredwith the TAST).
130 L. F. M. da Silva and R. D. Adams
approached). This is especially evident in shear (Fig. 11B). If a ductile adhesive isto be used in combination with Redux 326, it must, therefore, be able to carry theload up to 100◦C. While Hysol EA 9359.3 is stiff, strong and ductile up to 22◦C, at100◦C, it is near its Tg and is, therefore, not suitable to be used with Redux 326 in abi-material joint. Supreme 10HT is stiff, strong and ductile up to 100◦C. Therefore,Supreme 10HT is suitable for use with Redux 326. Note that the maximum shearstrain for both Supreme 10HT and Hysol EA 9359.3 increases with temperature upto 100◦C, but drops at 200◦C as if they have become brittle. We must, therefore, becareful, as the tensile strain to failure might be a problem even though it has 25%shear strain to failure. This result was surprising, but is in accord with the literature[30] where it is said that at high temperatures (above the Tg), the polymers areextremely soft, but the strain to failure may again decrease and give an apparentlybrittle behaviour.
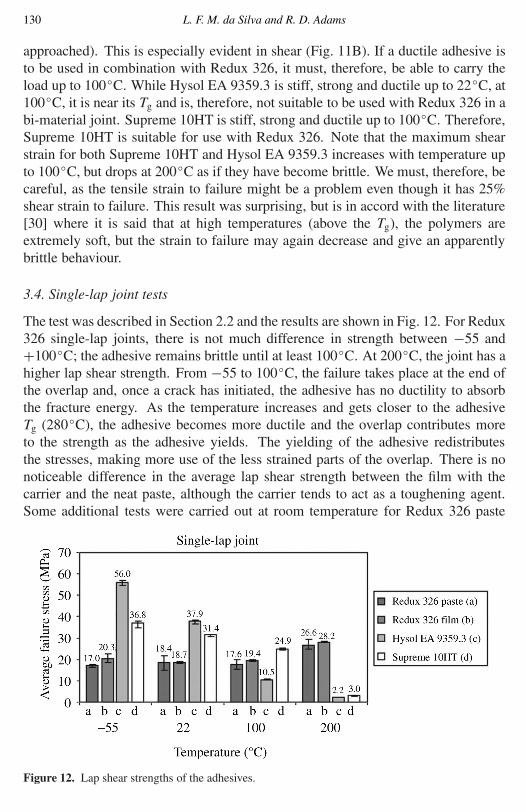
3.4. Single-lap joint tests
The test was described in Section 2.2 and the results are shown in Fig. 12. For Redux326 single-lap joints, there is not much difference in strength between −55 and+100◦C; the adhesive remains brittle until at least 100◦C. At 200◦C, the joint has ahigher lap shear strength. From −55 to 100◦C, the failure takes place at the end ofthe overlap and, once a crack has initiated, the adhesive has no ductility to absorbthe fracture energy. As the temperature increases and gets closer to the adhesiveTg (280◦C), the adhesive becomes more ductile and the overlap contributes moreto the strength as the adhesive yields. The yielding of the adhesive redistributesthe stresses, making more use of the less strained parts of the overlap. There is nonoticeable difference in the average lap shear strength between the film with thecarrier and the neat paste, although the carrier tends to act as a toughening agent.Some additional tests were carried out at room temperature for Redux 326 paste
Figure 12. Lap shear strengths of the adhesives.
Effect of temperature on mechanical properties of adhesives 131
without post-cure. The lap shear strength obtained was 14.9 MPa, which is 81% ofthe lap shear strength of Redux 326 paste with post-cure (18.4 MPa). This resultwas rather surprising as one would have expected the adhesive without post-cure tobe more ductile and, consequently, to give a higher lap shear strength. However, thisresult shows that the post-cure is a very important stage and must not be omitted.
Hysol EA 9359.3 has the best average failure stress at −55 and +22◦C. Atthese temperatures it has the best combination of stiffness, strength and ductility.However, its Tg is too low to be used in conjunction with the high-temperatureadhesive as it is unable to cover the intermediate temperature range where Redux326 is brittle.
Supreme 10HT has very good performance up to 100◦C. In a mixed adhesivejoint with Redux 326, it can be the load-bearing component until at least 100◦C. At200◦C, it is above its Tg, but Redux 326 is now more ductile and can carry the loadsafely.
3.5. Tension vs. shear
3.5.1. Stiffness. For isotropic bulk materials, the shear modulus is related to thetensile modulus by the following equation:
G = E
2(1 + ν), (7)
where G is the shear modulus. From tests on bulk specimens in tension, the shearmodulus can be derived and vice versa. The value of Poisson’s ratio typically variesbetween 0.3 and 0.5; it was measured on bulk tensile specimens with two straingauges, one in the direction of loading and the other rotated through 90◦. At 22◦C,ν was 0.35 for the Redux 326 paste, 0.38 for Hysol EA 9359.3 and 0.36 for Supreme10HT.
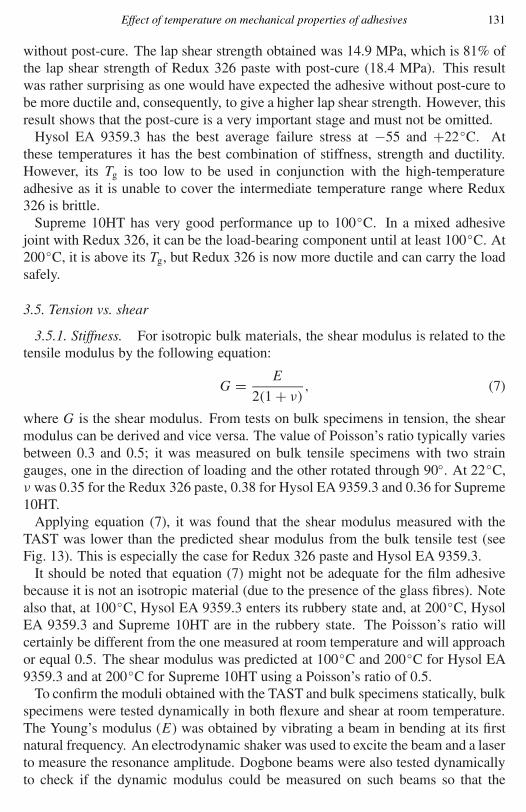
Applying equation (7), it was found that the shear modulus measured with theTAST was lower than the predicted shear modulus from the bulk tensile test (seeFig. 13). This is especially the case for Redux 326 paste and Hysol EA 9359.3.
It should be noted that equation (7) might not be adequate for the film adhesivebecause it is not an isotropic material (due to the presence of the glass fibres). Notealso that, at 100◦C, Hysol EA 9359.3 enters its rubbery state and, at 200◦C, HysolEA 9359.3 and Supreme 10HT are in the rubbery state. The Poisson’s ratio willcertainly be different from the one measured at room temperature and will approachor equal 0.5. The shear modulus was predicted at 100◦C and 200◦C for Hysol EA9359.3 and at 200◦C for Supreme 10HT using a Poisson’s ratio of 0.5.
To confirm the moduli obtained with the TAST and bulk specimens statically, bulkspecimens were tested dynamically in both flexure and shear at room temperature.The Young’s modulus (E) was obtained by vibrating a beam in bending at its firstnatural frequency. An electrodynamic shaker was used to excite the beam and a laserto measure the resonance amplitude. Dogbone beams were also tested dynamicallyto check if the dynamic modulus could be measured on such beams so that the
132 L. F. M. da Silva and R. D. Adams
Figure 13. Ratio of shear modulus measured by the TAST method and the shear modulus predictedfrom the tension test at different temperatures.
same specimen could be tested both dynamically and statically. Note that there isno closed-form solution for the resonance frequencies of vibration of the dogbonespecimen. However, if the dogbone specimen is made of a known material (e.g.,aluminium), then E can be computed, since the geometric factors are the same forall materials. Thus,
f = k
√E
ρ,
f 2a
f 2al
=k2 Ea
ρa
k2Eal
ρal
,
or
Ea = f 2a ρaEal
f 2alρal
, (8)
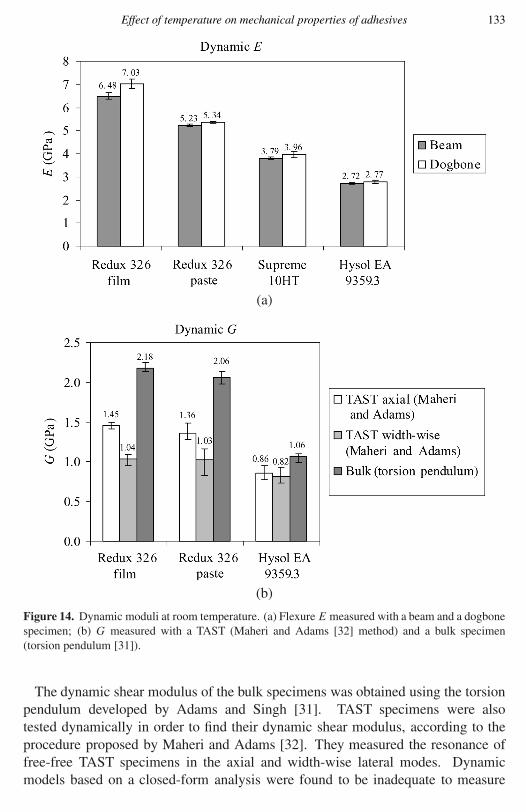
where k is a geometric factor and the subscript al stands for aluminium. Analuminium dogbone specimen was fabricated with exactly the same dimensions asthe adhesive dogbone. The Young’s modulus of the aluminium was first determinedwith a plain beam and it was found to be 71.033 GPa. The density of this aluminiumwas 2689 kg/m3. The first flexural natural frequency for the aluminium dogbonebeam was 568 Hz. Then, according to equation (8), it is only necessary to measurethe natural frequency of the adhesive dogbone and its density to compute its Young’smodulus. It was found that the dogbone specimens gave a modulus quite close to theone given by the beam with a uniform shape as shown in Fig. 14a. This means that,before testing a dogbone specimen destructively, the dynamic modulus can first bemeasured on that same specimen.
Effect of temperature on mechanical properties of adhesives 133
(a)
(b)
Figure 14. Dynamic moduli at room temperature. (a) Flexure E measured with a beam and a dogbonespecimen; (b) G measured with a TAST (Maheri and Adams [32] method) and a bulk specimen(torsion pendulum [31]).
The dynamic shear modulus of the bulk specimens was obtained using the torsionpendulum developed by Adams and Singh [31]. TAST specimens were alsotested dynamically in order to find their dynamic shear modulus, according to theprocedure proposed by Maheri and Adams [32]. They measured the resonance offree-free TAST specimens in the axial and width-wise lateral modes. Dynamicmodels based on a closed-form analysis were found to be inadequate to measure
134 L. F. M. da Silva and R. D. Adams
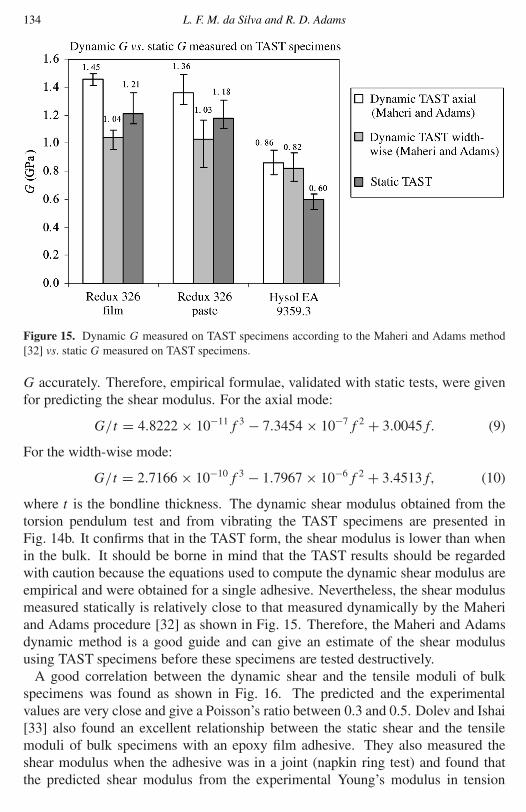
Figure 15. Dynamic G measured on TAST specimens according to the Maheri and Adams method[32] vs. static G measured on TAST specimens.
G accurately. Therefore, empirical formulae, validated with static tests, were givenfor predicting the shear modulus. For the axial mode:
G/t = 4.8222 × 10⁻¹¹f 3 − 7.3454 × 10⁻⁷f 2 + 3.0045f. (9)
For the width-wise mode:
G/t = 2.7166 × 10⁻¹⁰f 3 − 1.7967 × 10⁻⁶f 2 + 3.4513f, (10)
where t is the bondline thickness. The dynamic shear modulus obtained from thetorsion pendulum test and from vibrating the TAST specimens are presented inFig. 14b. It confirms that in the TAST form, the shear modulus is lower than whenin the bulk. It should be borne in mind that the TAST results should be regardedwith caution because the equations used to compute the dynamic shear modulus areempirical and were obtained for a single adhesive. Nevertheless, the shear modulusmeasured statically is relatively close to that measured dynamically by the Maheriand Adams procedure [32] as shown in Fig. 15. Therefore, the Maheri and Adamsdynamic method is a good guide and can give an estimate of the shear modulususing TAST specimens before these specimens are tested destructively.
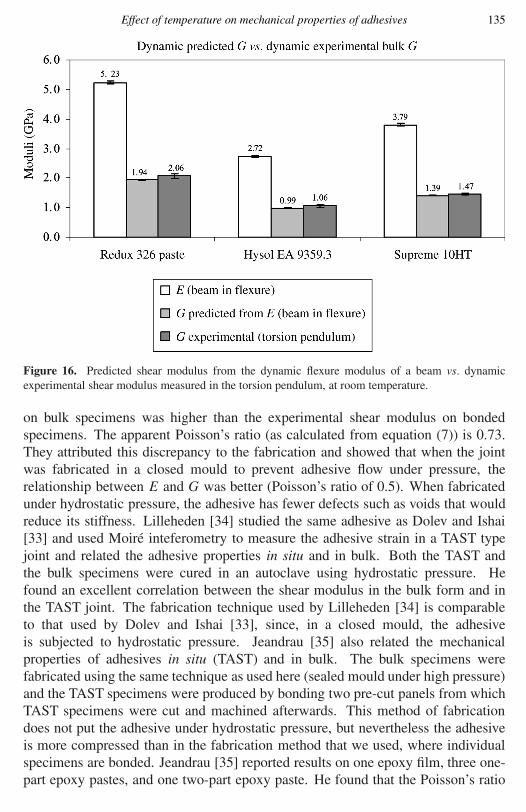
A good correlation between the dynamic shear and the tensile moduli of bulkspecimens was found as shown in Fig. 16. The predicted and the experimentalvalues are very close and give a Poisson’s ratio between 0.3 and 0.5. Dolev and Ishai[33] also found an excellent relationship between the static shear and the tensilemoduli of bulk specimens with an epoxy film adhesive. They also measured theshear modulus when the adhesive was in a joint (napkin ring test) and found thatthe predicted shear modulus from the experimental Young’s modulus in tension
Effect of temperature on mechanical properties of adhesives 135
Figure 16. Predicted shear modulus from the dynamic flexure modulus of a beam vs. dynamicexperimental shear modulus measured in the torsion pendulum, at room temperature.
on bulk specimens was higher than the experimental shear modulus on bondedspecimens. The apparent Poisson’s ratio (as calculated from equation (7)) is 0.73.They attributed this discrepancy to the fabrication and showed that when the jointwas fabricated in a closed mould to prevent adhesive flow under pressure, therelationship between E and G was better (Poisson’s ratio of 0.5). When fabricatedunder hydrostatic pressure, the adhesive has fewer defects such as voids that wouldreduce its stiffness. Lilleheden [34] studied the same adhesive as Dolev and Ishai[33] and used Moiré inteferometry to measure the adhesive strain in a TAST typejoint and related the adhesive properties in situ and in bulk. Both the TAST andthe bulk specimens were cured in an autoclave using hydrostatic pressure. Hefound an excellent correlation between the shear modulus in the bulk form and inthe TAST joint. The fabrication technique used by Lilleheden [34] is comparableto that used by Dolev and Ishai [33], since, in a closed mould, the adhesiveis subjected to hydrostatic pressure. Jeandrau [35] also related the mechanicalproperties of adhesives in situ (TAST) and in bulk. The bulk specimens werefabricated using the same technique as used here (sealed mould under high pressure)and the TAST specimens were produced by bonding two pre-cut panels from whichTAST specimens were cut and machined afterwards. This method of fabricationdoes not put the adhesive under hydrostatic pressure, but nevertheless the adhesiveis more compressed than in the fabrication method that we used, where individualspecimens are bonded. Jeandrau [35] reported results on one epoxy film, three one-part epoxy pastes, and one two-part epoxy paste. He found that the Poisson’s ratio
136 L. F. M. da Silva and R. D. Adams
given by the experimental Young’s modulus in bulk specimens and the experimentalshear modulus with the TAST was 0.36 for the epoxy film, 0.6 for the one-part epoxypaste and 0.66 for the two-part epoxy paste. Therefore, depending on the type ofadhesive, the relationship between E in a bulk specimen and G in a joint varies,the worst case being for the two-part adhesive. Two-part adhesives require mixingwhich leads to voids if the adhesive is not under hydrostatic pressure, as was thecase in the TAST specimen fabrication. In the present work, it was found that therelationship between E in a bulk specimen and G in a joint was not so good for thetwo-part adhesive Hysol EA 9359.3 (Poisson’s ratio of 0.74 at room temperature)nor for the bismaleimide adhesive Redux 326 (Poisson’s ratio of 0.88 at roomtemperature). The bismaleimide adhesive is a one-part adhesive but its manufactureis not as easy as for an epoxy adhesive and leads to more defects. The relationshipis better for the one-part adhesive Supreme 10HT (Poisson’s ratio of 0.4 at roomtemperature) as it does not require mixing and this leads to fewer voids in the joint.Another one-part adhesive, AV 119 from Vantico (formerly Ciba, Cambridge, UK),was also tested with the TAST (G = 1.00 GPa) and in tension (E = 3.05 GPa) witha bulk specimen, giving a Poisson’s ratio of 0.5. Another point to bear in mind is thenature of the test. Although the extensometer described in ISO 11003-2 [14] enablesvery precise and accurate measurements of adhesive deformations, there are severalsources of error, such as the measurement of specimen dimensions, the position ofthe extensometer and the adherend correction. Vaughn [36] estimated that the effectof the potential sources of error on the measurement of the shear modulus couldbe as much as ±12.7%. The calculated Poisson’s ratio using equation (7) is, infact, affected by test and fabrication limitations and, thus, is not a real Poisson’sratio. It would be better if the TAST specimens were produced with the adhesiveunder hydrostatic pressure, to guarantee that the adhesive was in the same stateboth in the bulk form and in the TAST joint. One possibility would be to usea fabrication method based on the French standard NF T 76-142 [18] previouslymentioned, where two plates could be bonded together with a silicone rubber frameand then specimens could be cut according to the TAST standard dimensions.
3.5.2. Strength and ductility. When the effect of the volumetric component ofthe stress is negligible, the shear properties (strength and ductility) can be predictedby the following two equations [35], which are derived from the von Mises criterion,
τ = σ√3, (11)
γ = 2ε(1 + ν)√3
, (12)
where τ is the shear stress, σ the tensile stress and γ the shear strain. However,unlike metals, polymer behaviour depends on both the hydrostatic and deviatoricstress components. The modelling of adhesives is a complex problem that is stillunder development [12, 37]. There are three main pressure-dependent yield criteria
Effect of temperature on mechanical properties of adhesives 137
(a)
(b)
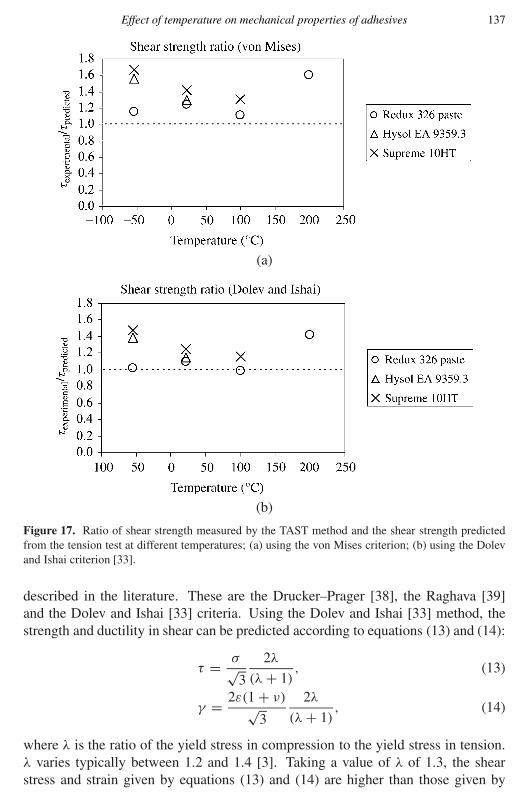
Figure 17. Ratio of shear strength measured by the TAST method and the shear strength predictedfrom the tension test at different temperatures; (a) using the von Mises criterion; (b) using the Dolevand Ishai criterion [33].
described in the literature. These are the Drucker–Prager [38], the Raghava [39]and the Dolev and Ishai [33] criteria. Using the Dolev and Ishai [33] method, thestrength and ductility in shear can be predicted according to equations (13) and (14):
τ = σ√3
2λ
(λ + 1), (13)
γ = 2ε(1 + ν)√3
2λ
(λ + 1), (14)
where λ is the ratio of the yield stress in compression to the yield stress in tension.λ varies typically between 1.2 and 1.4 [3]. Taking a value of λ of 1.3, the shearstress and strain given by equations (13) and (14) are higher than those given by
138 L. F. M. da Silva and R. D. Adams
(a)
(b)
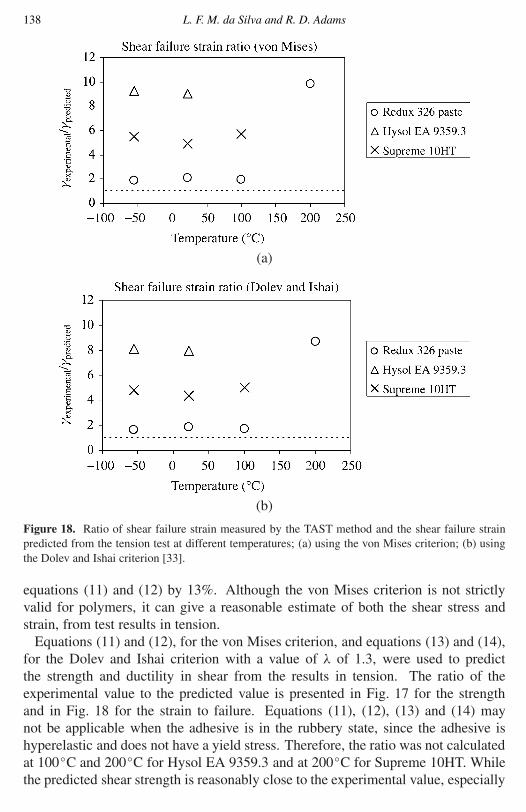
Figure 18. Ratio of shear failure strain measured by the TAST method and the shear failure strainpredicted from the tension test at different temperatures; (a) using the von Mises criterion; (b) usingthe Dolev and Ishai criterion [33].
equations (11) and (12) by 13%. Although the von Mises criterion is not strictlyvalid for polymers, it can give a reasonable estimate of both the shear stress andstrain, from test results in tension.
Equations (11) and (12), for the von Mises criterion, and equations (13) and (14),for the Dolev and Ishai criterion with a value of λ of 1.3, were used to predictthe strength and ductility in shear from the results in tension. The ratio of theexperimental value to the predicted value is presented in Fig. 17 for the strengthand in Fig. 18 for the strain to failure. Equations (11), (12), (13) and (14) maynot be applicable when the adhesive is in the rubbery state, since the adhesive ishyperelastic and does not have a yield stress. Therefore, the ratio was not calculatedat 100◦C and 200◦C for Hysol EA 9359.3 and at 200◦C for Supreme 10HT. Whilethe predicted shear strength is reasonably close to the experimental value, especially
Effect of temperature on mechanical properties of adhesives 139
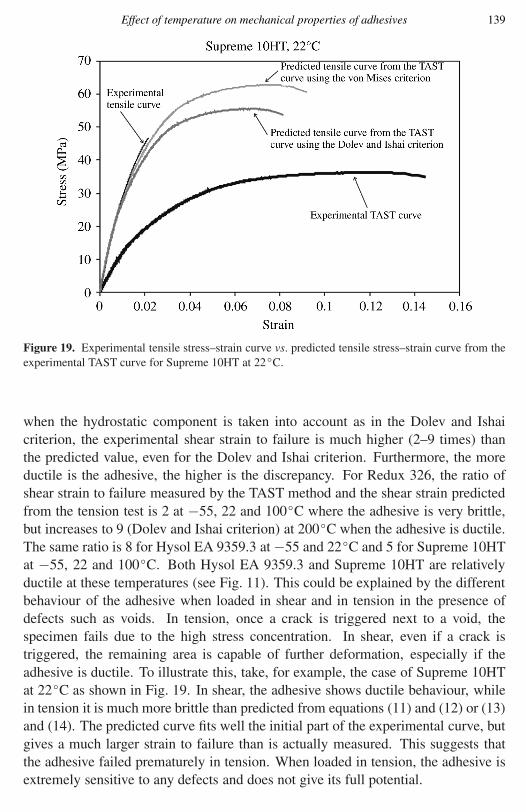
Figure 19. Experimental tensile stress–strain curve vs. predicted tensile stress–strain curve from theexperimental TAST curve for Supreme 10HT at 22◦C.
when the hydrostatic component is taken into account as in the Dolev and Ishaicriterion, the experimental shear strain to failure is much higher (2–9 times) thanthe predicted value, even for the Dolev and Ishai criterion. Furthermore, the moreductile is the adhesive, the higher is the discrepancy. For Redux 326, the ratio ofshear strain to failure measured by the TAST method and the shear strain predictedfrom the tension test is 2 at −55, 22 and 100◦C where the adhesive is very brittle,but increases to 9 (Dolev and Ishai criterion) at 200◦C when the adhesive is ductile.The same ratio is 8 for Hysol EA 9359.3 at −55 and 22◦C and 5 for Supreme 10HTat −55, 22 and 100◦C. Both Hysol EA 9359.3 and Supreme 10HT are relativelyductile at these temperatures (see Fig. 11). This could be explained by the differentbehaviour of the adhesive when loaded in shear and in tension in the presence ofdefects such as voids. In tension, once a crack is triggered next to a void, thespecimen fails due to the high stress concentration. In shear, even if a crack istriggered, the remaining area is capable of further deformation, especially if theadhesive is ductile. To illustrate this, take, for example, the case of Supreme 10HTat 22◦C as shown in Fig. 19. In shear, the adhesive shows ductile behaviour, whilein tension it is much more brittle than predicted from equations (11) and (12) or (13)and (14). The predicted curve fits well the initial part of the experimental curve, butgives a much larger strain to failure than is actually measured. This suggests thatthe adhesive failed prematurely in tension. When loaded in tension, the adhesive isextremely sensitive to any defects and does not give its full potential.
140 L. F. M. da Silva and R. D. Adams
4. CONCLUSIONS
1. Supported film adhesives behave like low volume fraction composites where thefibres are very influential in tension but not so much in shear. Note that, in ajoint, the adhesive is primarily loaded in shear or peel, especially for the single-lap joint. Whether in shear or in peel, supported film adhesives will behavemuch like a paste adhesive. In peel, the adhesive is loaded in the transversedirection; so in this case, the modulus is close to the modulus of the pasteadhesive. Therefore, the failure will be mostly governed by the properties ofthe adhesive. The single-lap joint results prove this, as the differences betweenpaste and film are very small.
2. The correlation between the tensile tests on bulk specimens and the TAST isreasonable in terms of both modulus and strength.
3. The adhesive is much more ductile in shear than in tension; therefore, thecomplete shear curve cannot be deduced from the tensile curve.
4. In a mixed adhesive joint with Redux 326 and Supreme 10HT, it is expectedthat, at high temperatures, Redux 326 in the middle of the joint will retain thestrength and transfer the entire load and, at low temperatures, Supreme 10HT atthe ends of the joint will be the load-bearing adhesive. This proposition needs tobe investigated through simulation and testing and will be the subject of futurework.
Acknowledgements
L. F. M. da S. would like to thank the Calouste Gulbenkian Foundation for supportwhile conducting this research as well as the Fundação para a Ciência e Tecnologia(project POCTI/43525/EME/2000).
REFERENCES
1. P. M. Hergenrother, SAMPE J. 36, 30–41 (2000).2. L. J. Hart-Smith, Analysis and Design of Advanced Composite Bonded Joints, NASA CR-2218.
NASA, Langley, VA (1974).3. R. D. Adams, J. Comyn and W. C. Wake, Structural Adhesive Joints in Engineering, 2nd edn.
Chapman & Hall, London (1997).4. R. H. Andruet, D. A. Dillard and S. M. Holzer, Int. J. Adhesion Adhesives 21, 17–34 (2001).5. E. Serrano, Int. J. Adhesion Adhesives 21, 115–127 (2001).6. G. Li and P. Lee-Sullivan, Int. J. Adhesion Adhesives 21, 211–220 (2001).7. A. Öchsner and J. Gegner, Int. J. Adhesion Adhesives 21, 349–353 (2001).8. R. H. Kaye and M. Heller, Int. J. Adhesion Adhesives 22, 7–21 (2002).9. J. P. M. Gonçalves, M. F. S. F. de Moura and P. M. S. T. de Castro, Int. J. Adhesion Adhesives
22, 357–365 (2002).10. L. Tong and X. Sun, Int. J. Adhesion Adhesives 23, 349–364 (2003).11. BS 2782 Methods of Testing Plastics, Part 3: Mechanical Properties. Methods 320A to 320F for
tensile strength, elongation and elastic modulus (1976).
Effect of temperature on mechanical properties of adhesives 141
12. B. Duncan and G. Dean, Int. J. Adhesion Adhesives 23, 141–149 (2003).13. J. A. Harris and R. D. Adams, Int. J. Adhesion Adhesives 4, 65–78 (1984).14. ISO 11003-2: 1993 (E), Adhesives — Determination of shear behaviour of structural bonds, Part
2: Thick-adherend tensile-test method (1993).15. F. Kadioglu, L. F. Vaughn, F. J. Guild and R. D. Adams, J. Adhesion 78, 355–381 (2002).16. A. Öchsner and J. Gegner, Int. J. Adhesion Adhesives 24, 37–41 (2004).17. L. F. M. da Silva, R. D. Adams and M. Gibbs, Int. J. Adhesion Adhesives 24, 69–83 (2004).18. NF T 76-142, Méthode de préparation de plaques d’adhésifs structuraux pour la réalisation
d’éprouvettes d’éssai de caractérisation (1988) (in French).19. W. D. Bascom and R. L. Cottington, J. Adhesion 4, 193–209 (1972).20. D. Hull and T. W. Clyne, An Introduction to Composite Materials, 2nd edn. Cambridge
University Press, Cambridge (1996).21. P. T. Curtis, Crag test methods for the measurement of the engineering properties of fibre re-
inforced plastics. Royal Aerospace Establishment (UK) TR 88012. Royal Aerospace Establish-ment, Bedford (1988).
22. R. D. Adams, M. A. O. Fox, R. J. L. Flood, R. J. Friend and R. L. Hewitt, J. Composite Mater.3, 594–603 (1969).
23. J. P. Den Hartog, Mechanical Vibrations, 4th edn. McGraw-Hill, New York, NY (1956).24. R. J. Roark, Roark’s Formulas for Stress and Strain, 6th edn. McGraw-Hill, New York, NY
(1989).25. I. M. Ward, Mechanical Properties of Solid Polymers, 2nd edn. John Wiley & Sons, Chichester
(1983).26. P. Bussi and H. Ishida, Polymer 35, 956–966 (1994).27. P. Bussi and H. Ishida, J. Polym. Sci.: Part B Polym. Phys. 32, 647–657 (1994).28. C. W. Wise, W. D. Cook and A. A. Goodwin, Polymer 41, 4625–4633 (2000).29. K. E. Atkinson and C. Jones, J. Adhesion 56, 247–260 (1996).30. L. E. Nielsen, Mechanical Properties of Polymers and Composites, Vol. 2. Marcel Dekker, New
York, NY (1974).31. R. D. Adams and M. M. Singh, Composites Part A 32, 797–814 (2001).32. M. R. Maheri and R. D. Adams, Int. J. Adhesion Adhesives 22, 119–127 (2002).33. G. Dolev and O. Ishai, J. Adhesion 12, 283–294 (1981).34. L. Lilleheden, Int. J. Adhesion Adhesives 14, 31–37 (1994).35. J. P. Jeandrau, Int. J. Adhesion Adhesives 11, 71–79 (1991).36. L. F. Vaughn, Measurement of basic mechanical properties of adhesives for design use, PhD
Dissertation, University of Bristol, Bristol (1998).37. X. X. Yu, A. D. Crocombe and G. Richardson, Int. J. Adhesion Adhesives 21, 197–210 (2001).38. D. C. Drucker and W. Prager, Q. Appl. Math. 10, 157–165 (1952).39. R. S. Raghava, R. Cadell and G. S. Y. Yeh, J. Mater. Sci. 8, 225–232 (1973).