Embed Size (px)
Citation preview
1International Helicopter Safety Team Latin America Regional - June 2007
Proven Helicopter Risk Reduction Measures
June 2007
Latin America Regional International Helicopter Safety Symposium
ABRAPHE International Flight Safety Seminar
Sao Paulo, BrazilBob Sheffield
Shell Aircraft Ltd &IHST Executive Committee
2International Helicopter Safety Team Latin America Regional - June 2007
Overview
• The current problem and the goal for improvement
• What’s been proven already• What remains to achieve the goal• Justifying the necessary risk mitigation
measures• Conclusions and summing up
3International Helicopter Safety Team Latin America Regional - June 2007
Three Main Points
• The risk of flying in a helicopter is an order of magnitude greater than in an airliner– we have a problem
• Helicopter safety can be improved significantly – we can fix it:– Proven risk mitigations are available for helicopters.– We need new helicopters built to the latest design standards.
• To be effective at lowest possible cost requires a combined effort from:– Regulators– Manufacturers– Operators
– Their customers - we need your help
4International Helicopter Safety Team Latin America Regional - June 2007
Cooperation is Key
• The best safety records come from those operations where either regulatory oversight or corporate care is highest.
• Corporate care is usually more expensive and less effective when the operators serve customers with different standards.
• If everyone in the industry (manufacturers, operators, regulators, and their customers) works together to implement the known, cost-effective solutions, these risk mitigations will be more effective and less costly.
5International Helicopter Safety Team Latin America Regional - June 2007
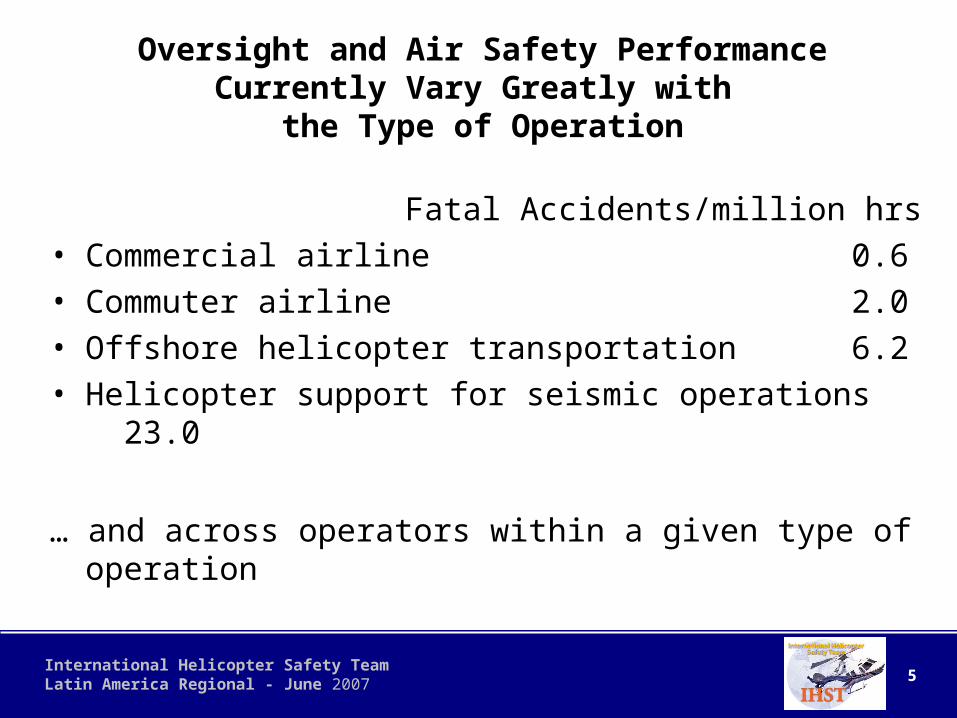
Oversight and Air Safety Performance Currently Vary Greatly with
the Type of Operation
Fatal Accidents/million hrs• Commercial airline 0.6• Commuter airline 2.0• Offshore helicopter transportation 6.2• Helicopter support for seismic operations 23.0
… and across operators within a given type of operation

6International Helicopter Safety Team Latin America Regional - June 2007
While this chart shows helicopter accident rates for the U.S. Gulf of Mexico (GOM) the same trend holds worldwide – the rate is getting worse.
GOM Offshore Accident Rate/100K Hours with 3 Year Moving Average
0.000.501.001.502.002.503.003.504.00
1984
1985
198619
8719
8819
8919
9019
9119
9219
9319
9419
9519
9619
9719
9819
9920
0020
0120
0220
0320
04
Overa
ll
Accidents 3 year moving average)
While airline safety trends are improving,
Helicopter safety trends are not improving.
We know we have a problem, and we are confident that we know how to fix it.
7International Helicopter Safety Team Latin America Regional - June 2007
Opportunities for Safety Improvements
• The airline industry has made significant improvements in its safety record over the last 30 yrs through the introduction of: – Damage tolerant design; system redundancy; improved
reliability/crashworthiness– Modern flight simulators– Engine and vibration monitoring systems to identify incipient failures– Safety Management Systems and Quality Assurance to reduce human
errors– Flight data monitoring programs (FOQA)– Disciplined take-off and landing profiles (e.g. stabilised approach)– EGPWS/TAWS; TCAS
• All of these are available today for helicopter operations and are being implemented in some parts of the helicopter industry.
• However some helicopter industry segments have adopted few of these measures.
• We need to apply all these risk reduction measures to all helicopter operations.

8International Helicopter Safety Team Latin America Regional - June 2007
The Helicopter Safety Goal
• OGP Safety Commitment: “The individual risk per period of flying exposure for an individual flying on OGP contracted business should be no greater than on the average global airline.”
• This goal coincides with IHST’s goal of reducing the current helicopter accident rate by 80%.
• This presentation will show you how this goal can be achieved.
9International Helicopter Safety Team Latin America Regional - June 2007
Overview
• The current problem and the goal for improvement
• What’s been proven already• What remains to achieve the goal• Justifying the necessary risk mitigation
measures• Conclusions and summing up

10International Helicopter Safety Team Latin America Regional - June 2007
0
Audit/Advice
Safety SystemSupport
Safety Perfo rm anc eAir Contracto rs
ResearchA irw orth ine ss - H um a n
F actors - S ec ondary S afety
StandardsDevelopm ent
IndustryInfluence
STRATEGICSAFETY TARGETS
0
4 4.2
2
15.1
13.2
5.8
11.3
13.7
2.9
5
24 4
04
81
21
62
0
90
-94
91
-95
92
-96
93
-97
94
-98
95
-99
96
-00
97
-01
98
-02
99
-03
00
-04
01
-05
01
-06
Ta
rge
t '0
8Fa
tal
Ac
cid
en
t R
ate
pe
r m
illi
on
fly
ing
hrs
5 Year Moving Average
Log. (5 Year Moving Average)Target 2000 Target
2005
Shell’s Fatal Air Accident Rate
Target2008
11International Helicopter Safety Team Latin America Regional - June 2007
>10~ 2
12International Helicopter Safety Team Latin America Regional - June 2007
Overview
• The current problem and the goal for improvement
• What’s been proven already• What remains to achieve the goal• Justifying the necessary risk mitigation
measures• Conclusions and summing up
13International Helicopter Safety Team Latin America Regional - June 2007
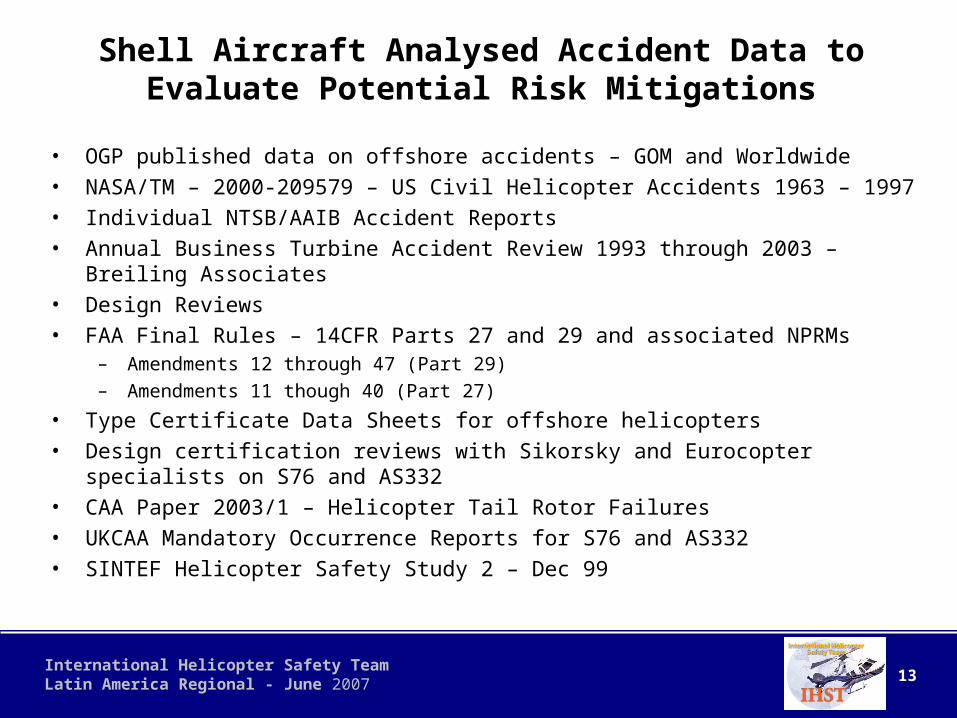
Shell Aircraft Analysed Accident Data to Evaluate Potential Risk Mitigations
• OGP published data on offshore accidents – GOM and Worldwide• NASA/TM – 2000-209579 – US Civil Helicopter Accidents 1963 – 1997• Individual NTSB/AAIB Accident Reports• Annual Business Turbine Accident Review 1993 through 2003 – Breiling
Associates• Design Reviews• FAA Final Rules – 14CFR Parts 27 and 29 and associated NPRMs
– Amendments 12 through 47 (Part 29)– Amendments 11 though 40 (Part 27)
• Type Certificate Data Sheets for offshore helicopters• Design certification reviews with Sikorsky and Eurocopter specialists on S76
and AS332• CAA Paper 2003/1 – Helicopter Tail Rotor Failures• UKCAA Mandatory Occurrence Reports for S76 and AS332• SINTEF Helicopter Safety Study 2 – Dec 99

14International Helicopter Safety Team Latin America Regional - June 2007
In Sum - What Have We Learned?
• Essential Pre-requisites for Safe Operations– Safety culture supported by Quality and Safety Management systems
• Equipment fit– Appropriate to the operation– HUMS/EGPWS/TCAS and cabin egress modifications
• Pilot procedures– Helicopter Flight Data Monitoring (HFDM, also known as HOMP or FOQA)– Flight simulator training in LOFT scenarios emphasising CRM– Helideck performance profiles
• Helideck management– Helicopter Landing Officer and Helideck Assistant training– Helideck procedures
• System failure management– HUMS/VHM/EVMS– Engine monitoring– Flight Simulator training
• Human error in maintenance– Human factors training– Duplicate inspections/RIIs– HUMS/VHM/EVMS
• All these items are addressed in OGP’s Aircraft Management Guide, and will mitigate risk, but they are unlikely to achieve the long term safety goal.
15International Helicopter Safety Team Latin America Regional - June 2007
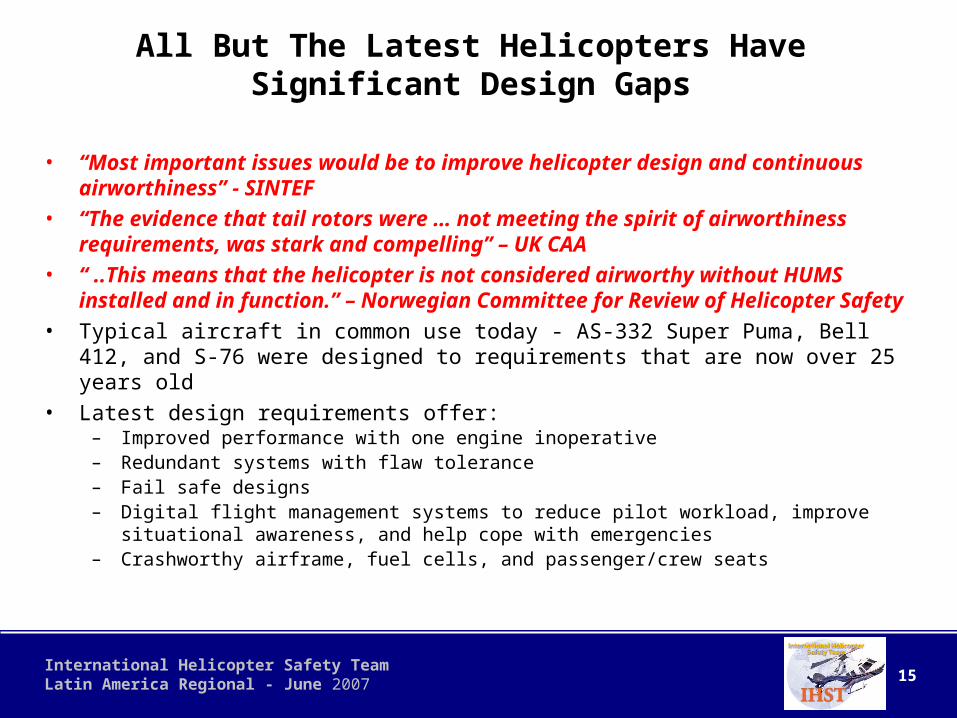
All But The Latest Helicopters Have Significant Design Gaps
• “Most important issues would be to improve helicopter design and continuous airworthiness” - SINTEF
• “The evidence that tail rotors were … not meeting the spirit of airworthiness requirements, was stark and compelling” – UK CAA
• “ ..This means that the helicopter is not considered airworthy without HUMS installed and in function.” – Norwegian Committee for Review of Helicopter Safety
• Typical aircraft in common use today - AS-332 Super Puma, Bell 412, and S-76 were designed to requirements that are now over 25 years old
• Latest design requirements offer:– Improved performance with one engine inoperative– Redundant systems with flaw tolerance– Fail safe designs– Digital flight management systems to reduce pilot workload, improve situational
awareness, and help cope with emergencies– Crashworthy airframe, fuel cells, and passenger/crew seats
16International Helicopter Safety Team Latin America Regional - June 2007
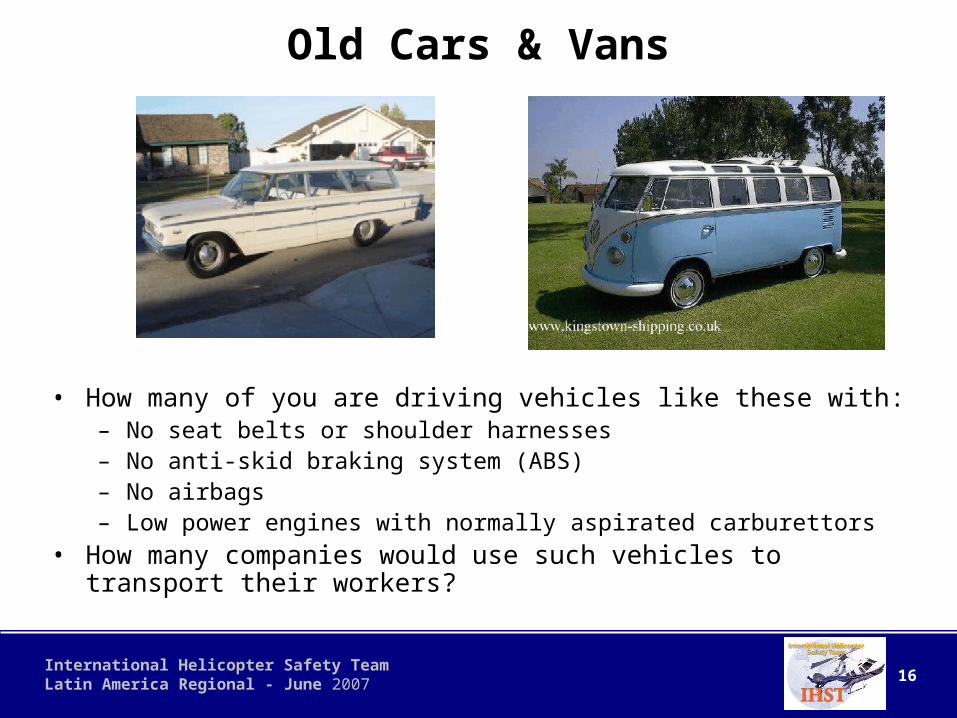
Old Cars & Vans
• How many of you are driving vehicles like these with:– No seat belts or shoulder harnesses– No anti-skid braking system (ABS)– No airbags– Low power engines with normally aspirated carburettors
• How many companies would use such vehicles to transport their workers?

17International Helicopter Safety Team Latin America Regional - June 2007
Old Helicopters
• Yet many helicopter operations still use aircraft such as B212 and AS350 that were designed in a similar era (1960/70’s) and to equivalent safety standards.
• Whilst certification standards for new design aircraft have changed, these models have continued to be built to old certification standards under “grandfather rights.”
18International Helicopter Safety Team Latin America Regional - June 2007
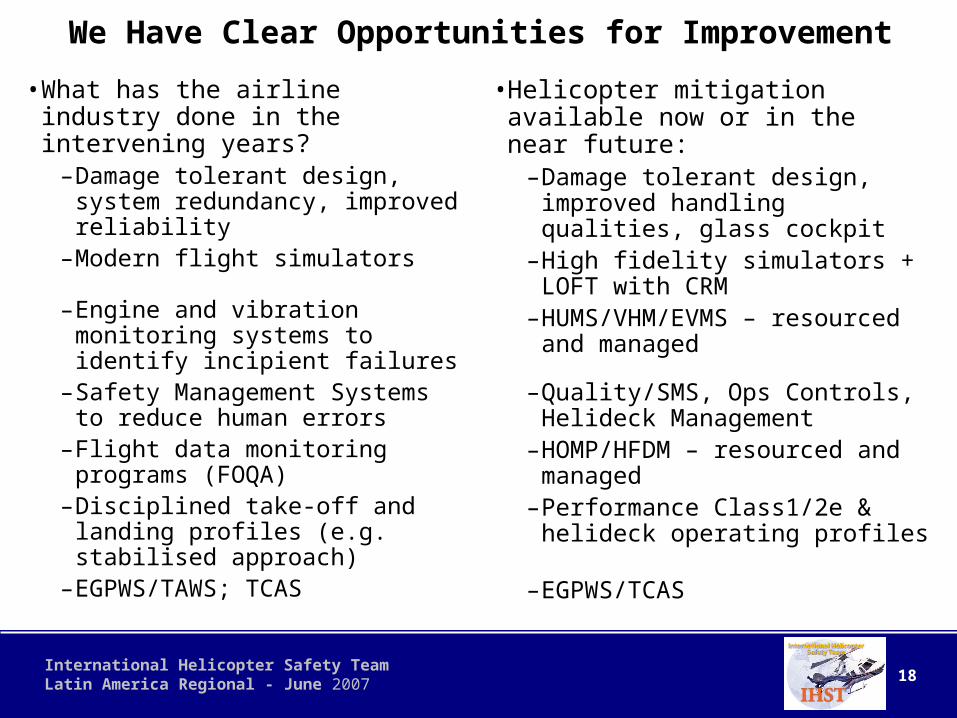
We Have Clear Opportunities for Improvement
•What has the airline industry done in the intervening years?
–Damage tolerant design, system redundancy, improved reliability
–Modern flight simulators
–Engine and vibration monitoring systems to identify incipient failures
–Safety Management Systems to reduce human errors
–Flight data monitoring programs (FOQA)
–Disciplined take-off and landing profiles (e.g. stabilised approach)
–EGPWS/TAWS; TCAS
•Helicopter mitigation available now or in the near future:
–Damage tolerant design, improved handling qualities, glass cockpit
–High fidelity simulators + LOFT with CRM
–HUMS/VHM/EVMS – resourced and managed
–Quality/SMS, Ops Controls, Helideck Management
–HOMP/HFDM – resourced and managed
–Performance Class1/2e & helideck operating profiles
–EGPWS/TCAS
19International Helicopter Safety Team Latin America Regional - June 2007
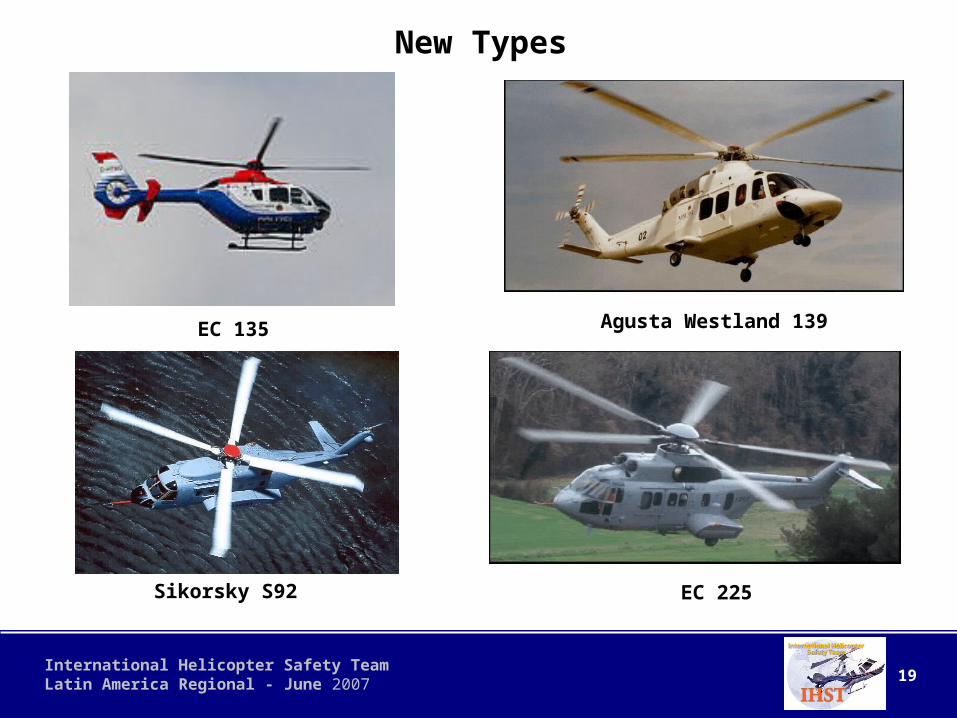
New Types
EC 135 Agusta Westland 139
EC 225Sikorsky S92
20International Helicopter Safety Team Latin America Regional - June 2007
Overview
• The current problem and the goal for improvement
• What’s been proven already• What remains to achieve the goal• Justifying the necessary risk mitigation
measures• Conclusions and summing up
21International Helicopter Safety Team Latin America Regional - June 2007
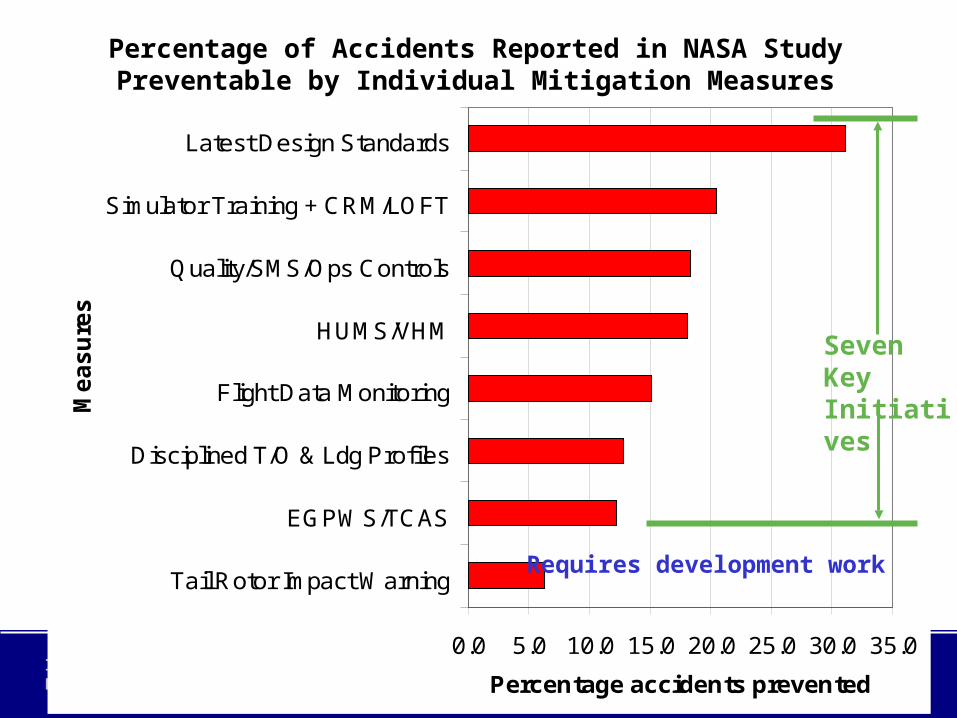
0.0 5.0 10.0 15.0 20.0 25.0 30.0 35.0
Tail Rotor Impact Warning
EGPWS/TCAS
Disciplined T/O & Ldg Profiles
Flight Data Monitoring
HUMS/VHM
Quality/SMS/Ops Controls
Simulator Training + CRM/LOFT
Latest Design Standards
Me
as
ure
s
Percentage accidents prevented
Seven KeyInitiatives
Requires development work
Percentage of Accidents Reported in NASA Study Preventable by Individual Mitigation Measures

22International Helicopter Safety Team Latin America Regional - June 2007
Proving That Risk Reduction Measures are Justified
• Use a layered defence model in Microsoft Excel as a predictive tool to calculate the incremental risk reduction for a given measure.
• Apply the risk reduction in question to the expected exposure; i.e., number of helicopters, flying hours per year, and number of passengers per flight.
• Use the incremental cost to calculate the implied cost of avoiding a fatality (ICAF) and the individual risk of fatality per annum (IRPA).
• Compare these outcomes to your company’s risk management guidelines; e.g., ICAF of $50 million, IRPA of 1 in 10,000.

23International Helicopter Safety Team Latin America Regional - June 2007
Mitigation Potential – NASA Data for Generic Twin1 Pilot related (in air) % Level 1
MitigationMF1 Level 2
MitigationMF2 Level 3
MitigationMF3 Overall
MFAccidents prevented
In flight collision with object 14.3 % Airport/helipad/fence 5.7 IW 0.50 SMS/QA/OC 0.43 HOMP 0.38 0.82 4.65 Wire 4.3 EGPWS/TCAS 0.75 SMS/QA/OC 0.43 HOMP 0.38 0.91 3.94 Other-trees, brush, acft 4.3 EGPWS/TCAS 0.75 IW 0.43 Training 0.34 0.90 3.92Loss of control 14.7 Handling 6.3 DR/HQ 0.60 HOMP 0.43 Training 0.34 0.85 5.37 Loss of reference/disorientation3.0 Training 0.45 DR/HQ 0.51 HOMP 0.38 0.83 2.49 System deficiency 2.3 DR 0.50 HOMP 0.43 Training 0.34 0.81 1.89 Misc/undetermined 3.0 Training 0.45 HOMP 0.43 PC 1/2e 0.49 0.84 2.51In flight collision with terrain 5.7 EGPWS/TCAS 0.75 HOMP 0.43 Training 0.34 0.90 5.12Weather 4.0 Training 0.45 SMS/QA/OC 0.43 PC 1/2e 0.49 0.84 3.35On ground/water collision with object3.3 IW 0.50 SMS/QA/OC 0.43 Training 0.34 0.81 2.70Hard landing 2.7 Training 0.45 PC 1/2e 0.55 DR/HQ 0.45 0.86 2.30Mid air collision 2.0 EGPWS/TCAS 0.75 Training 0.38 HOMP 0.38 0.90 1.81Rollover/Noseover 1.3 HOMP 0.50 DR/HQ 0.51 Training 0.34 0.84 1.11Subtotal % 48.0 % 41.160.00
2 TechnicalLoss of engine power 13.0 Engine structure 5.0 DR 0.50 PC 1/2e 0.55 HUMS 0.49 0.89 4.43 Fuel system related 5.7 PC 1/2e 0.65 DR 0.43 SMS/QA/OC 0.38 0.87 4.95 Other 2.3 PC 1/2e 0.65 DR 0.43 HUMS 0.49 0.90 2.09Airframe component/system 29.6 Main rotor 6.3 DR 0.50 HUMS 0.55 SMS/QA/OC 0.38 0.86 5.44 Main rotor drive train 4.3 DR 0.50 HUMS 0.55 Training 0.34 0.85 3.69 Main rotor control system3.7 DR 0.50 HUMS 0.55 Training 0.34 0.85 3.12 Tail rotor 3.3 DR/HQ 0.60 HUMS 0.55 SMS/QA/OC 0.38 0.89 2.96 Tail rotor drive train 6.3 DR/HQ 0.60 HUMS 0.55 Training 0.34 0.88 5.58 Tail rotor control system 2.3 DR/HQ 0.60 HUMS 0.55 Training 0.34 0.88 2.05 Other airframe 3.3 DR 0.50 SMS/QA/OC 0.43 Training 0.34 0.81 2.70Fire/explosion 1.7 DR 0.50 SMS/QA/OC 0.43 Training 0.34 0.81 1.34Gear collapsed 2.0 DR 0.50 SMS/QA/OC 0.43 Training 0.34 0.81 1.62Subtotal % 46.3 % 38.36
3 OtherRotor contact -person 2.7 SMS/QA/OC 0.50 SMS/QA/OC 0.43 Training 0.34 0.81 2.16Misc/other 3.0 HOMP 0.50 Training 0.38 SMS/QA/OC 0.38 0.81 2.42Subtotal % 5.7 % 4.58
Factor 0.85 Factor 0.75
Total accidents prevented (= % effectivity of mitigation measures) 84.10
Effectiveness of mitigation measures % Key
Risk mitigation measures applied to accident causes with 3 levels of diminishing efficacy.
24International Helicopter Safety Team Latin America Regional - June 2007
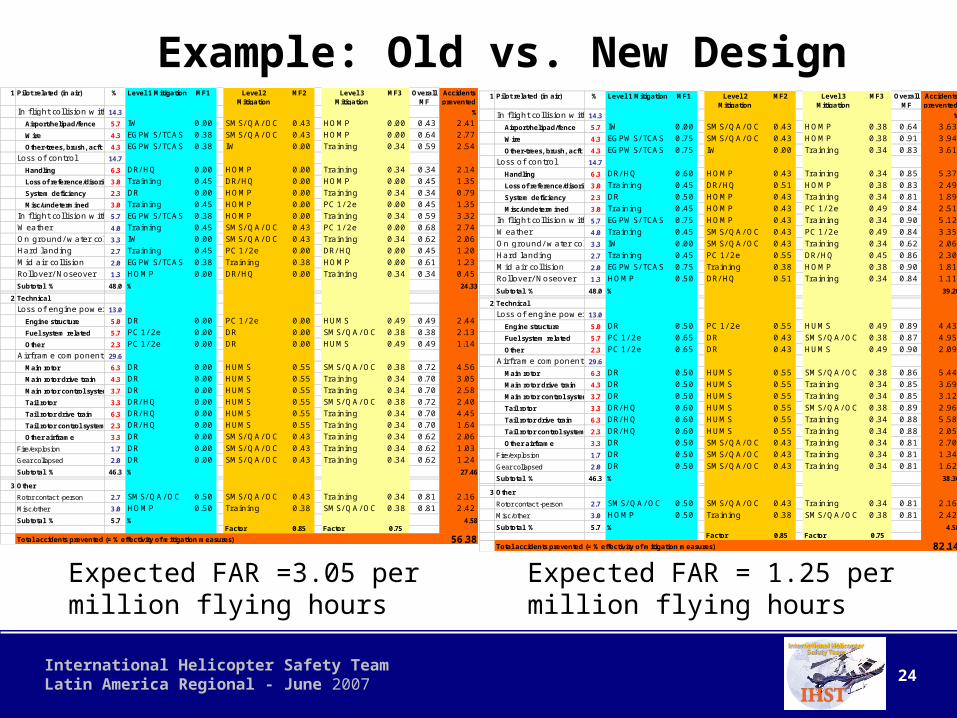
Example: Old vs. New Design1 Pilot related (in air) % Level 1 Mitigation MF1 Level 2
MitigationMF2 Level 3
MitigationMF3 Overall
MFAccidents prevented
In flight collision w ith object14.3 %
Airport/helipad/fence 5.7 IW 0.00 SMS/ QA/ OC 0.43 HOMP 0.38 0.64 3.63
Wire 4.3 EGPWS/ TCAS 0.75 SMS/ QA/ OC 0.43 HOMP 0.38 0.91 3.94
Other-trees, brush, acft 4.3 EGPWS/ TCAS 0.75 IW 0.00 Training 0.34 0.83 3.61
Loss of control 14.7
Handling 6.3 DR/ HQ 0.60 HOMP 0.43 Training 0.34 0.85 5.37
Loss of reference/disorientation3.0 Training 0.45 DR/ HQ 0.51 HOMP 0.38 0.83 2.49
System deficiency 2.3 DR 0.50 HOMP 0.43 Training 0.34 0.81 1.89
Misc/undetermined 3.0 Training 0.45 HOMP 0.43 PC 1/ 2e 0.49 0.84 2.51
In flight collision w ith terrain5.7 EGPWS/ TCAS 0.75 HOMP 0.43 Training 0.34 0.90 5.12
Weather 4.0 Training 0.45 SMS/ QA/ OC 0.43 PC 1/ 2e 0.49 0.84 3.35
On ground/ w ater collision w ith object3.3 IW 0.00 SMS/ QA/ OC 0.43 Training 0.34 0.62 2.06
Hard landing 2.7 Training 0.45 PC 1/ 2e 0.55 DR/ HQ 0.45 0.86 2.30
Mid air collision 2.0 EGPWS/ TCAS 0.75 Training 0.38 HOMP 0.38 0.90 1.81
Rollover/ Noseover 1.3 HOMP 0.50 DR/ HQ 0.51 Training 0.34 0.84 1.11
Subtotal % 48.0 % 39.200.002 Technical
Loss of engine pow er 13.0
Engine structure 5.0 DR 0.50 PC 1/ 2e 0.55 HUMS 0.49 0.89 4.43
Fuel system related 5.7 PC 1/ 2e 0.65 DR 0.43 SMS/ QA/ OC 0.38 0.87 4.95
Other 2.3 PC 1/ 2e 0.65 DR 0.43 HUMS 0.49 0.90 2.09
Airframe component/ system29.6
Main rotor 6.3 DR 0.50 HUMS 0.55 SMS/ QA/ OC 0.38 0.86 5.44
Main rotor drive train 4.3 DR 0.50 HUMS 0.55 Training 0.34 0.85 3.69
Main rotor control system 3.7 DR 0.50 HUMS 0.55 Training 0.34 0.85 3.12
Tail rotor 3.3 DR/ HQ 0.60 HUMS 0.55 SMS/ QA/ OC 0.38 0.89 2.96
Tail rotor drive train 6.3 DR/ HQ 0.60 HUMS 0.55 Training 0.34 0.88 5.58
Tail rotor control system 2.3 DR/ HQ 0.60 HUMS 0.55 Training 0.34 0.88 2.05
Other airframe 3.3 DR 0.50 SMS/ QA/ OC 0.43 Training 0.34 0.81 2.70
Fire/explosion 1.7 DR 0.50 SMS/ QA/ OC 0.43 Training 0.34 0.81 1.34
Gear collapsed 2.0 DR 0.50 SMS/ QA/ OC 0.43 Training 0.34 0.81 1.62
Subtotal % 46.3 % 38.36
3 Other
Rotor contact -person 2.7 SMS/ QA/ OC 0.50 SMS/ QA/ OC 0.43 Training 0.34 0.81 2.16
Misc/other 3.0 HOMP 0.50 Training 0.38 SMS/ QA/ OC 0.38 0.81 2.42
Subtotal % 5.7 % 4.58Factor 0.85 Factor 0.75
Total accidents prevented (= % effectivity of mitigation measures) 82.14
Expected FAR =3.05 permillion flying hours
Expected FAR = 1.25 permillion flying hours
1 Pilot related (in air) % Level 1 Mitigation MF1 Level 2 Mitigation
MF2 Level 3 Mitigation
MF3 Overall MF
Accidents prevented
In flight collision w ith object14.3 %
Airport/helipad/fence 5.7 IW 0.00 SMS/ QA/ OC 0.43 HOMP 0.00 0.43 2.41
Wire 4.3 EGPWS/ TCAS 0.38 SMS/ QA/ OC 0.43 HOMP 0.00 0.64 2.77
Other-trees, brush, acft 4.3 EGPWS/ TCAS 0.38 IW 0.00 Training 0.34 0.59 2.54
Loss of control 14.7
Handling 6.3 DR/ HQ 0.00 HOMP 0.00 Training 0.34 0.34 2.14
Loss of reference/disorientation3.0 Training 0.45 DR/ HQ 0.00 HOMP 0.00 0.45 1.35
System deficiency 2.3 DR 0.00 HOMP 0.00 Training 0.34 0.34 0.79
Misc/undetermined 3.0 Training 0.45 HOMP 0.00 PC 1/ 2e 0.00 0.45 1.35
In flight collision w ith terrain5.7 EGPWS/ TCAS 0.38 HOMP 0.00 Training 0.34 0.59 3.32
Weather 4.0 Training 0.45 SMS/ QA/ OC 0.43 PC 1/ 2e 0.00 0.68 2.74
On ground/ w ater collision w ith object3.3 IW 0.00 SMS/ QA/ OC 0.43 Training 0.34 0.62 2.06
Hard landing 2.7 Training 0.45 PC 1/ 2e 0.00 DR/ HQ 0.00 0.45 1.20
Mid air collision 2.0 EGPWS/ TCAS 0.38 Training 0.38 HOMP 0.00 0.61 1.23
Rollover/ Noseover 1.3 HOMP 0.00 DR/ HQ 0.00 Training 0.34 0.34 0.45
Subtotal % 48.0 % 24.330.002 Technical
Loss of engine pow er 13.0
Engine structure 5.0 DR 0.00 PC 1/ 2e 0.00 HUMS 0.49 0.49 2.44
Fuel system related 5.7 PC 1/ 2e 0.00 DR 0.00 SMS/ QA/ OC 0.38 0.38 2.13
Other 2.3 PC 1/ 2e 0.00 DR 0.00 HUMS 0.49 0.49 1.14
Airframe component/ system29.6
Main rotor 6.3 DR 0.00 HUMS 0.55 SMS/ QA/ OC 0.38 0.72 4.56
Main rotor drive train 4.3 DR 0.00 HUMS 0.55 Training 0.34 0.70 3.05
Main rotor control system 3.7 DR 0.00 HUMS 0.55 Training 0.34 0.70 2.58
Tail rotor 3.3 DR/ HQ 0.00 HUMS 0.55 SMS/ QA/ OC 0.38 0.72 2.40
Tail rotor drive train 6.3 DR/ HQ 0.00 HUMS 0.55 Training 0.34 0.70 4.45
Tail rotor control system 2.3 DR/ HQ 0.00 HUMS 0.55 Training 0.34 0.70 1.64
Other airframe 3.3 DR 0.00 SMS/ QA/ OC 0.43 Training 0.34 0.62 2.06
Fire/explosion 1.7 DR 0.00 SMS/ QA/ OC 0.43 Training 0.34 0.62 1.03
Gear collapsed 2.0 DR 0.00 SMS/ QA/ OC 0.43 Training 0.34 0.62 1.24
Subtotal % 46.3 % 27.46
3 Other
Rotor contact -person 2.7 SMS/ QA/ OC 0.50 SMS/ QA/ OC 0.43 Training 0.34 0.81 2.16
Misc/other 3.0 HOMP 0.50 Training 0.38 SMS/ QA/ OC 0.38 0.81 2.42
Subtotal % 5.7 % 4.58Factor 0.85 Factor 0.75
Total accidents prevented (= % effectivity of mitigation measures) 56.38
25International Helicopter Safety Team Latin America Regional - June 2007
ICAF and IRPA
• ICAF = Incremental Cost per Annum divided by the Incremental Lives Saved per Annum– Incremental Lives Saved per Annum =
(Incremental Reduction in Fatal Accident Rate) * (Flying Hours per Annum) * (Average Number of Occupants) * (Average Percentage of Occupants Killed in Fatal Accidents)
• IRPA = (Fatal Accident Rate) * (Individual Flying Hours per Annum) * (Average Percentage of Occupants Killed in Fatal Accidents)
26International Helicopter Safety Team Latin America Regional - June 2007
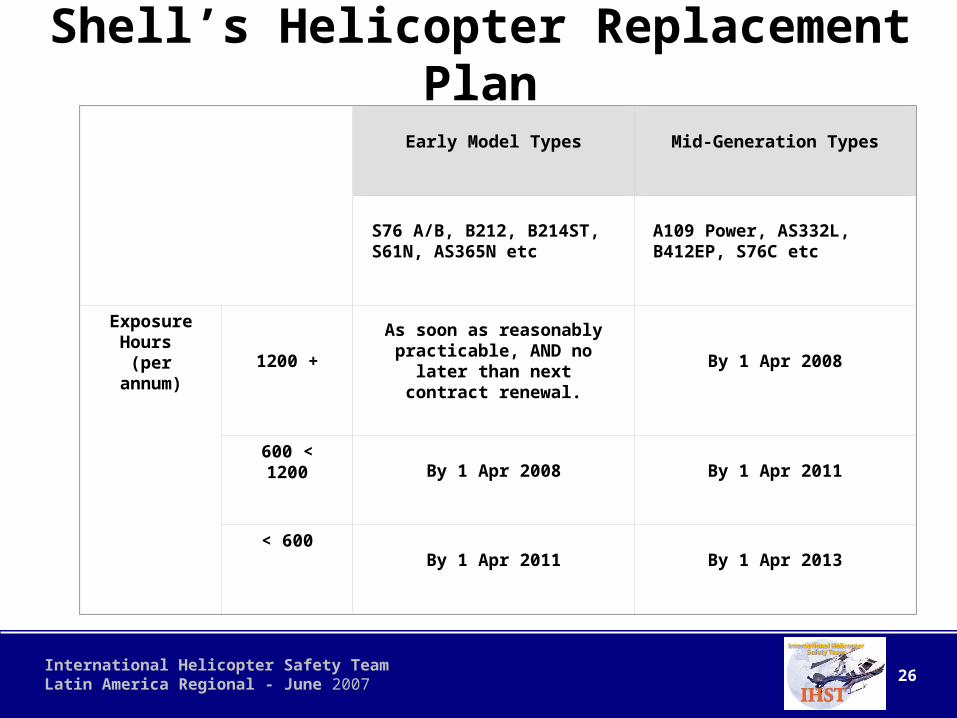
Shell’s Helicopter Replacement Plan
Early Model Types Mid-Generation Types
S76 A/B, B212, B214ST, S61N, AS365N etc
A109 Power, AS332L, B412EP, S76C etc
Exposure Hours
(per annum) 1200 +As soon as reasonably
practicable, AND no later than next contract renewal.
By 1 Apr 2008
600 < 1200By 1 Apr 2008 By 1 Apr 2011
< 600By 1 Apr 2011 By 1 Apr 2013
27International Helicopter Safety Team Latin America Regional - June 2007
Overview
• The current problem and the goal for improvement
• What’s been proven already• What remains to achieve the goal• Justifying the necessary risk mitigation
measures• Conclusions and summing up
28International Helicopter Safety Team Latin America Regional - June 2007
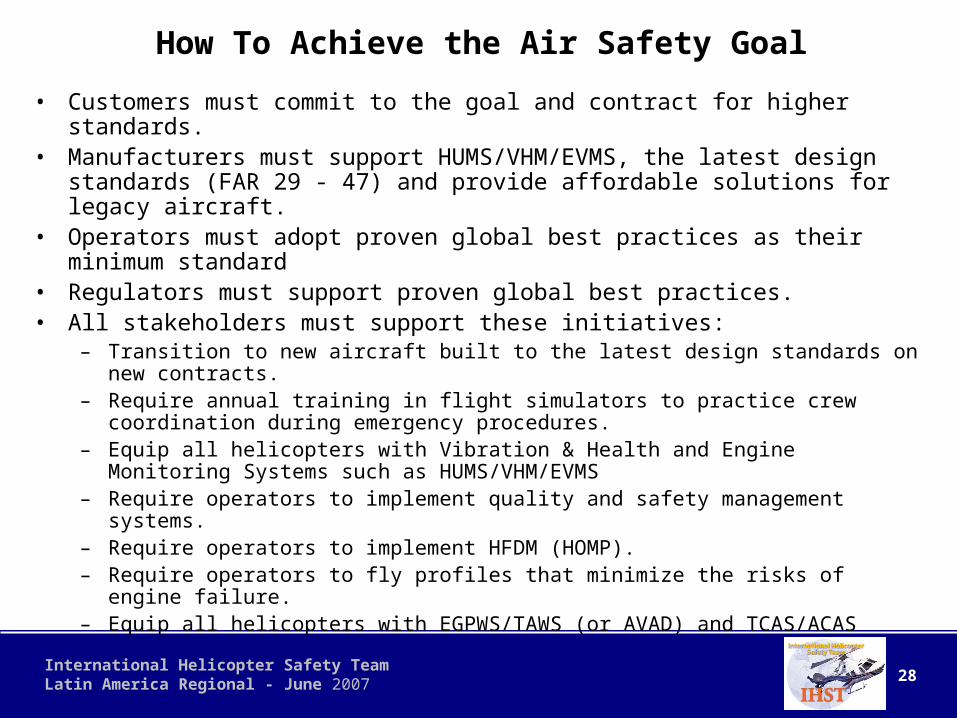
How To Achieve the Air Safety Goal
• Customers must commit to the goal and contract for higher standards.• Manufacturers must support HUMS/VHM/EVMS, the latest design
standards (FAR 29 - 47) and provide affordable solutions for legacy aircraft.
• Operators must adopt proven global best practices as their minimum standard
• Regulators must support proven global best practices.• All stakeholders must support these initiatives:
– Transition to new aircraft built to the latest design standards on new contracts.
– Require annual training in flight simulators to practice crew coordination during emergency procedures.
– Equip all helicopters with Vibration & Health and Engine Monitoring Systems such as HUMS/VHM/EVMS
– Require operators to implement quality and safety management systems.– Require operators to implement HFDM (HOMP).– Require operators to fly profiles that minimize the risks of engine failure.– Equip all helicopters with EGPWS/TAWS (or AVAD) and TCAS/ACAS

29International Helicopter Safety Team Latin America Regional - June 2007
We have many imperatives to make these improvements!
• Respect for people – the disparity between helicopter safety and airline safety
• ALARP – we know what can be done and that the cost is not disproportionate to the benefits to be gained
• The Ford Pinto story• The “Red Face” test• Good business sense – safer operations will attract more
customers.
30International Helicopter Safety Team Latin America Regional - June 2007
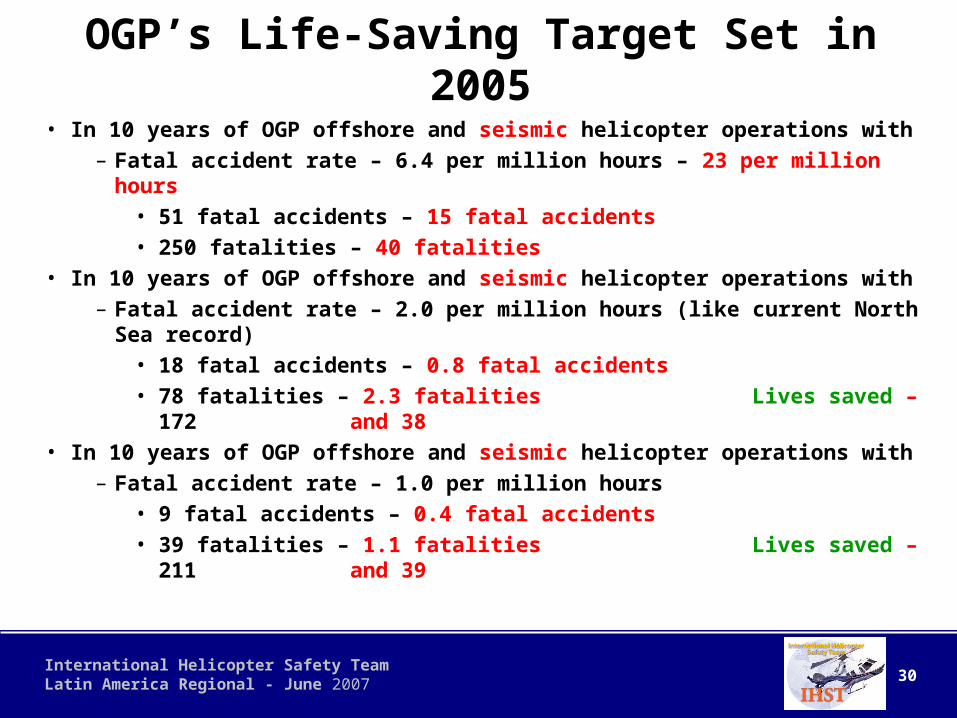
OGP’s Life-Saving Target Set in 2005• In 10 years of OGP offshore and seismic helicopter operations with
– Fatal accident rate – 6.4 per million hours – 23 per million hours• 51 fatal accidents – 15 fatal accidents• 250 fatalities – 40 fatalities
• In 10 years of OGP offshore and seismic helicopter operations with– Fatal accident rate – 2.0 per million hours (like current North Sea
record)• 18 fatal accidents – 0.8 fatal accidents • 78 fatalities – 2.3 fatalities Lives saved – 172 and 38
• In 10 years of OGP offshore and seismic helicopter operations with– Fatal accident rate – 1.0 per million hours
• 9 fatal accidents – 0.4 fatal accidents• 39 fatalities – 1.1 fatalities Lives saved – 211 and 39
31International Helicopter Safety Team Latin America Regional - June 2007
My Plea To All of You
• Please join the IHST and contribute your knowledge and data to the process.
• Help us “raise the bar” for all helicopter operators.– Make helicopter safety a feature that attracts
customers.– Make the best risk reduction measures more
affordable.
• Support IHST goal of reducing helicopter accidents by 80% and by implementing the risk reduction measures featured in this presentation.
32International Helicopter Safety Team Latin America Regional - June 2007
Questions?