Embed Size (px)
Citation preview
1
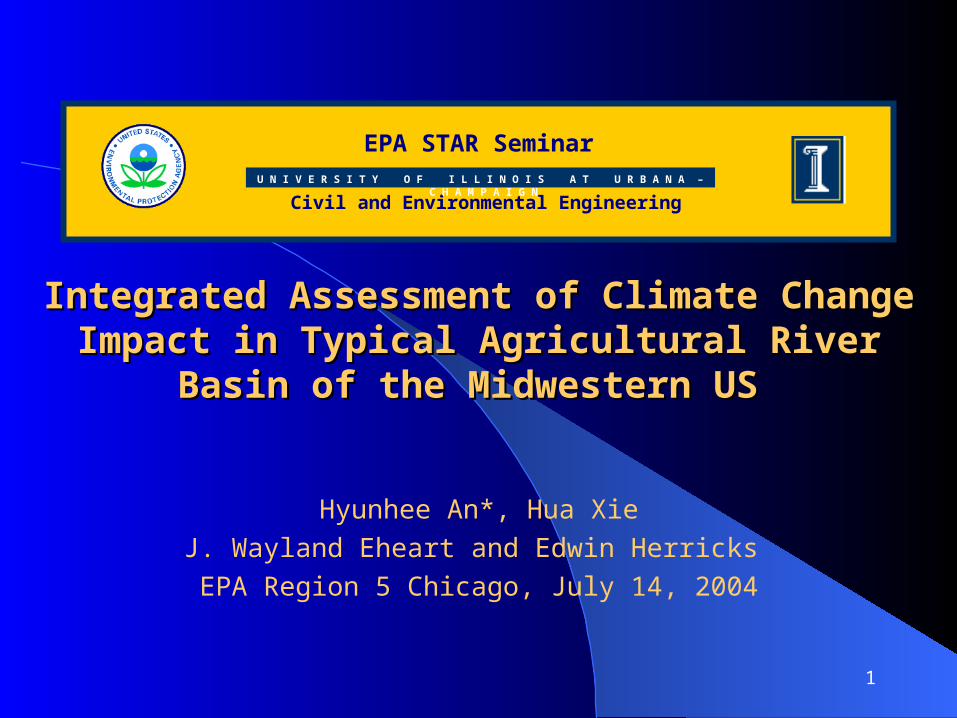
Integrated Assessment of Climate Change Integrated Assessment of Climate Change Impact in Typical Agricultural River Basin of the Impact in Typical Agricultural River Basin of the
Midwestern US Midwestern US
Hyunhee An*, Hua Xie
J. Wayland Eheart and Edwin Herricks
EPA Region 5 Chicago, July 14, 2004
EPA STAR Seminar
Civil and Environmental Engineering
U N I V E R S I T Y O F I L L I N O I S A T U R B A N A – C H A M P A I G N
2
ProjectsProjects• US. EPA Star program : Award No. EPA R827451-01
PublicationsPublicationsEheart, J.W. and Tornil, D.W. Low flow frequency exacerbation by irrigation withdrawals in the agricultural midwest under various climate change scenarios, Water Resources Research Vol. 35, no. 7, p.2237 2246 Jul 1999.
Wollmuth, J.J. C. and J.W. Eheart, Surface Water Withdrawal Allocation and Trading Systems for Traditionally Riparian Areas, Journal of the American Water Resources Association, April 2000.
Hyunhee An and J. W. Eheart, Protecting Midwestern stream from Climate change impact, Annual meeting of EWRI, Orlando, FL, May 20-24, 2001
3
Hyunhee An and W Eheart, Investigation of Trading of stream withdrawal permits in traditionally humid areas, Annual meeting of EWRI, Roanoke, VA, May 19-22, 2002
Hua Xie and J. W. Eheart, Assessing Vulnerability of Water Resources to Climate Change in Midwest, Annual meeting of EWRI, Philadelphia, PA, June 23-26, 2003
Hyunhee An and J. W Eheart, Evaluations of regulatory programs that constrain water withdrawals based on a regulated riparian legal foundation, Annual meeting of EWRI, Salt Lake City, UT, June 27-July 1, 2004
Hua Xie and J. W. Eheart, Implications of Climate Change for a Typical Agricultural River Basin of the Midwestern US , Annual meeting of EWRI, Salt Lake City, UT, June 27- July 1, 2004
4
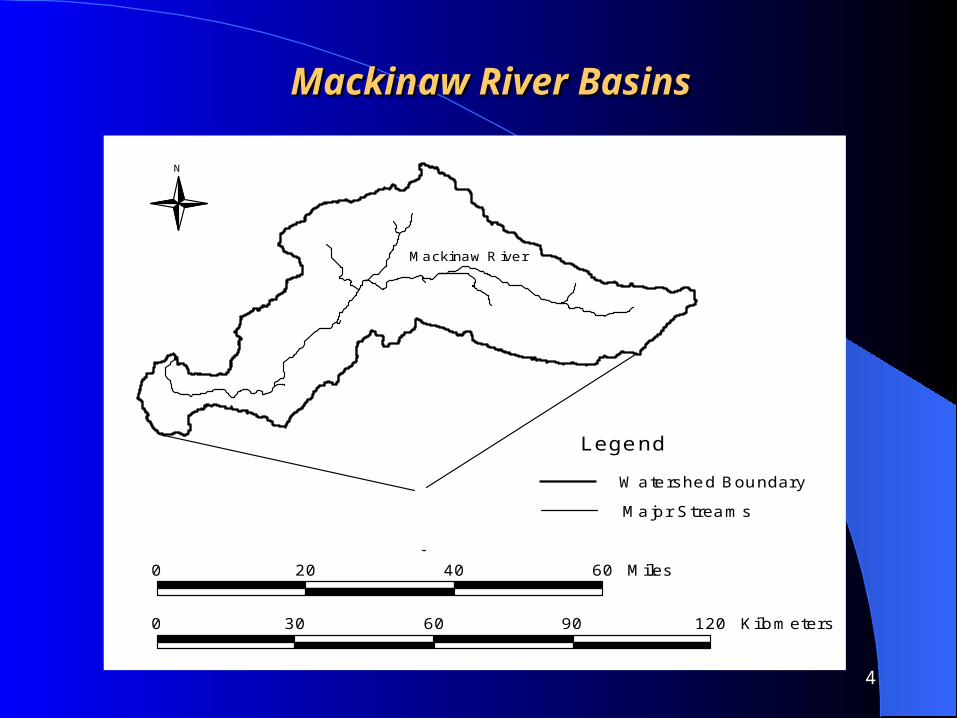
Mackinaw River BasinsMackinaw River Basins
N
Mackinaw River
0 30 60 90 120 Kilometers
0 20 40 60 Miles
Watershed Boundary
Major Streams
Legend
5
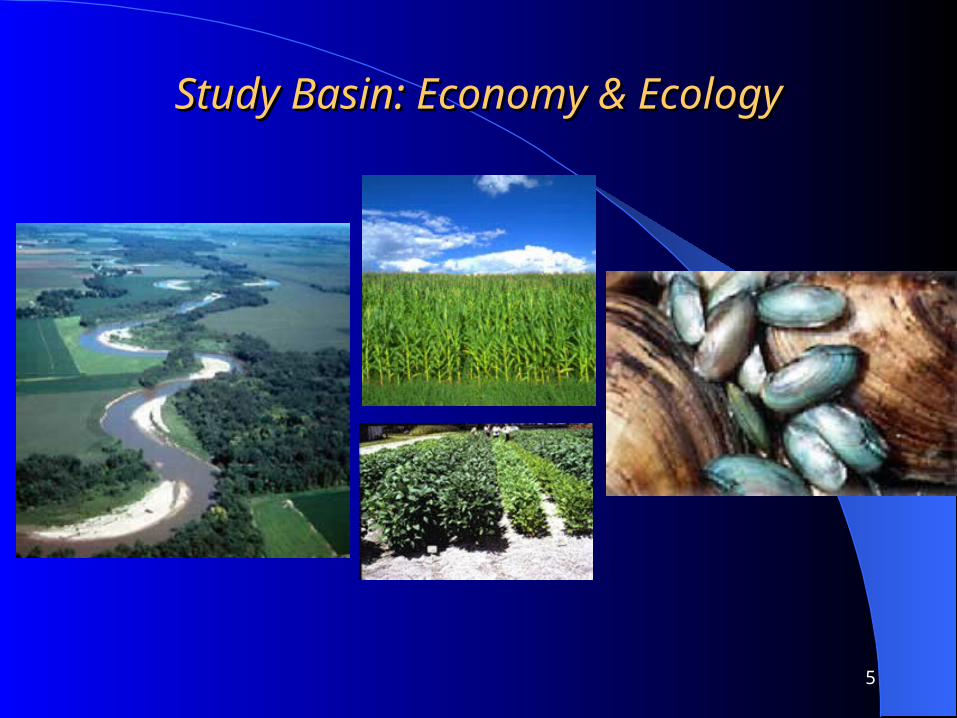
Study Basin: Economy & EcologyStudy Basin: Economy & Ecology
6
SequenceSequence
1. Selection of climate change scenarios
2. Mitigation efforts: irrigation, alternative crops
3. Selection of criteria to demonstrate impacts: LF and Profits
4. Model Run and analysis
7
1. Selection of 1. Selection of Climate change scenariosClimate change scenarios
8
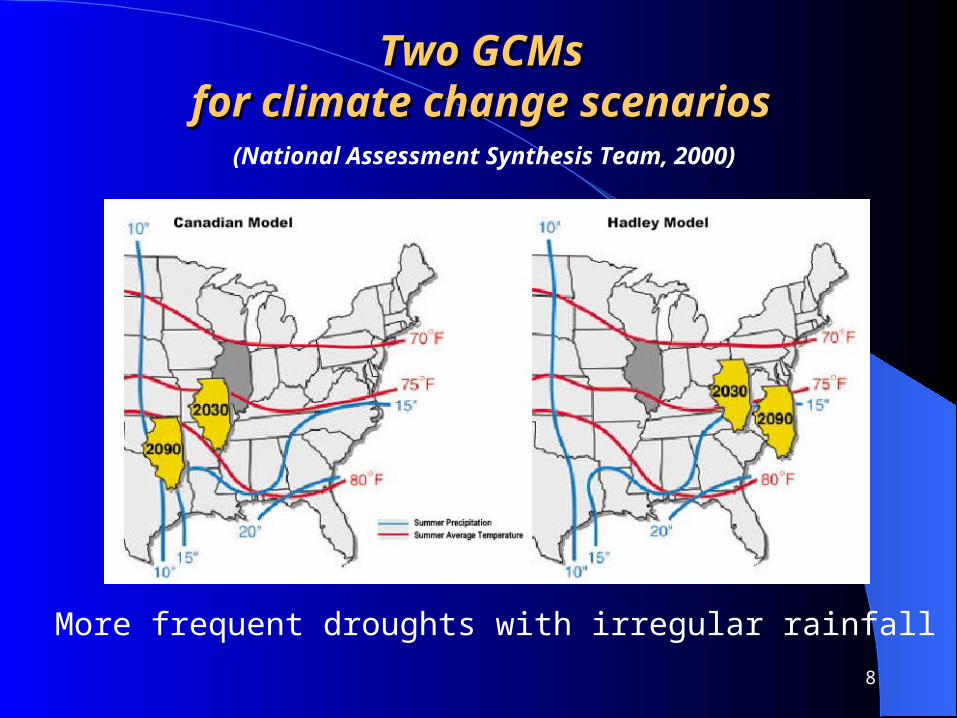
Two GCMs Two GCMs for climate change scenarios for climate change scenarios
More frequent droughts with irregular rainfall
(National Assessment Synthesis Team, 2000)
9
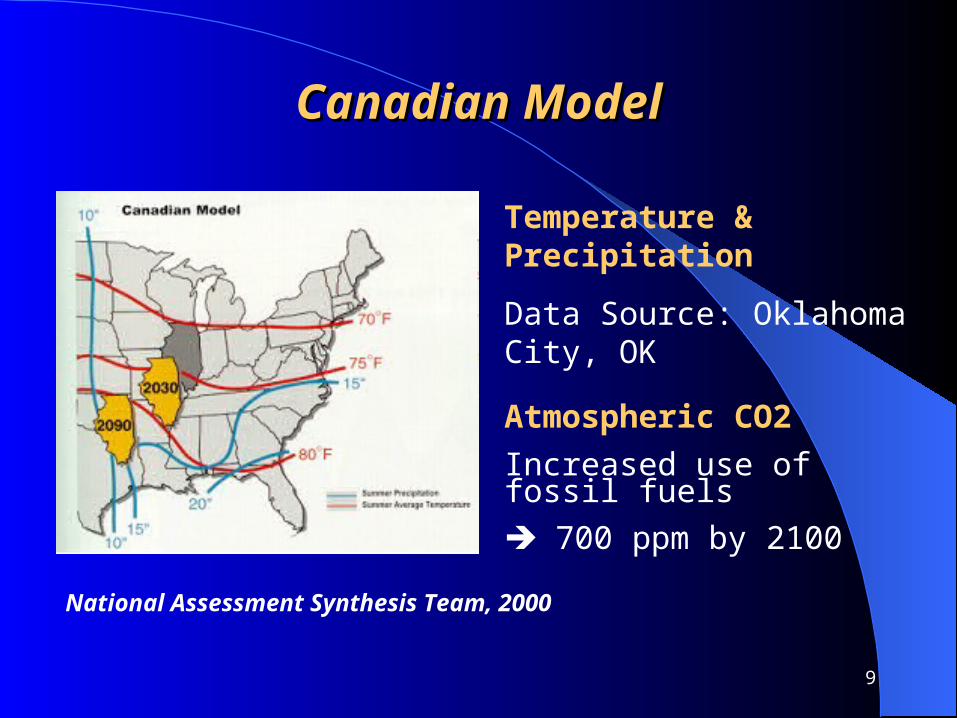
Canadian ModelCanadian Model
National Assessment Synthesis Team, 2000
Temperature & Precipitation
Data Source: Oklahoma City, OK
Atmospheric CO2
Increased use of fossil fuels
700 ppm by 2100
10
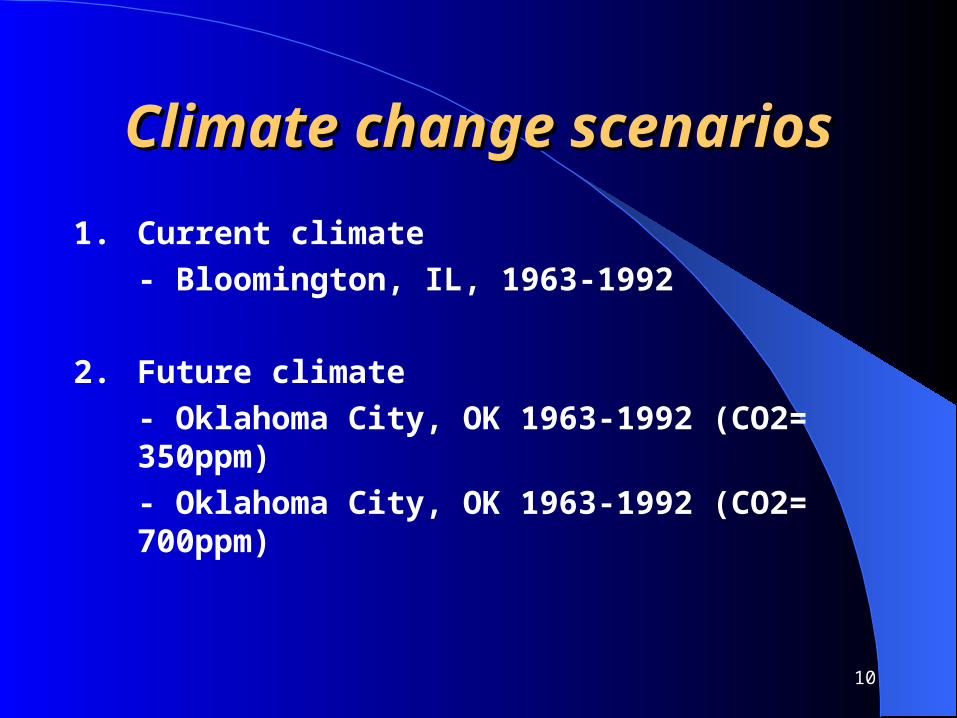
Climate change scenariosClimate change scenarios
1. Current climate - Bloomington, IL, 1963-1992
2. Future climate - Oklahoma City, OK 1963-1992 (CO2= 350ppm)- Oklahoma City, OK 1963-1992 (CO2= 700ppm)
11
2. Mitigation efforts2. Mitigation efforts
12
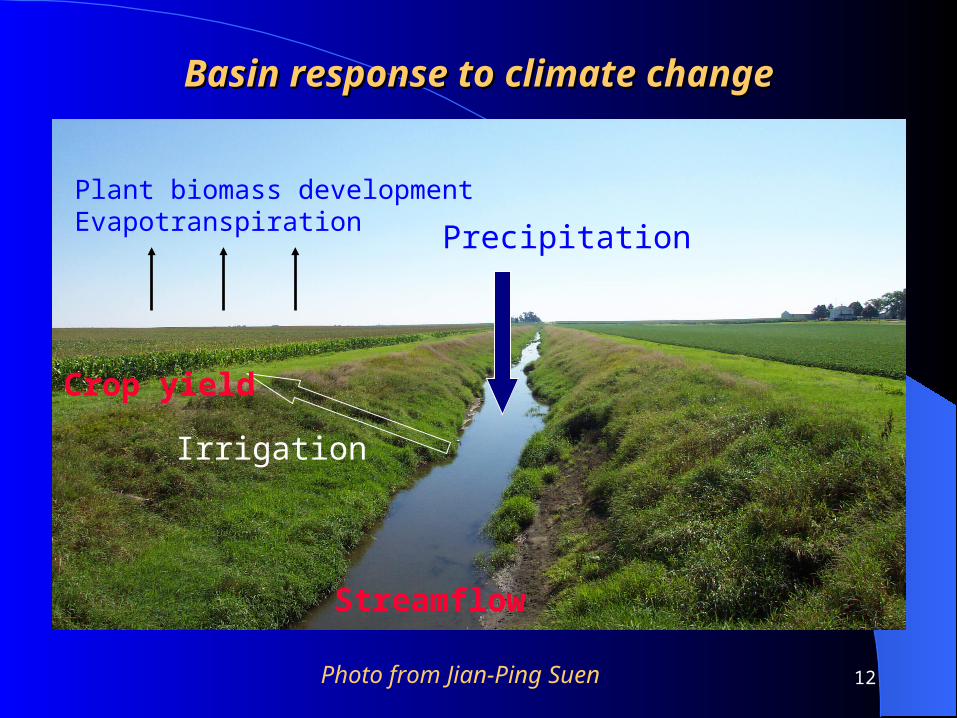
Basin response to climate changeBasin response to climate change
Photo from Jian-Ping Suen
Plant biomass developmentEvapotranspiration
Irrigation
Precipitation
Streamflow
Crop yield
13
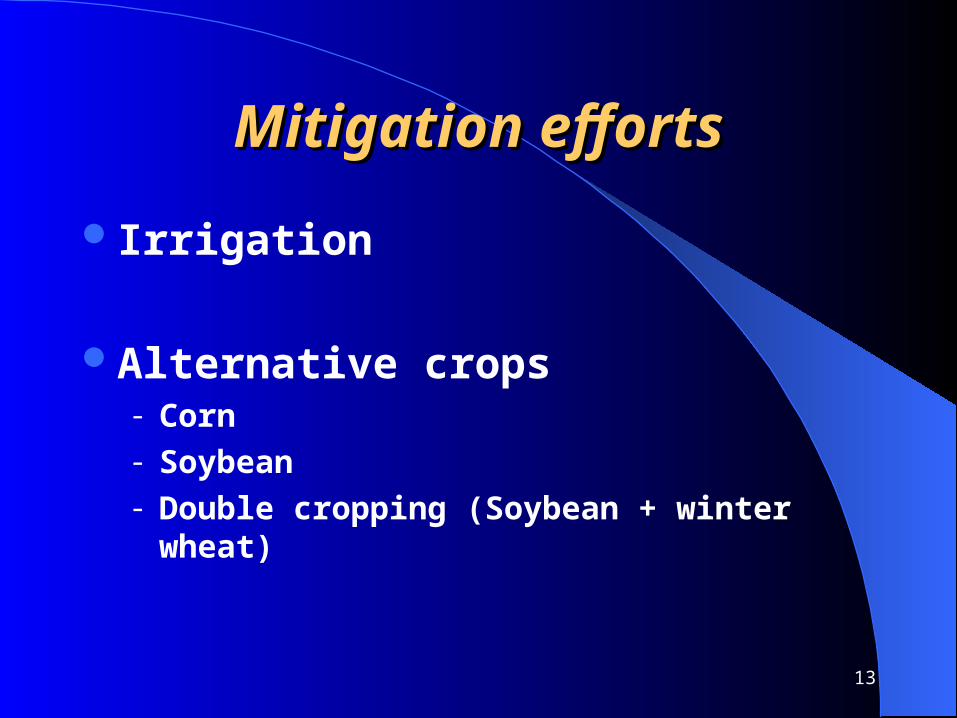
Mitigation effortsMitigation efforts
Irrigation
Alternative crops- Corn- Soybean- Double cropping (Soybean + winter
wheat)
14
3. Selection of criteria 3. Selection of criteria to demonstrate to demonstrate impacts: impacts:
Low flow Low flow frequencyfrequency
ProfitsProfits
15
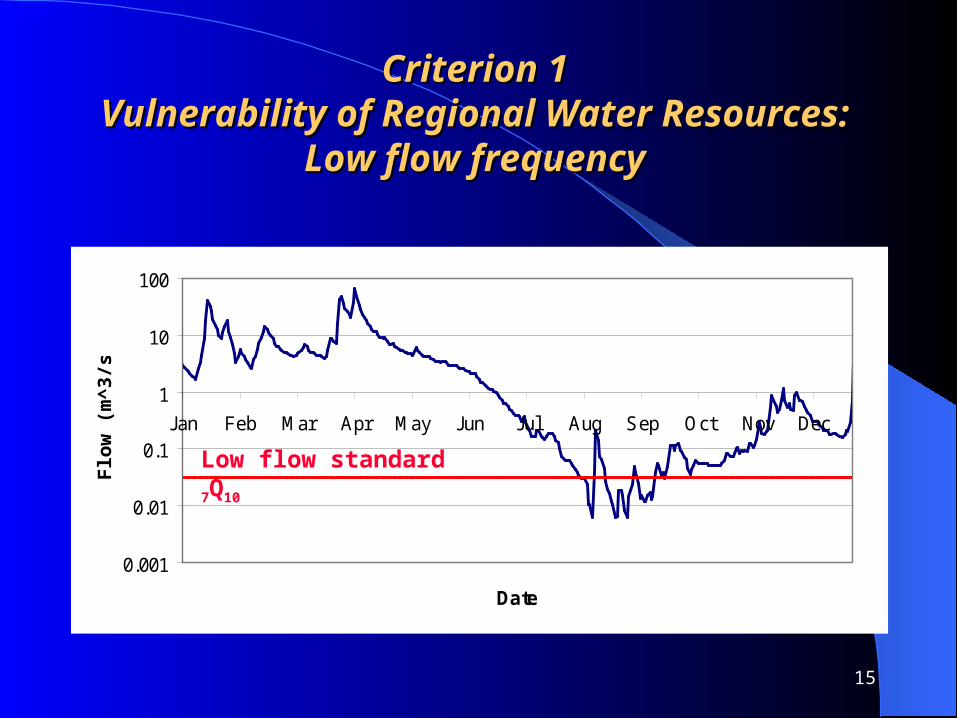
Criterion 1Criterion 1Vulnerability of Regional Water Resources: Vulnerability of Regional Water Resources:
Low flow frequencyLow flow frequency
0.001
0.01
0.1
1
10
100
Jan Feb Mar Apr May Jun Jul Aug Sep Oct Nov Dec
Date
Flo
w (
m^
3/s)
Low flow standard 7Q10
16
Green Valley
Congerville
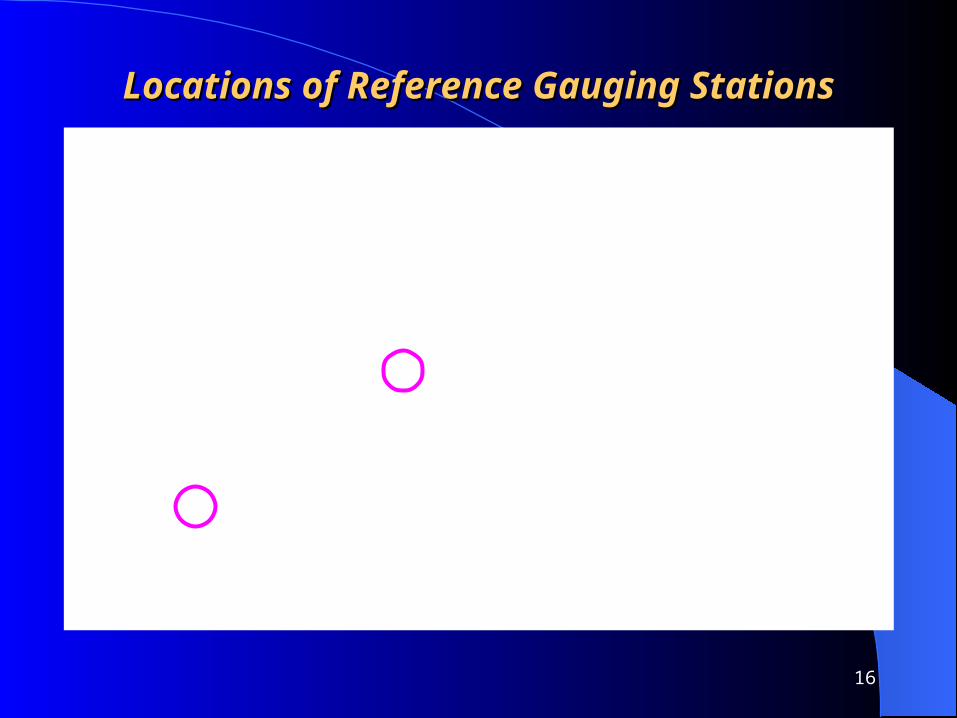
Locations of Reference Gauging StationsLocations of Reference Gauging Stations
17
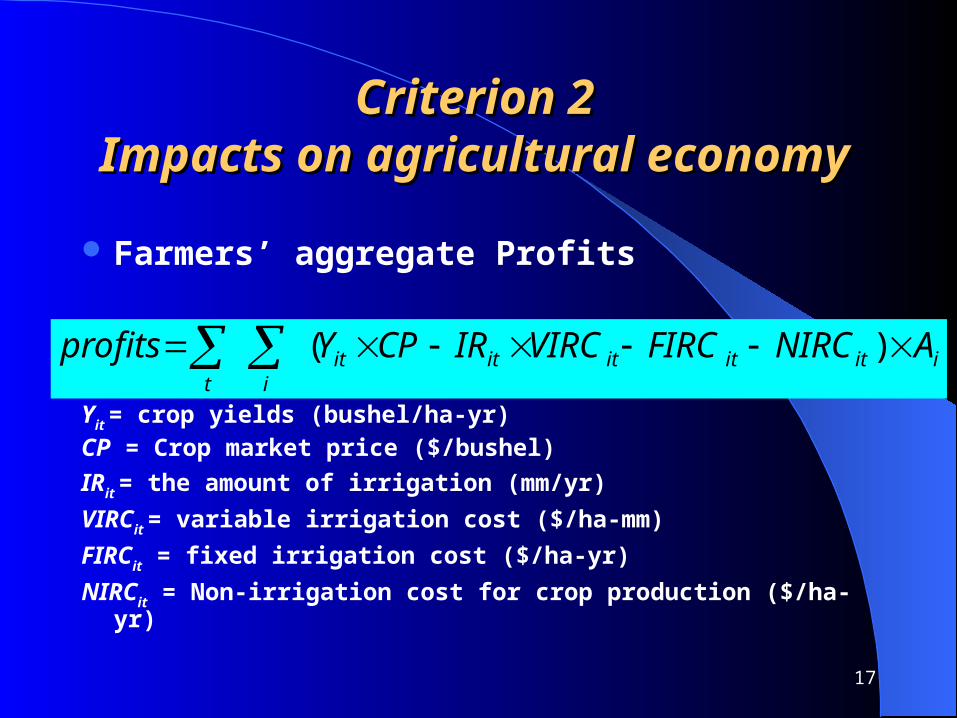
Criterion 2Criterion 2Impacts on agricultural Impacts on agricultural
economyeconomy Farmers’ aggregate Profits
Yit = crop yields (bushel/ha-yr)CP = Crop market price ($/bushel)
IRit = the amount of irrigation (mm/yr)
VIRCit = variable irrigation cost ($/ha-mm)
FIRCit = fixed irrigation cost ($/ha-yr)
NIRCit = Non-irrigation cost for crop production ($/ha-yr)
iitititititit
ANIRCFIRCVIRCIRCPYprofits )(
18
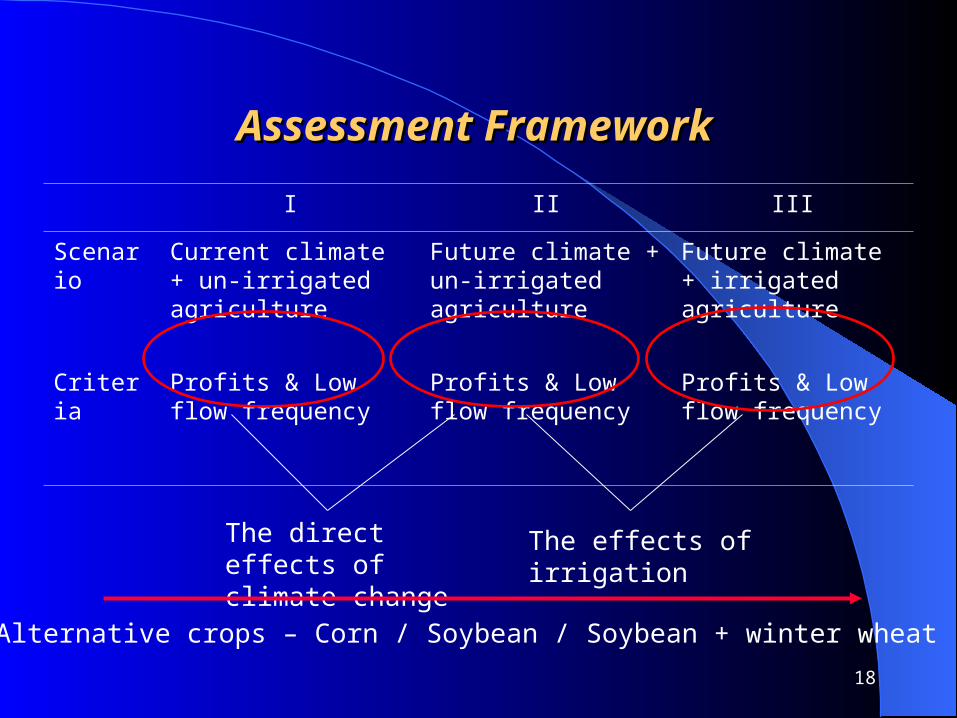
Assessment FrameworkAssessment Framework
I II III
Scenario Current climate + un-irrigated agriculture
Future climate + un-irrigated agriculture
Future climate + irrigated agriculture
Criteria Profits & Low flow frequency
Profits & Low flow frequency
Profits & Low flow frequency
The direct effects of climate change
The effects of irrigation
Alternative crops – Corn / Soybean / Soybean + winter wheat

19
4. Model Runs and Analysis4. Model Runs and Analysis
20
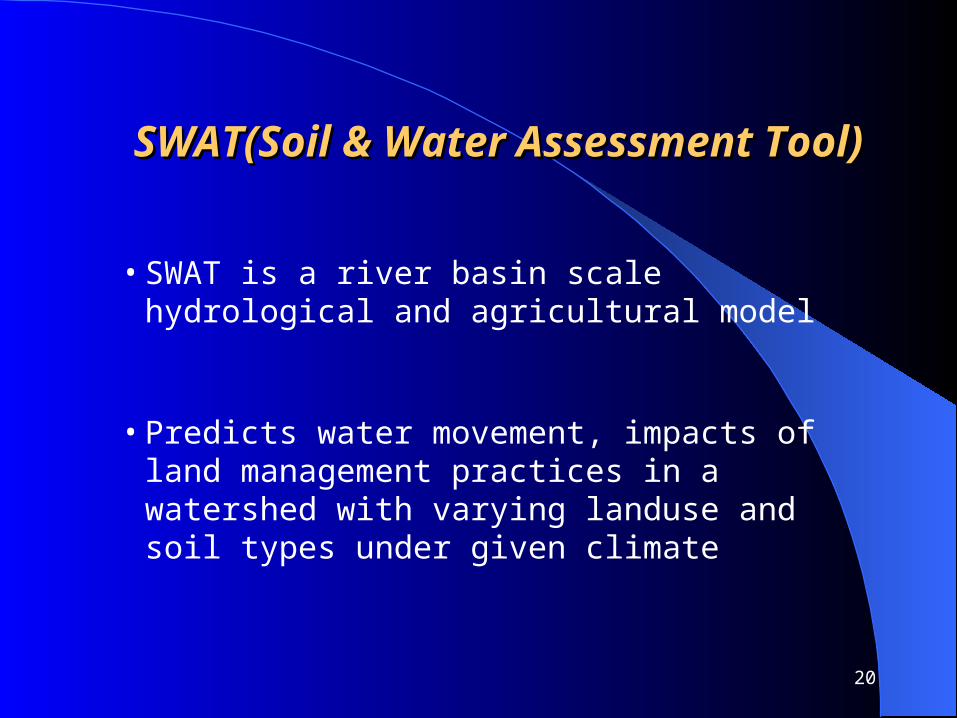
SWAT(Soil & Water Assessment Tool)SWAT(Soil & Water Assessment Tool)
• Predicts water movement, impacts of land management practices in a watershed with varying landuse and soil types under given climate
• SWAT is a river basin scale hydrological and agricultural model
21
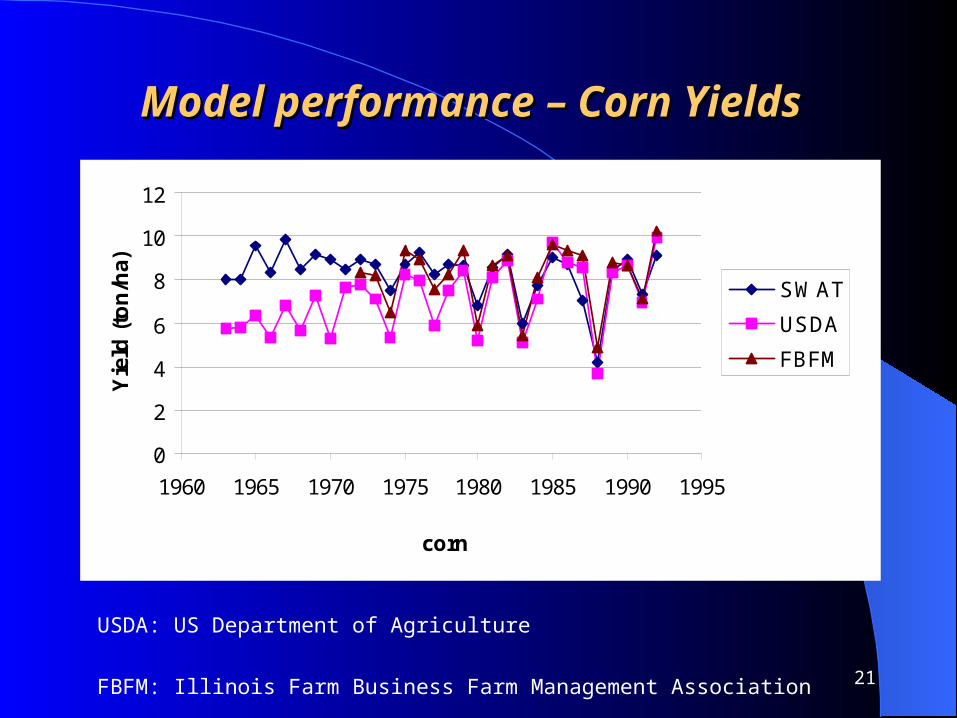
Model performance Model performance – Corn Yields– Corn Yields
corn
0
2
4
6
8
10
12
1960 1965 1970 1975 1980 1985 1990 1995
Yie
ld (
ton
/ha)
SWAT
USDA
FBFM
USDA: US Department of Agriculture
FBFM: Illinois Farm Business Farm Management Association
22
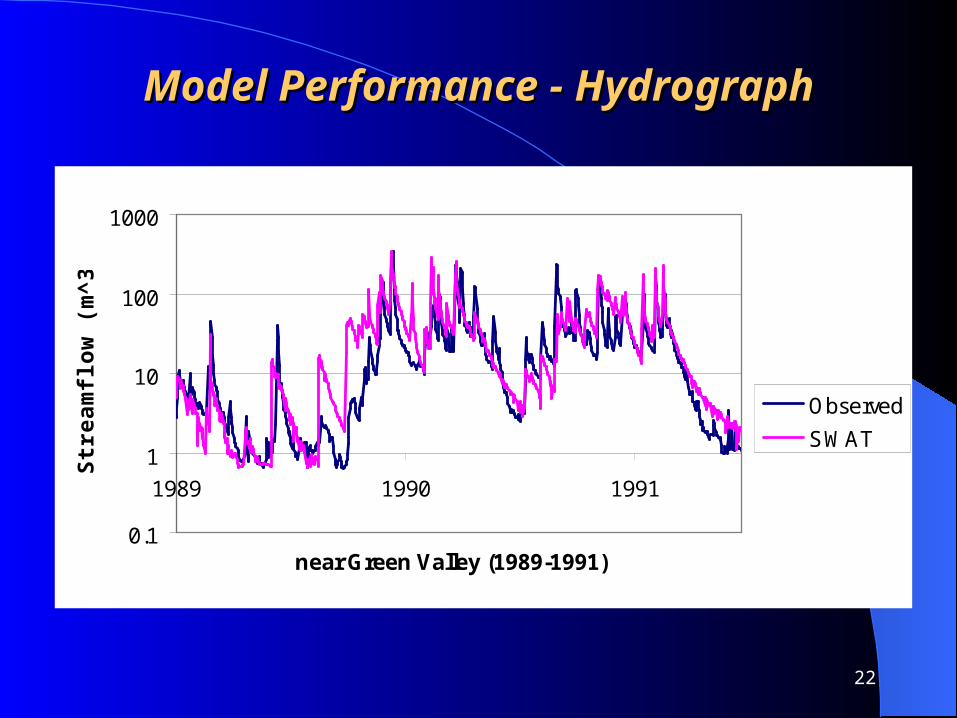
Model Performance -Model Performance - Hydrograph Hydrograph
near Green Valley (1989-1991)0.1
1
10
100
1000
1989 1990 1991
Str
ea
mfl
ow
(m
^3
/s)
Observed
SWAT

23
ResultsResults
24
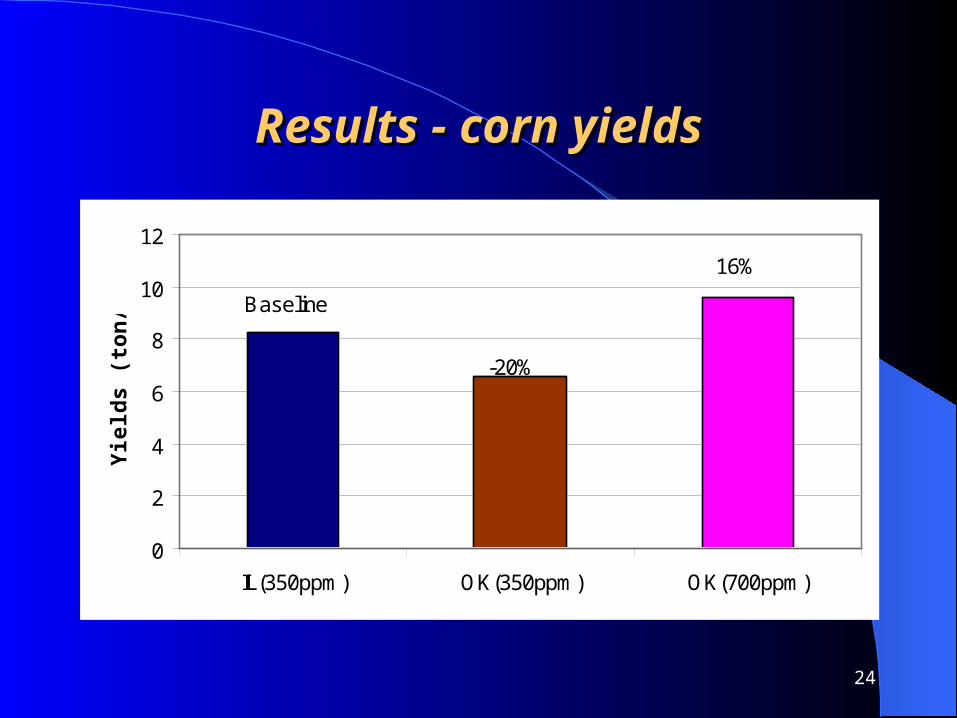
Results - Results - corn yieldscorn yields
0
2
4
6
8
10
12
IL(350ppm) OK(350ppm) OK(700ppm)
Yie
lds
(to
n/h
a)
Baseline
-20%
16%
25
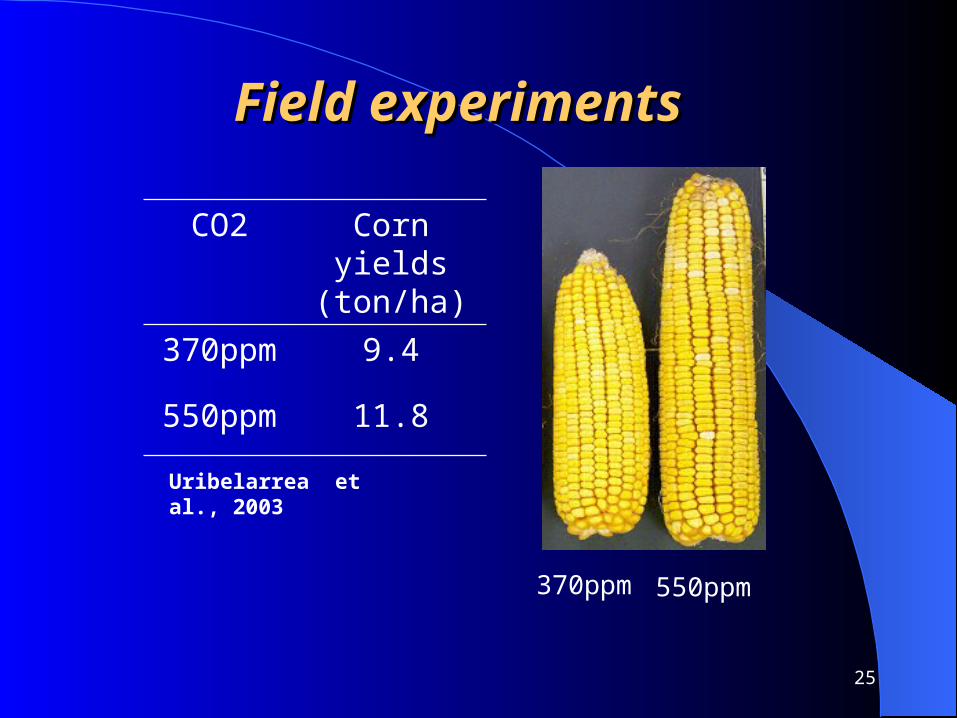
Field experimentsField experiments
CO2 Corn yields (ton/ha)
370ppm 9.4
550ppm 11.8
370ppm 550ppm
Uribelarrea et al., 2003
26
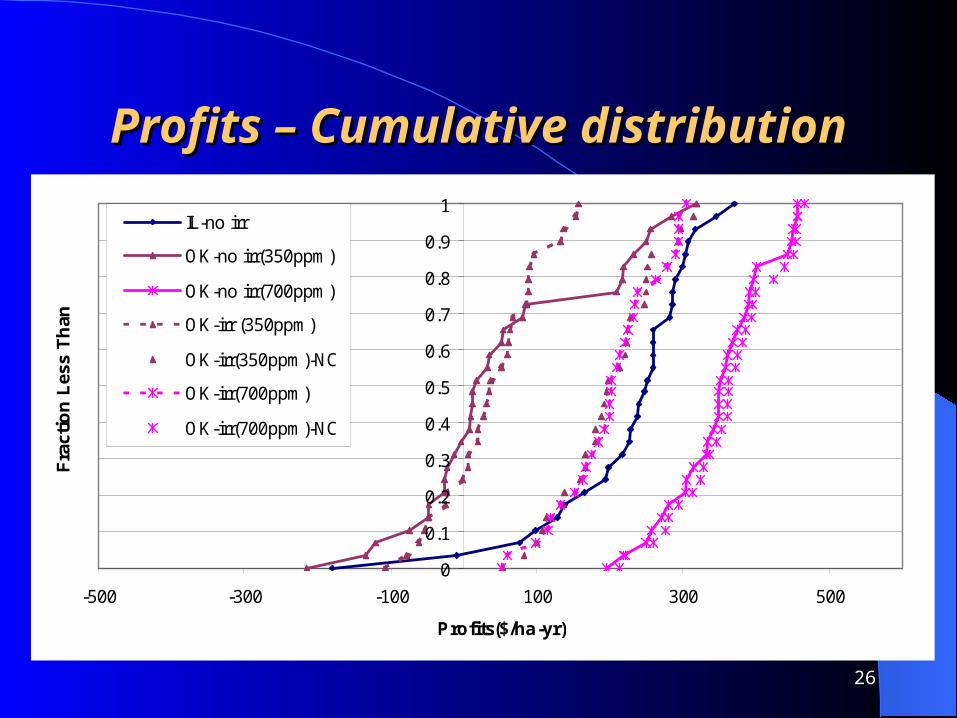
Profits – Cumulative distributionProfits – Cumulative distribution
0
0.1
0.2
0.3
0.4
0.5
0.6
0.7
0.8
0.9
1
-500 -300 -100 100 300 500
Profits($/ha-yr)
Fra
ctio
n L
ess
Th
an
IL-no irr
OK-no irr(350ppm)
OK-no irr(700ppm)
OK-irr (350ppm)
OK-irr(350ppm)-NC
OK-irr(700ppm)
OK-irr(700ppm)-NC
27
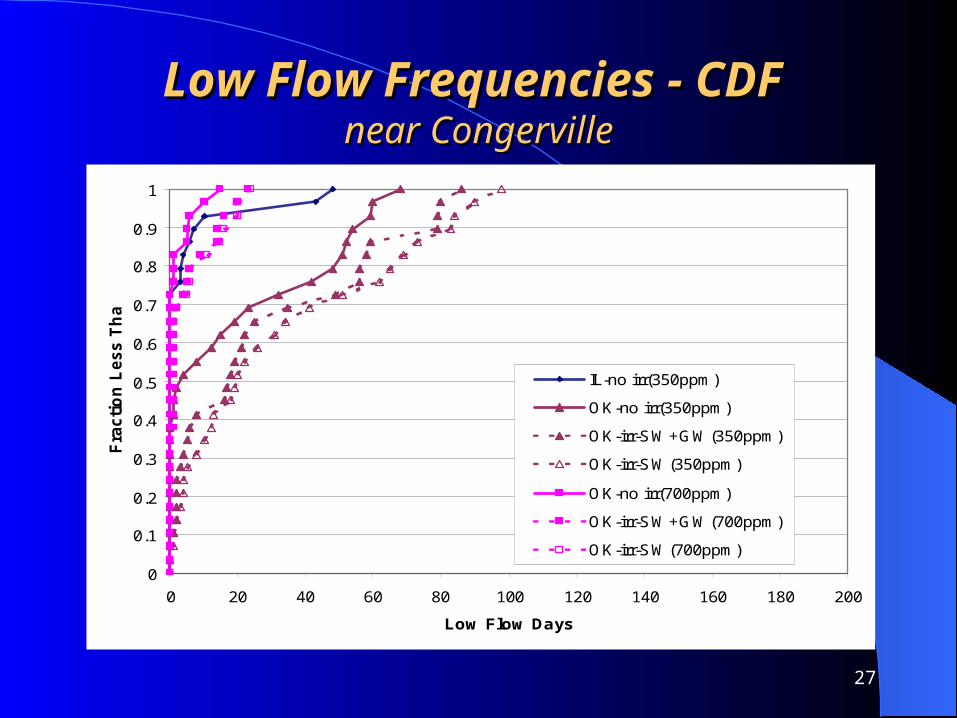
LLow Flow Frequencies - CDF ow Flow Frequencies - CDF near Congervillenear Congerville
0
0.1
0.2
0.3
0.4
0.5
0.6
0.7
0.8
0.9
1
0 20 40 60 80 100 120 140 160 180 200
Low Flow Days
Fra
cti
on
Le
ss
Th
an
IL-no irr(350ppm)
OK-no irr(350ppm)
OK-irr-SW+GW(350ppm)
OK-irr-SW(350ppm)
OK-no irr(700ppm)
OK-irr-SW+GW(700ppm)
OK-irr-SW(700ppm)
28
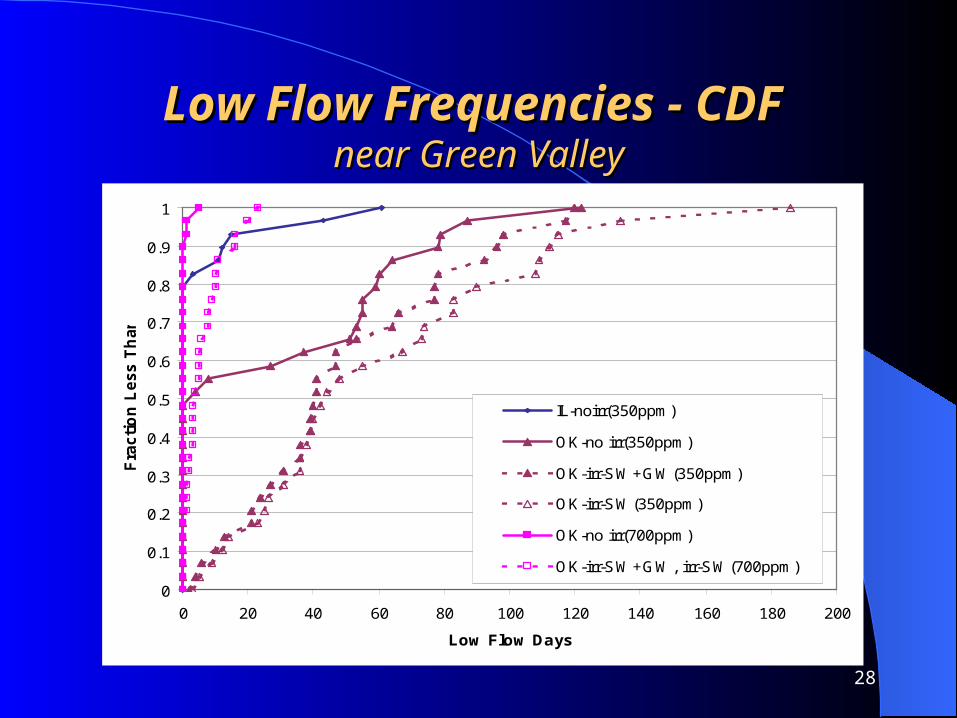
LLow Flow Frequencies - CDF ow Flow Frequencies - CDF near Green Valleynear Green Valley
0
0.1
0.2
0.3
0.4
0.5
0.6
0.7
0.8
0.9
1
0 20 40 60 80 100 120 140 160 180 200
Low Flow Days
Fra
cti
on
Le
ss
Th
an
IL-noirr(350ppm)
OK-no irr(350ppm)
OK-irr-SW+GW(350ppm)
OK-irr-SW(350ppm)
OK-no irr(700ppm)
OK-irr-SW+GW, irr-SW(700ppm)
29
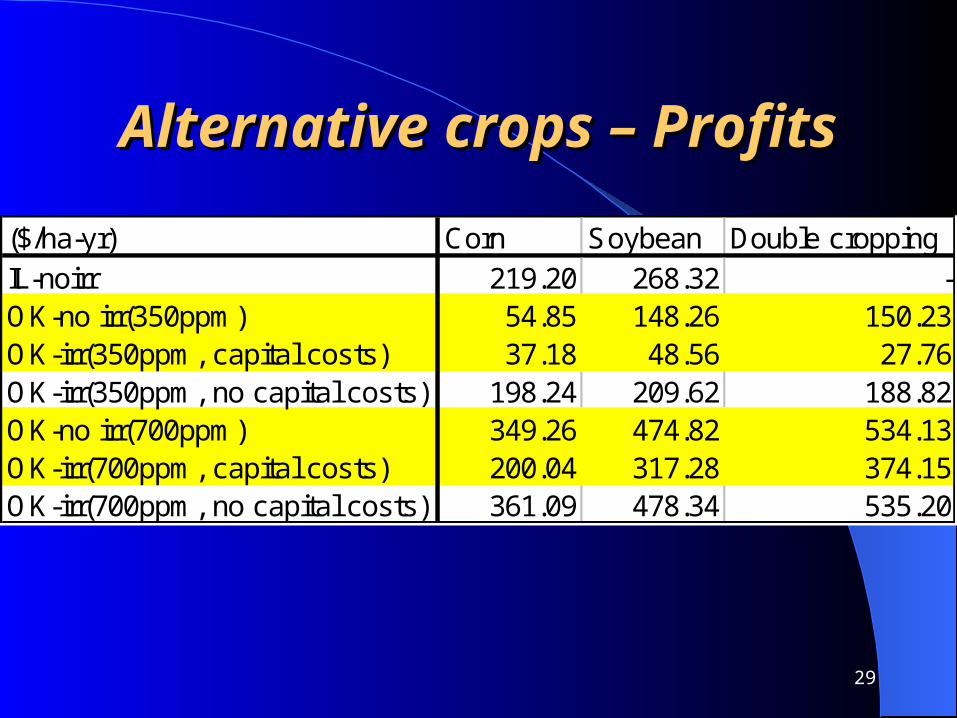
Alternative crops – ProfitsAlternative crops – Profits
($/ha-yr) Corn Soybean Double croppingIL-noirr 219.20 268.32 -OK-no irr(350ppm) 54.85 148.26 150.23OK-irr(350ppm, capital costs) 37.18 48.56 27.76OK-irr(350ppm, no capital costs) 198.24 209.62 188.82OK-no irr(700ppm) 349.26 474.82 534.13OK-irr(700ppm, capital costs) 200.04 317.28 374.15OK-irr(700ppm, no capital costs) 361.09 478.34 535.20
30
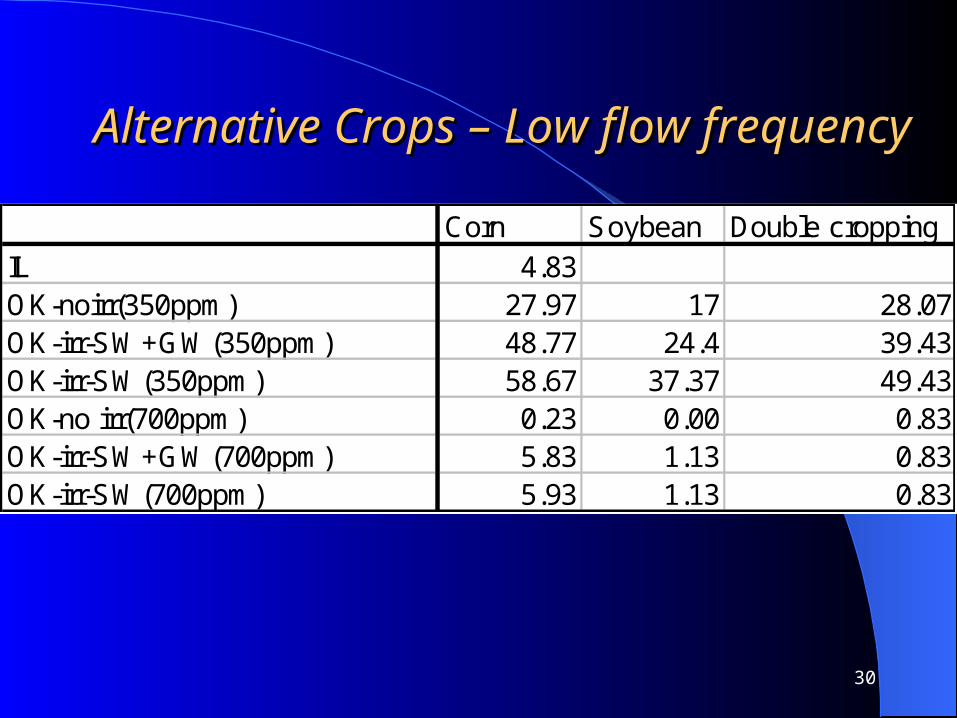
Alternative Crops – Low flow frequencyAlternative Crops – Low flow frequency
Corn Soybean Double croppingIL 4.83OK-noirr(350ppm) 27.97 17 28.07OK-irr-SW+GW(350ppm) 48.77 24.4 39.43OK-irr-SW(350ppm) 58.67 37.37 49.43OK-no irr(700ppm) 0.23 0.00 0.83OK-irr-SW+GW(700ppm) 5.83 1.13 0.83OK-irr-SW(700ppm) 5.93 1.13 0.83
31
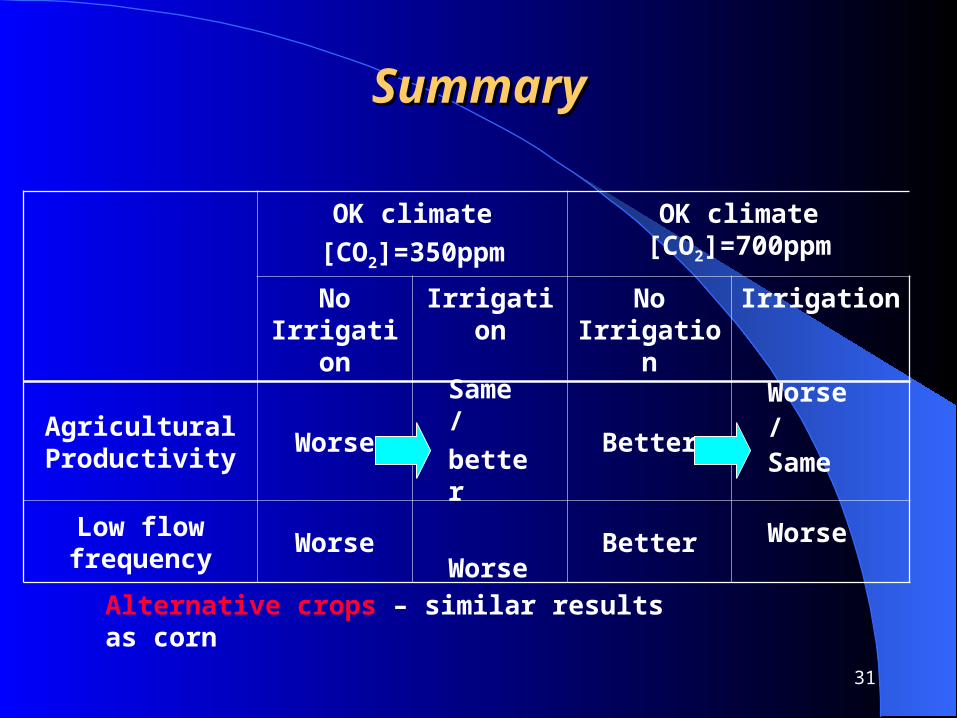
SummarySummary
OK climate
[CO2]=350ppm
OK climate [CO2]=700ppm
No Irrigation
Irrigation No Irrigation
Irrigation
Agricultural Productivity
Worse Better
Low flow frequency
Worse Better
Alternative crops – similar results as corn
Same /
better
Worse
Worse / Same
Worse
32
ImplicationsImplications
Climate change could leave basins more or less unchanged
Irrigation could threat health of aquatic systems Regulatory program to control surface water withdrawals in IL
33
LimitationsLimitations
Uncertainty - climate change scenarios- Down-scaling techniques- Model adequacy for simulating elevated
CO2
- Model adequacy for simulating double cropping
34
AcknowledgementsAcknowledgements
•Dr. Jeff Arnold, Dr. Susan Neitsch, and Ms. Nancy Sammons – USDA ARS Blackland Research Center , Temple, TX