Embed Size (px)
Citation preview
~j(l IN-1326_ / 1 ()
1 . I J
lf7gl IN-1326
December. 1969
lASTER
PRELIMINARY RESULTS AND TEST EXPERIENCE OF
THE CAROLINAS VIRGINIA TUBE REACTOR CONTAINMENT
-1EAKAGE RATE TESTS --by
G. E. Bingham J. A. Norberg R. C. Schmitt 0. A. Waddoups
IDAHO NUCLEAR CORPORATION NATIONAL REACTOR TESTING STATION
IDAHO FALLS, IDAHO
· ' · r ~ ' I, t,. 1 .. 1 r ...
U. S. ATOMIC ENERGY COMMISSION
DISCLAIMER
This report was prepared as an account of work sponsored by an agency of the United States Government. Neither the United States Government nor any agency Thereof, nor any of their employees, makes any warranty, express or implied, or assumes any legal liability or responsibility for the accuracy, completeness, or usefulness of any information, apparatus, product, or process disclosed, or represents that its use would not infringe privately owned rights. Reference herein to any specific commercial product, process, or service by trade name, trademark, manufacturer, or otherwise does not necessarily constitute or imply its endorsement, recommendation, or favoring by the United States Government or any agency thereof. The views and opinions of authors expressed herein do not necessarily state or reflect those of the United States Government or any agency thereof.

DISCLAIMER
Portions of this document may be illegible in electronic image products. Images are produced from the best available original document.

Printed in the United States of America Available from
Clearinghouse for Federal Scientific and Technical Information National Bureau of Standards, U. S. Department of Commerce
Springfield, Virginia 22151 Price : Printed Copy $3 . 00; Microfiche $0.65
LEGAL NOTICE
This report was prepared as an account of Government sponsored work. Neither the United States, nor the Commission, nor any person acting on behalf of the Commission:
A. Makes any warranty or representation, express or implied, with respect to the accuracy, completeness, or usefulness of the information contained in this report, or that the use of any information, apparatus, method, or process d isclosed in this report may not infringe privately owned rights; or
B. Assumes any liabilities with respect to the use of, or for damages resulting from the use of any information, apparatus, method, or process disclosed in this report.
As used in t he above, "person acting on behalf of the Commission" includes any employee or contractor of the Commission, or employee of such contractor, to the extent that such employee or contractor of the Commission, or employee of such contractor prepares, disseminates, or provides access to, any information pursuant to his employment or contract with the Commission, or his employment with such contractor.

' \
I
IN-1326 Issued: December 1969
Reactor Technology TID-4500
PRELIMINA-RY RESULTS AND TEST EXPERIENCE OF
THE CAROLINAS VIRGINIA TUBE REACTOR CONTAINMENT
LEAKAGE RATE TESTS
By
G. E. Bingham
J. A, Norberg
R. c. Schmitt
D. A. Waddoups
IDAHO NUCLEAR CORPORATI-ON A Jointly Owned Subsidiary of
AEROJET GENERAL CORPORATION ALLIED CHEMICAL CORPORATION PHILLIPS PETROLEUM tOMPANY
U. S. Atomic Energy Commission Research and Development Report Issued Under Contract AT(l0-1)-1230
Idaho Operations Office
THIS DOCUMENT IS UNLIM"f.f:D DISTRIJlUTION OF v

ACKNOWLEDGMENTS
The authors recognize those persons who have contributed to the completion of this test project. Those who gave managem:mt and program direction pertinent to the work discussed in this report include N. K. Sowards, Idaho Nuclear Corporation; 0. J. Miller and- H. T. Babb, Carolinas Virginia Nuclear Power Associates·; and members of the CVNP A Technical Advisory Research Subcommittee.
Special thanks are due to M. B. Jones, Jr., Carolinas Virginia Nuclear Power Associates, Project Engineer for the CVTR test series, and other members of the CVNPA operations staff.
Particular acknowledgment also goes to H. G. Seipel of the Institute for Reactor Safety of the Technical Inspection Association, Cologne, Germany, and R. M. Millhollin formerly. with Phillips Petroleum Company for their technh;al ::;upport. S. G. Englert, M. J. Johnson, G. L. Munk.i't:::;, alll.l K. Nli of Idaho Nuclear Corporation and other National Reactor Testing Station personnel also contributed significantly to the success of the CVTR program.
''
1i

ABSTRACT
Containment leakage rate tests were performed on the Carolinas Virginia Tube Reactor to. investigate the effects of pressure, temperature, and design basis accident (DBA) conditions on containment leakage rate. The results of these tests as well as the instrumentation used, the test procedures, and the problems encountered are presented in this report.
iii

SUMMARY
This preliminary report contains the results and the test experience from a leakage rate test series performed on the Carolinas Virginia Tube Reactor (CVTR) containment system. The primary objective of these tests was to evaluate the effects of containment temperature and pressure on leakage rate. Additional objectives were to determine the adequacy and sensitivity of generally accepted leakage rate measurement techniques, evaluate leakage rate analytical· extrapolation equations, and obtain ba.,c::epoint data for evaluating the effects of simulated design basis accident (DBA) conditions upon the CVTR containment leakage.
Presented in the report are descriptions of the CVTR facility, test procedures, test instrumentation, test results, general recommendations, and conclusions. A detailed description of the prohlemR P.nr.n11nt.er.ed during the CVTR leakage rate tests is also included as part of this report.
The results presented in this report were calculated from data from only one absolute and one reference vessel measurement system, although several systems of each type we:re used to obtain test data. These results from the two measurement systems analyzed indicate that both systems provided reliable and accurate measurements of containment leakage rate with the reference vessel method providing data with slightly less scatter. For a particular leakage path, the containment vessel leakage rate increased and decreased with pressure as predicted by established extrapolation equations. An increase in containment temperature reduced the leakage rate for the same pressure. Subjection of the containment system to DBA conditions did not increase the ambient temperature leakage rate and possibly caused a slight decrease.
The tests at CVTR showed that leak paths, and as a result leakage rates, could and did change from time to time even though care was taken to prevent changes. Because of these changes in le~ paths, a contimtnnR le;:~k;:~ge r~te system that provides a constant knowledge of containment integrity may be the most useful system for realistic containment leakage rate measurements.
iv
CONTENTS
ACKNO~EOOMENTS . . • . . . . . • . • • . . • . . • . • • • • • • . • • . . • • . • • ii
ABSTRACT • • • • • • . • • • • • • • • • • • • • • • • • • • • • • • • • • • • • • • • • • • • iii
SUMMARY. • • • • • • • • • • • • • • • • • • • • • • • • . • . • • • • • • • • • • • • • • • • iv
I. INTRODUCTION . • • • • • • . • . . . • . . • . . • . . . . . . . • • • . . . • . . . 1
1. PROGRAM OBJECTIVES • • • • • • • • • • • • • • • • • • • • • • • • • • • • • 1
2. REPORT ORGANIZATION • • • • • • • • • • • • • • • • • • • • • • • • • • • • 2
II. EXPERIMENTAL METHOD • • • • • • • • • • • • • • • • • • • • • • • • • • • • • 3
1. FACILITY DESCRIPTION • • • • • • • • • • • • • • • • • • • • • • • • • • • • 3
2. TEST DESCRIPTION. • • • • • • • • • • • • • • • • • • • .• • • • • • • • • • • • 5
3. TEST PROCEDURE • . . . . . . . . . . • . . • • . . . . . . . . . . . . . . . . 5
4. TEST INSTRUMENTATION AND EQUIPMENT. • • • • • • • • • • • • • • 6
4.1 Reference Vessels • • • • • • • • • • • • • • • • • • • • • • • • • • • • • • 6 4.2 Absolute and Differential Pressure • • • • • • • • • • • • • . • • • • • 8 4.3 Temper·atm·e ........ ·. . . . . . . . . . . . . . . • . . • • • • • • • • 12 4.4 Humidity • • • • • • . • . • • • • . . • . . • • • . . • . • . • . . . . . • . . . 14 4.5 Containment Liner Stress and Containment Expansion • • • • • • • 15 4.6 Controlled Leak Systems • • • • • • • • • • • • • • • • • • • • • • • • • • 17 4. 7 Hot Air System. . . . . . . . . . . . . . . . . . . . . . . . . . . . . . . . . 18 4.8 Instrument Accuracies ••••• ·• • • • • • • • • • • • • • • • • • • • • • • 18
III. DATA ACQUISITION ••••••••••••••••••••••••••••••••• ·~ 22
1. PRETEST PERSONNEL TRAINING AND ADMINISTRATIVE PROCEDURES • o • • • • • • • • • • • • • ....... _. • • • • • • • • • • • • • • 22
2. DATA ACQUISITION SYSTEMS •...••••••••••••••• ; ••••• 24
2.1 Digital Data Acquisition System. • • • • • • • • • • • • • • • • • • • • • 24 2.2 Analog Data Multiplexer System ••••••••••••••••••••• 24 2.3 Digital Voltmeter System • o • • • • • • • • • • • • • • • • • • • • • • • • 24
IV. TEST RESULTS . ••.........•.•...•.•............•... 28
1. LEAKAGE RATE EQUATIONS ••••••••••••••••••••••••• 28
2. LEAKAGE RATE CALCULATIONS •••••.•••••••••••••••• 29
3. AMBIENT AIR TEST RESULTS •••••••••••••••••••••••• 32
3.1 Discussion of Results. ~ ••••••.•.•.•••••••••..••..... 41 3.2 Known Leak ••••••.•.•••.••..•.•...••.••••...•.•• 42 3.3 Extrapolation Factors •••••••.....•..••.•••.••.••.•. 42
4. HOT AIR TEST RESULTS ••••. .- .••.••..•...•.••..•..••.•• 46
· 5. POST-DBA TEST RESULTS ••••. ~ ••..••• · ••.•. • •••.•••.•. 50
V. TEST EXPERIENCE .••••••.••••.••.•.•.••.•..•.•....... 51
1. MODiFIED REFERENCE VESSEL .......••.•.•••.•..•..... !;>1
2. AMBIENT AIR TESTS .•••.•••.••.••.••...•.••.••..•... 51
3. HOT AIR TESTS ...................................... 52
4. POST-DBA TEST •.....•••.•.... , , •••...... , , , , .....• 53
VI. TIECOMMENDATIONS ..•.••.•.•.•.••.• • , , • , .•....... , ... 54
1. LEAKAGE RATE MEASUREMENT METHOD ••.•...•.•........ 54
2. TEMPERATURE MEASUREMENTS ..•......•.••...••••...• 55
3. PRESSURE MEASUREMENTS ••••......••.•••.•.......•.. 55
4. HUMIDITY MEASUREMENTS •••.....•.•...•••••.•.•.•..• 57
5. INSTRUMENT LOCATIONS ...•••......... ' ....•.•...••••• 57
6. TEST LENGTH •.•••.•...•.•......•.•••.•••.•.••..••• 57
VTI. C:ONCLlTSIOJ:IlS ••••••••••••••••••••••••.•••••••.••••••• 59
v lll. HE.lt'ERENCES .· ............. · .......................... 60
FIGURES
1. CVTR vapor container • • . • . . • • . • . • . • • . • • . • . • • . . . .. • • . • . • . • . 4
2. Three -fourths -inch reference vessel system . . . . • . . . • • • • • • • • . • • • 7
3. CVTR pressure instrumentation ..•••....•......••.• · ••••••.•. 11
4. Typical temperature sensors •.•.•••.•..•....•... · •.•••.•••.• 13
5. Temperature measuring system .•••.•...•.•.••.•.••.•..••.•. 14
6. Humidity sampling system •...••••..••••...••.•.•.....•.•. 15
7. Typical strain gage installatio_n •...•....••••..•••......••••• 16
vi

8. Containment liner strain gages ....•.....•.•.........•.•... 17
9. Known leak system ...•...............................• 19
10. Fixed leak system ..... ~ ................................. 19
11. Hot air systern ...••.....••• ~ ............•............ 20
12. CVTR leakage rate data sheet . . • . . . . . . . . . . . . . . • . . . . . . . . . . . 23
13. CVTR resistance thermometer data sheet .•.•.•.....•.....•.•. 23
14. Data acquisition systems •..•.•......... ~ ......•......... 25
15. Digital data acquisition system ••..........•............... 26
16. Analog data multiplexer system .••................•.•...... 26
17. Digital voltmeter and digital printer system .••... ·. . . . . . . . .. . . . . . 27
18. Calculation sheet -- initial conditions ................ · ........ 30
19. Leakage rate calculation sheet .••..............•. · •...•.....• 31
20. Leakage rate Test 1
2i. Leakage rate Test 2
22. Leakage rate Test 3
23. Leakage rate Test 4
24. Leakage rate Test 5
25. Leakage rate Test 6
26. Leakage rate Test 7
27. Leakage rate Test 8
28. Leakage rate Test 9
6 psig . ........................... ·. . 32
13 ps ig . . . . . . . . . . . . · . . ~ . ·. . . . . . . . . . . . 33
21 ps ig . . . . . . . · . . .. ~ . . . . . . . . . . . . . . . . 34
13 psig ............................ 35
6 psig
6 psig
. •.... 35
. . . . . . . . . . . . . . . . . . . . . ,, . . . . .. . 36
13 ps ig 0 e 0 0 0 0 0 0 0 0 I e 0 0 0 0 e 0 0 0 0 II 0 0 0 .. e 0 36
21 psig . • . . . . . . . • . • . . . . . . . . . . . . .. . . . 37
13 ps ig 0 0 0 0 0 0 0 e 0 0 e 11 II 0 0 .. e 0 e II II II II • e II e 0 3 7
29. Leakage rate Test 10 -- 6 psig . • . . . . . . . . . • . . . . . . . . . . • . .. . . . 38
30. Leakage rate Tests 11 and llA -- 6 psig . . . . . . . . • . . . • . . . . . . . . 38
31. Leakage rate Test 12 13 psig ............................ 39
32. Leakage rate Test 13 21 psig ................... " ....... 39
33. Containment leakage rate at various pressures ...••••...•••••••. 43
vii
34. CVTR leakage rate scale-up factors -- Tests 1 through 5, llA, 12, and 13 . . . . . . . . . . . . . . . ~ . . . . . . . . . . . . . . . . . . . . . . . . . . 44
35. CVTR leakage rate scale-up factors -- Tests 6 through 10 ......... 45
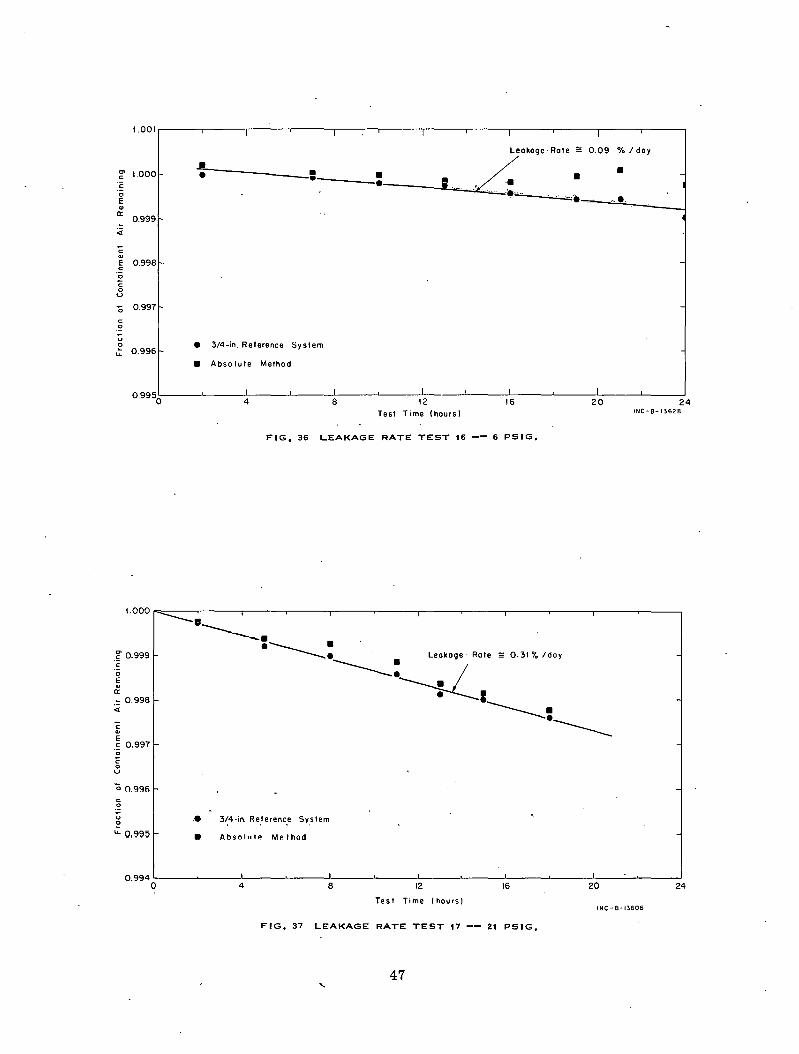
36. Leakage rate Test 16 6 ps ig ...... : ..................... 4 7
37. Leakage rate Test 17 21 psig ... · •.................•..... 47
38. Leakage rate Test 18 21 psig, 1460f' ....................... 48
39. Leakage rate Test 19 21 psig, 1~5°F ...................... 48
40. Typical external containment concrete cracks ..........•....... 49
41. Leakage rate Test 20 _ _; 21 psig ........................... 50
TABLES
I. CVTR Reference Vessels Dimensions .•....•••......... , , , , . . 9
II. CVTR Pressure Instrumentation .•••.•.•...•........•.••••. 10
III. Temperature Sensor Locations . . . . • . • • • . . • • . . • . • • . . . . . . . . . 12
IV. Leak Rate Instrumentation .••.•.•.••.•••...... ~ .•••..•••. 21
V. CVTR Leakage Rate Test Summary •.....•.................. 40
VI. Leakage Rate Extrapolation Equations .................••.•... 43
viii

PRELIMINARY RESULTS AND-TEST EXPERIENCE OF
THE CAROLINAS VIRGINIA TUBE REACTOR CONTAINMENT
LEAKAGE RATE TESTS
I. INTRODUCTION
Tests recently have been performed 9n the containm:mt system of the Carolinas Virgi~ia Tube Reactor (CVTR) Facility at Parr, South Carolina. These tests ·were performed by Phillips Petroleum Company's Atomic Energy Division [a] and the Carolinas Virginia Nuclear Power Associates, Inc., owners of the CVTR, as part of the Atomic Energy Commission's Water Reactor Safety Program.
'rhe CVTR Project[!] consisted. of three major tests:
(1) A series of leakage rate tests of the containment to evaluate leakage as a function of pressure and temperature
(2) Steam injection tests of the containment to simulate design basis accident conditions
(3) Vibration tests of the containment by two independent techniques to obtain measurements of the vibrational characteristics of the containment.
1. PROGRAM OBJECTIVES
The construction of large power reactors near population centers necessitates a knowledge of containment integrity, becau::>e, in the event of a design basis accident (DBA), the containment leakage will be a determining factor in the extent of fission product release to the atmosphere. The objectives of the CVTR integrated leakage rate tests were to perform containment leakage rate tests at both ambient and elevated temperatures and several static pressure conditions in a manner similar to that for tests being conducted for AEC
.,. compliance requirements. The specific objectives of these tests were to:
(1) Determine the adequacy and sensitivity of generally accepted leakage rate measurement techniques used in containment leak testing
(2) Evaluate the effects of. internal temperature and pressure on containment leakage
[a] Now part of Idaho Nuclear Corporation.
1

(3)" Provide basepoint data for evaluating the containment leakage resulting from a DBA occurrence
(4) Provide information on other areas of interest including the adequacy of generally accepted extrapolation equations, ipstru:rpent;~t~op r~q1,1irements, and ~rror apalysis
(5)_ Evaluate and report typical leakage rate testing experience, especially the problems encountered and the solutions to those problems. "
Attaining these objectives hopefully will aid in establishing uniform leakage testing. and reporting. Such standardization will permit independent evaluation and comparison of leakage rate test r~sults.
!:!. REPORT ORGANIZATION
This report describes th~ test experience and the preliminary evaluation o.f the results of the CVTR leakage rate tests. Also includ~d is a description of the test procedures, test instrumentation and equipment., nata gathering systems, recommendations, and conclusions. A description of the problems encountered during the leakage tests is included as part of the results section. This information, which is seldom included in leakage rate reports, is purposely detailed to point out the difficulties which can arise in containment leakage rate testing and the methods employed at CVTR to overcome these difficulties.
2
II. EXPERIMENTAL METHOD
The CVTR facility is owned by the Carolinas Virginia Nuclear Power Associates (CVNP A}, Inc., a corporation formed by four Carolinas area private utilities, and was a power demonstration prototype of a full-scale, heavy water-moderated and -cooled pressure tube reactor. The plant, located about 25 air miles northwest of Columbia, South Carolina, is adjacent to the Parr Power Station of the South Carolina Gas and Electric Company.
1. FACILITY DESCRIPTION [2]
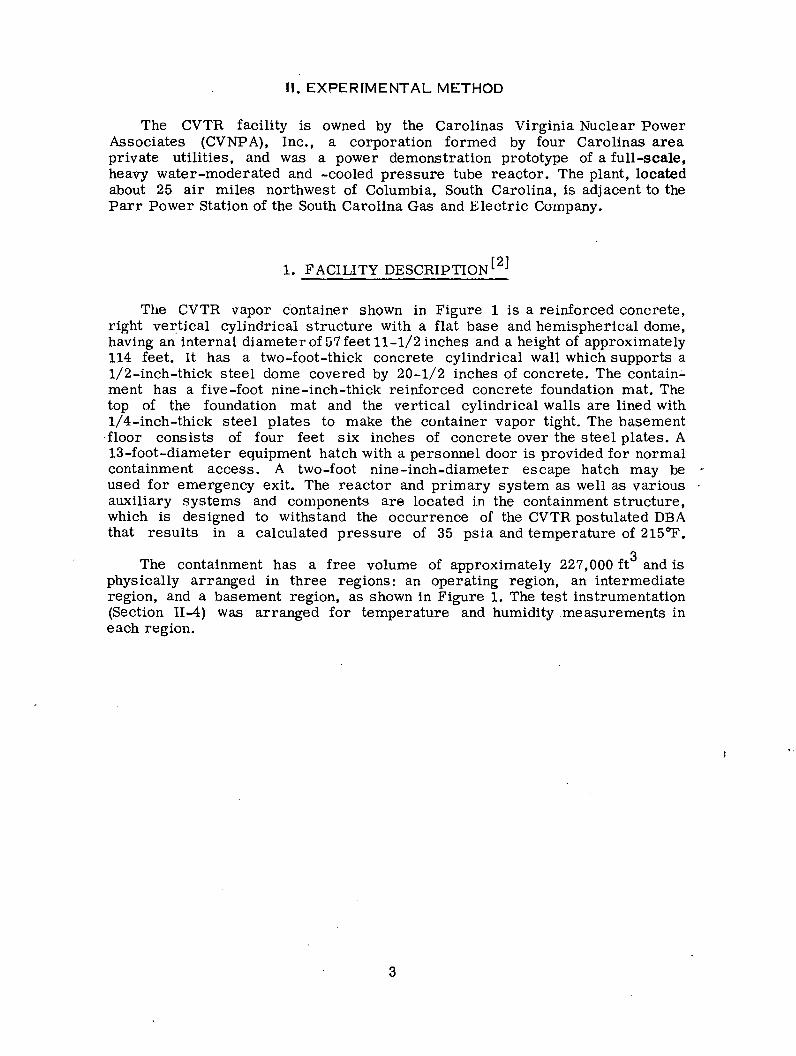
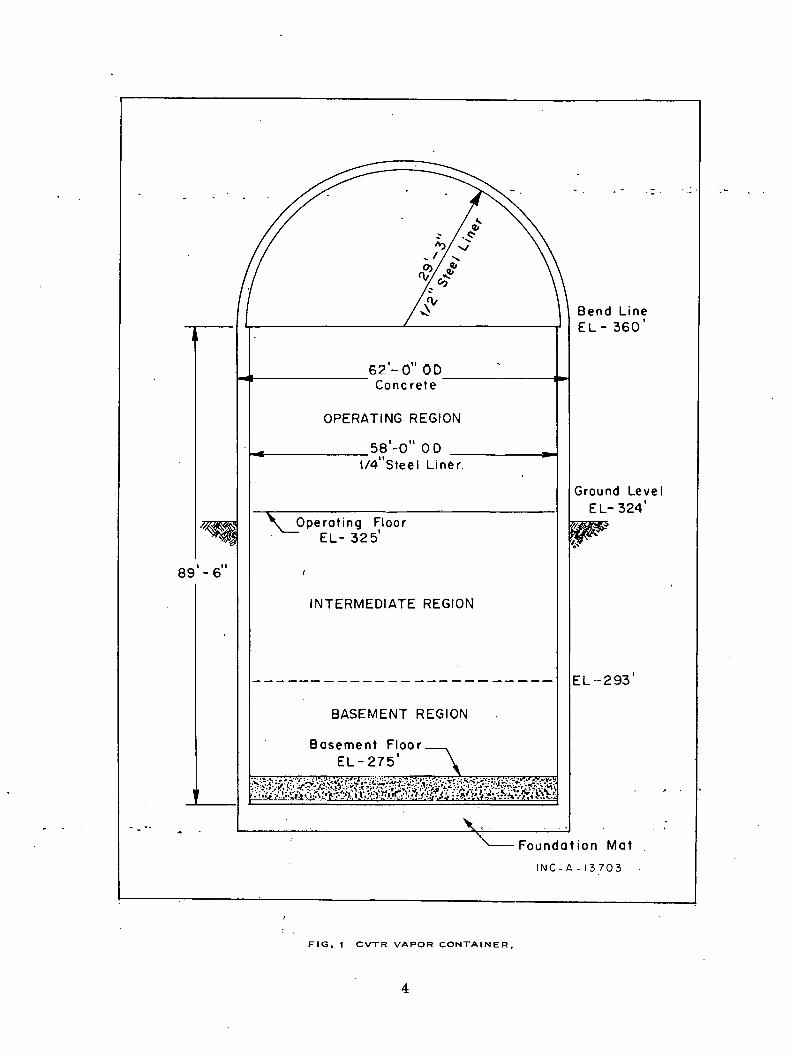
The CVTR vapor container shown in Figure 1 is a reinforced concrete, right ve~tical cylindrical structure with a flat base and hemispherical dome, having an internal diameter of G7 feet 11-1/2 inches and a height of approximately 114 feet. It has a two-foot-thick concrete cylindrical wall which supports a 1/2-inch-thick steel dome covered by 20-1/2 inches of concrete. The containment has a five-foot nine-inch-thick reinforced concrete foundation mat. The top of the foundation mat and the vertical cylindrical walls are lined with 1/4-inch-thick steel plates to make the container vapor tight. The basement
·floor consists of four feet six inches of concrete over the steel plates. A 13-foot-diameter equipment hatch with a personnel door is provided for normal containment access. A two-foot nine-inch-diameter escape hatch may be -used for emergency exit. The reactor and primary system as well as various auxiliary systems and components are located in the containment structure, which is designed to withstand the occurrence of the CVTR postulated DBA that results in a calculated pressure of 35 psia and temperature of 215°F.
The containment has a free volume of approximately 227,000 ft3 and is physically arranged in three regions: an operating region, an intermediate region, and a basement region, as shown in Figure 1. The test instrumentation (Section II-4) was arranged for temperature and humidity measurements in each region.
3
89'-6"
Bend Line EL- 360'
62'- o" OD ~~------------Concrete--------------~
OPERATING REGION
58'-o" o o ~-------------
I/4"Stee I Liner.
Operating Floor EL- 325'
INTERMEDIATE REGION
BASEMENT REGION
FIG, I CVTR VAPOR CONTAINER,
4
Ground Leve I EL-324'
EL -293'
Foundation Mat
INC-A-13703
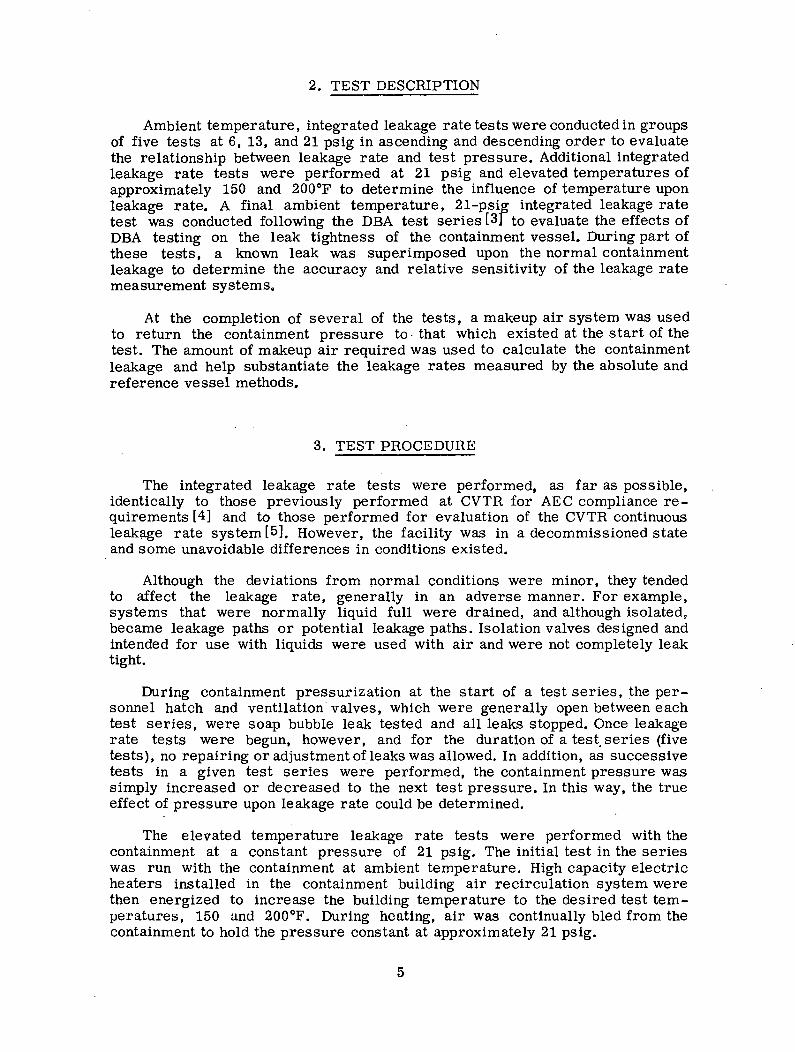
2. TEST DESCRIPTION
Ambient temperature, integrated leakage rate tests were conducted in groups of five tests at 6, 13, and 21 psig in ascending and descending order to evaluate the relationship between leakage rate and test pressure. Additional integrated leakage rate tests were performed at 21 psig and elevated temperatures of approximately 150 and 200°F to determine the influence of temperature upon leakage rate. A final ambient temperature, 21-psif integrated leakage rate test was conducted following the DBA test series [3 to evaluate the effects of DBA testing on the leak tightness of the containment vessel. During part of these tests, a known leak was superimposed upon the normal containment leakage to determine the accuracy and relative sensitivity of the leakage rate measurement systems.
At the completion of several of the tests, a makeup air system was used to return the containment pressure to. that which existed at the start of the test. The amount of makeup air required was used to calculate the containment leakage and help substantiate the leakage rates measured by the absolute and reference vessel methods.
3. TEST PROCEDUllE
The integrated leakage rate tests were performed, as far as possible, identically to those previously performed at CVTR for AEC compliance requirements [ 4] and to those performed for evaluation of the CVTR continuous leakage rate system [5]. However, the facility was in a decommissioned state and some unavoidable differences in conditions existed.
Although the deviations from normal conditions were minor, they tended to affect the leakage rate, generally in an adverse manner. For example, systems that were normally liquid full were drained, and although isolated, became leakage paths or potential leakage paths. Isolation valves designed and intended for use with liquids were used with air and were not completely leak tight.
During containment pressurization at the start of a test series, the personnel hatch and ventilation valves, which were generally open between each test series, were soap bubble leak tested and all leaks stopped. Once leakage rate tests were begun, however, and for the duration of a test. series (five tests), no repairing or adjustment of leaks was allowed. In addition, as successive tests in a given test series were performed, the containment pressure was simply increased or decreased to the next test pressure. In this way, the true effect of pressure upon leakage rate could be determined.
The elevated temperature leakage rate tests were performed with the containment at a constant pressure of 21 psig. The initial test in the series was run with the containment at ambient temperature. High capacity electric heaters installed in the containment building air recirculation system were then energized to increase the building temperature to the desired test temperatures, 150 and 200°F. During heating, air was continually bled from the containment to hold the pressure constant at approximately 21 psig.
5

As the containment system approached the desired test temperature, some of the electric heaters were turned off until, at the desired test temperature, the heat input balanced the heat loss. The heaters were then manually set for a constant heat input and remained so for the duration of the test. A slight containment temperature drift was experienced, but it was very gradual .and d.id not affect the test results .• Initially, an attempt was made to auto,.. matically maintain a constant containment temperature. This method, however, caUl=>ed iarge, fluctuating containment temperature gradients and satisfactory test data could not be obtained.
Use of the constant heat input method resulted in containment air temperature gradients of about 20°F during the hot air tests. Once established, however, and regardless of the length of the test, these gradients changed very little even though the containment air recirculation system was in constant operation at a flow rate of about 25,000 ft3/min.
The final integrated leakage rate test was performed foUowing the DBA ~st series. This test was a 21-psig ambient temperature test performed identically to previous ambient temperature tests.
Before the vapor container was pressurized for a leakage rate test, the ref~rence vessels were pressurized With dry air to a pressure about 1 psig greater than that desired for the test and isolated. The containment was then pressurized to the desired test pressure and the containment and reference vessel equalizing block valves opened. Since the reference vessels were at a higher pressure than the containment, air flow during pressure equalization was always from the reference vessel to the containment, thus ensuring a dry reference vessel atmosphere and eliminating the need for reference vessel vapor pressure measurements.
TQ.e length of the leakage rate tests varied from 18 to 48 hours. For some tests, a known leak was superimposed on normal containment leakage for an additional 6 to 24 hqurs. During all tests, complete sets of dat:;~ wAr.e tR.ken hourly.
4. TEST INSTRUMENTATION AND EQUIPMENT
Containment temperature, pressure and humidity, and the differential pressure between the containment and each reference vessel were the primary measurements made during the integrated leakage rate tests. Secondary measurements included flow from two controlled leak systems, containment liner strain, and vapor container expansion. These measurerpents were made at various containment pressures and temperatures and provided information on containment leakage· rate, stress level, and expansion.
4.1 Reference Vessels
Two reference vessels, a one-inch-diameter and a 1/4-inch-diameter copper tube system, existed at CVTR and were used for the integrated leakage rate tests. Two additional parallel reference vessels, Figure 2, were installed for the leakage rate tests. Both vessels were constructed of 3/4-inch-diameter
6
390'Eievation 385'
380'
370'
360'
350'
340'
330'
327'
3121
297'
2841
312' Elevation 297' Elevation
325' To Auxiliary
Building
Basement
3011
293'
284' Elevation AOR- 2!22
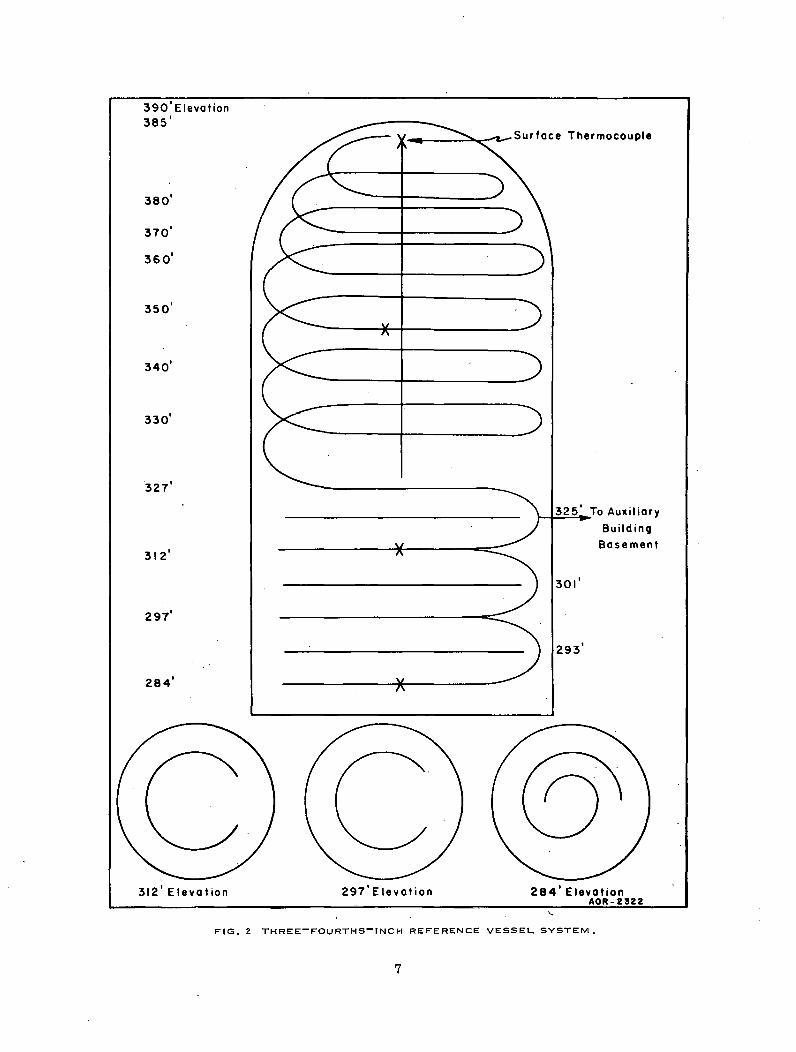
FIG, 2 THREE-FOURTHS-INCH REFERENCE VESSEL SYSTEM,
7
thin-walled, copper-refrigeration tubing and were installed as nearly as possible on a volume-weighted basis, that is, the volume of any given portion of the reference vessel was in direct proportion to the free volume of the containment in which it was located.
Both existing reference vessels and one of the 3/4-inch vessels were used in the conventional manner, that is, the vessel was sealed and the differential pressure which developed between it and the containment was measured and the data used to calculate'leakage rate. The other 3/4-inch vessel [a] was installed to determine the feasibility of a variation in the reference vessel method of determining leakage rate. This method of determining leakage did not work, however, and following the first group of tests, the vessel was sealed for use as an · additional reference system for the remainder of the leakage rate tests.
The 3/4-inch-reference vessels were fabricated by joining 50-foot sections of refrigeration tubing to form a. continuous length of tubing approximately 1400 feet long. This tubing was distributed throughout the containment vessel. A minimum distance of five feet was maintained between the reference vessel and the containment wall. The dimensions of the CVTR reference vessels are shown in Table I.
The following precautions were taken to ensure that leakage from the reference vessels was negligible:
(1) Bellows seal valves were used on the valve manifold
(2) Swaglock fittings and valve connections were soft soldered
(3) Each reference vessel was leak tested by three independent methods including:
(a) Pressurizing with air to approximately 80 psig and soap bubble checking all joints andfittings
(b) Pressurizing with helium to 21 psig and checking each joint and fitting with a portable helium leak detector
(c) Pressurizing with air. to 21 psig and monitoring the pressure with sensitive pressure instrumentation for a 24-hour period.
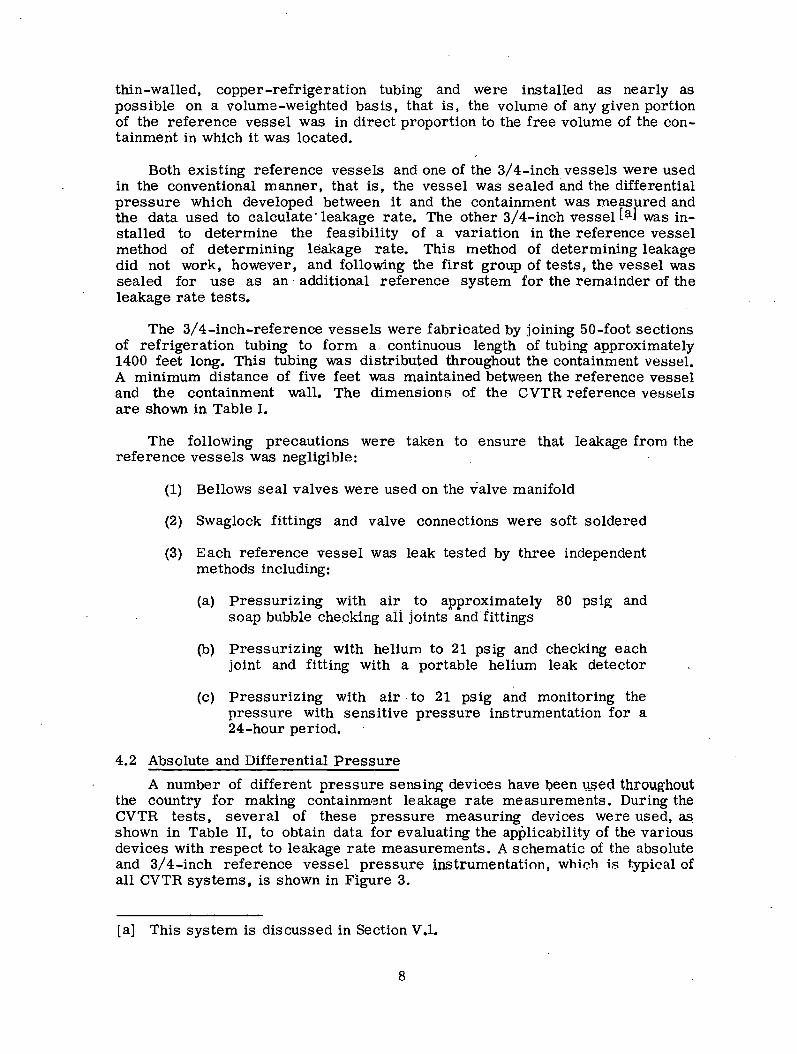
4.2 Absolute and Differential Pressure
A number of different pressure sensing devices have l:;leen U..$ed. throughout the country for making containment leakage rate measurements. During the CVTR tests, several of these pressure measuring devices were used, as. shown in Table II, to obtain data for evaluating the applicability of the various devices with respect to leakage rate measurements. A schematic of the absolute and 3/4-inch reference vessel press1,1re instrumentation, which is typical of all CVTR systems, is shown in Figure 3.
[a] This sys tern is dis cussed in Section V .1.
8

TABLE I
CVTR REFERENCE VESSELS DIMENSIONS
Vessel Diameters
System ID (in.) OD (in.)
·l-inch 0.996 1.125
3/4-inch 0.680 0.75
l/4-inch 0.190 0.25
Vessel Lengths
Volume Ratio
Location[a] Tubing Size Tubing Length Volume Outside to
(in.) ( ft) ( r:t3) Inside
l-inch Vessel
Inside containment l 206
l/4 31 l.ll 1 to 358
Outside containment l/4 16 0.0031
3/4-inch Vessel
Inside containment 3/4 1389
l/4 12 3.502 l to 1297
Outside containment l/4 14 0.0027
l/4-inch Vessel
Inside containment l/4 227 0.045 l to 14.5
Outside containment l/4 16 0.0031
[a] The center of the containment wall at the reference vessel penetration was th~ dividing line between the inside arid outside of the containment.
9
..... 0
Instr1llli.ent
Two TexE.s Instrum-ents , Inc. , precisic·n pressure gages
(1) Ft:sed quartz Bourdon tube absolute capsule
(2) Ft:sed quartz Bourdon tube d~fferential capsule
Meriam ~icromanometer Fluid: Green indicating sp gr = 1.00
Meriam "U" type mancmeter Fluid: fed oil sp gr = 0.827
Meriam "U" type mancnieter Fluid: Fed oil sp gr = 0.827
Zimmerli gage Fluid: Fed oil sp gr = 0.827
·Meriam well type manometer Fluid: ~ercury
Meriam well type manometer Fluid: No. 3 indicating sp gr = 2.95
Heise gage
Barometer
TABLE II
CVTR PRESSURE INSTRUME~TATlON
Range
0 to lOO inches Hg
0 to 5 psid
0 to 20 inches water
0 to 60 inches water
0 to 6 inches red oil
0 to 9 em red oil
0 to 100 inches Hg
0 to 120 inches fl-:.lid
0 to 30 psig
26 to 32 inches Hg
Use
•:::ontainment pressure
3eference vessel - containment ·lifferential pressure - 3/4-inch system
~eference vessel - containment diff~rential pressure - 3/4-inch system
~eference vessel - containment •iifferential pressure - l-inch system
~eference vessel - containment d.ifferential pressure - 1/4-inch system
Reference vessel - containtnent •iifferential pressure - 1/4-inch system
Containment pressure
Containment pressure
Containment pressure
Atmospheric presst:re

Vapor Container ·
Flow Transducer
Instrument
Auxil1ary Equipment Area
I I I I I_ __
Line·/
-------Capsule is I Texas I 0-5 psid I instruments, I line. Precision I I Pressure I Gage I l _____ _j.
Mi cromanometer 0-20 in. Water
Texas Capsule is 0-100 in./Hg Instruments, Inc. Precision Pressure Gage
Instruments, Inc. Precision Pressure Gage
Flow Recorder
Capsule is 0-100 in./Hg
INC·B·I3690
FIG. 3 CVTR PRESSURE INSTRUMENTATION •
11

All pressure instrumentation, except the Heise gage, was located in the auxiliary building basement; the Heise gage was located in the reactor control room.
4.3 Temoerature
Temperature measurements of the containment atmosphere were made · tvHli29 Clirotnei-Aiumel thermocouples and 15 platinum resistance thermbmeters, aii of which were positioned throughout the containment on a volume-weighted basis. Temperature measurements of the 3/4-inch reference vessel and the containment liner were obtained by four thermocouples attached to the surface of the reference vessel and 14 thermocouples attached to the surface of the containment liner. The location of the temperature sensors by containment regions is shown in Table III.
TABLE III
TEMPERATURE SENSOR LOCATIONS
Temperature Measurement
Atmospheric
Thermocouples
Resistance thermometers
Liner
Thermocouples
Reference vcosels
Thermocouples
!'Jumber in
Basement . Intermediate
5 6
3 6
3
1 2
Regluu
Operating Dome
16 2
5 l
7 0
1 0
[a] Ineludes two thermocouples located benea.t.h 2-inch-thick polyurethane sheets.
The thermocouples were fabricated at the test site from premium grade thermocouple wire. The junctions were made by fusing the two wires together into a bead about 3/16 inch in diameter. To reduce the effects of thermal radiation, all atmosphere thermocouples exceiJl one were shielded with a two-inch length of one-inch-diameter hard-drawn polished copper tubing. One thermocouple was left unshielded to establish a basis of comparisons between shielded and unshielded thermocouples.
The temperature sensors were located at least two feet from any equipment that could have acted as a significant heat source or sink, and at least five feet from the containment wall. A typical resistance thermometer and shielded thermocouple installation are shown in Figure 4.
12
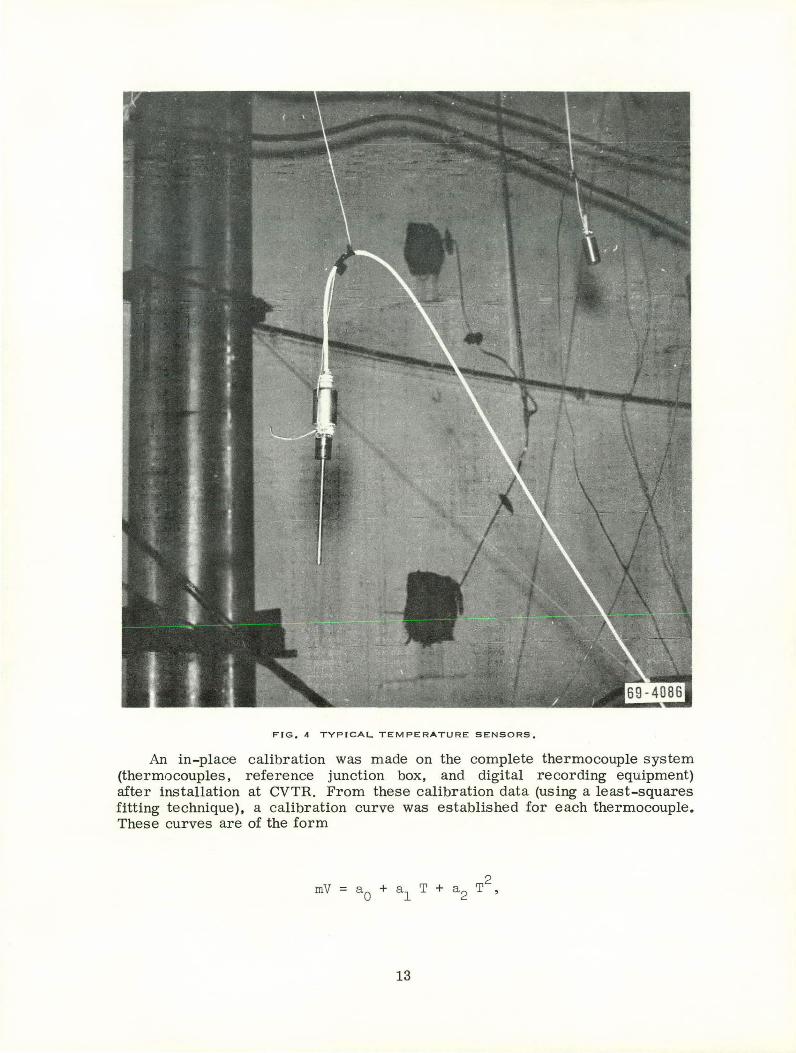
FIG. 4 TYPICAL TEMPERATURE SENSORS.
An in-place calibration was made on the complete thermocouple system (thermocouples, reference junction box, and digital recording equipment) after installation at CVTR. From these calibration data (using a least-squares fitting technique), a calibration curve was established for each thermocouple. These curves are of the form
13
where
mV = millivolt output
T temperature (°F)
ao, a1, a2 = constants.
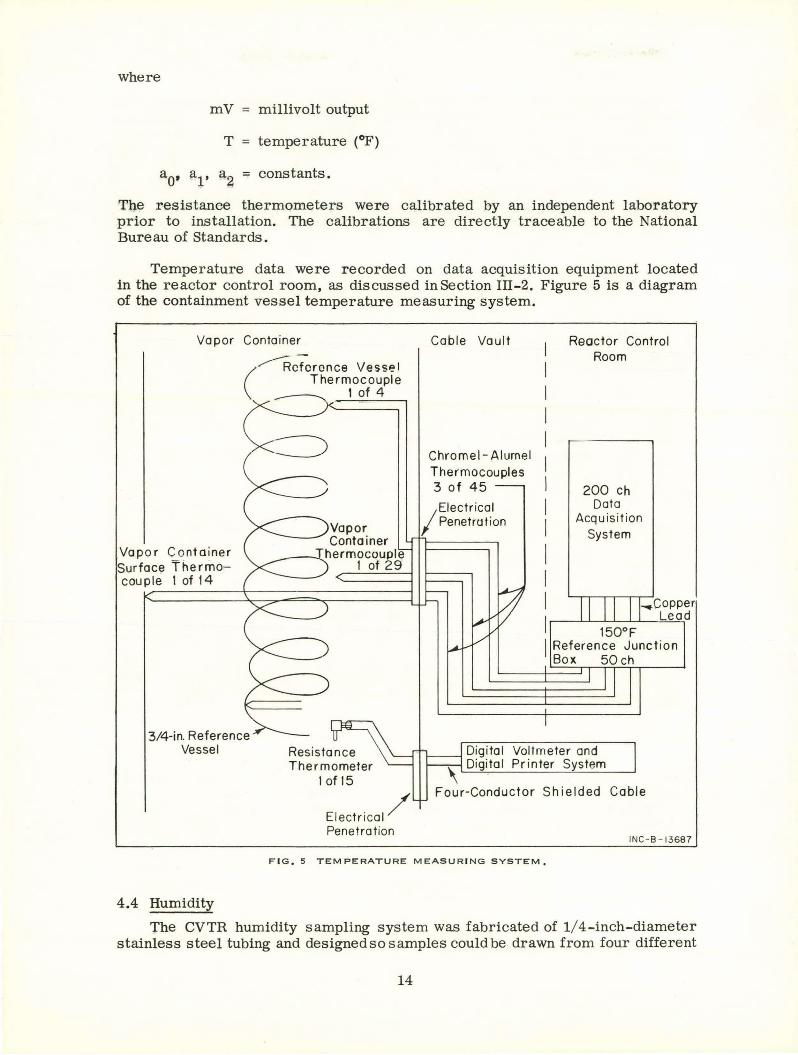
The resistance thermometers were calibrated by an independent laboratory prior to installation. The calibrations are directly traceable to the National Bureau of Standards.
Temperature data were recorded on data acquisition equipment located in the reactor control room, as discussed in Section III-2. Figure 5 is a diagram of the containment vessel temperature measuring system.
Vapor Container --(
/ Reference Vessel Thermocouple
...-------..., 1 of 4
Vapor Container Surface Thermo~couple 1 of 14
3/4-in. Reference Vessel
... .-- .
Vapor ----Container ____ _,_Thermocouple
1 of 29
Electrical/ Penetration
Cable Vault
Chrome I- Alumel Thermocouples 3 of 45
Electrical /Penetration
Reactor Control Room
200 ch Data
Acquisition System
..,.Copper Lead
Digital Voltmeter and Digital Printer System
Four-Conductor Shielded Cable
INC- 8 - 13 687
FIG, 5 TEMPERATURE MEASURING SYSTEM,
4.4 Humidity
The CVTR humidity sampling system was fabricated of 1/ 4-inch-diameter stainless steel tubing and designed so samples could be drawn from four different
14
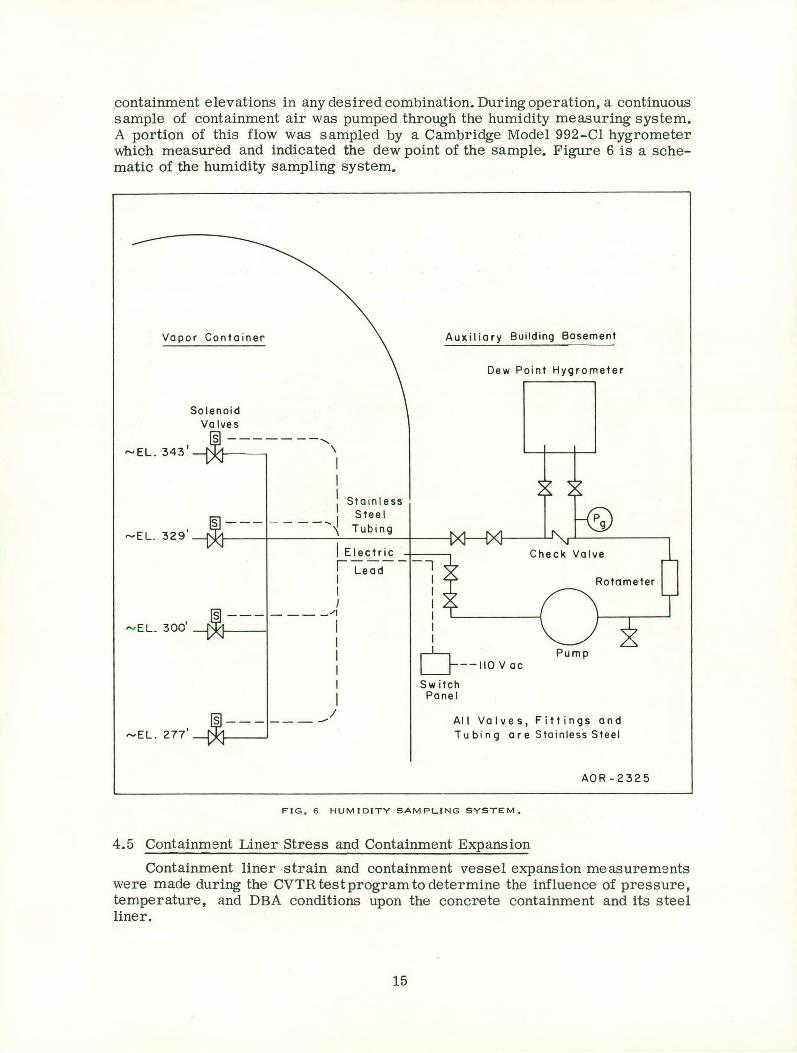
containment elevations in any desired combination. During operation, a continuous sample of containment air was pumped through the humidity measuring system. A portion of this flow was sampled by a Cambridge Model 992-Cl hygrometer which measured and indicated the dew point of the sample. Figure 6 is a schematic of the humidity sampling system.
Vapor Container Auxiliary Building Basement
Dew Point Hygrometer
Solenoid
---------... "'EL. 343
1 \
I I I Stainless 1 Steel
S --- - -- --J Tubing ~EL. 329'~1~1-----+--------~'-------+-----1
I Electric I L"e-;;-d- - -l I I I I I I
"'EL. 300'--£.=...=.- -- -"~ : I I
: D---110 V ac
I Switch 1 Panel
Pump
All Valves, Fittings and Tubing are Stainless Steel
AOR-2325
FIG, 6 HUMIDITY SAMPLING SYSTEM.
4.5 Containment Liner Stress and Containment Expansion
Containment liner strain and containment vessel expansion measurements were made during the CVTR test program to determine the influence of pressure, temperature, and DBA conditions upon the concrete containment and its steel liner.
15

Strain measurements of the steel liner were made with 83 three-component rosette type strain gages under three different test conditions:
(1) Ambient temperature-static pressure
~2)- Ele\liated temperature-static pressure thot air tests)
~3·)' DyRtam.ic temperature-dynamfc pres-su:re (DBA tests).
Because the strain gages were required to withstand DBA conditions, bonding and water proofing techniques developed at the NRTS we·re used for installation. Figures 7 and 8 show a typical strain gage installation and a section of the instrumented liner, respectively.
FIG. 7 TVPI<":AL.. STRAIN GAGE INSTAL..L..ATJON.
16

FIG. 8 CONTAINMENT LINER STRAIN GAGES.
Vertical and circumferential expansion measurements of the containment structure were attempted using six-inch strain gages bonded to the outside of the containment and by optical techniques using a surveyor's transit and scales positioned on the outside of the containment.
4. 6 Controlled Leak Systems
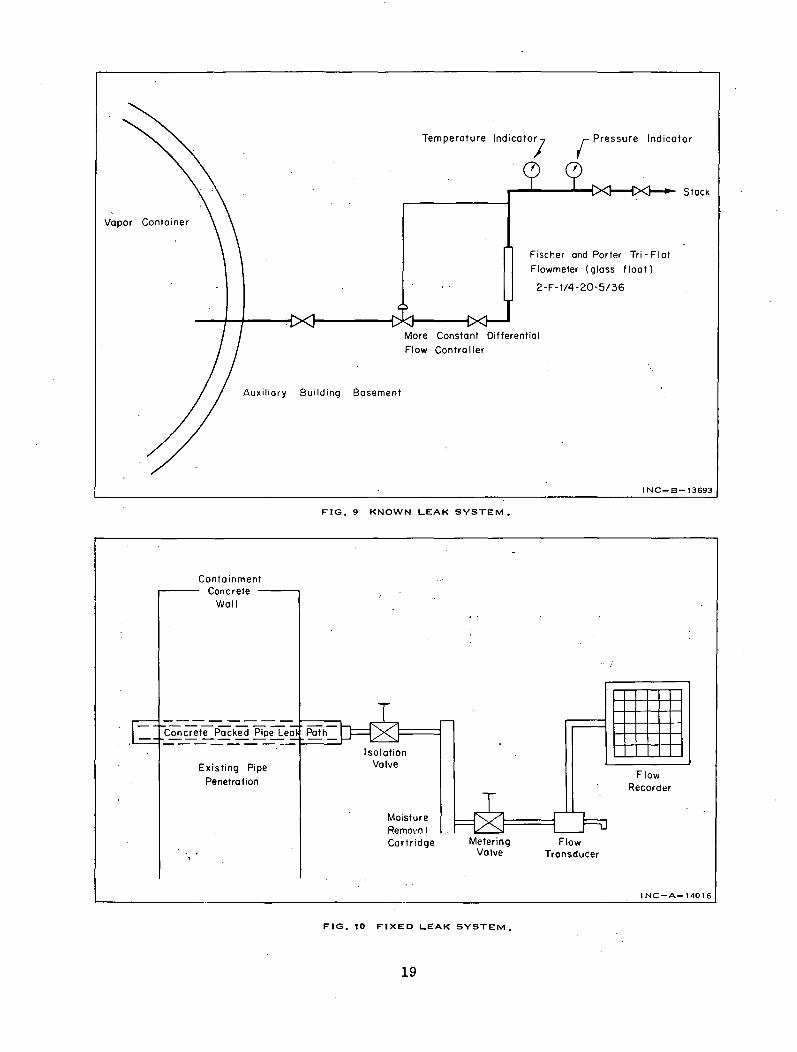
Two controlled leak systems, a known leak system and a fixed leak system, wen: iu:stalletl at CVTR. The known leak system superimposed a carefully controlled and measured leakage on normal containment leakage by purging air from the containment to the stack. This system was used during some of the
17
le~ge rate tests to help determine the sensitivity and accuracy of the CVTR leakage rate measurement systems. Figure 9 is a schematic of the known leak system.
The fixed leak system was installed to determine the influence of pressure, temperature, and DBA conditions on the leakage rate through a fixed leak path. This system, shown in Figure 10, consisted of a one-inch-diameter pipe 48 inches long, 40 inches of which were filled with crushed concrete. A fourinch-thick stainless steel wool plug was installed at each end of the pipe to hold the concrete in position. The entire assembly was welded into an existing containment penetration and vented to the stack. The flow, about 100 cm3/min, was initially set with the metering valve and then controlled either on or off as determined by the block valve, thus providing a constant leak path. Before being discharged to the stack, the air passed through a Drierite cartridge to remove the moisture and then through a Hastings mass flowmeter so the flow could be measured.
4. 7 Ilot Air Syotem
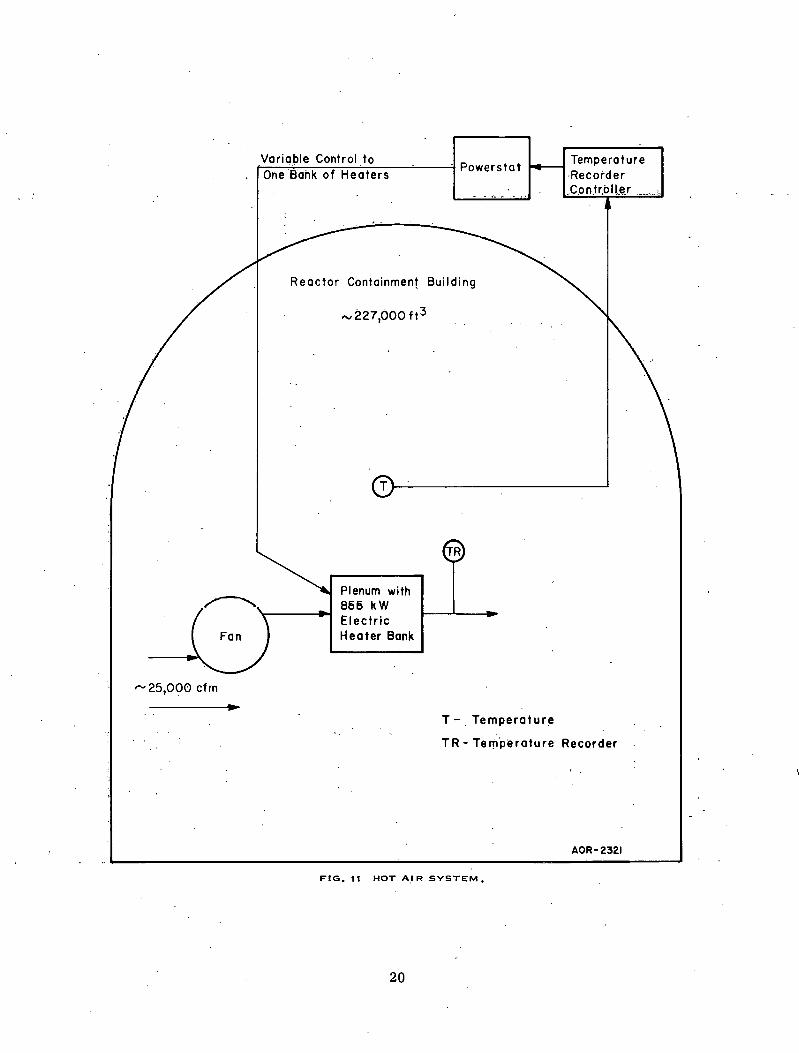
A bank of electric duct heaters totaling 855 kW was installed in the air recirculation system to heat the contamment for the hot air· lt:!::;L::;. The existing air recirculation system fan motors were replaced with larger motors so flow rates of approximately 25,000 ft3/min at 21 psig could be obtained. The motors, heaters, and power cables were designed to operate at elevated temperatures and in the air-steam environment of the DBA tests. Figure 11 is a diagram of the hot air system.
4.8 Instrument Accuracies
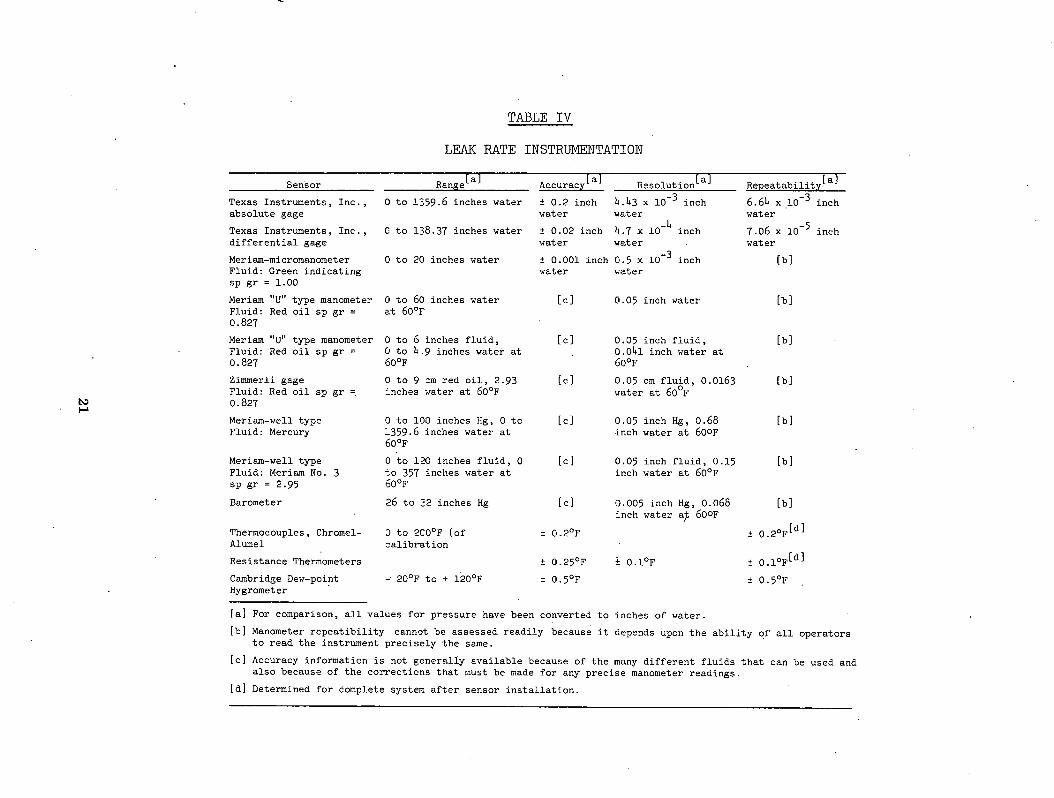
To permit evaluation and comparison of leakage rate measurements, both precision laboratory type instruments and general field type instrument::~ were used to obtain leakage rate data. Table 1 V 1s a tabulation of the lu::;LJ.' umentation used at CVTR for leakage rate measurements. The accuracies, resolution, and repeatability values shown in the table were determined experimentally where practical or obtained from the equipment BpeeifiL:atiuus. For the manometers and the barometer, the resolution was taken as one-half the minor scale division. The following definitions taken from the ISA Transducer Compendium [6] should be considered When refel'l'lng to TaLle IV;
(1) Static Error Bant:l (A~rmrl'l~y)· The devi~tion from the theor·etical transfer function under constant environmental conditions, including effects of hysteresis, friction, and repeatability as well as other sources of error which are not due to environmental variations.
(2) Resolution: The ~:>rnallest change of measurand [a] that produces a recognizable change in output. RP.Rolution is sometimes referred to as threshold in certain specific applications.
(3) Repeatability: The ability of a transducer to reproduce an output signal when the same measurand value is applied to it three successive times, under the same conditiolll:> aml ulrection. Expressed ru:; the maximum differAnr.fl between output readings.
[a] Measurand is the physical quantity, property, or condition which is measure.d.
18
Containment Concrete
Wall
Existing Pipe Penetration
Temperature r Pressure
f
Indicator
Fischer and Porter Tri- Flat
Flowmeter (glass float)
2 -F -1/4-20-5/36
Stock
More Constant Differential Flow Contra ller
Basement
FIG, 9 KNOWN LEAK SYSTEM,
Isolation Val11e
Moisture Remo\•<:11 Cartridge Metering
Val11e
FIG, 10 FIXED LEAK SYSTEM,
19
Flow Transducer
JNC-B-13693
Flow Recorder
JNC-A-14016
.- 25,000 cfm
Variqble Control to r--=--~-:-:-~;-;-;--'--:----'------=t Powers t a t
One Bank of Heaters
- ..... " . ·'
Reactor Containment Building
"'227,000 ft3
Temperature ·Recorder .C.on.tr,plte.r ~··-1.
T~----------------------~
Plenum with 856 kW Electric Heater Bank
TR
T-. Temperature
T R- Te rn·PfHatu re Recorder
AOR-2321
FIG, 11 HOT AIR SYSTEM,
20
Sensor
Texas Instruments, Inc., absolute gage
Texas Instruments, Inc., differential gage
Meriam-micrornanorneter Fluid: Green indicating sp gr = 1.00
Meriam "U" type manometer Fluid: Red oil sp gr·= 0.827
Meriam "U" type manometer Fluid: Red oil sp gr = 0.827
Zimrnerli gage Fluid: Red oil sp gr 0.827
Meriam-well type Fluid: Mercury
Meriam-well type Fluid: Meriarn No. 3 sp gr = 2.95
Barometer
Thermocouples, ChrornelAlumel
Resistance Thermometers
Cambridge Dew-point Hygrometer ·
TABLE IV
LEAK RATE INSTRUMENTATION
Ranse[a]
0 to 1359.6 inches water
0 to 138.37 inches water
0 to 20 inches water
0 to 60 inches water at 60°F
0 to 6 inches fluid, 0 to 4.9 inches water at 60°F
0 to 9 :rn red oil, 2.93 ~nches ~ater at 60°F
0 to 100 inches Hg, 0 to ~359.6 inches water at 60°F
0 to 120 inches fluid, 0 ~o 357 inches water at 60°F
26 to ~2 inches Hg
J to 2C0°F (of :ali brat ion
Accurac:z::[a]
± 0.2 inch water
± 0.02 inch water
± 0.001 inch water
[c]
[c]
[c]
[c]
[c]
[c]
± C•.2°F
± 0.25°F
± 0.5°F
Resolution[a]
4.43 x 10⁻³ inch water 4 -4 .7 X 10 inch water
C.5 X 10 -3 inch .-ater
0.05 inch water
0.05 inch fluid, 0.041 inch water at 60°F
0.05 ern fluid, 0.0163 vater at 60°F
0.05 inch Hg, 0.68 inch water at 600F
0.05 inch fluid, 0.15 inch water at 60°F
0.005 inch Hg, 0.068 inch water at
I 600F
± O.l°F
[a] For comparison, all values fer pressure have been converted to inches of water.
ReEeatabili t:z:: [a J 6.64 X 10⁻³ inch water
7.06 X 10⁻⁵ inch water
[b]
[b]
[b]
[b]
[b]
[b]
[b]
± 0.2°F[d]
± O.l°F[d]
± 0.5°F
[b] Manometer repeatibility cannot be assessed readily because it depe~ds upon the ability of all operators to read the instrument precisely the same.
[c] Accuracy information is not generaliy available because of the many different fluids that can be used and also because of the correcticns that must be made for any precise manometer readings.
[d] Determined for complete system after sensor installation.
Ill. DATA ACQUISITION
CVTR data taking and analysis methods were made as uniform and simple as possible to minimize the chance of errors, to obtain consistent andreliia:ful'e data, ancd! to establish uniform calculations of :results. Leakage rate d'atli! :iincTuding, te·mpe·:ratl!r:res., absolute: and differential. pressures., and hum~diti~~ we·:te· taken hoUJ:r1!y.
Pressure, humidity, and known leak readings were recorded manually. Resistance thermometer readings were recorded by the digital voltmeter system and manually by test personnel. · Thermocouple readings were recorded by the digital data acquisition system.
l. PRETEST PERSONNEL TRAINING AND ADMINISTRATIVE -·-----PROCEDURES
Prior to all testing, netailed test plans and procedures were prepared to fainiWirize personnel with the purpose of the tests to be conducted ami with the methods and procedures to be followed.
Measurements, such as temperature, absolute and differential pressures, and humidity, which were recorded on data sheets by test personnel. were taken every hour on the half-hour to permit personnel changes without disruption of recording interval.
Pressure and humidity, readings from the known leak system, and the resistance thermometers were recorded on prepared data sheets as shown in Figures 12 and 13.
22

Data Set TEST DATE
TIME
Cont. Pressure Heise Gage
Hg Manometer
# 3 Fluid Monom.
Cont. Pressure Texas Instrument
Micro-manometer
3/4 in. ref.
TeKas Instrument 3/4 in. ref. t.P
Z immerli Gage
1/4 in. ref.
Red Oil Manometer
1 in. ref.
Known Leak Flow Rote
Barometer
Humidity Dew Point
Aulri. Ald. Basement Outside Air Operator
CH. NO. SIN
1 3581
2 3582
3 3583
4 3584
5 3585
6 3726
7 3728
8 3730
9 3782
10 3784
11 3785
12 3788
13 3789
14 3790
15 3791
Time I Dote
# # 1968
hrs.
PSIG
in. Hg.
in.# 3 RDG Temp.
Bose RDG
~~ 1H20 tal Temp, RDG Temp. Bose RDG
Cm. Red Oil Total RiQht Left in H20 total RDG Temo. Press.
in. Hg.
277 fl. 300ft. 329 fl. 343ft. Comb. Temp" Temp. lnititiol
CVTR LEAKAGE RATE AND HOT AIR TEST DATA SHEET
PRESSWRE; HUMIDITY· KNOWN LEAK
FIG, 12 CVTR LEAKAGE RATE DATA SHEET.
RESISTANCE THERMOMETER DATA SHEET
RES. TEMP. RES. TEMP. RES. TEMP. RES. TEMP. RES. TEMP. OHMS °F OHMS °F OHMS °F OHMS • F OHMS •F
-~ ... ····-· ···-··
Remarks
KNOWN LEAK
Time Started
---Dole ---Time Slopped
---Dote ---
RES. TEMP. OHMS °F
.....
FIG, 13 CVTR RESISTANCE THERMOMETER DATA SHEET.
23
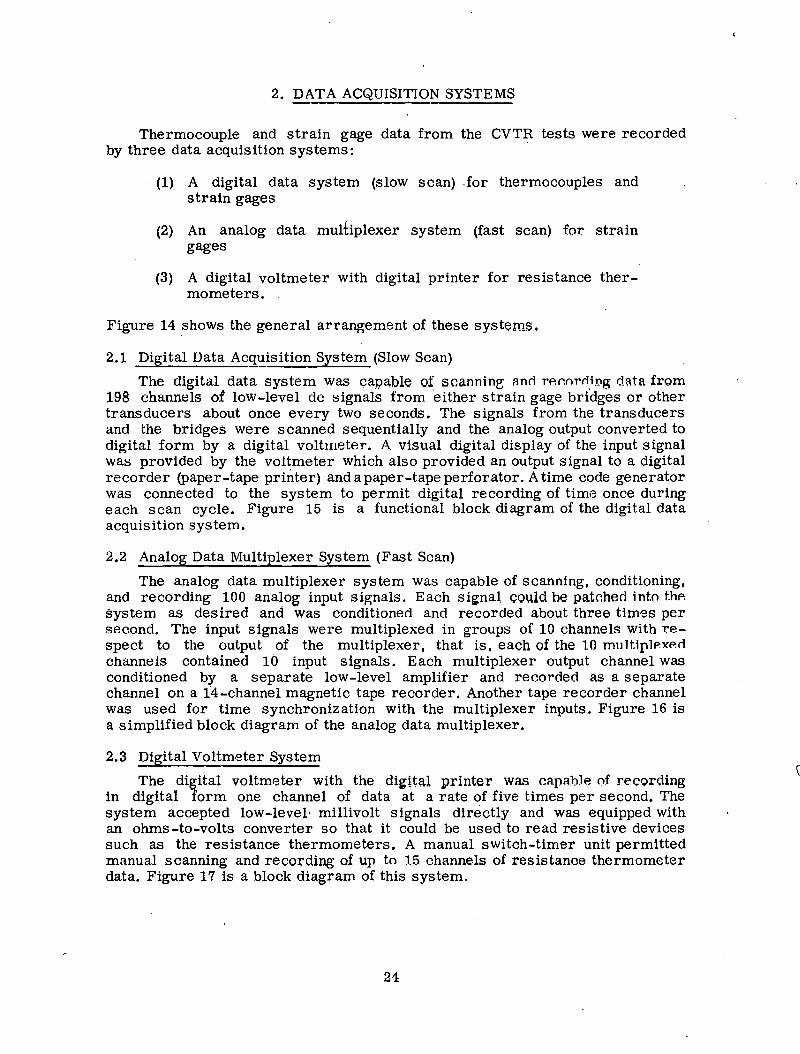
2. DATA ACQUISITION SYSTEMS
Thermocouple and strain gage data from the CVTR tests were recorded by three data acquisition systems:
· (1) A digital data system (slow scan) .for thermocouples and strain gages
(2) An analog data multiplexer system (fast scan) for strain gages
(3) A digital voltmeter with digital printer for resistance thermometers.
Figure 14 shows the general arrangement of these systems.
2.1 Digital Data Acquisition System (Slow Scan)
The digital_ data system was capa,ble of scannine ::mrl mml'diDg data from 198 channels of low-level de ::>ignals from either strain gage bridges or other transducers about once every two seconds. The signals from the transducers and the bridges were scanned sequentially and the analog output converted to digital form by a digital voltmeter. A visttal digital display of the input signal wa::> provided by the voltmeter which also provided an output signal to a digital recorder (paper-tape printer) and a paper-tape perforator. A time code generator was connected to the system to permit digital recording of time once during each scan cycle. Figure 15 is a functional block diagram of the digital data acquisition system.
2.2 Analog Data Multiplexer System (Fast Scan)
The analog data multiplexer system was capable of scanning, conditioning, and recording 100 analog input signals. Each si~nal could be patchecl into t.hA system as desired and was conditioned and recorded about three times per second. The input signals were multiplexed in groups of 10 channels with respect to the output of the multiplexer, that is, each of the 10 mult.iplP.xP.rl channels contained 10 input signals. Each multiplexer output channel was conditioned by a separate low-level amplifier and recol'ded as a separate channel on a 14-channel magnetic tape recorder. Another tape recorder channel was used for time synchronization with the multiplexer inputs. Figure 16 is a simplified block diagram of the analog data multiplexer.
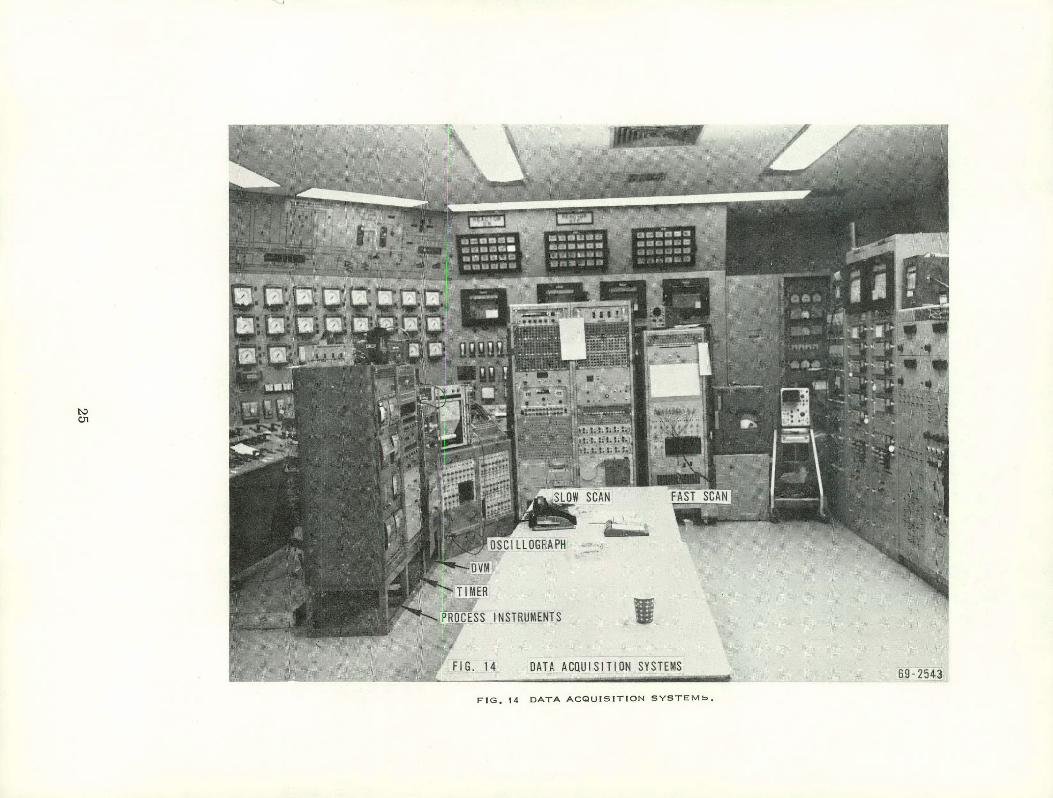
2.3 Digital Voltmeter System
The digital voltmeter with the die-ital printer wa.'3 capal:lle of recording in digital form one channel of data at a rate of five times per second. The system accepted low-level· millivolt signals directly and was equipped with an ohms-to-volts converter so that it could be used to read resistive devices such as the resistance thermometers. A manual switch-timer unit permitted manual scanning and recording of up to 15 channels of resistance thermometer data. Figure 17 is a block diagram of this system.
24
S INSTRUMENTS I Fl G. 14 OATA ACQUISITION SYSTEMS 69 -2543
FIG, 14 DATA ACQUISITION SYSTEM'=>,

~------------------------------------------------------Channel Advance
Channel Identif i cation
200-Point Scanner
Analog Output d e
Preamplifier
j ch 1-1.98 ,
!
I
-199
Bridge :Scanner Output 1 Input Pane I 1 Panel
Ch 1-192 L__j L Ch I -198 .----...J..._---,
Bridge
Power Supply Monitor
f--------Dig ita I
Voltmeter
I
Externa I !Jlputs
r-- ---~ I
Para ll el Data
Entry
t
Dig ita I Recorder
Power Supply
Serio I Data
(") ;;r 0 ::0 ::0
"' J> a. < 0 ::0 (")
"'
Completion Mnrl11IA<; h
L----,----'· I Cil I -4i:s
I I I I
r--*L--L-~L-,~nt~-Tav.,
r-
Termination Subpanel
Cl1 I ---r--
Low I
~ower
Supplies I
Strain Gages
I I I I I
Jlc,; ~v;l -;c Sig~a ~ I 1 from Thermocouples I ~~ ~e_::u~ _!r~s~ucersl
r.,, fu1 U lUI
Control and Driver
- . Logic Power Supply
FIG, 15 DIGITAL DATA ACQUISITION SYS7"EM,
l.h I Ch I Ch I I I I I I I
:....- Perforator r-Unit
Punch Power Supply
Ch- Channel
AOR- 2331
r------I I I Topo Ch I Recorder
i 8 Levell Input I Do to I Recorder I Outpu I I
~nalagl Patch I Multiplexer I Driver I Patch I
I lnputsl Panel I Relays I Amplifiers I
Panel I 8 I I I r I I
I Ch 100 Ch. 100 ('h 10 Ch 10 Ch 10
I Ch 14 14 Track I .-
: I
: ll~wleveld; Sig~l;-: Channel Identification and I Analog-to-Digital Synchro- I L_: from Thermocouples I n1zat1on I
1 and Strain Gages I L _______ L_ __ - ------
Timing M11ltiple~er Confr'ul and Ch -Channel Signal Control and Drive Relay
Electronics Power Supplies
AOR- 2332
FIG, 16 ANALOG DATA MULTIPLEXER SYS 'TEM,
26
Ohms Resistance Converter
Input (15 Channels) Switch
Timer
Low Level de Inputs
"""-
I
Mi II ivolt I Preamplifier I
1-------1
Ohms- to- I
Volts I I
Converter I I
Digital
Voltmeter Digital
Printer
AOR-2334
FIG. 17 DIGITAL VOLTMETER AND DIGITAL PRINTER SYSTEM.
27

IV. TEST RESULTS
This section contains a discussion of the equations used in calculat-ing the leakage rate of the CVTR containment, the procedures used in performing the calculations, and the results of the ambient air tests, the hot air tests, and. the post-DBA test.-
1. LEAKAGE RATE EQUATIONS
The containment leakage rate measurements were made by both the absolute method and the reference vessel method. Leakage rates were calculated using the equations recommended by the American Nuclear Society [7]. These equations are as follows [a]: · ·
where
(1) For the absolute method
24 [ percent leakage/day = lH l
(2) For the reference vessel method
·percent leakage/day=
- p I) - (P v
2 2
T (P - P ) 2 l v
1
100.
- p ). ] v2
(P I
l
(P -l
- (P l vl - p ) ]
100
H = length of the test period. (lu~)
= mean absolute temperature of the containment at the start of the test (''R)
= mean absolute .temperature of the containment at the end of the test (~)
(1)
(2)
[a] The only deviation from the recommendations of the American Nuclear Society was that the leakage rate was not calculated on an hourly basis. Rather, calculations were made from an initial data set to each successive data set to reduce the. effect of instrument error upon the leakage rate results.
28

p vl
p ~2
pl '
= absolute pressure of the containment at 'the beginning of the test (psia)
= absolute pressure of the containment at the end of the test (psia)
= containment water .vapor pressure at. the begitming of the test (psia)
= containment water vapor pressure at the end of the test (psia)
= reference vessel absolute pressure at the start of the test (psia)
p I = 2 reference vessel absolute pressure at the end of the test
(psia)
P ' = reference vessel vapor pressure at the start of the test (psia) vl
P 1 = reference vessel vapor pressure at the end of the test (psia). v2
Since the reference vessels were filled with dry air at the beginning of each test series, the reference vessel vapor pressure can be set equal to zero. Also, because the difference between the reference vessel and containment vessel pressure was measured as a differential, Equation (2) becomes
where
percent leakage/day -( li..,...P_l_+ _P_v_l.,...) ] 100
(Pl - p ) vl
= differential pressure between the containment vessel and the reference vessel at the start of the test (psid)
= differential pressure between the containment vessel and the reference vessel at the end of the test (psid)
2. LEAKAGE RATE CALCULATIONS
(3)
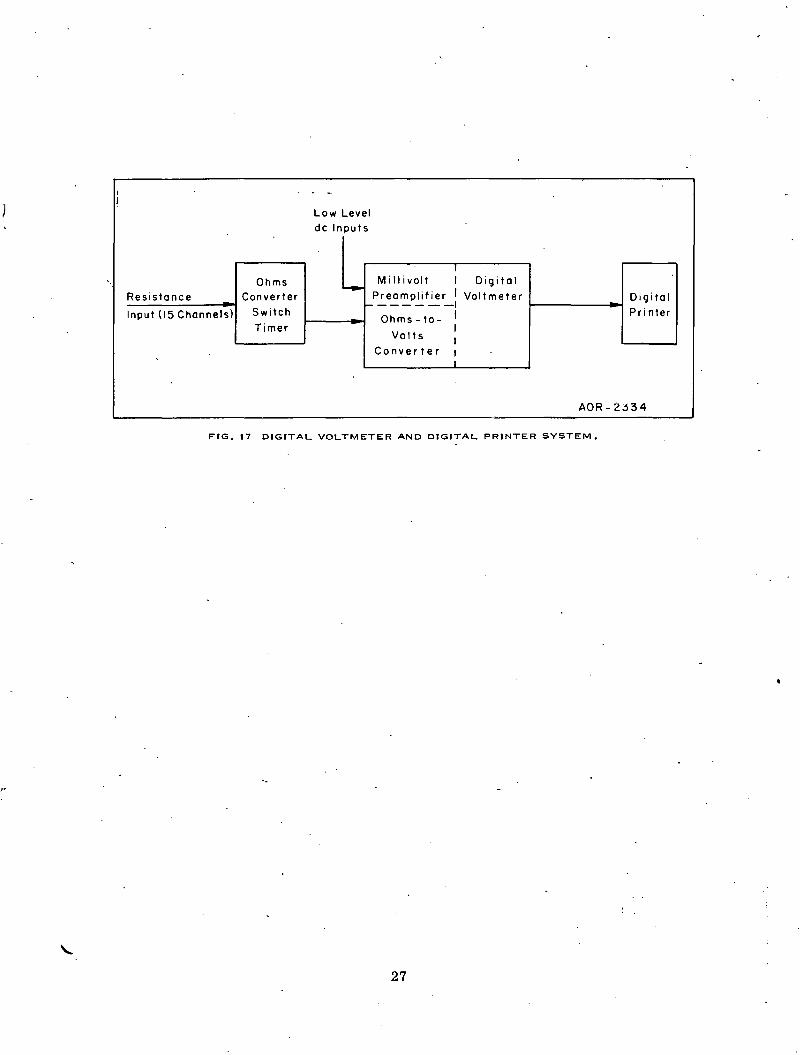
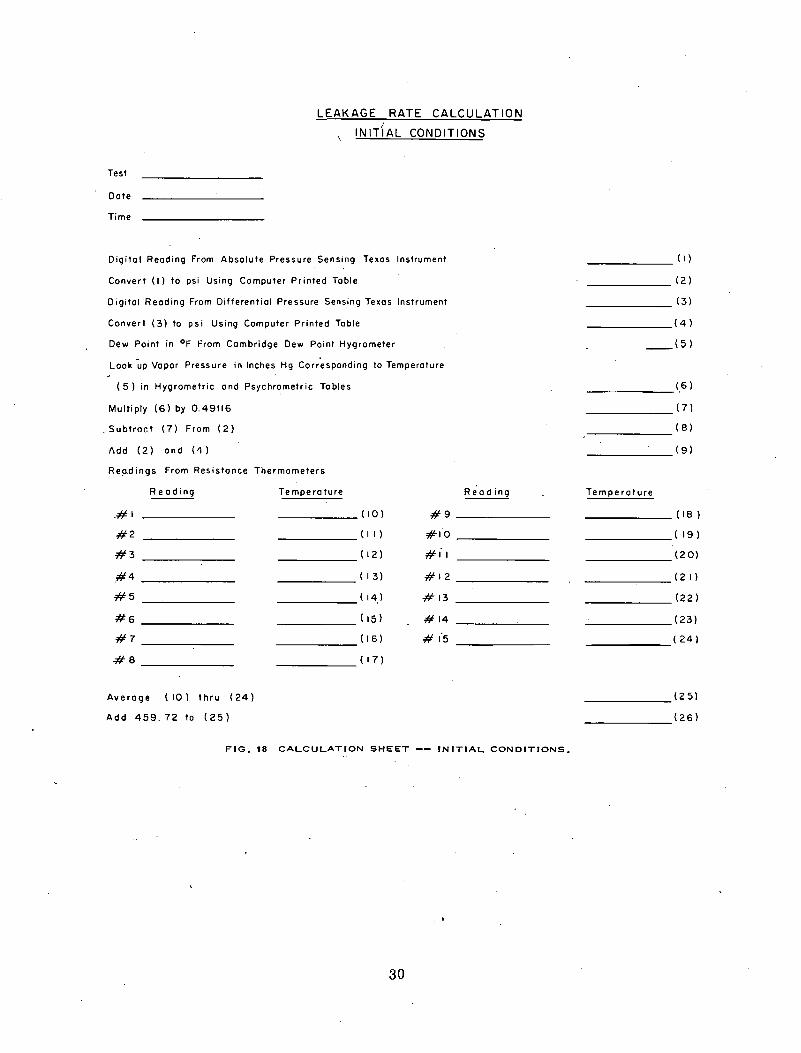
Preliminary leakage rates were calculated during testing through use of prepared calculation sheets as shown ·in Figures 18 and 19. The initial test conditions .became the base conditions for all future calculations for any given test. Leakage rat.P.R were then calculated at any desired time through use of the calculation sheet shown in Figure 19.
29
LEAKAGE RATE CALCULATION I
INITIAL CONDITIONS
Test
Dote
Time
Digital Reading From Absolute Pressure Sensing Texas Instrument
Convert (I) to psi Using Computer Printed Tobie
D igitol Reading From Differential Pressure Sensing Texas Instrument
Convert ( 3) to psi Using Computer Printed Tobie
Dew Point in °F From Cambridge Dew Point Hygrometer
Look ~up Vapor Pressure in Inches Hg Corr'esponding to Temperature
( 5) in Hygrometric and Psychrometric Tables
Multiply (6) by 0.49116
. Subtrn<;t (7) From (2)
1\dd (2) and ('1)
Re!].d ings From Resistance Thermometers
Reading Tempe ro ture
.#I
#2
#3
.#4
#5
#6
#7
#8
Average ( 10) thru ( 24)
Add 459. 72 to ( 25)
(10) #9
(II) #1.0
( 12) #II
(I 3) #12
( 14) #13
( 15) #14
( 16) # ~·s
( 17)
R~od ing
FIG. 18 CALCULATION SHEET-- INITIAL CONDITIONS.
30
(I)
(2)
(3)
(4)
(5)
(6)
(7)
(8)
(9)
Temperature
( 18)
( 19)
(20)
(2 I)
(22)
(23)
( 24)
______ (25)
______ (26)

LEAKAGE RATE CALCULATION TEST CONDITIONS
Test
Dote
Ti.me
Digital· Reading Frq,(ll, Absolute -Pressure Sensing Texas Instrument Convert (I) to psi Using Computer Printed Tobie Digital Reading From Differential Pressure Sensing Texas. Instrument Convert (3) to psi Using Computer Printed Tobie Dew Point in °F From Comb ridge Dew Point Hygrometer Look Up Vapor Pressure in Inches Hg Corresponding to Temperature
(5) In Hygrometer ond Psychrometric Tables Multiply (6) by 0.49116 Subt•oct (7) From ( 2) Add ( 4 ) o nd ( 7)
Readings From Resistance Thermometers
Reading
#I
#2
#3
#4
#5
#6
#7
#a
A veroge ( 10) thru (2 4) Add 459.72 to (25)
T emperoture
Divide Initial Conditiq~ (26) by (26) Divide ( 8) by Initial €ondition ( 8)
(10)
(tl.l
(12)
(13)
(14)
(15)
(16)
(17)
Divide 240D by th~ Time, in Hour&, Elapsed Since the Initial Conditions Were Read
Multiply (27) by (28) Subtract (30) From I. 0 Multiply (29) by (31) ~ 0/ 0 per Day= Leakage Rote by Absolute Method
Multiply <2n by < 9 l Subr.•or.t (:'17.) From'lniliul Cuolo;lition ( 9) Divide (33) by I nit iol Condition ( 8) Subtract (34) From 1.0 Multiply (29) by (35)
#9
#to
#tt
# 12
#t3
#14_
#15
______ 0/ 0 per Day= Leakage Rote by Reference Vessel Method
..
Reading
The Leakage Rote is to be Calculated Once Each Shift; at 0200, I 000 1 and 1800.
----~~---------------< I ) ----~~------------<21 ----~------------~--(3) ______________________ (4) ______________________ (5)
______________________ (6) ______________________ (7)
--~----------------<81 ______________________ (9)
Temperature
18)
(19)
(20)
(21)
(22)
(23)
(24)
(25) (26) (27) (28)
~~) (30) (31)
(32) (33) (34) (35)
FIG. 19 LEAKAGE RATE CALCULATION SHEET.
31
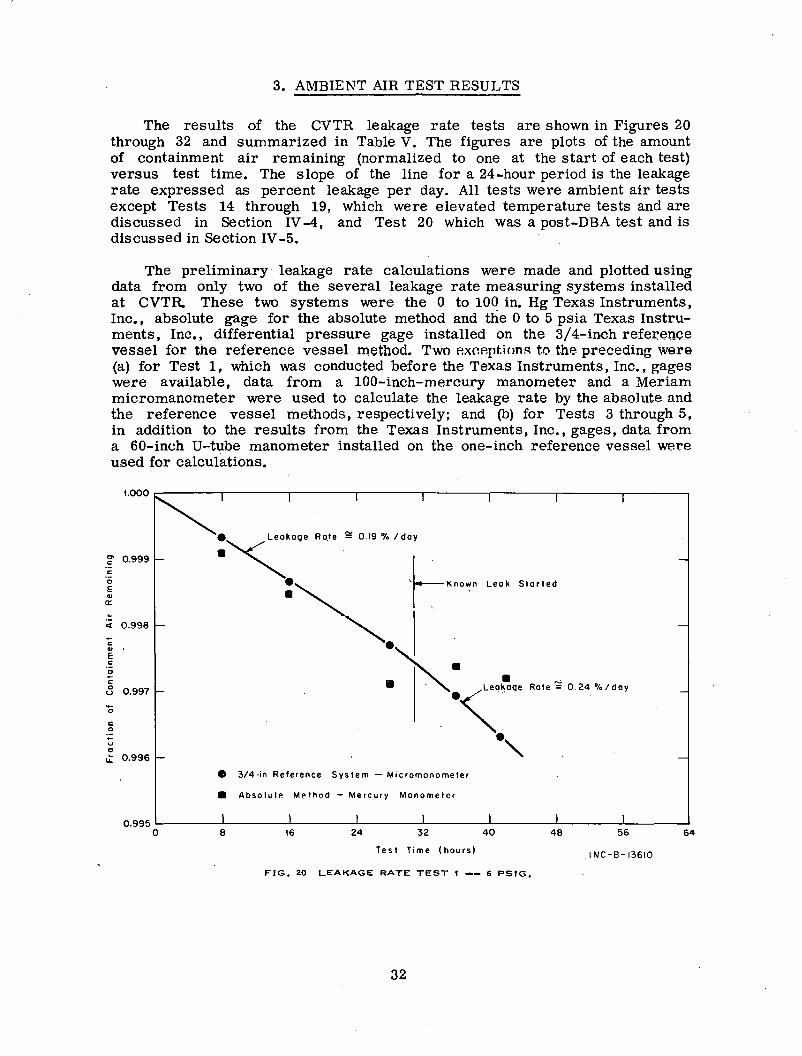
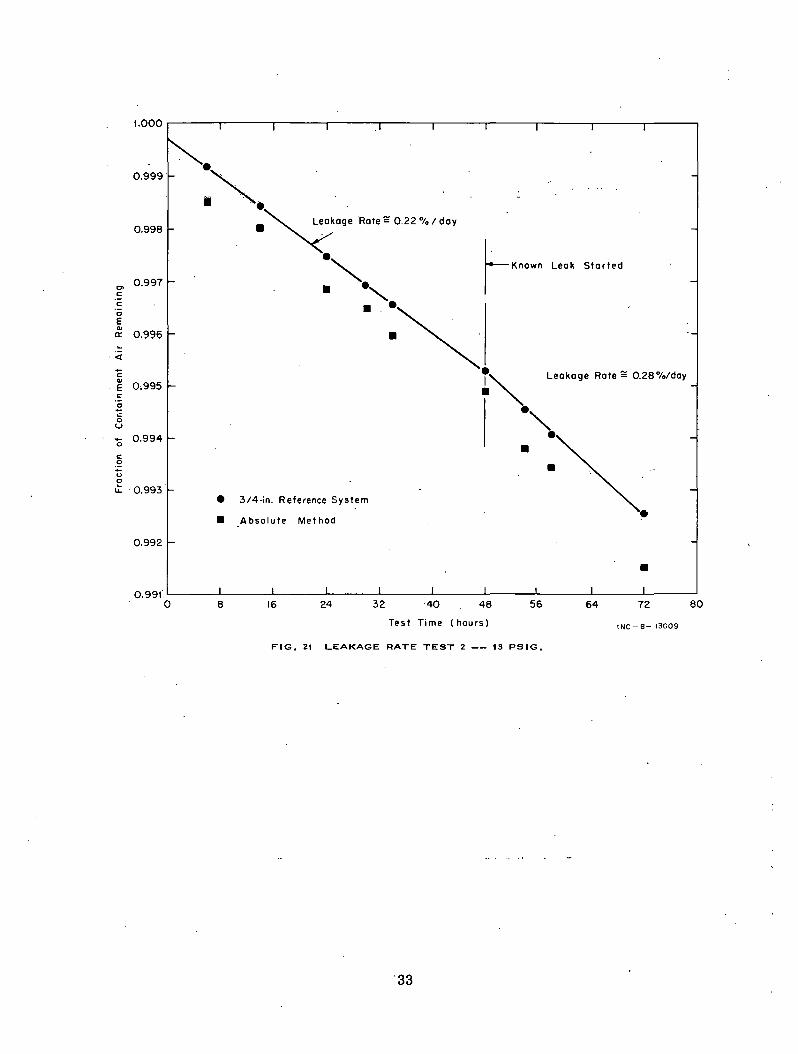
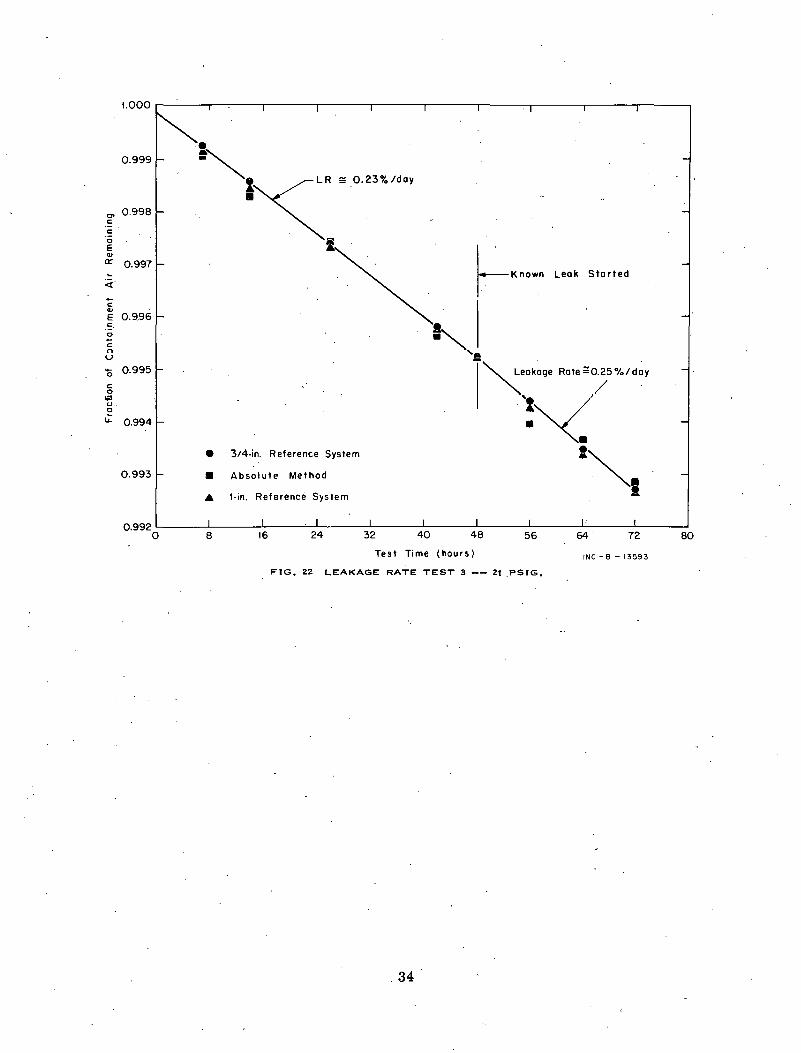
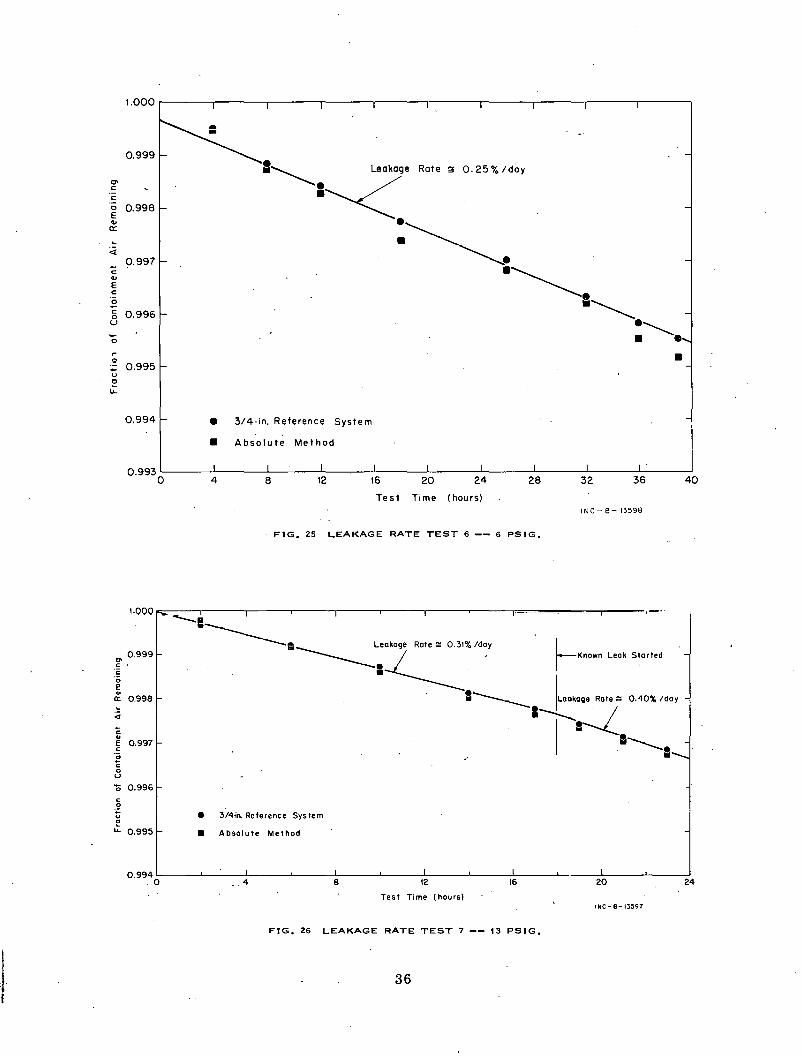
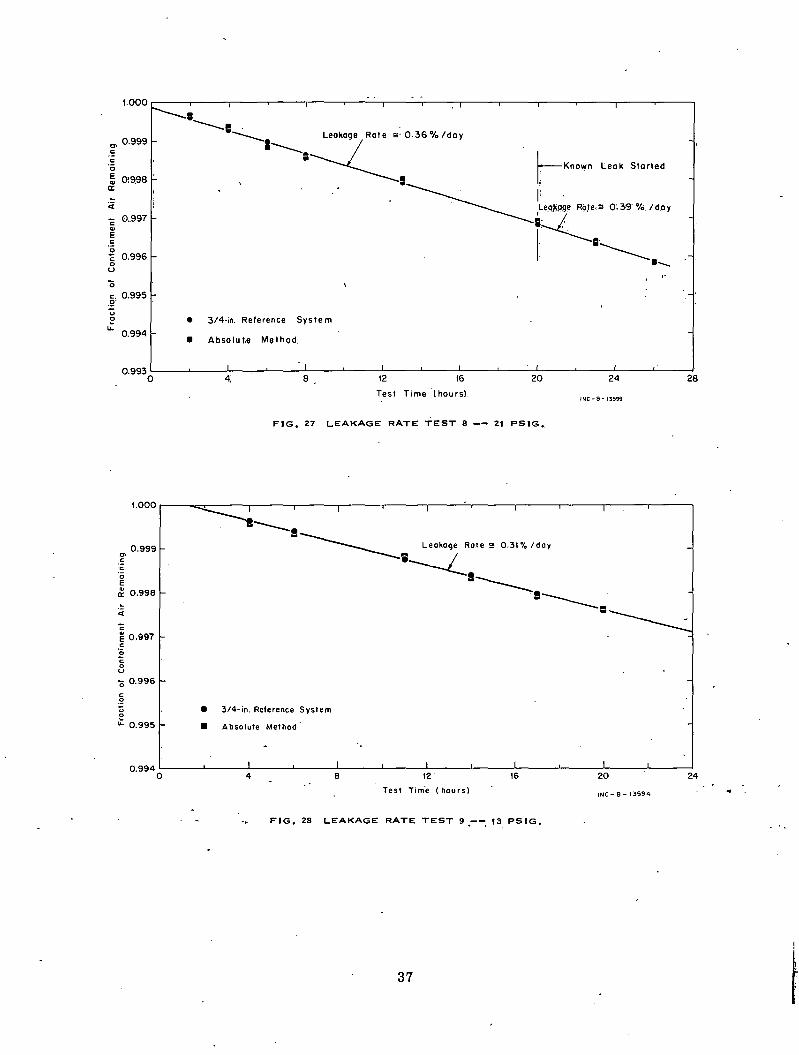
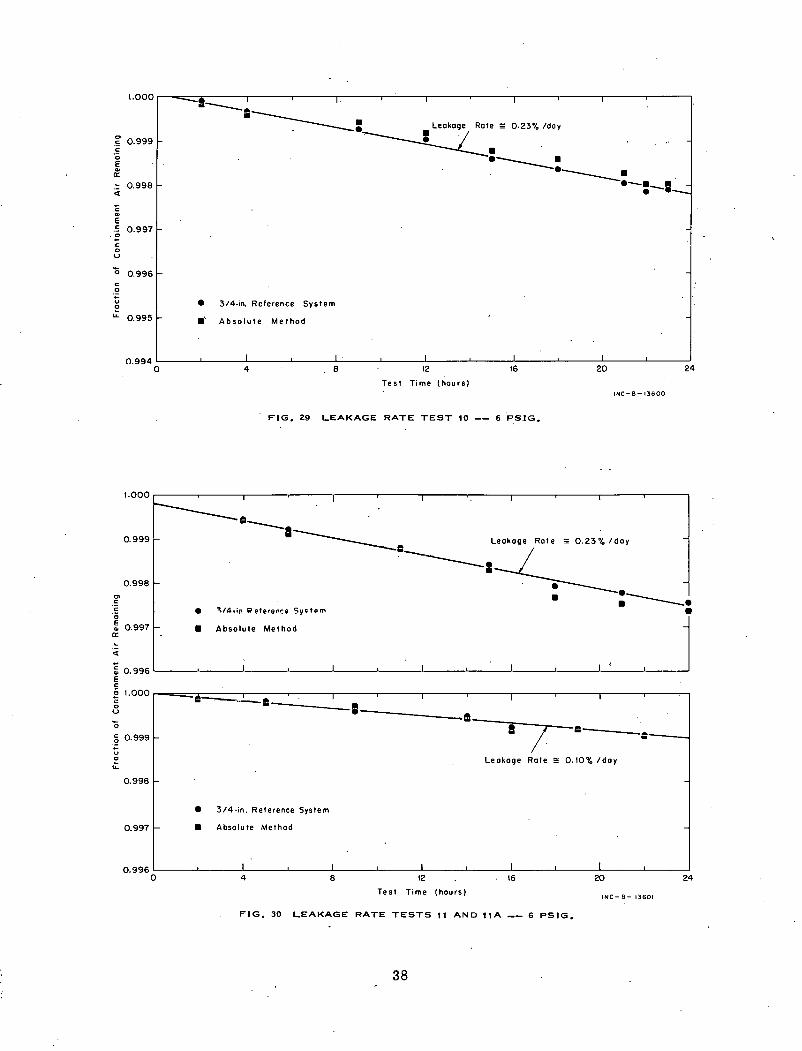
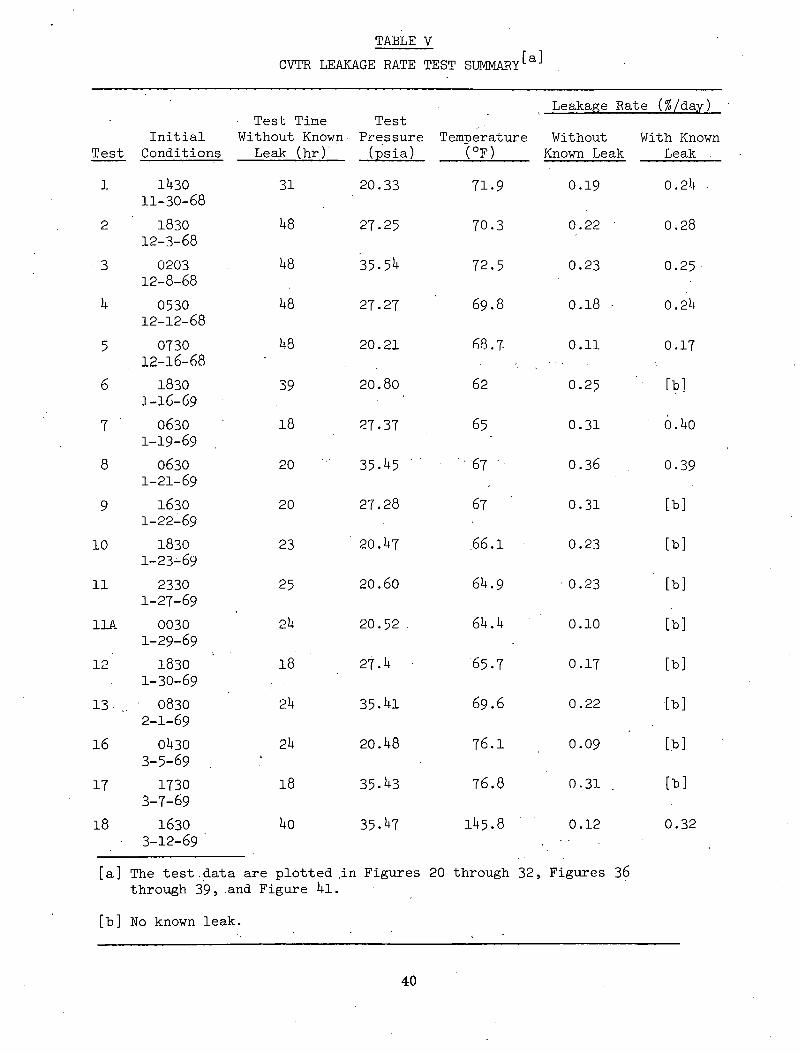
3. AMBIENT AIR TEST RESULTS
The results of the CVTR leakage rate tests are shown in Figures 20 through 32 and summarized in Table V. The figures are plots of the amount of containment air remaining (normalized to one at the start of each test) versus test time. The slope of the line for a 24-hour period is the leakage rate expressed as percent leakage per day. All tests were ambient air tests except Tests 14 through 19, which were elevated temperature tests and are discussed in Section IV -4, and Test 20 which was a post-DBA test and is discussed in Section IV -5.
The preliminary leakage rate calculations were made and plotted using data from only two of the several leakage rate measuring systems installed at CVTR. These two· systems were the 0 to 100 in. Hg Texas Instruments, Inc., absolute gage for the absolute method and the 0 to 5 psia Texas Instruments, Inc., differential pressure gage installed on the 3/ 4-inch reference vessel for the reference vessel method. Two P.X~P.ptionR to the preceding were (a) for Test 1, which was conducted before the Texas Instruments, Inc. , gages were available, data from a 100-inch-mercury manometer and a Meriam micromanometer were used to calculate the leakage rate by the absolute and the reference vessel methods, respectively; and (b) for Tests 3 through 5, in addition to the results from the Texas Instruments, Inc., gages, data from a 60-inch U-tube manometer installed on the one-inch reference vessel wer.e used for calculations.
a> 0.999 c c 0 E "' a:
<I 0.998
-c: "' E c
~ c 0 0.997 u
0 c:: 0
-.::; 0
~ 0.996
e 3/4·in Reference System - Micromonometer
• AbsolutP. MP.tnod -Mercury Monomelcr
Test Time (noursl .INC-8-13610
FIG, 20 LEAKAGE RATE TEST f -- 6 PSIG,
32
0> 0.997
c: c: 0 E "' 0.996 cr
·-·<I: -c:
"' 0,995 E c:
~ .:: 0 u
:"' . • •
• ~og• .• , ... 0.22% I doy
•""' LKoowo Look 51""'
• ., I
·:~ !"" ."
Leakage Rote~ 0.28 %/day
0 0.994
c: 0 -u 0
~ . 0.993 -~ ~
• 3/4-in. Reference System
• Absolute Method
• 0.99fL-----~-------L ______ J_ ______ L_ ____ ~~-----L------~------~----~L-----~
0 8 16 24 32 40 48 56 64 72 80
Test Time (hours) INC-8- 13G09
FIG, 21 LEAKAGE RATE TEST 2 -- 13 PSJG,
"33
1.000.------.~----.-~---.------.------.------.-----~------r------.-----,
C> c: c: 0 E ., a: ~
<C
-c: .,
0.999
0.998
0.997
E 0.9,96 c:. 0 -c: n u 0 0.995 c: 0 ... u 0
~ 0.994
0.993
•• ~~ LRO
. -~. 0.23%/doy
Storied
• 314-in. Reference System
• Absolute Method
& 1-in. Reference System
Test Time (hours) INC -8-13593
FIG. 22 LEAKAGE RATE TEST 3 -- 21 .PSIG •
. 34

"'0.999 ~
~
0 E ..
0.998 ll:
~
<t -~ .. E 0.997 ~
2 ~ 0 u
0 0.996 ~ 0
u
~~-• ·~Leakage Rote= 0.18'l'o/doy
"~$""• . ~ KoO.; Loo' ""''"
=~I -·~· Leakage Rote = 0. 24 % I day
:"'-.1 • • 3/4-in. Reference System
0
~ 0.995 • Absolute Method
• l=in. Reference System
Test Time (hours) INC-A-13596
FIG; 23 LEAKAGE RATE TEST 4 -- 13 PSIG.
1.000 r-.... --=---._.---l---,----..,.l-----,l---r-1--.---l--.---l---rl----rl-----,
~· -"' ~ ~
~ 0.999-.. ll:
- 0.998-~ .. E ~
0 -~ 0.997- .. u
-0
~
~ 0.996-u 0
~
• • • I
8
~-------~·Leakage Rote = 0.11% /day
• -.J 1---Koowo Look ""'"'
-------• .________. I . _ ·r~: .7 Ot7%1d•·
M'(t =~
' ... , 3/4-in. Reference System
-
-
-
Absolute Method -
l-in. Reference System
I I I I I I I I.
16 24 32 40 48 56 64 72 80
Test Time (hours) INC- 8- 13595
FIG. 24 LEAKAGE RATE TEST 5 -- 6 PSI G.
35
0.999
"" c: c: 0 E
0.998
"' a:: ~
<l 0.997
c:
"' E c:
2 c: 0.996 0 u -0
... 0
0.995 -u 0 .;:,
0.994
t.QQO
0.999 "' c: ·;: 0 e ..
0.998 0:
·-<I
c .. E 0.997 c:
f c: 0 u
'E 0.996 c: .!:! ::; ~
I.L 0.995
0.994 0
I (
--·
~~ Leakage Rate~ 0.25%/doy
~~
.=~. ·~
·~ :~.
•
e 3/4-in. Reference System
• Absolute Method
Test Time (hours) INC-8-13598
FIG. 25 LEAKAGE RATE TEST 6 -- 6 PSIG.
------=-----Lie:ki Rate :; 0.31% /day I_ ----- . ~Known Leak Started
~------- ll.eakaqe Rate:;; 0.40% /day
:--:-._J s-_L ·----.
• 3/4-in. Reference System
• Absolute Method
.4 8 12 16 20
Test Time (hours! INC- B- 13597
FIG. 26 LEAKAGE RATE TEST 7 -- 13 PSIG.
36
24
"'0.999 c: c: ·c; ~ 0!998 a:
c 0 .. 997
"' E c: 0
c 0 u
0.996
-~' 0.995
u 0
~ 0.994
.-.
• 3/4-in. Reference System
•· Absolut.e Method
0.993 '----'-----'--.,.-'------'1---'----'-----'----'----'-----'----'----'--1 ---'----=-' 0 4, 8 12 16 20 24 28
0.999 CJ' c: c: 0
E "' 0.998 0::
c: e o.997 c:
·c; c: 0 u 0 0.996 c: -~
" 0
u: 0.995
Test Time ·(hours) INC- 8- 13599
FIG, 27 L.EAKAGE RATE TEST 8 -- 21 PSIG,,
e 3/4-in. Reference System
• Absolute Method
0.994L------L------L------L------L------L------L------L----~------J-----~------~----~ 0 4 8 12' t6 20 24
Test Tim'e (hours) INC- B- 13594
FIG. 28 L.EAKAGE RATE TEST 9 .--. 13 PSIG.
37
"' .!: c: ·c; E .. cr:
~
c: .. E c:
·!? c: 0 u
0 c: 0
u ~ lL
"' c:
:e 0
t.ooo
0.999
0.998
0.997
0.9961--
0.995 I-
0.994 0
-~--~ I I
•------:----_:_ • Leakage Rate ~ 0.23% /day
~=----· . ·-------· ·-=-·-
e 3/4-in. Reference System
... Absolute Method
I I
4 8 I I
12 16
Test Time (hours)
FIG. 29 LEAKAGE RATE TEST tO -- 6 PSIG.
I 20 24
INC-B-13600
t.OOO 1 r-----= . . . I --. 0.999 ----- Leakage Rate ~ 0.23% /day
·--------·~. 0.998 1-
• . ·----· • 2 0.997 1-cr: • Absolute Method -
~ 0.996L-----~------L-~----~------L-I ____ _L ______ L_I ____ -L------L------L----~-------L----~ E c:
~ t.ooor-~~==~~==~:::;~=-~-----,--~---r------,-------.-------r-----~r------,------~------l
8 =-------=---------.~ 0.999
u 0
~
0.998
• 3/4-in. Reference System
0.997 1- • Absolute Method
0.996L-----L-----i-~----~----~I ____ _J ____ ~I----~------~~--~~--~~~----~--~ 0 4 8 12 16 20 24
Test Time (hours) INC- B- 13601
FIG. 30 LEAKAGE RATE TESTS tt AND ttA -- 6 PSIG.
38

"" 0.999 c: c: 0
woo.._ ___ .____! __ ! _________ !!_ • • • •
' w - ------------------·---""-1 Leakage Rate - 0.17% /day
E G>
ol:
<(
c: G>
E c:
·;:; c 0 u
c: .2 u ~ 0.995
0 994 . 0
• 3/4-ln . System . Reference
Method Absolute
4 -~--~----~~----~------,!E6)
12 INC-B-13608 -- ~ (hours)
TP.st Time
FIG. 3 ! LEAKAGE RATE TEST 1 3 PSIG. 12 --
V' 0.999 c ·;: ·c; E
;:. 0.2 2% /day Leakage Rote -
t.ooor-___ '"! -----· -J_ . - . -. ....____·~. . . ·-----. . . '----· ..
a:: 0.998
c
e o.997 c
2 c 8 '0 0. 996
c .!? u
:: 0.995
0.9940
• •
System 3/4-in. Reference
Method Absolute
FIG. 32
.8 12
Test Time (hoursl
TEST 13 RATE LEAKAGE
39
u; 20
INC- 6- 1:\607
-- 21 PSIG.
40

TABLE V ( Contd. )
CVTR LEAKAGE RATE TESTS SUMMARY[a]
- .. - ,,Leaka~e Rate ( %/da;y:)
Test Time Test Initial Without Known Pressure Temperature Without
Test Conditions Leak (hr) (Esia) (OF) Known Leak
19 0230 42 34.28 195 [b] 3-20-69
20 2230 38 34.85 92 0.23 5-11-69
[a] The test data are plotted in Figures 20 through 32, Figures 36 through 39, and Figure 41.
[b] No leakage measured.
With Known Leak
0.1
0.30
The leakage rates for Tests 1 through 5 were calculated by using the average of 10 representative thermocouple readings. For all other tests, the calculations were based upon the average of the 15 resistance thermometer readings.
The containment. water vapor pressure was obtained as a combined sample by a simultaneous measurement from all four humidity ·sampling stations.
3.1 Discussion of Results
Throughout the ambient temperature tests some scatter in test data was eXperienced. This data scatter, which was consistently less for the 3/4-inch reference vessel than either the one-inch reference vessel or the absolute method, resulted from several contributing factors. In the case of the reference vessels, these factors included the percentage of the reference vessel volume located outside the containment vessel -- 0.3 and 0.08% for the one-inch and 3/4-inch vessels, respectively; the physical location of the reference vessel within the vapor container, that is, the distance from walls, floors, and equipment; the arrangement of the vessel within the containment (volume weighted); the accuracy of the readout instrumentation used with each system; and the total vblume of the reference vessel (the greater the total volume the less the effects of the other factors).
In the case of the absolute method, the controlling factor is the accuracy of the containment temperature measurement. Even with the air recirculation system operating at approximately 25,000 ft3/min, temperature gradients existed during the leakage rate tests. During the ambient air tests, temperature gradients of approximately 4.5°F existed with the basement at the higher temperature. In addition, a uniform containment temperature rise of approximately 1.5°F/24 hr occurred. Since containment temperature measurements have such an effect on the leakage rate calculations, particularly by the absolute method, .much of the data scatter is believed to be associated with the measurement of these temperature gradients.
41
.
Generally, the data scatter increased as test pressure decreased because the lower the test pressure the less the containment leakage rate and the more difficult the leakage rate measurement becomes. Therefore, if the same accuracy in test results is desired, tests at lower pressures must be run for longer periods of time than for higher pressure· tests.
The leakage rate lines which have been drawn through the test data for each test are best estimate lines, and no attempt has been made to mathematically fit the lines to the data. Generally, however, the lines were drawn through the 3/4-inch reference· vessel precision pressure gage data, since, as mentioned earlier, these data provided the least scatter.
The physical effects of the ambient air tests upon the containment appeared to be negligible. Originally, repeated cycling of the containment from atmospheric pressure to 21 psig was thought to detrimentally affect the structure. However, no detrimental effects were observed. Containment expansion and liner strain measurements indicate that containment expansion and contraction did take place during pressurization and depressurization. These changes were so slight, however, that no permanent visible or measurable effects occurred.
3.2 Known .Leak
During the latter portion of several of the leakage rate tests, a known leak (Section II-4.6, Figure 9) was superimposed upon normal containment leakage to aid in determining the sensitivity and accuracy of the containment leakage rate measuring system. As can be seen from the plotted data, the leakage rate system quickly detected the known leak each time the known leak was placed in operation. The Texas Instruments, Inc., gages were especially sensitive to the known leak. The effects of the known leak could be seen almost immediately through observation of these instruments.
The accuracy of the containment leakage rate system is evaluated by comparing the measured increase in containment leakage as determined by the le::~kAg'=' rate system to the calculated increase lu cuntalnment leakage as determined by the flow through the known leak system. By using the best estimate of containment free volume (227 ,000 ft3) and the results of Test 7, the calculated effect of the known leak was found to be 0.11%/day, which compares very well with the measured effect of 0.09%/day. Part of the difference between these values can be attributed to errors in the calculated value which depends upon the accuracy of the known leak rotameter the care with which flow is controlled while the known leak is in operation, and the accuracy to whi.ch the containment free volume is known.
3.3 Extrapolation Factors
The effect of test pressure on the CVTR containment leakage can be seen in Figure 33, which shows the leakage rate curves for Tests llA, 12, and 13. To evaluate leakage rate extrapolation equations, the experimentally determined leakage rate and that calculated by the most commonly used extrapolation equations [8], shown in Table VI, are plotted in Figures 34 and 35 in terms of Le/Lt versus Pe/Pt. Figure 34, which is valid for Tests 1 through 5, llA, 12, and 13, shows that the containment leakage is best extrapolated by the molecular flow equation, which, if true, indicates that the containment leakage
42

o> c
=:-----.t__ --........._ -----• 6 psig
............... ~ ·----Leakage Role ~ 0.10% /day c 0
E .. Q:
~ 0.999:
. ==.::::::::::·~ ~ I'~ . =----13 ~s•g · ; """::-.• ·----- - . .I
Leakage Role 'lr 0.17%1 day ...........___ - •-•:---
0 ~=y~: c .. E c 0
c 0 u
0 0.998 c 0
Leakage Role ~ 0.22% /day -..........._
e 3/4-in. Reference Syslem
• Absotule Melhod
0 ·997 0~ __ .__ __ 4~_ __ .__ _ _Jsl.__---''---_J,2~----''---_J, 6~----'-----720::------'-----724
Tesl Time (hours) INC -B-13604
FIG, 33 CONTAINMENT LEAKAGE RATE AT VARIOUS PRESSURES,
TABLE VI
LEAKAGE RATE EXTRAPOLATION EQUATIONS
Laminar Flow
Molecular Flow
Turbulent Flow, Rough Path
Turbulent Flow, Smooth Path Le
where
Lt = leakage rate at test pressure, Pt
Le = leakage rate at extrapolation pressure, Pe
pt = test pressure (atmospheres absolute)
Pe = extrapolation pressure ( A.tmospheres absolute).
43
'-.

Le
Lt
10r------------------r---------,,------,----~--------~----~--,
9
8
7
6
5
2
i i
/La~inor Flow
I /Experimental Data
I /~-Molecular Flow I . ./.,. I/ . /he ----Turbulent Flow- Smooth Path
tlh //:--T"''"'"' Flow~ Ro,gh Polh fJ//~ .. ~
.. J 2 3 4
Pe Pt
5 6 7 8 9 10
INC-B -13611
FIG, 34 CVTR LEAKAGE RATE SCALE-UP FACTO.RS -- TESTS I THROUGH 5, IIA, 12, AND 13,
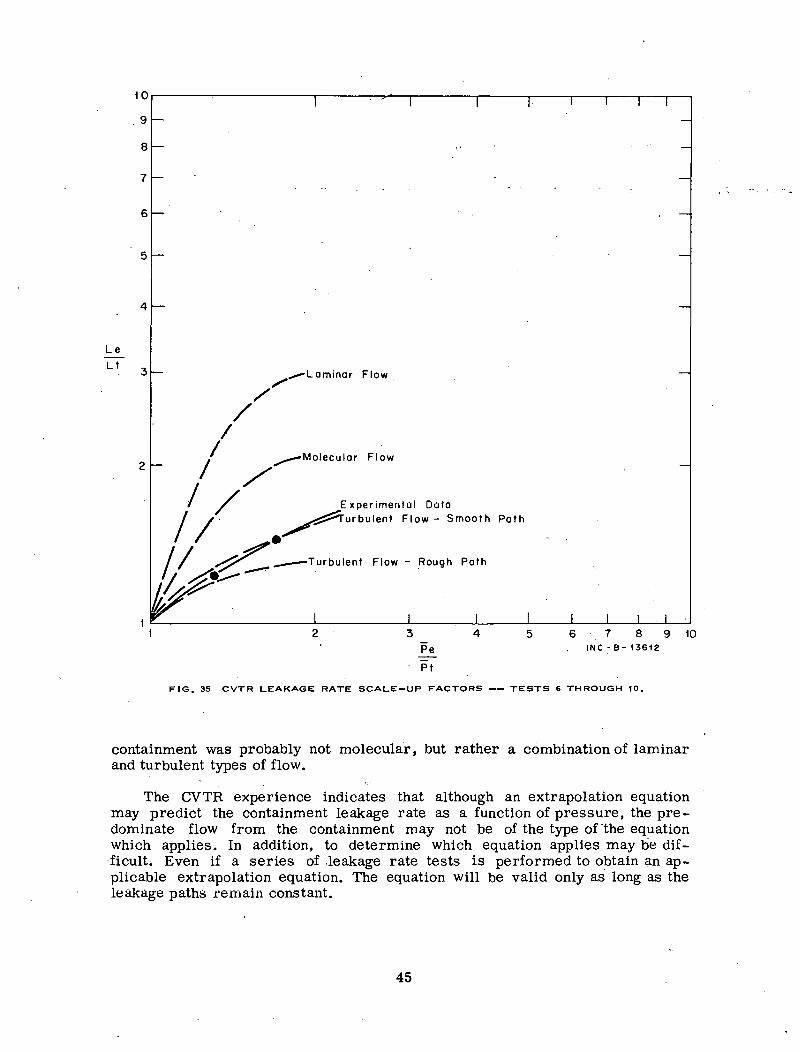
occurred through an immense number of very small leaks. Figure 35, however, which compares the results of Tests 6 through 10, shows that 'the containment leakage during these tests closely followed the turbulent flow, smooth path extrapolation equation. During this test series, in addition to normal containment leakage, leakage occurred through the packing gland on one of the large air recirculation system valves causing a change in the leak paths and as a result a change in the applicable extrapolation equation.
As discussed in other reports [S] molecular flow is not of.significant consequence for the size of leaks of interest in containment vessels; that is, in the range of flows of interest (300 to 500 ft3/day) an enormous number of leak paths would have to exist for leakage to occur by molecular means. Therefore, although the molecular flow extrapo~ation equation predicted the containment leakage for part of the tests, the prevailing type of flow from the
44
Le
Lt
9
7
5
2
/ /
I
...,........-Laminar Flow.
/ /....-Molo'"'" Flow
I / E xperimenlol Dolo I I· .~urbulent Flow- Smooth
! / £.--Turbulent Flow - Rough Polh
'I ~-.....--~~
2 3 4 Pe
· Pt
Path
5 6 7 8 9 10 INC-B-13612
FIG, 35 CVTR LEAKAGE RATE SCALE-UP FACTORS -- TESTS 6 THROUGH 10,
containment was probably not molecular, but rather a combination of laminar and turbulent types of flow.
The CVTR experience indicates that although an extrapolation equation may predict the containment leakage rate as a function of pressure, the predominate flow from the containment may not be of the type of "the equation which applies. In addition, to determine which equation applies may be difficult. Even if a series of .leakage rate tests is performed to obtain an applicable extrapolation equation. The equation will be valid only as long as the leakage paths 1·emain constant.
45

The data obtained from the fixed leak system (Section II-4.6) during Tests 1 through 5 and Tests 6 through 10 were also compared to that predicted by the extrapolation equations and were found to· extrapolate according to the molecular flow equation. However, this flow is also probably a combination of several types of flow.
4. HOT AIR TEST RESULTS
The hot air test series was performed as Tests 16 through 19. the results of which are plotted in Figures 36 through 39. As can be seen, a definite decrease in containment leakage occurred as test temperature increased. The leakage decreased from 0.31%/day at ambient temperature to 0.12%/day at 146°F to 0.1%/day (including the known leak) at 195°F.
During Test 19, even though the containment had been d_ried as much as practical, the dew point steadily increased until at 42 hours, despite attempts to continue measurements, the range of the hygrometer was exceeded and the
. test was terminated. The high containment temperatures of Tests 18 and 19, 146 and 195°F, respectively, melted organics in the containment including refueling machine shielding material and neutron chamber shielding material. These temperatures also decreased the viscosity of oils and grea.c:;es in pumps, motors, and valves, and caused a large increase in the concentration of these materials in the containment atmosphere. As containment atmosphere samples passed through the hygrometer some of these organic contaminants plated out on the sample mirror causing an erroneous (high) dew point indication by the hygrometer. When this erroneous dew point was used in the leakage rate calculation. an abnormally high leakage rate was obtained. The effect can clearly be seen in Figure 39 between 20 and 28 hours. Several methods were devised to overcome this problem, including heat tracing the hygrometer sample lines, maintaining a continuous flow through the hygrometer, throttling flow to the hygrometer so that the sampling pressure was lese than 4.5 psig and balancing the dew-point hygrometer (automatically cleaning the mirror) while holding a vacuum on the hygrometer sensor unit. These
·methods allowed Test 19 to be continued for an additional 14 hours.
The physical effects of the elevated temperature tests upon the containment were quite pronounced. As the temperature of the concrete containment increased, a large number of cracks appeared on the outside concrete surface. Photographs of a typical external containment crack on the cylindrical section of the containment near ground level are shown in Figure 40 .. The photographs were taken during and following Test 19 at containment conditions of 195°F and 21 psig, 100°F and atmospheric pressure, and ambient temperature and atmospheric pressure for Figures 40 a, b, and c, respectively.
Inside the· containment the high temperature caused several noticeable . effects: paint darkened; grease and oil dripped from gear boxes, bearings, and motors; shielding material melted and flowed from the neutron chambers and the refueling machine; and the containment liner contained numerous, small, inward dents, presumably from expanding against aggregate protruding from the inside surface of the concrete wall. The containment integrity was not violated, however, even though high temperature conditions were maintained for more than 10 days.
46
"' c: ·c: ·;; E
"' a:
c: "' E c:
·c; c: 0 u
1.001
t.OOO
-~ 0.999 c: 0
~ ~ 0.998 ~
c: .. ~ 0.997 ·c; c: 0 u
0 0.996 c: 0
u
~ 0.99:i
0.9940
!L-----------------=----------· •
• Reference System 3/4-in .
I te Method • Abso u
Leakage. Rote ~
=---/~- •
4 -~-- 20
FIG, 36 LEAKAGE RATE -- 6 PSIG, TEST t6
. . . ""'"' '"' . . ·-----------·---- ·~ 0.31% /doy
.. •
e System 3/4-in. Re_terenc.
· M~thad Abso lu tp .
4 8
• •
12
. ·----· ·----
20
Test Time (hours)
INC-8-13628
INC- B-13606
FIG, 3 7 LEAKAGE
'
-- 21 PSIG, RATE TEST t7
47
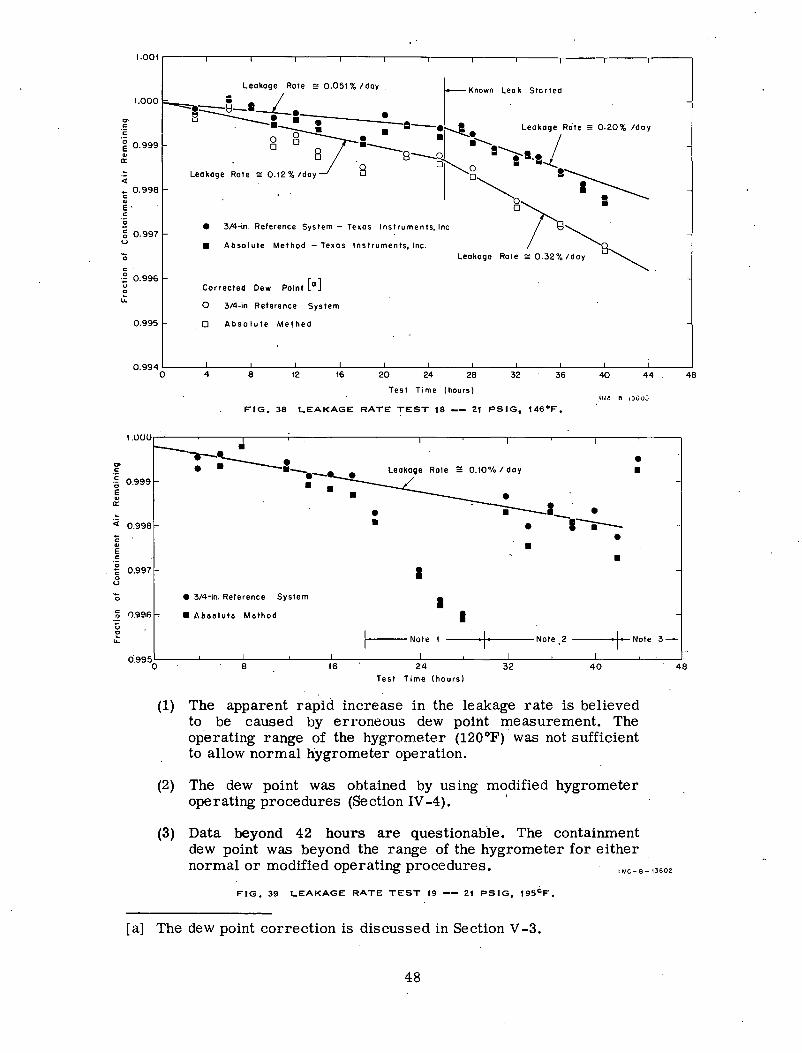
"' c: c: 0
E ., a:
:.t
c .. E c: 0
c 0 u -0
c: .£ v 0
.::
t.001r-----.------r------r-----.------r-----,,-----,------,-----,------r-----.-----~
"' c: ·c.
1.000
·~ 0.999 .. a:
<t
- 0.998 c: .. E. c: 0
g 0.997 u
c: ~ 0.996 u 0
.::
; Leakage Rote ~ 0.051'l'o /day . '-Known Leak Started
,_u_t_L_ . . e~--.:::...---. ·- • u --- • • -= :~• • • -=~~ Leokojge Rote = 0.20% /day
0 0 ·-- ·--8 g--o s-... •.. . 0~ Iii Iii
Leakage Rote~ 0.12%/doy 8 I g~ !~
0 'A-;o. '''"'"" '""m - "'"' '"" ,..,. "· '"' 0
~~ • • Absolute Method -Texas Instruments, Inc. 8~ .
Leakage Rote = 0.32% /day ~
Corrected Dew Point [ 0 ]
0 3/4-in. Reference System
0.995 0 Absolute Me!hed
0'994o~----~4------8~----~,2~----1~6----~2L0-----2~4,_----2L8----~32~----3~6----~4QL-----4~4----~48
0.999
0.998
0.997
0.996
0.9950
(1)
Test Time (hours)
FIG. 38 LEAKAGE RATE TEST 18 -- 21 PSIG• 146°F •
• =------=-.- • • - 0.10%/doy •
• • I . • -li • ·------• • •
I e 3/4-in. Reference System I • Abssluto Mothod I
Note 2 Note
8 16 24 40 Test Time (hours)
The apparent rapid increase in the leakage rate is believed to be caused by erroneous dew point measurement. The op-erating range of the hygrometer (120°F) was not sufficient to allow normal hygrometer operation.
(2) The dew point was obtained by using modified hygrometer operating procedures (Section IV -4).
(3) Data beyond 42 hours are questionable. The containment dew point was beyond the range of the hygrometer for either
3-
48
normal or modified operating procedures. '"c-e-l3soz
FIG. 39 LEAKAGE RATE TEST 19 -- 21 PSIG• 195C.F.
(a] The dew point correction is discussed in Section V -3.
48
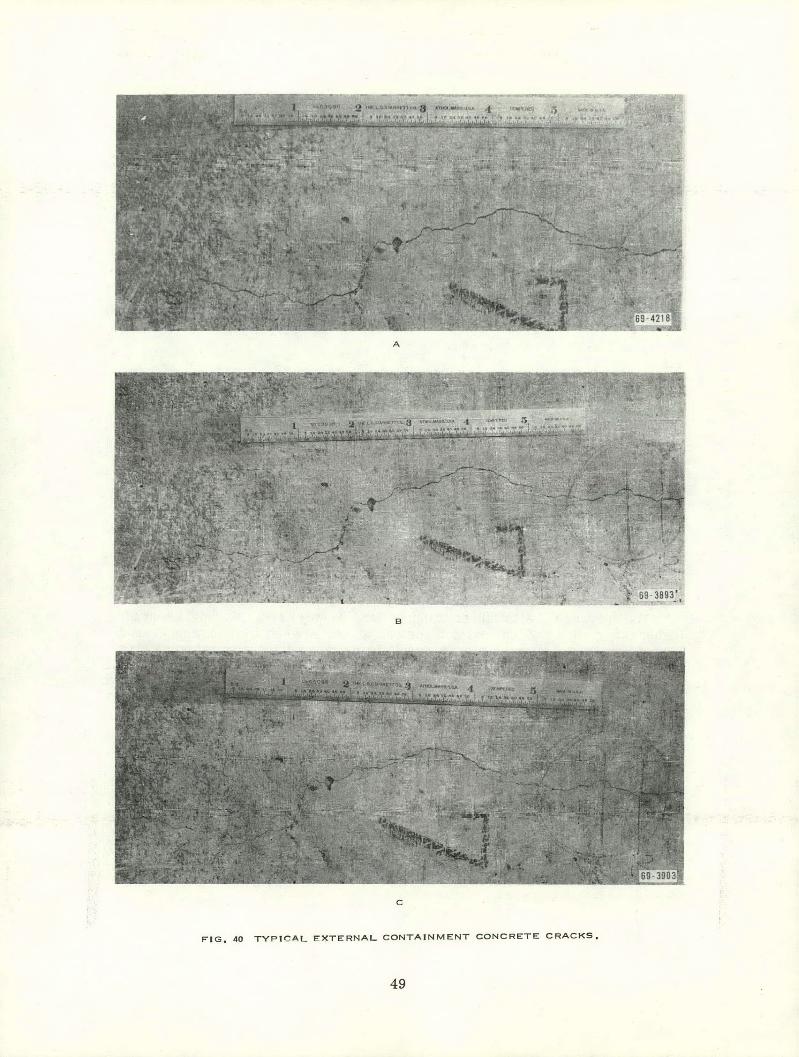
A
B
c
FIG. 40 TYPICAL EXTERNAL CONTAINMENT CONCRETE CRACKS.
49

5. POST-DBA TE ST RESULTS
Following the DBA tests, the final integrated leakage r ate test (Test 20) was performed. This test was performed to determine the overall effects of DBA conditions upon containment leakage and to deter mine whether DBA testfiig had violated containment integrity. This test showed a s light decrease in the CVTR containment leakage, appr oximately 0.23%/day versus 0.31%/day. Because of the data scatter experienced during this test, the leakage rate line shown in Figure 41 could be drawn with several different slopes, resulting in leakage of 0.15 to 0.26%/day. Thus, the conta inment leakage rate did not increase because of DBA conditions and possibly decreased slightly.
1.000 a --& -.-------,-------,--------,-------,-------,-------,-------~
"'0.999 ~. . ~
---
• Known Lea k Sto ri ed • • •
~.----;__ I " " C ()'l'lA I • - •-- • •
I ~ • e "' n:
~ 0 .997 Leakage Ro te ~ 0 .23°/o / day I ------- •
------·--- • " 1! o.996 / ·----. " ·c; c Leakage Hate :; O ,jt) u/o/doy
8 0 .995
" 0.994 -~ • 3/4 - in . Ref erence Sy s tem u
~ 0 .993 • Abs o lut e Method
0 ·992o!--- ----,5!--------,-lo=-----:l'::-5 -----::'2o=-----~25=-----~3o=------~35:-------4:-:0
Test T ime (hou rsl
FIG. 41 LEAKAGE RATE TEST 20 -- 21 PSIG.
The average conta inment temperature during Test 20 was about 20°F higher than that which existed prior to hot air and DBA testing. Because higher containment temperatures result in decreased leakage rates, as shown by the hot air tests, the decreased leakage rate of Test 20 may be a result of temperature or DBA conditions, or both. Certainly, DBA conditions did not cause an increase in containment leakage and may have caused a slight decrease.
50
V. TEST EXPERIENCE
One of the objectives of the. CVTR tests was to evaluate and report the problems encountered and the solutions to these problems. This section of the report describes problems encountered during the leakage rate tests and' the methods devised to overcome these p:roblems. ·
The problems encountered during the CVTR tests are believed to be typical of those encountered by others who have performed and who will be performing containment leakage rate tests._ The following discussion of these problems and their solutions hopefully will aid those persons performing future leakage rate tests. ·
1. MODIFIED REFERENCE VESSEL
Prior to leakage rate testing, two parallel 3/4-inch reference vessels were installed in CVTR. One vessel was installed for use in the conventional manner. The other was ·installed to determine the feasibility of a modified reference vessel method of determining leakage rate. The primary difference between the modified method and the standard method is that an air flow measurement rather than a differential pressure measurement is used to determine leakage rate. With the modified method, the reference vessel was left open to the containment atmosphere. As the containment was pressurized for a leakage rate test, the reference vessel was also pressurized, and as the containment leaked and its pressure dropped, air flowed from the reference vessel to the containment to maintain equal pressures. This air flow, measured by a sensitive mass flowmeter, is theoretically directly proportional to the containment leakage rate. Unfortunately, although this method has certain merits, the mass flowmeter used was unable to measure the minute flow rates which occurred. Therefore, following Test 5 the modified reference vessel was sealed and used as a standard reference vessel for the remainder of the CVTR tests.
2. AMBIENT AIR TESTS
A primary objective of the ambient air tests was to evaluate the effect of pressure upon containment leakage. As can be seen in Table V, the containment leakage rate did not increase with pressure between Tests 2 and 3. ln addition, the leakage rates of Tests 2 and 4 did not agree nor did those of Tests 1 and 5, even though the test pressures were the same. The reason for thio unexpected containment leakage behavior between Tests 2 and 3 was that a leak was inadvertently stopped which significantly reduced cont~inment leakage. Because the primary test objective had not been achieved, the series was repeated ao Teats 6 through 10.
The leakage rates of Tests 6 through 10 increased and decreased with pressure as expected. In addition, the leakage rates of tests performed at the
51

~arne pressures (that is, Tests 6 and 10 and Tests 7 and 9) were essentially identical. The leakage rates of afi the tests in the series, however, were approximately 30% greater than those of the first series of tests. Between Tests 5 and 6 the containment was depressurized and the vapor container air purge valve used to maintain the containment. air activity at a sufficiently low level to allow personnel access. A purge valve packing began leaking during this time. The exact location of the leak was not found until the third test in the series was in progress. Rather than compromise the test results, the valve packing was allowed to leak throughout the test series. Because the ,leak was unexpected, and to verify that the higher leakage rates of Tests 6 through 10 were solely the result of the packing leak, after a short shutdown Test 10 was repeated as Test 11. During the shutdown the containment was depressurized to atmospheric pressure, remained so for several days, and was then repressurized to 6 psig with no changes to the containment other than depressurization and repressurization. When Test 11 had be.en in progress for a sufficient time to provide reliable test data (25 hours) and to verify that containment leakage had not changed, the valve packing leak was stopped and Test 11 continued as Test 11A, which became the first test of the initial hot air series (Tests 11A through 15). As can be seen in Table V, the leakage
·rates of Tests 11A, 12, anrl 13 repeated those of 'l'ests 5, 4, and 3, respectively, and proved that the packing leak caused the increased leakage rates of Tests 6 th:rough 10. ·
3. HOT AIR TESTS
Tests llA through 15 were the initial attempt to perform the hot air test series. At the time this initial attempt wa.<:: made, the reactor primary system was filled with water, including the moderator tank (TK-1) which was essentially open to the containment atmosphere •. As the containment temperature was increased to 150°F and then 200°F, the containment dew point also increased \mtil the moaouring cupability uf. Lhe t.lew-po1nt hygrometer· (120uF) was exceeded. At this time, a cold trap was installed on the known leak system in an attempt to obtain humidity measurements and continue leakage rate testing. Data from this system, however, proved too poor for leakage rate calculations. Because satisfactory leakage rate data could not be obtained, the test series was terminated, the water t.lrained from the primary system, and the containment and primary system dried as much as practical. The hot air tests were then repeated as Tests 16 through 19.
As can be seen in Table V, a 40% increase in containment leakage occurred between Tests 16 and 17 'when a vapor container purge valve flange began leaking.· The leak was impossible to stop and the results of Tests 17, 18, and 19 include this leakage.
Several changes iri leak paths occurred at CVTR during both the ambient and· ho-t air tests. Changes occurred for no apparent reason and were often difficult to find. Although no large· changes in leakage occurred, the fact that unexpected changes did take place indicates that a continuous leakage rate measurement system would be a valuable addition to any power reactor system.
52

A correction which is not normally applied to leakage rate measurements but which became significant during the hot air tests was the pressure correction to the dew point measurement. When dew point samples are passed through long lines to an external dew point instrument, as was the case at CVTR, pressure drops occur and the indicated dew point had to be corrected to obtain the true containment dew point. By Dalton's Law, as the total pressure changes, all of the partial pressures comprising the total pressure change in the same ratio. Therefore, the dew point of the containment atmosphere must be calculated from the indicated dew point by the following equation:
partial pressure of water.vapor at hygrometer partial pressure of water vapor in containment
= sample pressure at hygrometer total pressure in containment
At lower test pressures and dew points this correction is not significant in the leakage rate calculations. At higher pressures and dew points, however, such as those encountered during the hot air tests, the correction becomes important and can have a significant effect upon the test results. Figure 38, in which both the uncorrected and corrected leakage rates of Test 18 are shown, clearly illustrates the effect of this correction. For Test 18, this correction increased the leakage rate by about a factor of two, from 0.05 to 0.12%/day.
4. POST-DBA TEST
Some difficulty was encountered obtaining reliable test data during Test 20. As can be seen in Figure 41, the data scatter is greater than for other 21-psig ambient temperature tests. This scatter is believed to be a direct result of the DBA tests. During the DBA tests, steam was injected into the containment, following which a water spray system was placed in oper.ation. As a result, even though efforts were made to dry the containment between the DBA tests and Test 20, the dew point during Test 20 was considerably higher than for previous tests, 80 and 50°F, respectively. Because the accuracy of the hygrometer was ±0.5°F, the higher the dew point, the greater the resulting scatter in test data.
In addition to the dew point problem, the residual heat from the DBA tests caused a 20~ higher than normal containment temperature. Also, large pieces of equipment and the concrete walls and floors became heat sources causing larger than normal containment temperature gradients which increased the temperature salllpling errors. Because of these problems and the resultant data scatter, the leakage rate line for Test 20 can be drawn so that leakage rates range from 0.15 to 0.26%/day. Although the post-DBA leakage rate measurements appear to be less accurate than the previous measurements, DBA conditions conclusively did not increase the containment leakage rate.
53
VI. RECOMMENDATIONS
Although the data analyses are preliminary and incomplete, several general recommendations can be made concerning leakage rate testing.
1. LEAKAGE RATE MEASUREMENT METHOD
For the CVTR tests, both the absolute measurement system and the 3/ 4-inch reference vessel measurement system using Texas Instruments Inc., pressure capsules provided reliable and accurate determinations of containment leakage rates. Preliminary analysis indicates that the 3/4-inch reference vessel system yielded data with slightly less scatter than the absolute system. Very little data scatter was experienced from either measurement method.
To ensure accurate and reliable results, special precautions must be exercised for each measurement technique. ARR11r1mr.A nf lP.::~k tightness of the reference vessel is mandatory. Even a slight leak in the vessel can compromise the results, which, for the usual method of operation (reference vessel pressure higher than containment pressure), leads to a measured containment leakage rate that is lower than the actual leakage rate. Conversely, i.f the mode of reference vessel operation is reversed, that is, the reference vessel pressure is lower than the containment pressure, a measurement obtained with a leaking reference vessel overestimates the actual containment leakage rate.
A potential method for performing leakage rate measurements using the reference ve::;sel system that could nullify the effect of a slightly leaking reference vessel would be to initiate the test with the reference vessel pressure slightly lower than the containment pressure. The test would then be performed until the containment pressure decreased to a value less than the reference vessel pressure. If the starting and ending differential pressure between the containment and the referenr.e vP.RRP.l wP.re about the e:amo; and the rcfcrcn.ce vessel leaked less than the containment, the average of the leakage rates measured over the test time should be a good approximation of the actual containment leakage rate. This method of operation will also indicate whether the reference vessel is leaking during the test.
The accuracy of the leakage rate measurement using the absolute method is more dependent upon accurate meac:;nrements uf containment pressure, temperature, and humidity than is the reference vessel method. For example, the introduction into the equations outlined in Section IV -1 of a 1 °F change in temperature causes an error in .the results for the absolute method four times as large as it does in the results for the reference vessel method. In addition, the pressure instrumentation accuracy requirements for the absolute method are· a factor of 10 greater than for the reference vessel method. At CVTR, fo·r example, Texas Instruments, Inc., precision pressure gages were used for both the absolute and reference vessel methods. Both instruments had an accuracy of ±0.015% of full-scale reading. However, since the range of the absolute gage had to be 10 times the range of the differential gage, 100 inches of mercury and 5 psid, respectively, the actual accuracies were ±0.2 inch
54

of water for the absolute gage and ±0.02 inch of water for the differential gage. Thus, to obtain comparable readings, the accuracy of the absolute gage would have to be a factor of 10 better than that for the differential gage.
The sm.all amount of analysis completed to date indicates that for the four refe:r~nqe vessel ~ystems used <;luring the CVTR te~ts, the data obtained from the 3/4-inch ·systems were better because of less scatter. The 3/4-inch vessels were well distributed throughout the containment and were responsive to containment temperature changes. The 3/4-inch systems were also less susceptible to outside influences than either the 1/4- or one-inch systems.
How the two leakage rate measurement methods would compare in a steel containment which experienc~d large daily temperatu:re cycles, or one in which large heat sources or sinks exist, such as an ice condenser, is not known. Neither of these effects was experienced at CVTR.
CVTR experience showed that leak paths and therefore leakage rates changed from time to time, often for no apparent reason. These experiences indicate that the most meaningful leakage rate system may be a continuous system that provides constant knowledge of the leak tightness of the containment. Although such a system would probably be insensitive to small changes in · leakage rate, it could detect larger changes and thus provide constant assurance that the containment was leak tight and that appropriate action could be taken to prevent gross leakage in the unlikely event of a DRA.
2. TEMPERATURE MEASUREMENTS
Since s~all temperature measurement errors can result in large leakage rate calculational errors, a reliable, representative containment temperature measurement is a necessity, particularly for the absolute method. The less responsive the reference vessel becomes to changes . in the containment temperature, the more Important containment atmosphere temperature measurements become to the reference vessel method.
The CVTR containment atmosphere temperature measuring devices were volume weighted (approximately 8000 ft3 per thermocouple and 15,000 ft3 per resistance bulb) and were calibrated prior to leakage rate tests. As a result, these devices appear to have provided an accurate measurement of actual containment atmosphere temperature conditions.
3. PRESSURE MEASUREMENTS
Accurate pressure measuring instruments are essential for. reliable leakage rate measurements. For the absolute method, a sensitive and accurate absolute pressure measuring instrument appears preferable to measu~ements obtained by adding the readings from a manometer and a barometer because the former requires only a single readout and is expected to eliminate a possible source of error.
55

For comparative purposes, an industrial type direct reading mercury manometer and a standard mercury barometer were used during the CVTR tests to obtain containment absolute pressure measurements. Results indicate that for relatively short-term tests (<48 hours) a system of this type is too insensitive, particularly for hourly leakage rate eva,luations. This insensitivity is illustrated by the results of Test 8, a 20-hour, 21-psig test, which had the largest leakage rate of any CVTR test, 0.36%/day. The Texas Instruments, Inc., absolute pressure gage readings showed the average hourly containment pressure drop during. Test 8 to be 0.00267 psi (0.00543 in. Hg). The pressure drop is well within the resolution of the precision pressure gage but is only 1/20th of the least scale division on the mercury manometer. Even for the entire length of Test 8 (20 hours), the total pressure loss was only 0.053 psi (0.019 in. Hg) which is one least division on the manometer scale. Thus, to attempt to use a direct reading mercury manometer to measure small pressure changes is impractical, particularly when most containment leakage rates are much less than 0.36%/ day.
Pressure is not as great a measurement problem in the reference vessel method as the absolute method because the range of the pressure to be measured is much smaller.' By using Test 8 and the readings from the Texas Instruments, Inc., differential pressure gage which was installed on a 3/4-inch reference vessel, a total differential pressure of three inches of water (0.11 psi) developed at an average rate of 0.15 inch of water (0.005 psi) [a] per hour which can be measured easily using a · U -tube manometer with least scale divisions of 0.1 inch and filled with indicating fluid (sp gr = 1.0). Should more accuracy be desired, a 20% increase can be obtained by simply changing the indicating fluid to red oil (sp gr = 0.827). Much more accurate differential pressure instrumentation can be obtained, such as a Zimmerli gage having minimum divisions of 0.1 em, or a micromanometer having minimum divisions of 0.001 inch. A distinct advantage of a micromanometer is that readings are obtained by returning the indicating fluid to a reference point, that is, a scale indicator moves rather than the indicating fluid, thereby elminating any need for a reference vessel volume correction because of changing fluid level. The Texas Instruments, lnc., differential pressure gage also has this advantage.
The readout method is an important consideration in the selection of pressure measuring instrumentation for a leakage rate test. If instruments are used which have either digital or vernier readout rather than instruments with which the fluid level is simply observed against a fixed scale, a distinct advantage can be gained by the reduction of possible reading errors.
[a] The average hourly differential pressure drop does not agree with the average hourly absolute pressure drop because of containment temperature changes during Test 8. A changing containment temperature has no effect on the differential pressure measurement; however, the absolute pressure measurement is directly affected.
56

4. HUMIDITY MEASUREMENTS
Regardless of the leakage rate measurement method used, an accurate humidity sampling system is essential. On short-term leakage rate tests, small dew point errors can completely mask the leakage rate. For example, for Test 8, hourly differential pressure. changes averaged 0.2 inch of water. If a containment dew point of 50°F is assumed, a 1 °F dew point error can have the effect of either doubling or completely nullifying the calculated leakage. The CVTR humidity system sampled the containment atmosphere at four different elevations in any desired combination. Since no stratification was observed, the dew point from the centrally located sampling point would have been sufficient. If sample lines are long and pressure drops occur, the indicated dew point must be corrected for pressure prior to using it in the leakage rate equations. Condensation within the sampling system must be avoided for accurate dew point measurement.
5. INSTRUMENT LOCATIONS
Leakage rate pressure readout instrumentation should be located in a controlled temperature environment. Small temperature swings (approximately lOop) can have significant effects on these instruments, particularly the reference vessel differential pressure instruments. Part of the effect is the influence of the temperature upon the indicating fluid. The major effect arises from a portion of the reference vessel being located out::;ide the containment where any temperature cycle causes a corresponding reference vessel pressure cycle. This effect was particularly noticeable at CVTR because the three different reference vessels (1/ 4, 3/4, and one inch) penetrated the containment at the same point. A comparison of the effects of temperature cycles upon the vessels showed the 1/4-inch vessel to be most affected, the one-inch system next, and the 3/ 4-inch system least affected. Table I of Section II-4.1 shows that this effect is in direct proportion to the percent of the reference vessel located outside the containment; that is, about 7% of the 1/4-inch vessel, 0.3% of the one-inch vessel, and 0.08% of the 3/4-inch vessel were outside the containment.
At times, the temperature effect was quite pronounced, even though every effort was made to minimize it including holding the auxiliary building basement temperature as stable as possible, locating the instrumentation so the external lines were as· short as possible, and insulating the external lines with Neoprene tubing insulation.
6. TEST LENGTH
The CVTR tests varied from 18 to 48 hours in duration with an additional (during certain tests) 6 to 24 hours of known leak operation. Generally, satisfactory test results were obtained within 18 to 20 hours after an initial 4- to 6-hour period following pressurization or depressurization to allow the containment and reference vessel systems to stabilize. Based upon CVTR experience,
57

18 hours is the minimum time in which a reliable leakage rate test can be performed; this time may or may not·be sufficient for tests at pressures less than 6 psig or in containments that experience large diurnal temperature swings.
58

V)l. CONCLUSIONS
The following conclusions were reached from the CVTR tests:
(1) For these tests, both the reference vessel method and the absolute method of measuring leakage rate provided good data with the reference vessel method providing data with slightly less scatter.
(2) For a particular leakage path, the CVTR leakage rates increased and decreased with pressure and as predicted by established extrapolation equations. However, leakage paths and associated leakage rates were found to change during and between test series. Thus, the selection of a particular extrapolation equation may be uncertain.
(3) Both the absolute and reference vessel methods were able to quickly detect a superimposed known le,ak and indicate its relative size.
(4) The CVTR containment leakage rate decreased with increasing test temperature. This phenomenon is undoubtedly dependent upon the particular leak paths, and these results may not be applicable to all containments. However, they · are expected to be representative of many of the newer containments which are similar in construction to CVTR.
(5) Subjection of the containment to simulated DBA conditions appears to have had negligible effect on the containment leak tightness.
·(6) A continuous leakage rate measurement system, which provides constant knowledge of containment leak tightness, is probably the most meaningful method of monitoring containment leakage because of uncertainties associated with changing leakage paths.
59

VIII. REFERENCES
1. J. A. Norberg, Carolinas Virginia Tube Reactor (CVTR) In-Plant Testing Project, ID0-17258H (April 1969).
2. Carolinas Virginia Nuclear Power Associates, Inc., Final Hazards Summary Report, CVNA-90 (January 1962).
3. J. A., Norberg, Preliminary Results of Simulated Design Basis Accident Tests of the Carolinas Virginia Tube Reactor Containment, IN-1325 (October 1969).
4. W. E. Barrow, CVTR Vapor Container Leak Rate Test, September 1966, CVNA-266 (November 1966).
5. G. E. Bingham, The Carolinas Virginia Tube Reactor Preliminary Leakage Rate Test Results, ID0-17273 (October 1968).
6. E. J. Minnar (ed.), ISA Transducer Compendium, New York: Plenum Press, 1963.
7. .American · Nuclear SOciety standards Committee, Proposed Standard for ·Lealmge Rate Testing of Containment structures for Nuclear Reactors, ANS 7.60 (June 1967).
8. W. B. Cottrell and A. W. Savolainen (eds.); U. S. Reactor Containment Technology -- A Compilation. of Current Practice in Analysis, Design, Construction, Test, and Operation, ORNL-NSIC-5 (Vol.· II) (August 1965).
60