Embed Size (px)
Citation preview
Color Appearance Models Second Edition M. D. Fairchild © 2005 John Wiley & Sons, LtdISBN: 0-470-01216-1 (HB)
1Human Color Vision
Color appearance models aim to extend basic colorimetry to the level of speci-fying the perceived color of stimuli in a wide variety of viewing conditions. Tofully appreciate the formulation, implementation, and application of colorappearance models, several fundamental topics in color science must firstbe understood. These are the topics of the first few chapters of this book.Since color appearance represents several of the dimensions of our visualexperience, any system designed to predict correlates to these experiencesmust be based, to some degree, on the form and function of the humanvisual system. All of the color appearance models described in this book arederived with human visual function in mind. It becomes much simpler tounderstand the formulations of the various models if the basic anatomy,physiology, and performance of the visual system is understood. Thus, thisbook begins with a treatment of the human visual system.
As necessitated by the limited scope available in a single chapter, thistreatment of the visual system is an overview of the topics most importantfor an appreciation of color appearance modeling. The field of vision scienceis immense and fascinating. Readers are encouraged to explore the liter-ature and the many useful texts on human vision in order to gain furtherinsight and details. Of particular note are the review paper on the mechan-isms of color vision by Lennie and D’Zmura (1988), the text on human colorvision by Kaiser and Boynton (1996), the more general text on the founda-tions of vision by Wandell (1995), the comprehensive treatment by Palmer(1999), and edited collections on color vision by Backhaus et al. (1998) andGegenfurtner and Sharpe (1999). Much of the material covered in this chap-ter is treated in more detail in those references.
1.1 OPTICS OF THE EYE
Our visual perceptions are initiated and strongly influenced by the anatom-ical structure of the eye. Figure 1.1 shows a schematic representation of
CAMC01 9/30/04 3:13 PM Page 1
HUMAN COLOR VISION2
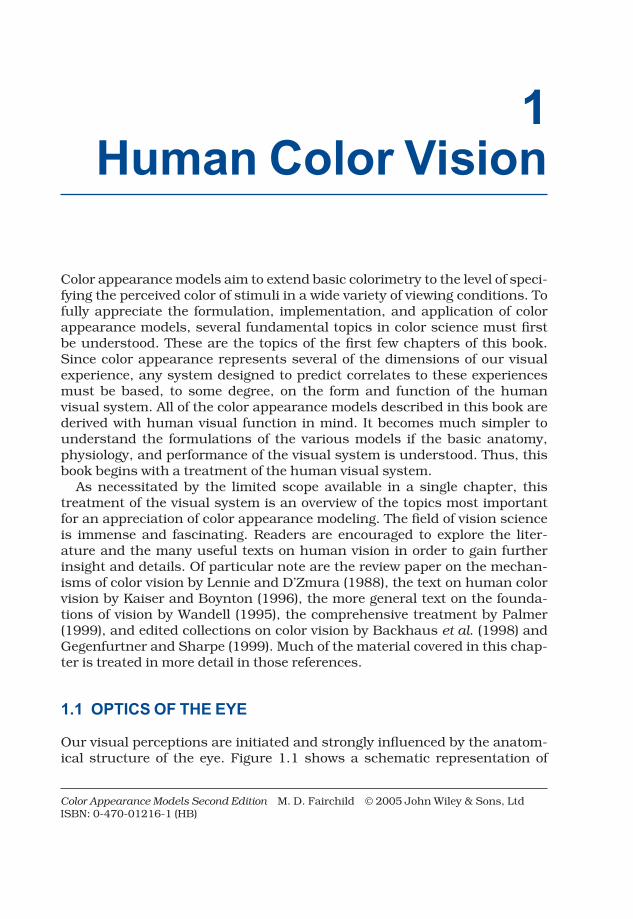
the optical structure of the human eye with some key features labeled. Thehuman eye acts like a camera. The cornea and lens act together like a camera lens to focus an image of the visual world on the retina at the back ofthe eye, which acts like the film or other image sensor of a camera. Theseand other structures have a significant impact on our perception of color.
The Cornea
The cornea is the transparent outer surface of the front of the eye throughwhich light passes. It serves as the most significant image-forming elementof the eye since its curved surface at the interface with air represents thelargest change in index of refraction in the eye’s optical system. The corneais avascular, receiving its nutrients from marginal blood vessels and thefluids surrounding it. Refractive errors, such as nearsightedness (myopia),
Figure 1.1 Schematic diagram of the human eye with some key structrues labeled
CAMC01 9/30/04 3:13 PM Page 2
HUMAN COLOR VISION 3
farsightedness (hyperopia), or astigmatism, can be attributed to variationsin the shape of the cornea and are sometimes corrected with laser surgerythat reshapes the cornea.
The Lens
The lens serves the function of accommodation. It is a layered, flexible struc-ture that varies in index of refraction. It is a naturally occurring gradient-index optical element with the index of refraction higher in the center of thelens than at the edges. This feature serves to reduce some of the aberrationsthat might normally be present in a simple optical system.
The shape of the lens is controlled by the ciliary muscles. When we gaze ata nearby object, the lens becomes ‘fatter’ and thus has increased opticalpower to allow us to focus on the near object. When we gaze at a distantobject, the lens becomes ‘flatter’ resulting in the decreased optical powerrequired to bring far away objects into sharp focus. As we age, the internalstructure of the lens changes resulting in a loss of flexibility. Generally,when an age of about 50 years is reached the lens has completely lost itsflexibility and observers can no longer focus on near objects (this is calledpresbyopia, or ‘old eye’). It is at this point that most people need readingglasses or bifocals.
Concurrent with the hardening of the lens is an increase in its optical density. The lens absorbs and scatters short-wavelength (blue and violet)energy. As it hardens, the level of this absorption and scattering increases.In other words, the lens becomes more and more yellow with age. Variousmechanisms of chromatic adaptation generally make us unaware of thesegradual changes. However, we are all looking at the world through a yellowfilter that not only changes with age, but is significantly different fromobserver to observer. The effects are most noticeable when performing crit-ical color matching or comparing color matches with other observers. Theeffect is particularly apparent with purple objects. Since an older lensabsorbs most of the blue energy reflected from a purple object, but does notaffect the reflected red energy, older observers will tend to report that theobject is significantly more red than reported by younger observers. Import-ant issues regarding the characteristics of lens aging and its influence onvisual performance are discussed by Pokorny et al. (1987), Werner andSchefrin (1993), and Schefrin and Werner (1993).
The Humors
The volume between the cornea and lens is filled with the aqueous humor,which is essentially water. The region between the lens and retina is filledwith vitreous humor, which is also a fluid, but with a higher viscosity, similarto that of gelatin. Both humors exist in a state of slightly elevated pressure
CAMC01 9/30/04 3:13 PM Page 3
HUMAN COLOR VISION4
(relative to air pressure) to assure that the flexible eyeball retains its shapeand dimensions in order to avoid the deleterious effects of wavering retinalimages. The flexibility of the entire eyeball serves to increase its resistance toinjury. It is much more difficult to break a structure that gives way underimpact than one of equal ‘strength’ that attempts to remain rigid. Since theindices of refraction of the humors are roughly equal to that of water, andthose of the cornea and lens are only slightly higher, the rear surface of thecornea and the entire lens have relatively little optical power.
The Iris
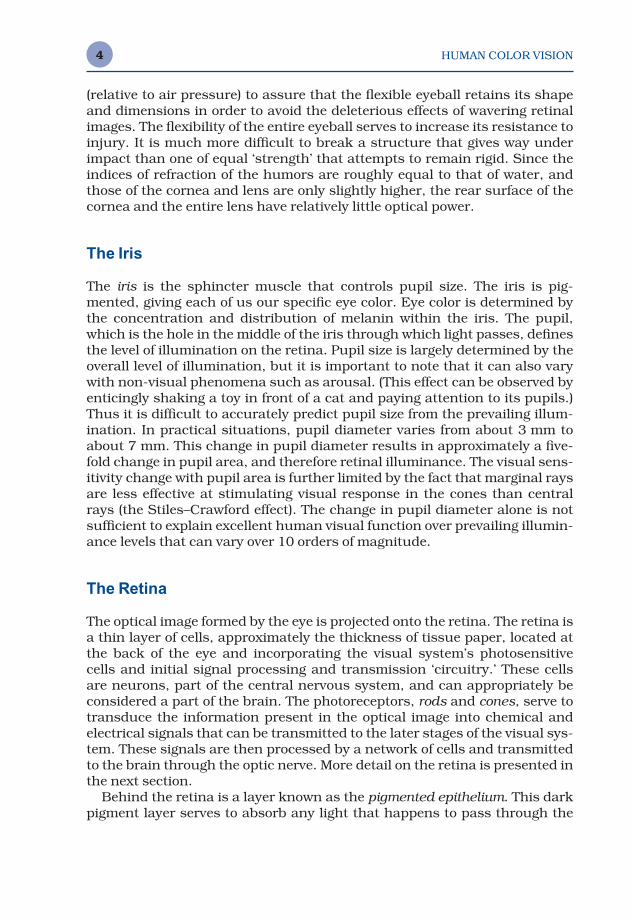
The iris is the sphincter muscle that controls pupil size. The iris is pig-mented, giving each of us our specific eye color. Eye color is determined bythe concentration and distribution of melanin within the iris. The pupil,which is the hole in the middle of the iris through which light passes, definesthe level of illumination on the retina. Pupil size is largely determined by theoverall level of illumination, but it is important to note that it can also varywith non-visual phenomena such as arousal. (This effect can be observed byenticingly shaking a toy in front of a cat and paying attention to its pupils.)Thus it is difficult to accurately predict pupil size from the prevailing illum-ination. In practical situations, pupil diameter varies from about 3 mm toabout 7 mm. This change in pupil diameter results in approximately a five-fold change in pupil area, and therefore retinal illuminance. The visual sens-itivity change with pupil area is further limited by the fact that marginal raysare less effective at stimulating visual response in the cones than centralrays (the Stiles–Crawford effect). The change in pupil diameter alone is notsufficient to explain excellent human visual function over prevailing illumin-ance levels that can vary over 10 orders of magnitude.
The Retina
The optical image formed by the eye is projected onto the retina. The retina isa thin layer of cells, approximately the thickness of tissue paper, located atthe back of the eye and incorporating the visual system’s photosensitive cells and initial signal processing and transmission ‘circuitry.’ These cellsare neurons, part of the central nervous system, and can appropriately beconsidered a part of the brain. The photoreceptors, rods and cones, serve totransduce the information present in the optical image into chemical andelectrical signals that can be transmitted to the later stages of the visual sys-tem. These signals are then processed by a network of cells and transmittedto the brain through the optic nerve. More detail on the retina is presented inthe next section.
Behind the retina is a layer known as the pigmented epithelium. This darkpigment layer serves to absorb any light that happens to pass through the
CAMC01 9/30/04 3:13 PM Page 4
HUMAN COLOR VISION 5
retina without being absorbed by the photoreceptors. The function of thepigmented epithelium is to prevent light from being scattered back throughthe retina, thus reducing the sharpness and contrast of the perceived image.Nocturnal animals give up this improved image quality in exchange for ahighly reflective tapetum that reflects the light back in order to provide a second chance for the photoreceptors to absorb the energy. This is why theeyes of a deer, or other nocturnal animal, caught in the headlights of anoncoming automobile, appear to glow.
The Fovea
Perhaps the most important structural area on the retina is the fovea. Thefovea is the area on the retina where we have the best spatial and colorvision. When we look at, or fixate, an object in our visual field, we move ourhead and eyes such that the image of the object falls on the fovea. As you arereading this text, you are moving your eyes to make the various words fall onyour fovea as you read them. To illustrate how drastically spatial acuity fallsoff as the stimulus moves away from the fovea, try to read preceding text inthis paragraph while fixating on the period at the end of this sentence. It isprobably difficult, if not impossible, to read text that is only a few lines awayfrom the point of fixation. The fovea covers an area that subtends about twodegrees of visual angle in the central field of vision. To visualize two degreesof visual angle, a general rule is that the width of your thumbnail, held atarm’s length, is approximately one degree of visual angle.
The Macula
The fovea is also protected by a yellow filter known as the macula. The mac-ula serves to protect this critical area of the retina from intense exposures toshort-wavelength energy. It might also serve to reduce the effects of chro-matic aberration that cause the short-wavelength image to be rather severelyout of focus most of the time. Unlike the lens, the macula does not becomemore yellow with age. However, there are significant differences in the opticaldensity of the macular pigment from observer to observer and in some casesbetween a single observer’s left and right eyes. The yellow filters of the lensand macula, through which we all view the world, are the major source ofvariability in color vision between observers with normal color vision.
The Optic Nerve
A last key structure of the eye is the optic nerve. The optic nerve is made up of the axons (outputs) of the ganglion cells, the last level of neural processingin the retina. It is interesting to note that the optic nerve is made up of
CAMC01 9/30/04 3:13 PM Page 5
HUMAN COLOR VISION6
approximately one million fibers, carrying information generated by approx-imately 130 million photoreceptors. Thus there is a clear compression of thevisual signal prior to transmission to higher levels of the visual system. Aone-to-one ‘pixel map’ of the visual stimulus is never available for processingby the brain’s higher visual mechanisms. This processing is explored ingreater detail below. Since the optic nerve takes up all of the space that would normally be populated by photoreceptors, there is a small area in each eye inwhich no visual stimulation can occur. This area is known as the blind spot.
The structures described above have a clear impact in shaping anddefining the information available to the visual system that ultimatelyresults in the perception of color appearance. The action of the pupil servesto define retinal illuminance levels that, in turn, have a dramatic impact oncolor appearance. The yellow-filtering effects of the lens and macula modu-late the spectral responsivity of our visual system and introduce significantinter-observer variability. The spatial structure of the retina serves to helpdefine the extent and nature of various visual fields that are critical fordefining color appearance. The neural networks in the retina reiterate thatvisual perception in general, and specifically color appearance, cannot betreated as simple point-wise image processing problems. Several of theseimportant features are discussed in more detail in the following sections onthe retina, visual physiology, and visual performance.
1.2 THE RETINA
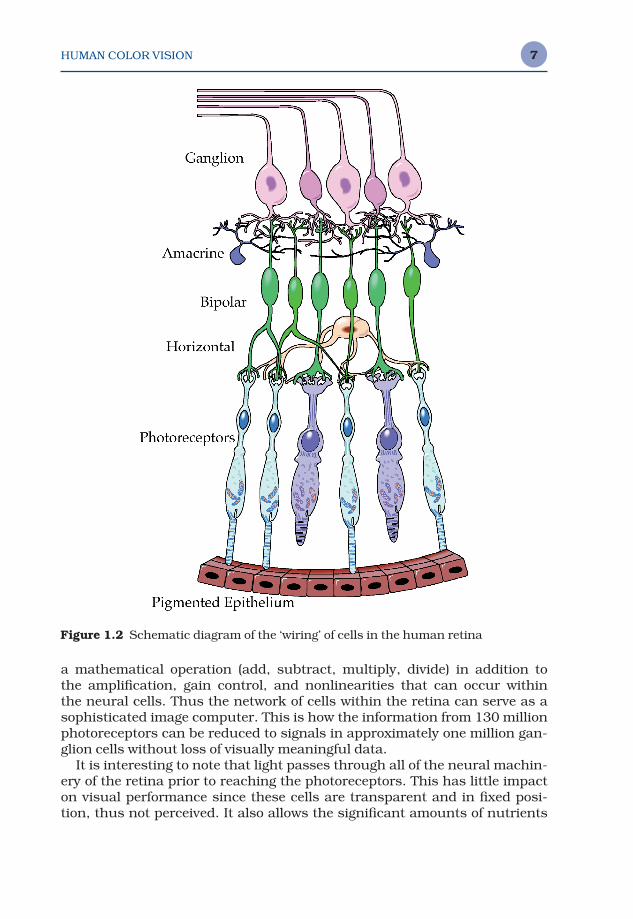
Figure 1.2 illustrates a cross-sectional representation of the retina. Theretina includes several layers of neural cells, beginning with the photorecep-tors, the rods and cones. A vertical signal processing chain through theretina can be constructed by examining the connections of photoreceptors tobipolar cells, which are in turn connected to ganglion cells, which form theoptic nerve. Even this simple pathway results in the signals from multiplephotoreceptors being compared and combined. This is because multiplephotoreceptors provide input to many of the bipolar cells and multiple bipo-lar cells provide input to many of the ganglion cells. More importantly, thissimple concept of retinal signal processing ignores two other significanttypes of cells. These are the horizontal cells, that connect photoreceptors andbipolar cells laterally to one another, and the amacrine cells, that connectbipolar cells and ganglion cells laterally to one another. Figure 1.2 providesonly a slight indication of the extent of these various interconnections.
The specific processing that occurs in each type of cell is not completelyunderstood and is beyond the scope of this chapter. However, it is importantto realize that the signals transmitted from the retina to the higher levels of the brain via the ganglion cells are not simple point-wise representationsof the receptor signals, but rather consist of sophisticated combinations ofthe receptor signals. To envision the complexity of the retinal processing,keep in mind that each synapse between neural cells can effectively perform
CAMC01 9/30/04 3:13 PM Page 6
HUMAN COLOR VISION 7
a mathematical operation (add, subtract, multiply, divide) in addition to the amplification, gain control, and nonlinearities that can occur within the neural cells. Thus the network of cells within the retina can serve as asophisticated image computer. This is how the information from 130 millionphotoreceptors can be reduced to signals in approximately one million gan-glion cells without loss of visually meaningful data.
It is interesting to note that light passes through all of the neural machin-ery of the retina prior to reaching the photoreceptors. This has little impacton visual performance since these cells are transparent and in fixed posi-tion, thus not perceived. It also allows the significant amounts of nutrients
Figure 1.2 Schematic diagram of the ‘wiring’ of cells in the human retina
CAMC01 9/30/04 3:13 PM Page 7
HUMAN COLOR VISION8
required and waste produced by the photoreceptors to be processed throughthe back of the eye.
Rods and Cones
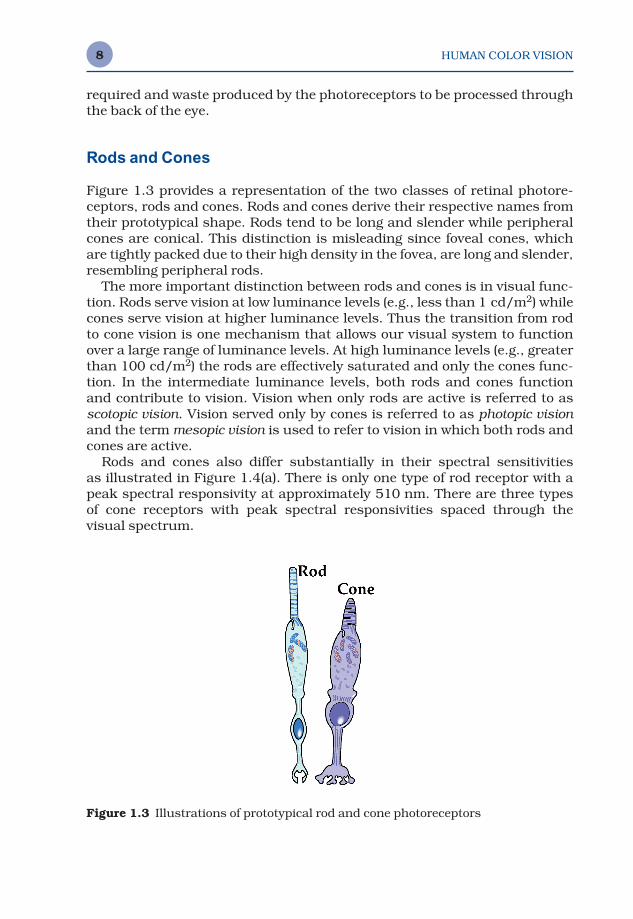
Figure 1.3 provides a representation of the two classes of retinal photore-ceptors, rods and cones. Rods and cones derive their respective names fromtheir prototypical shape. Rods tend to be long and slender while peripheralcones are conical. This distinction is misleading since foveal cones, whichare tightly packed due to their high density in the fovea, are long and slender,resembling peripheral rods.
The more important distinction between rods and cones is in visual func-tion. Rods serve vision at low luminance levels (e.g., less than 1 cd/m2) whilecones serve vision at higher luminance levels. Thus the transition from rodto cone vision is one mechanism that allows our visual system to functionover a large range of luminance levels. At high luminance levels (e.g., greaterthan 100 cd/m2) the rods are effectively saturated and only the cones func-tion. In the intermediate luminance levels, both rods and cones function and contribute to vision. Vision when only rods are active is referred to asscotopic vision. Vision served only by cones is referred to as photopic visionand the term mesopic vision is used to refer to vision in which both rods andcones are active.
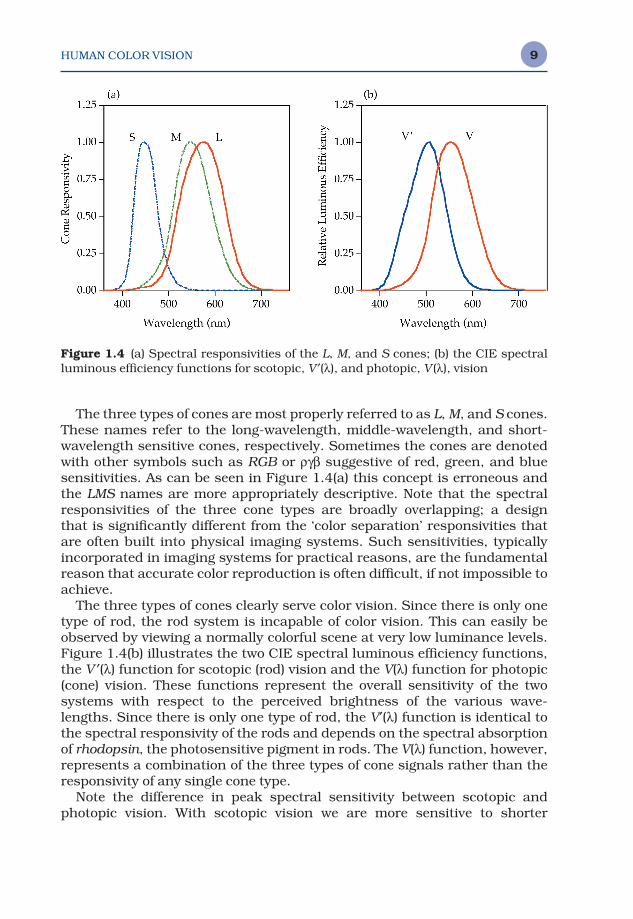
Rods and cones also differ substantially in their spectral sensitivities as illustrated in Figure 1.4(a). There is only one type of rod receptor with apeak spectral responsivity at approximately 510 nm. There are three typesof cone receptors with peak spectral responsivities spaced through thevisual spectrum.
Figure 1.3 Illustrations of prototypical rod and cone photoreceptors
CAMC01 9/30/04 3:13 PM Page 8
HUMAN COLOR VISION 9
The three types of cones are most properly referred to as L, M, and S cones.These names refer to the long-wavelength, middle-wavelength, and short-wavelength sensitive cones, respectively. Sometimes the cones are denotedwith other symbols such as RGB or ργβ suggestive of red, green, and bluesensitivities. As can be seen in Figure 1.4(a) this concept is erroneous andthe LMS names are more appropriately descriptive. Note that the spectralresponsivities of the three cone types are broadly overlapping; a design that is significantly different from the ‘color separation’ responsivities thatare often built into physical imaging systems. Such sensitivities, typically incorporated in imaging systems for practical reasons, are the fundamentalreason that accurate color reproduction is often difficult, if not impossible toachieve.
The three types of cones clearly serve color vision. Since there is only onetype of rod, the rod system is incapable of color vision. This can easily beobserved by viewing a normally colorful scene at very low luminance levels.Figure 1.4(b) illustrates the two CIE spectral luminous efficiency functions,the V ′(λ) function for scotopic (rod) vision and the V(λ) function for photopic(cone) vision. These functions represent the overall sensitivity of the two systems with respect to the perceived brightness of the various wave-lengths. Since there is only one type of rod, the V′(λ) function is identical tothe spectral responsivity of the rods and depends on the spectral absorptionof rhodopsin, the photosensitive pigment in rods. The V(λ) function, however,represents a combination of the three types of cone signals rather than theresponsivity of any single cone type.
Note the difference in peak spectral sensitivity between scotopic and photopic vision. With scotopic vision we are more sensitive to shorter
Figure 1.4 (a) Spectral responsivities of the L, M, and S cones; (b) the CIE spectralluminous efficiency functions for scotopic, V ′(λ), and photopic, V (λ), vision
CAMC01 9/30/04 3:13 PM Page 9
HUMAN COLOR VISION10
wavelengths. This effect, known as the Purkinje shift, can be observed byfinding two objects, one blue and the other red, that appear the same light-ness when viewed in daylight. When the same two objects are viewed undervery low luminance levels, the blue object will appear quite light while thered object will appear nearly black because of the scotopic spectral sensitiv-ity function.
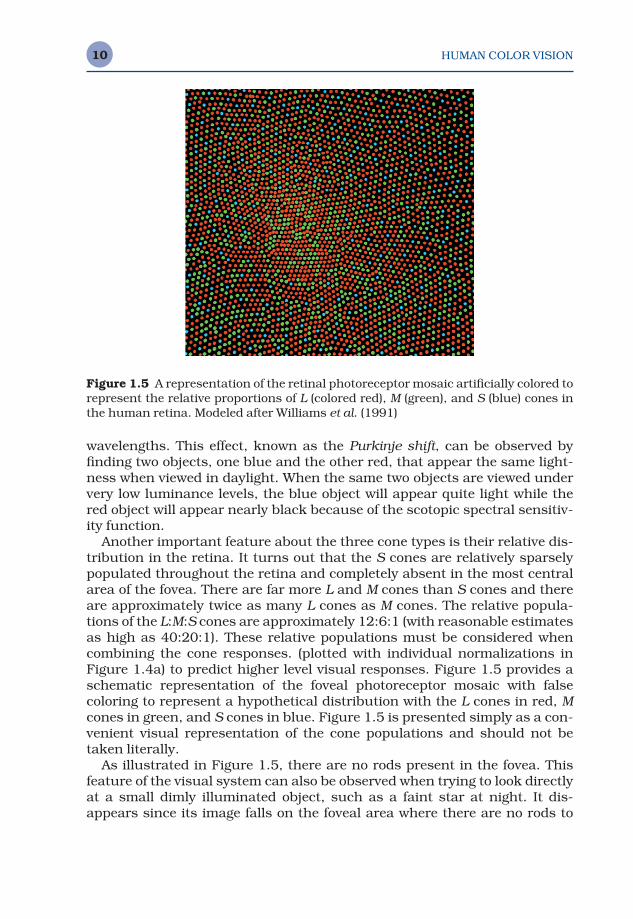
Another important feature about the three cone types is their relative dis-tribution in the retina. It turns out that the S cones are relatively sparselypopulated throughout the retina and completely absent in the most centralarea of the fovea. There are far more L and M cones than S cones and thereare approximately twice as many L cones as M cones. The relative popula-tions of the L:M:S cones are approximately 12:6:1 (with reasonable estimatesas high as 40:20:1). These relative populations must be considered whencombining the cone responses. (plotted with individual normalizations inFigure 1.4a) to predict higher level visual responses. Figure 1.5 provides aschematic representation of the foveal photoreceptor mosaic with false coloring to represent a hypothetical distribution with the L cones in red, Mcones in green, and S cones in blue. Figure 1.5 is presented simply as a con-venient visual representation of the cone populations and should not betaken literally.
As illustrated in Figure 1.5, there are no rods present in the fovea. Thisfeature of the visual system can also be observed when trying to look directlyat a small dimly illuminated object, such as a faint star at night. It dis-appears since its image falls on the foveal area where there are no rods to
Figure 1.5 A representation of the retinal photoreceptor mosaic artificially colored torepresent the relative proportions of L (colored red), M (green), and S (blue) cones inthe human retina. Modeled after Williams et al. (1991)
CAMC01 9/30/04 3:13 PM Page 10
HUMAN COLOR VISION 11
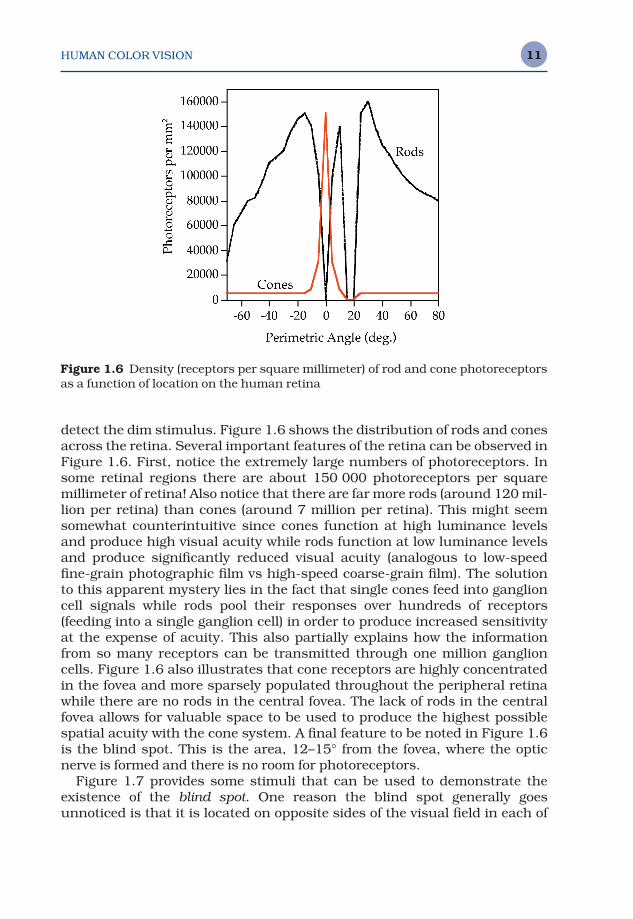
detect the dim stimulus. Figure 1.6 shows the distribution of rods and conesacross the retina. Several important features of the retina can be observed inFigure 1.6. First, notice the extremely large numbers of photoreceptors. Insome retinal regions there are about 150 000 photoreceptors per square millimeter of retina! Also notice that there are far more rods (around 120 mil-lion per retina) than cones (around 7 million per retina). This might seemsomewhat counterintuitive since cones function at high luminance levelsand produce high visual acuity while rods function at low luminance levelsand produce significantly reduced visual acuity (analogous to low-speedfine-grain photographic film vs high-speed coarse-grain film). The solutionto this apparent mystery lies in the fact that single cones feed into ganglioncell signals while rods pool their responses over hundreds of receptors (feeding into a single ganglion cell) in order to produce increased sensitivityat the expense of acuity. This also partially explains how the informationfrom so many receptors can be transmitted through one million ganglioncells. Figure 1.6 also illustrates that cone receptors are highly concentratedin the fovea and more sparsely populated throughout the peripheral retinawhile there are no rods in the central fovea. The lack of rods in the centralfovea allows for valuable space to be used to produce the highest possiblespatial acuity with the cone system. A final feature to be noted in Figure 1.6is the blind spot. This is the area, 12–15° from the fovea, where the opticnerve is formed and there is no room for photoreceptors.
Figure 1.7 provides some stimuli that can be used to demonstrate theexistence of the blind spot. One reason the blind spot generally goes unnoticed is that it is located on opposite sides of the visual field in each of
Figure 1.6 Density (receptors per square millimeter) of rod and cone photoreceptorsas a function of location on the human retina
CAMC01 9/30/04 3:13 PM Page 11
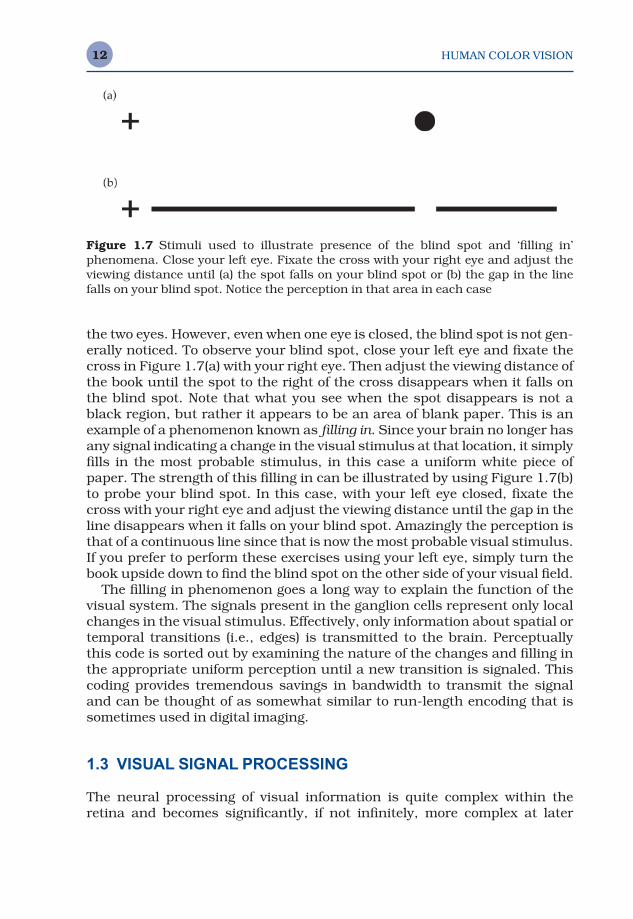
HUMAN COLOR VISION12
the two eyes. However, even when one eye is closed, the blind spot is not gen-erally noticed. To observe your blind spot, close your left eye and fixate thecross in Figure 1.7(a) with your right eye. Then adjust the viewing distance ofthe book until the spot to the right of the cross disappears when it falls onthe blind spot. Note that what you see when the spot disappears is not ablack region, but rather it appears to be an area of blank paper. This is anexample of a phenomenon known as filling in. Since your brain no longer hasany signal indicating a change in the visual stimulus at that location, it simplyfills in the most probable stimulus, in this case a uniform white piece ofpaper. The strength of this filling in can be illustrated by using Figure 1.7(b)to probe your blind spot. In this case, with your left eye closed, fixate thecross with your right eye and adjust the viewing distance until the gap in theline disappears when it falls on your blind spot. Amazingly the perception isthat of a continuous line since that is now the most probable visual stimulus.If you prefer to perform these exercises using your left eye, simply turn thebook upside down to find the blind spot on the other side of your visual field.
The filling in phenomenon goes a long way to explain the function of thevisual system. The signals present in the ganglion cells represent only localchanges in the visual stimulus. Effectively, only information about spatial ortemporal transitions (i.e., edges) is transmitted to the brain. Perceptuallythis code is sorted out by examining the nature of the changes and filling inthe appropriate uniform perception until a new transition is signaled. Thiscoding provides tremendous savings in bandwidth to transmit the signaland can be thought of as somewhat similar to run-length encoding that issometimes used in digital imaging.
1.3 VISUAL SIGNAL PROCESSING
The neural processing of visual information is quite complex within theretina and becomes significantly, if not infinitely, more complex at later
Figure 1.7 Stimuli used to illustrate presence of the blind spot and ‘filling in’ phenomena. Close your left eye. Fixate the cross with your right eye and adjust theviewing distance until (a) the spot falls on your blind spot or (b) the gap in the linefalls on your blind spot. Notice the perception in that area in each case
CAMC01 9/30/04 3:13 PM Page 12
HUMAN COLOR VISION 13
stages. This section provides a brief overview of the paths that some of thisinformation takes. It is helpful to begin with a general map of the steps alongthe way. The optical image on the retina is first transduced into chemicaland electrical signals in the photoreceptors. These signals are then pro-cessed through the network of retinal neurons (horizontal, bipolar, amacrine,and ganglion cells) described above. The ganglion cell axons gather to formthe optic nerve, which projects to the lateral geniculate nucleus (LGN) in thethalamus. The LGN cells, after gathering input from the ganglion cells, pro-ject to visual area one (V1) in the occipital lobe of the cortex. At this point, theinformation processing begins to become amazingly complex. Approximately30 visual areas have been defined in the cortex with names such as V2, V3,V4, MT, etc. Signals from these areas project to several other areas and viceversa. The cortical processing includes many instances of feed-forward,feed-back, and lateral processing. Somewhere in this network of informationour ultimate perceptions are formed. A few more details of these processesare described in the following paragraphs.
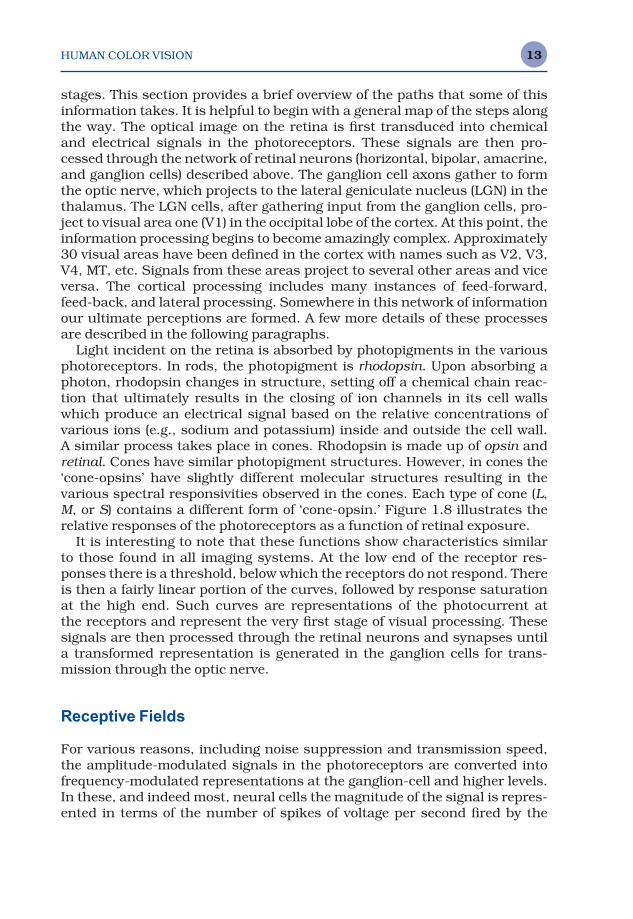
Light incident on the retina is absorbed by photopigments in the variousphotoreceptors. In rods, the photopigment is rhodopsin. Upon absorbing aphoton, rhodopsin changes in structure, setting off a chemical chain reac-tion that ultimately results in the closing of ion channels in its cell wallswhich produce an electrical signal based on the relative concentrations ofvarious ions (e.g., sodium and potassium) inside and outside the cell wall. A similar process takes place in cones. Rhodopsin is made up of opsin andretinal. Cones have similar photopigment structures. However, in cones the‘cone-opsins’ have slightly different molecular structures resulting in thevarious spectral responsivities observed in the cones. Each type of cone (L,M, or S) contains a different form of ‘cone-opsin.’ Figure 1.8 illustrates therelative responses of the photoreceptors as a function of retinal exposure.
It is interesting to note that these functions show characteristics similarto those found in all imaging systems. At the low end of the receptor res-ponses there is a threshold, below which the receptors do not respond. Thereis then a fairly linear portion of the curves, followed by response saturationat the high end. Such curves are representations of the photocurrent at the receptors and represent the very first stage of visual processing. Thesesignals are then processed through the retinal neurons and synapses until a transformed representation is generated in the ganglion cells for trans-mission through the optic nerve.
Receptive Fields
For various reasons, including noise suppression and transmission speed,the amplitude-modulated signals in the photoreceptors are converted intofrequency-modulated representations at the ganglion-cell and higher levels.In these, and indeed most, neural cells the magnitude of the signal is repres-ented in terms of the number of spikes of voltage per second fired by the
CAMC01 9/30/04 3:13 PM Page 13
HUMAN COLOR VISION14
cell rather than by the voltage difference across the cell wall. To representthe physiological properties of these cells, the concept of receptive fieldsbecomes useful.
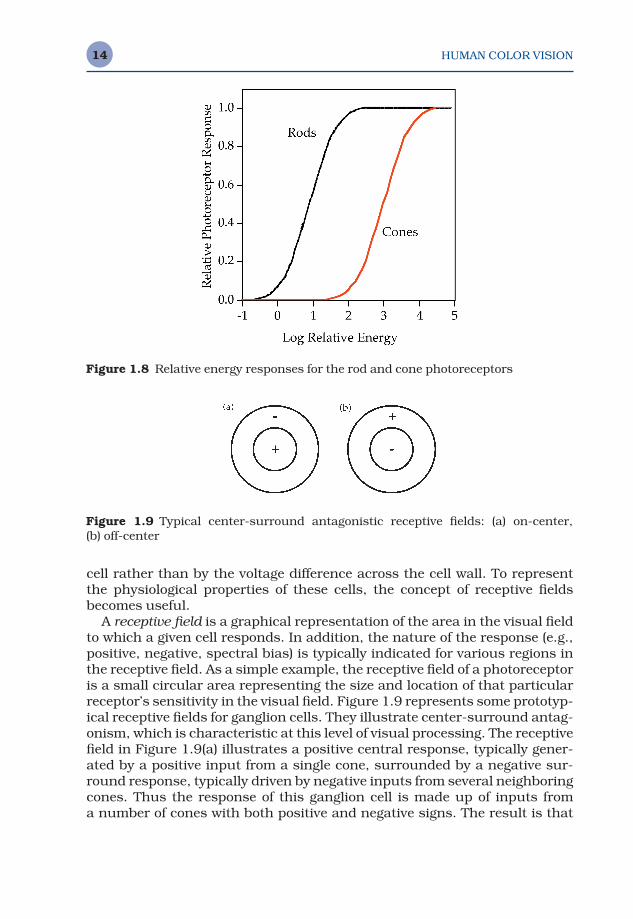
A receptive field is a graphical representation of the area in the visual fieldto which a given cell responds. In addition, the nature of the response (e.g.,positive, negative, spectral bias) is typically indicated for various regions inthe receptive field. As a simple example, the receptive field of a photoreceptoris a small circular area representing the size and location of that particularreceptor’s sensitivity in the visual field. Figure 1.9 represents some prototyp-ical receptive fields for ganglion cells. They illustrate center-surround antag-onism, which is characteristic at this level of visual processing. The receptivefield in Figure 1.9(a) illustrates a positive central response, typically gener-ated by a positive input from a single cone, surrounded by a negative sur-round response, typically driven by negative inputs from several neighboringcones. Thus the response of this ganglion cell is made up of inputs from a number of cones with both positive and negative signs. The result is that
Figure 1.8 Relative energy responses for the rod and cone photoreceptors
Figure 1.9 Typical center-surround antagonistic receptive fields: (a) on-center, (b) off-center
CAMC01 9/30/04 3:13 PM Page 14
HUMAN COLOR VISION 15
the ganglion cell does not simply respond to points of light, but serves as anedge detector (actually a ‘spot’ detector). Readers familiar with digital imageprocessing can think of the ganglion cell responses as similar to the outputof a convolution kernel designed for edge detection.
Figure 1.9(b) illustrates that a ganglion cell response of opposite polarityis equally likely. The response in Figure 1.9(a) is considered an on-centerganglion cell while that in Figure 1.9(b) is called an off-center ganglion cell.Often on-center and off-center cells will occur at the same spatial location,fed by the same photoreceptors, resulting in an enhancement of the system’sdynamic range.
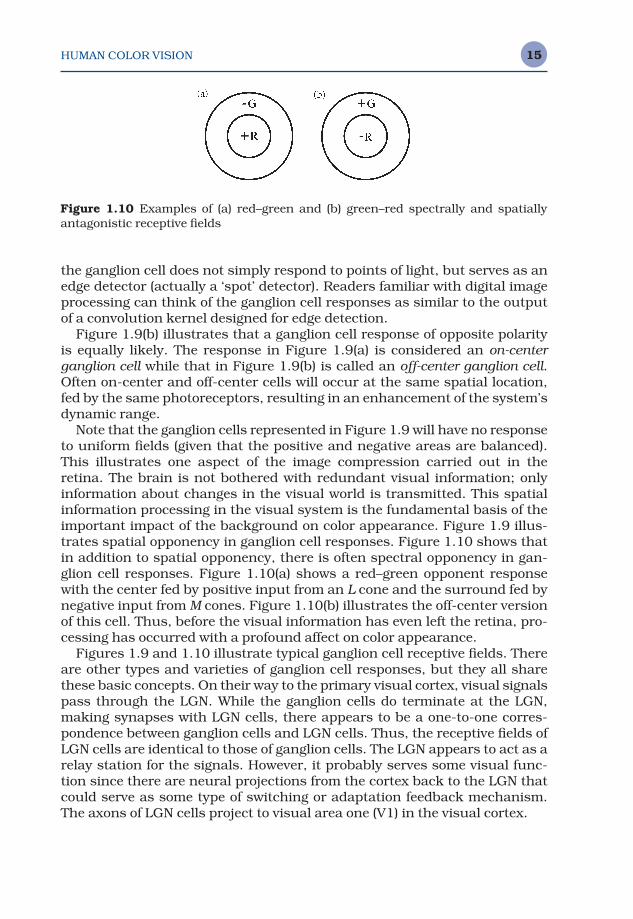
Note that the ganglion cells represented in Figure 1.9 will have no responseto uniform fields (given that the positive and negative areas are balanced).This illustrates one aspect of the image compression carried out in theretina. The brain is not bothered with redundant visual information; onlyinformation about changes in the visual world is transmitted. This spatialinformation processing in the visual system is the fundamental basis of theimportant impact of the background on color appearance. Figure 1.9 illus-trates spatial opponency in ganglion cell responses. Figure 1.10 shows thatin addition to spatial opponency, there is often spectral opponency in gan-glion cell responses. Figure 1.10(a) shows a red–green opponent responsewith the center fed by positive input from an L cone and the surround fed bynegative input from M cones. Figure 1.10(b) illustrates the off-center versionof this cell. Thus, before the visual information has even left the retina, pro-cessing has occurred with a profound affect on color appearance.
Figures 1.9 and 1.10 illustrate typical ganglion cell receptive fields. Thereare other types and varieties of ganglion cell responses, but they all sharethese basic concepts. On their way to the primary visual cortex, visual signalspass through the LGN. While the ganglion cells do terminate at the LGN,making synapses with LGN cells, there appears to be a one-to-one corres-pondence between ganglion cells and LGN cells. Thus, the receptive fields ofLGN cells are identical to those of ganglion cells. The LGN appears to act as arelay station for the signals. However, it probably serves some visual func-tion since there are neural projections from the cortex back to the LGN thatcould serve as some type of switching or adaptation feedback mechanism.The axons of LGN cells project to visual area one (V1) in the visual cortex.
Figure 1.10 Examples of (a) red–green and (b) green–red spectrally and spatiallyantagonistic receptive fields
CAMC01 9/30/04 3:13 PM Page 15
HUMAN COLOR VISION16
Processing in Area V1
In area V1 of the cortex, the encoding of visual information becomes sig-nificantly more complex. Much as the outputs of various photoreceptors arecombined and compared to produce ganglion cell responses, the outputs ofvarious LGN cells are compared and combined to produce cortical responses.As the signals move further up in the cortical processing chain, this processrepeats itself with the level of complexity increasing very rapidly to the pointthat receptive fields begin to lose meaning. In V1, cells can be found thatselectively respond to various types of stimuli, including
• Oriented edges or bars• Input from one eye, the other, or both• Various spatial frequencies• Various temporal frequencies• Particular spatial locations• Various combinations of these features
In addition, cells can be found that seem to linearly combine inputs fromLGN cells and others with nonlinear summation. All of these various res-ponses are necessary to support visual capabilities such as the perceptionsof size, shape, location, motion, depth, and color. Given the complexity of cor-tical responses in V1 cells, it is not difficult to imagine how complex visualresponses can become in an interwoven network of approximately 30 visualareas.
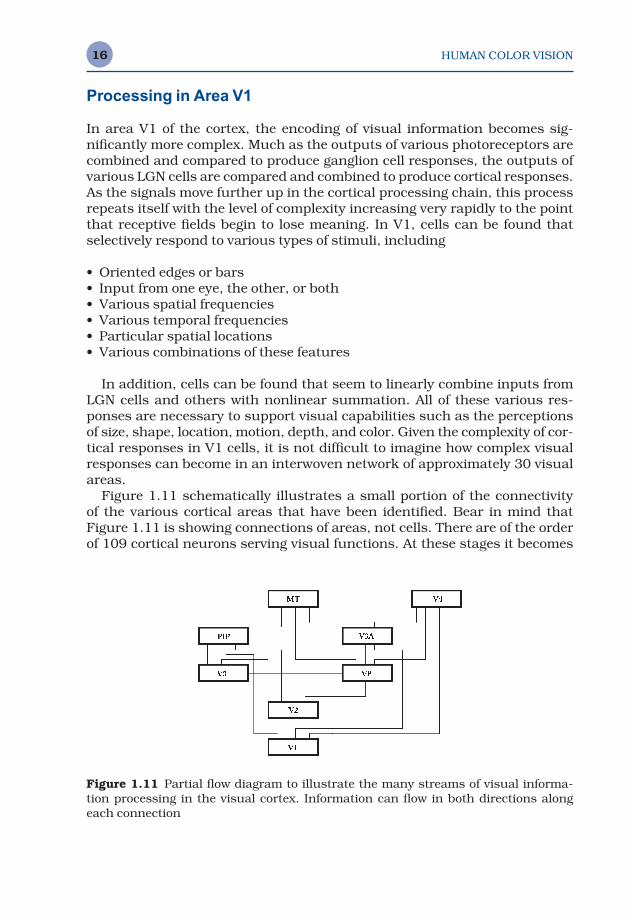
Figure 1.11 schematically illustrates a small portion of the connectivity of the various cortical areas that have been identified. Bear in mind thatFigure 1.11 is showing connections of areas, not cells. There are of the orderof 109 cortical neurons serving visual functions. At these stages it becomes
Figure 1.11 Partial flow diagram to illustrate the many streams of visual informa-tion processing in the visual cortex. Information can flow in both directions alongeach connection
CAMC01 9/30/04 3:13 PM Page 16
HUMAN COLOR VISION 17
exceedingly difficult to explain the function of single cortical cells in simpleterms. In fact, the function of a single cell might not have meaning since therepresentation of various perceptions must be distributed across collectionsof cells throughout the cortex. Rather than attempting to explore the physi-ology further, the following sections will describe some of the overall percep-tual and psychophysical properties of the visual system that help to specifyits performance.
1.4 MECHANISMS OF COLOR VISION
Historically, there have been many theories that attempt to explain the function of color vision. A brief look at some of the more modern conceptsprovides useful insight into current concepts.
Trichhromatic Theory
In the later half of the 19th century, the trichromatic theory of color vision wasdeveloped, based on the work of Maxwell, Young, and Helmholtz. They recog-nized that there must be three types of receptors, approximately sensitive tothe red, green, and blue regions of the spectrum, respectively. The trichro-matic theory simply assumed that three images of the world were formed bythese three sets of receptors and then transmitted to the brain where theratios of the signals in each of the images was compared in order to sort outcolor appearances. The trichromatic (three-receptor) nature of color visionwas not in doubt, but the idea of three images being transmitted to the brainis both inefficient and fails to explain several visually observed phenomena.
Hering’s Opponent-Colors Theory
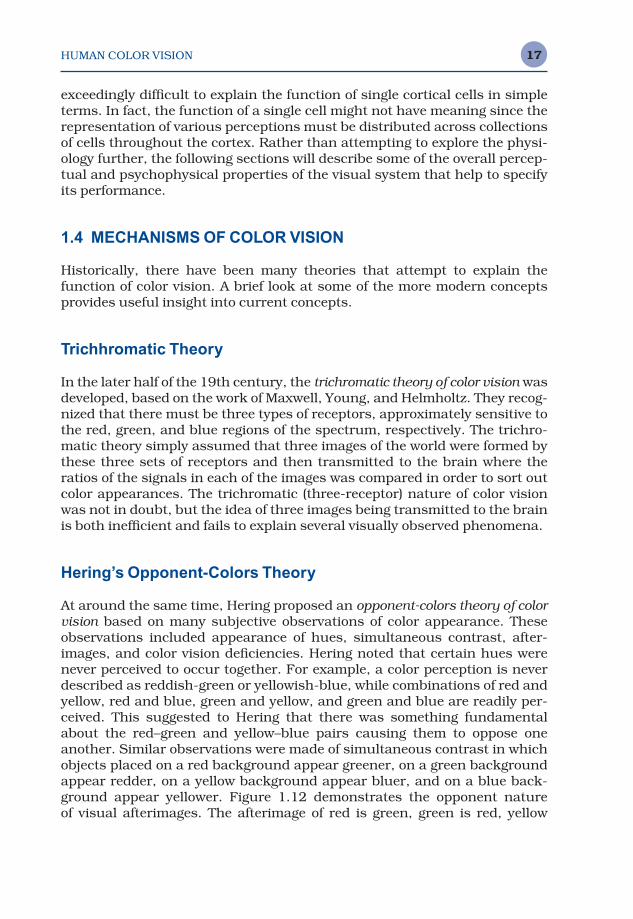
At around the same time, Hering proposed an opponent-colors theory of colorvision based on many subjective observations of color appearance. Theseobservations included appearance of hues, simultaneous contrast, after-images, and color vision deficiencies. Hering noted that certain hues werenever perceived to occur together. For example, a color perception is neverdescribed as reddish-green or yellowish-blue, while combinations of red andyellow, red and blue, green and yellow, and green and blue are readily per-ceived. This suggested to Hering that there was something fundamentalabout the red–green and yellow–blue pairs causing them to oppose oneanother. Similar observations were made of simultaneous contrast in whichobjects placed on a red background appear greener, on a green backgroundappear redder, on a yellow background appear bluer, and on a blue back-ground appear yellower. Figure 1.12 demonstrates the opponent nature of visual afterimages. The afterimage of red is green, green is red, yellow
CAMC01 9/30/04 3:13 PM Page 17
HUMAN COLOR VISION18
is blue, and blue is yellow. (It is worth noting that afterimages can also beeasily explained in terms of complementary colors due to adaptation in atrichromatic system. Hering only referred to light-dark afterimages in sup-port of opponent theory, not chromatic afterimages.) Lastly, Hering observedthat those with color vision deficiencies lose the ability to distinguish hues inred–green or yellow–blue pairs.
All of these observations provide clues regarding the processing of color in-formation in the visual system. Hering proposed that there were three typesof receptors, but Hering’s receptors had bipolar responses to light–dark,red–green, and yellow–blue. At the time, this was thought to be physiologic-ally implausible and Hering’s opponent theory did not receive appropriateacceptance.
Modern Opponent-Colors Theory
In the middle of the 20th century, Hering’s opponent theory enjoyed a revivalof sorts when quantitative data supporting it began to appear. For example,Svaetichin (1956) found opponent signals in electrophysiological measure-ments of responses in the retinas of goldfish (which happen to be trichro-matic!). DeValois et al. (1958), found similar opponent physiological responsesin the LGN cells of the macaque monkey. Jameson and Hurvich (1955) alsoadded quantitative psychophysical data through their hue-cancellationexperiments with human observers that allowed measurement of the relat-ive spectral sensitivities of opponent pathways. These data, combined with
Figure 1.12 Stimulus for the demonstration of opponent afterimages. Fixate uponthe black spot in the center of the four colored squares for about 30 seconds thenmove your gaze to fixate the black spot in the uniform white area. Note the colors ofthe afterimages relative to the colors of the original stimuli
CAMC01 9/30/04 3:13 PM Page 18
HUMAN COLOR VISION 19
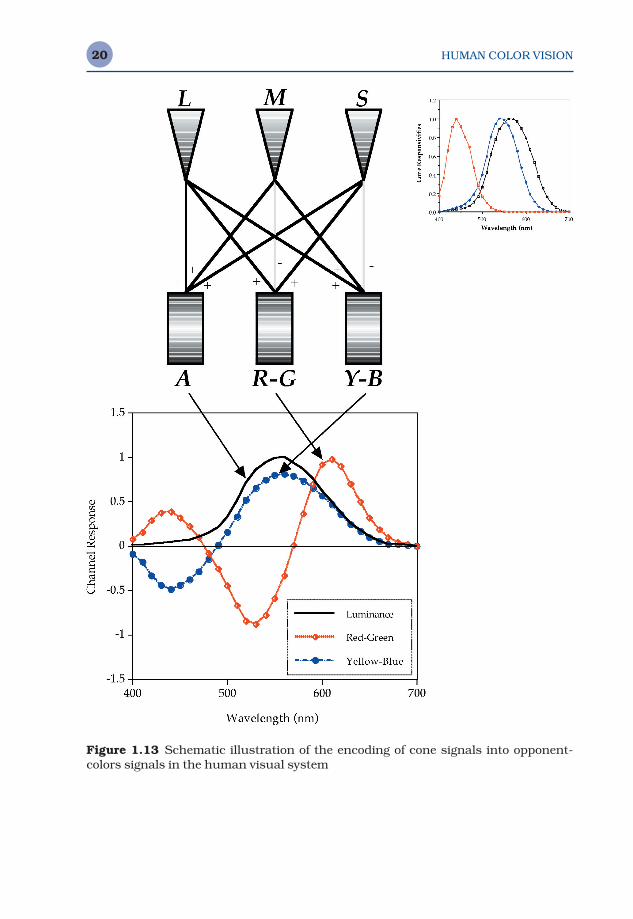
the overwhelming support of much additional research since that time, haveled to the development of the modern opponent theory of color vision (some-times called a stage theory) as illustrated in Figure 1.13.
Figure 1.13 illustrates that the first stage of color vision, the receptors, isindeed trichromatic as hypothesized by Maxwell, Young, and Helmholtz.However, contrary to simple trichromatic theory, the three ‘color-separation’images are not transmitted directly to the brain. Instead the neurons of theretina (and perhaps higher levels) encode the color into opponent signals.The outputs of all three cone types are summed (L + M + S) to produce anachromatic response that matches the CIE V(λ) curve as long as the summa-tion is taken in proportion to the relative populations of the three cone types.Differencing of the cone signals allows construction of red-green (L − M + S)and yellow-blue (L + M − S) opponent signals. The transformation from LMSsignals to the opponent signals serves to decorrelate the color informationcarried in the three channels, thus allowing more efficient signal transmis-sion and reducing difficulties with noise. The three opponent pathways alsohave distinct spatial and temporal characteristics that are important for pre-dicting color appearance. They are discussed further in Section 1.5.
The importance of the transformation from trichromatic to opponent sig-nals for color appearance is reflected in the prominent place that it findswithin the formulation of all color appearance models. Figure 1.13 includesnot only a schematic diagram of the neural ‘wiring’ that produces opponentresponses, but also the relative spectral responsivities of these mechanismsboth before and after opponent encoding.
Adaptation Mechanisms
However, it is not enough to consider the processing of color signals in thehuman visual system as a static ‘wiring diagram.’ The dynamic mechanismsof adaptation that serve to optimize the visual response to the particularviewing environment at hand must also be considered. Thus an overview ofthe various types of adaptation is in order. Of particular relevance to thestudy of color appearance are the mechanisms of dark, light, and chromaticadaptation.
Dark Adaptation
Dark adaptation refers to the change in visual sensitivity that occurs whenthe prevailing level of illumination is decreased, such as when walking into adarkened theater on a sunny afternoon. At first the entire theater appearscompletely dark, but after a few minutes one is able to clearly see objects in the theater such as the aisles, seats, and other people. This happensbecause the visual system is responding to the lack of illumination bybecoming more sensitive and therefore capable of producing a meaningfulvisual response at the lower illumination level.
CAMC01 9/30/04 3:13 PM Page 19
HUMAN COLOR VISION20
Figure 1.13 Schematic illustration of the encoding of cone signals into opponent-colors signals in the human visual system
CAMC01 9/30/04 3:13 PM Page 20
HUMAN COLOR VISION 21
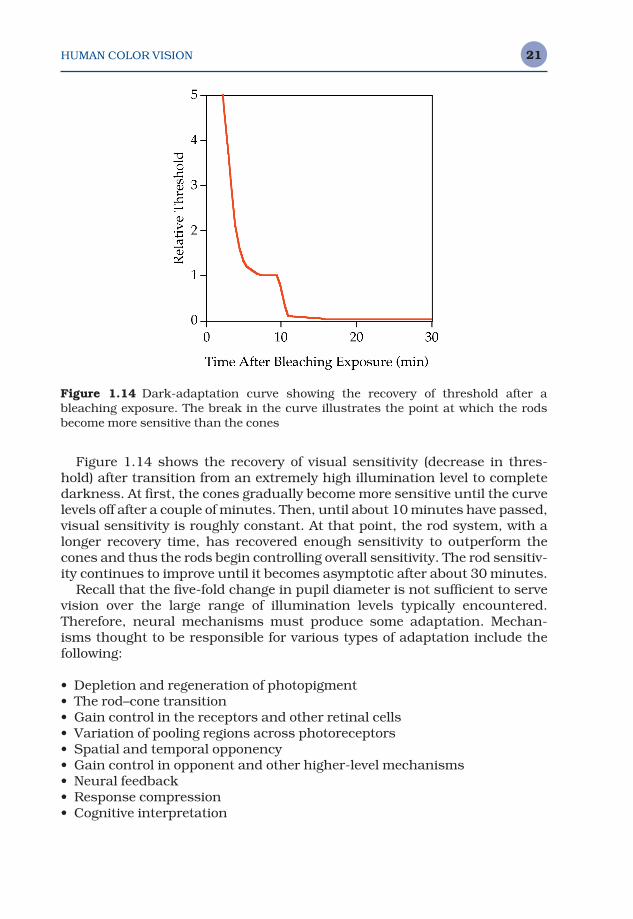
Figure 1.14 shows the recovery of visual sensitivity (decrease in thres-hold) after transition from an extremely high illumination level to completedarkness. At first, the cones gradually become more sensitive until the curve levels off after a couple of minutes. Then, until about 10 minutes have passed,visual sensitivity is roughly constant. At that point, the rod system, with alonger recovery time, has recovered enough sensitivity to outperform thecones and thus the rods begin controlling overall sensitivity. The rod sensitiv-ity continues to improve until it becomes asymptotic after about 30 minutes.
Recall that the five-fold change in pupil diameter is not sufficient to servevision over the large range of illumination levels typically encountered.Therefore, neural mechanisms must produce some adaptation. Mechan-isms thought to be responsible for various types of adaptation include thefollowing:
• Depletion and regeneration of photopigment• The rod–cone transition• Gain control in the receptors and other retinal cells• Variation of pooling regions across photoreceptors• Spatial and temporal opponency• Gain control in opponent and other higher-level mechanisms• Neural feedback• Response compression• Cognitive interpretation
Figure 1.14 Dark-adaptation curve showing the recovery of threshold after ableaching exposure. The break in the curve illustrates the point at which the rodsbecome more sensitive than the cones
CAMC01 9/30/04 3:13 PM Page 21
HUMAN COLOR VISION22
Light Adaptation
Light adaptation is essentially the inverse process of dark adaptation. How-ever, it is important to consider it separately since its visual properties differ.Light adaptation occurs when leaving the darkened theater and returningoutdoors on a sunny afternoon. In this case, the visual system must becomeless sensitive in order to produce useful perceptions since there is signific-antly more visible energy available.
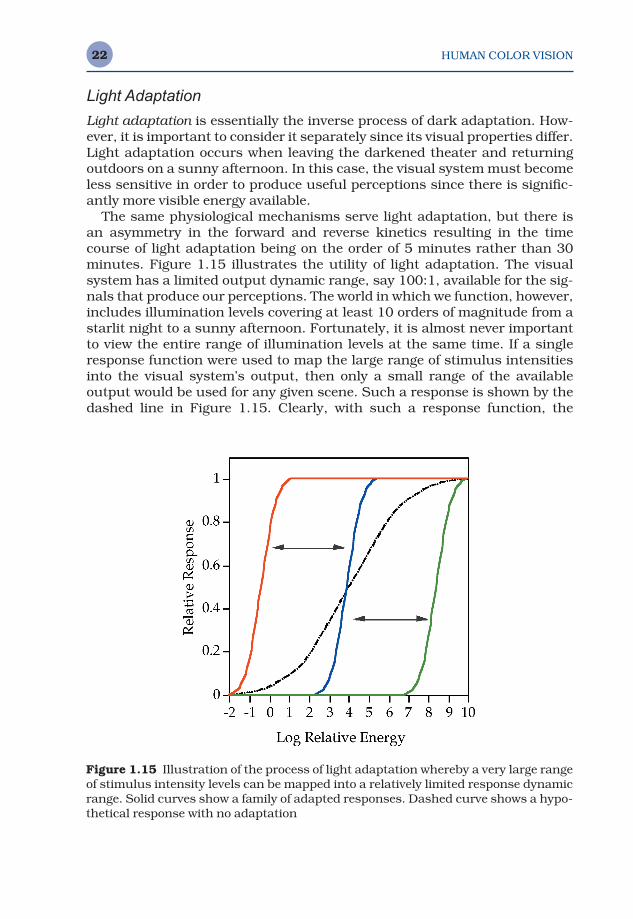
The same physiological mechanisms serve light adaptation, but there isan asymmetry in the forward and reverse kinetics resulting in the timecourse of light adaptation being on the order of 5 minutes rather than 30minutes. Figure 1.15 illustrates the utility of light adaptation. The visualsystem has a limited output dynamic range, say 100:1, available for the sig-nals that produce our perceptions. The world in which we function, however,includes illumination levels covering at least 10 orders of magnitude from astarlit night to a sunny afternoon. Fortunately, it is almost never importantto view the entire range of illumination levels at the same time. If a singleresponse function were used to map the large range of stimulus intensitiesinto the visual system’s output, then only a small range of the available output would be used for any given scene. Such a response is shown by thedashed line in Figure 1.15. Clearly, with such a response function, the
Figure 1.15 Illustration of the process of light adaptation whereby a very large rangeof stimulus intensity levels can be mapped into a relatively limited response dynamicrange. Solid curves show a family of adapted responses. Dashed curve shows a hypo-thetical response with no adaptation
CAMC01 9/30/04 3:13 PM Page 22
HUMAN COLOR VISION 23
perceived contrast of any given scene would be limited and visual sensitivityto changes would be severely degraded due to signal-to-noise issues.
On the other hand, light adaptation serves to produce a family of visualresponse curves as illustrated by the solid lines in Figure 1.15. These curvesmap the useful illumination range in any given scene into the full dynamicrange of the visual output, thus resulting in the best possible visual percep-tion for each situation. Light adaptation can be thought of as the process ofsliding the visual response curve along the illumination level axis in Figure1.15 until the optimum level for the given viewing conditions is reached.Light and dark adaptation can be thought of as analogous to an automaticexposure control in a photographic system.
Chromatic Adaptation
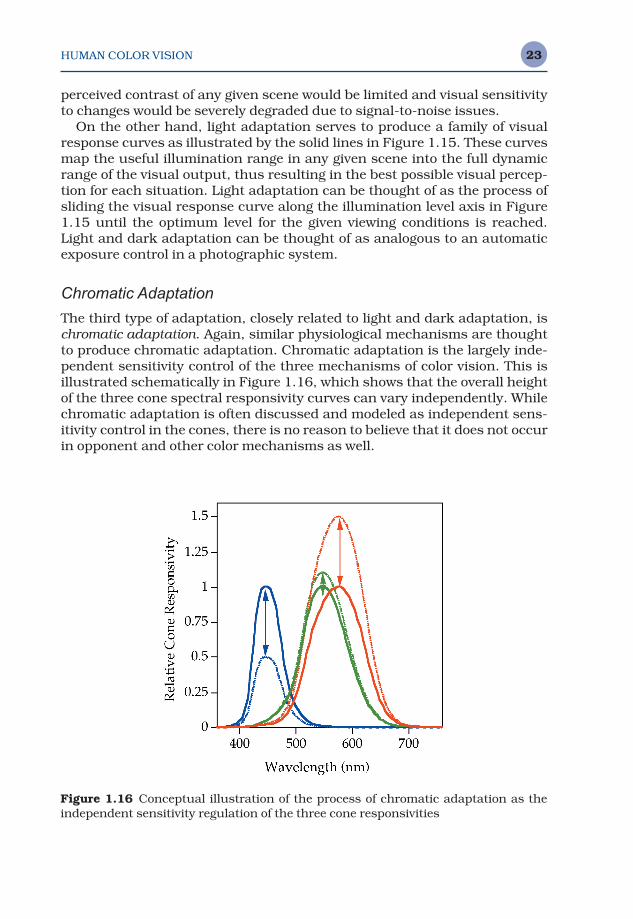
The third type of adaptation, closely related to light and dark adaptation, ischromatic adaptation. Again, similar physiological mechanisms are thoughtto produce chromatic adaptation. Chromatic adaptation is the largely inde-pendent sensitivity control of the three mechanisms of color vision. This isillustrated schematically in Figure 1.16, which shows that the overall heightof the three cone spectral responsivity curves can vary independently. Whilechromatic adaptation is often discussed and modeled as independent sens-itivity control in the cones, there is no reason to believe that it does not occurin opponent and other color mechanisms as well.
Figure 1.16 Conceptual illustration of the process of chromatic adaptation as theindependent sensitivity regulation of the three cone responsivities
CAMC01 9/30/04 3:13 PM Page 23
HUMAN COLOR VISION24
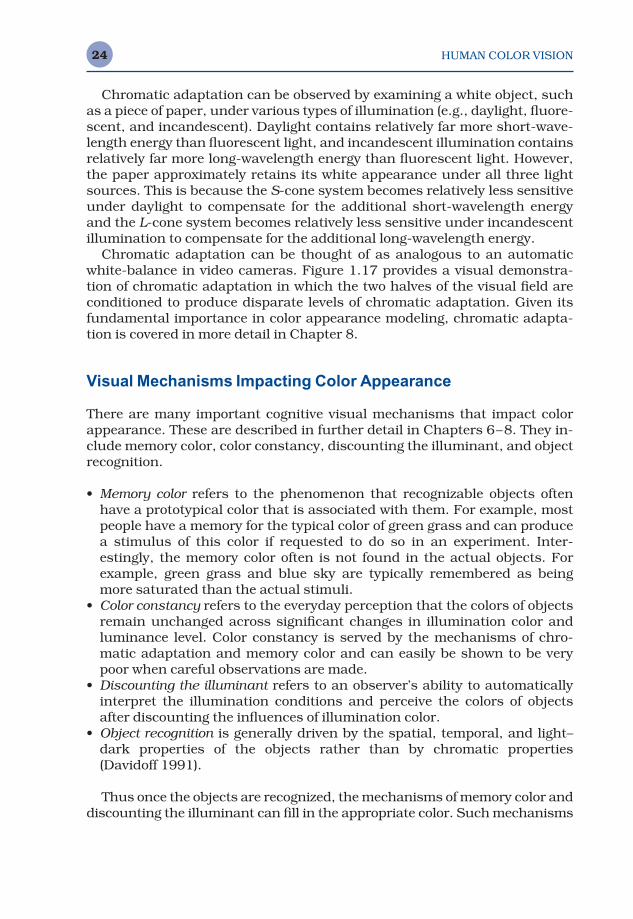
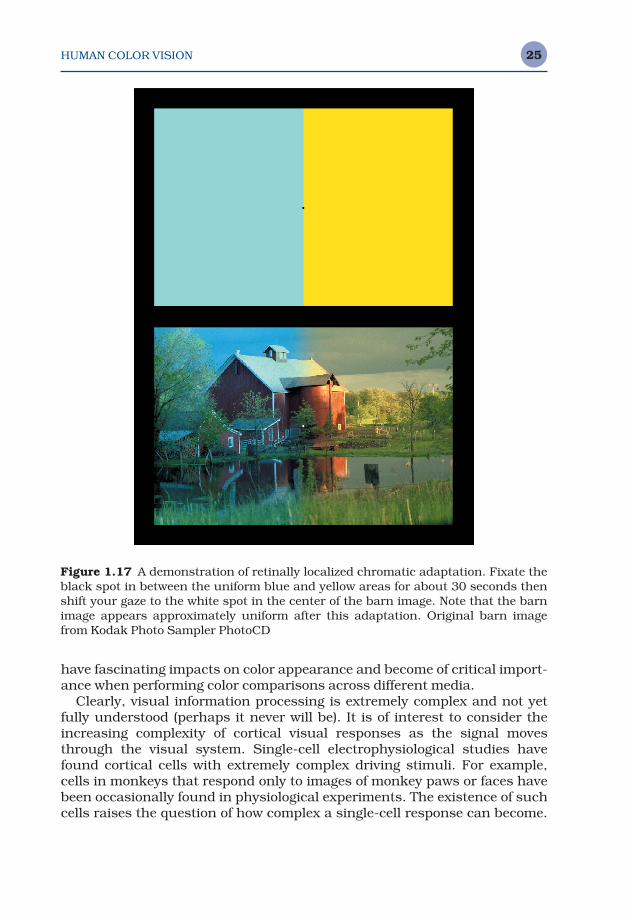
Chromatic adaptation can be observed by examining a white object, suchas a piece of paper, under various types of illumination (e.g., daylight, fluore-scent, and incandescent). Daylight contains relatively far more short-wave-length energy than fluorescent light, and incandescent illumination containsrelatively far more long-wavelength energy than fluorescent light. However,the paper approximately retains its white appearance under all three lightsources. This is because the S-cone system becomes relatively less sensitiveunder daylight to compensate for the additional short-wavelength energyand the L-cone system becomes relatively less sensitive under incandescentillumination to compensate for the additional long-wavelength energy.
Chromatic adaptation can be thought of as analogous to an automaticwhite-balance in video cameras. Figure 1.17 provides a visual demonstra-tion of chromatic adaptation in which the two halves of the visual field areconditioned to produce disparate levels of chromatic adaptation. Given itsfundamental importance in color appearance modeling, chromatic adapta-tion is covered in more detail in Chapter 8.
Visual Mechanisms Impacting Color Appearance
There are many important cognitive visual mechanisms that impact colorappearance. These are described in further detail in Chapters 6–8. They in-clude memory color, color constancy, discounting the illuminant, and objectrecognition.
• Memory color refers to the phenomenon that recognizable objects oftenhave a prototypical color that is associated with them. For example, mostpeople have a memory for the typical color of green grass and can producea stimulus of this color if requested to do so in an experiment. Inter-estingly, the memory color often is not found in the actual objects. Forexample, green grass and blue sky are typically remembered as beingmore saturated than the actual stimuli.
• Color constancy refers to the everyday perception that the colors of objectsremain unchanged across significant changes in illumination color andluminance level. Color constancy is served by the mechanisms of chro-matic adaptation and memory color and can easily be shown to be verypoor when careful observations are made.
• Discounting the illuminant refers to an observer’s ability to automaticallyinterpret the illumination conditions and perceive the colors of objectsafter discounting the influences of illumination color.
• Object recognition is generally driven by the spatial, temporal, and light–dark properties of the objects rather than by chromatic properties(Davidoff 1991).
Thus once the objects are recognized, the mechanisms of memory color anddiscounting the illuminant can fill in the appropriate color. Such mechanisms
CAMC01 9/30/04 3:13 PM Page 24
HUMAN COLOR VISION 25
have fascinating impacts on color appearance and become of critical import-ance when performing color comparisons across different media.
Clearly, visual information processing is extremely complex and not yetfully understood (perhaps it never will be). It is of interest to consider theincreasing complexity of cortical visual responses as the signal movesthrough the visual system. Single-cell electrophysiological studies havefound cortical cells with extremely complex driving stimuli. For example,cells in monkeys that respond only to images of monkey paws or faces havebeen occasionally found in physiological experiments. The existence of suchcells raises the question of how complex a single-cell response can become.
Figure 1.17 A demonstration of retinally localized chromatic adaptation. Fixate theblack spot in between the uniform blue and yellow areas for about 30 seconds thenshift your gaze to the white spot in the center of the barn image. Note that the barnimage appears approximately uniform after this adaptation. Original barn imagefrom Kodak Photo Sampler PhotoCD
CAMC01 9/30/04 3:13 PM Page 25
HUMAN COLOR VISION26
Clearly it is not possible for every perception to have its own cortical cell.Thus, at some point in the visual system, the representation of perceptionsmust be distributed with combinations of various signals producing variousperceptions. Such distributed representations open up the possibilities fornumerous permutations on a given perception, such as color appearance. It is clear from the large number of stimulus variables that impact colorappearance that our visual system is often experimenting with these permutations.
1.5 SPATIAL AND TEMPORAL PROPERTIES OF COLOR VISION
No dimension of visual experience can be considered in isolation. The colorappearance of a stimulus is not independent of its spatial and temporalcharacteristics. For example, a black and white stimulus flickering at anappropriate temporal frequency can be perceived as quite colorful. The spa-tial and temporal characteristics of the human visual system are typicallyexplored through measurement of contrast sensitivity functions. Contrastsensitivity functions (CSFs) in vision science are analogous to modulationtransfer functions (MTFs) in imaging science. However, CSFs cannot legitim-ately be considered MTFs since the human visual system is highly non-linear and CSFs represent threshold sensitivity and not suprathresholdmodulation. A contrast sensitivity function is defined by the thresholdresponse to contrast (sensitivity is the inverse of threshold) as a function ofspatial or temporal frequency. Contrast is typically defined as the differencebetween maximum and minimum luminance in a stimulus divided by thesum of the maximum and minimum luminances, and CSFs are typicallymeasured with stimuli that vary sinusoidally across space or time. Thus auniform pattern has a contrast of zero and sinusoidal patterns with troughsthat reach a luminance of zero have a contrast of 1.0, no matter what theirmean luminance is.
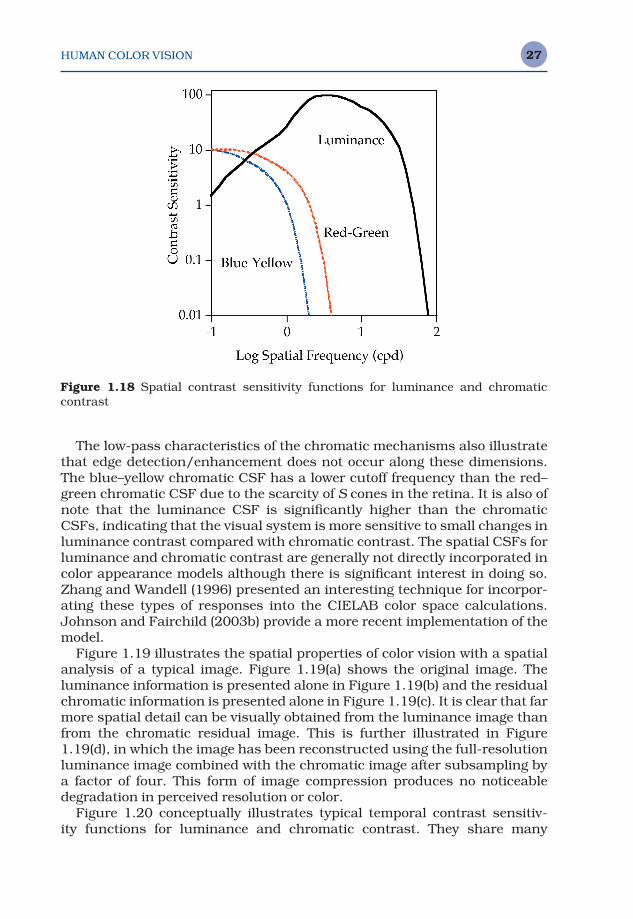
Figure 1.18 conceptually illustrates typical spatial contrast sensitivityfunctions for luminance (black–white) and chromatic (red–green and yellow–blue at constant luminance) contrast. The luminance contrast sensitivityfunction is band-pass in nature, with peak sensitivity around 5 cycles perdegree. This function approaches zero at zero cycles per degree, illustratingthe tendency for the visual system to be insensitive to uniform fields. It alsoapproaches zero at about 60 cycles per degree, the point at which detail canno longer be resolved by the optics of the eye or the photoreceptor mosaic.The band-pass contrast sensitivity function correlates with the concept ofcenter-surround antagonistic receptive fields that would be most sensitiveto an intermediate range of spatial frequency. The chromatic mechanismsare of a low-pass nature and have significantly lower cutoff frequencies. Thisindicates the reduced availability of chromatic information for fine details(high spatial frequencies) that is often taken advantage of in image codingand compression schemes (e.g., NTSC or JPEG).
CAMC01 9/30/04 3:13 PM Page 26
HUMAN COLOR VISION 27
The low-pass characteristics of the chromatic mechanisms also illustratethat edge detection/enhancement does not occur along these dimensions.The blue–yellow chromatic CSF has a lower cutoff frequency than the red–green chromatic CSF due to the scarcity of S cones in the retina. It is also ofnote that the luminance CSF is significantly higher than the chromaticCSFs, indicating that the visual system is more sensitive to small changes inluminance contrast compared with chromatic contrast. The spatial CSFs forluminance and chromatic contrast are generally not directly incorporated incolor appearance models although there is significant interest in doing so.Zhang and Wandell (1996) presented an interesting technique for incorpor-ating these types of responses into the CIELAB color space calculations.Johnson and Fairchild (2003b) provide a more recent implementation of themodel.
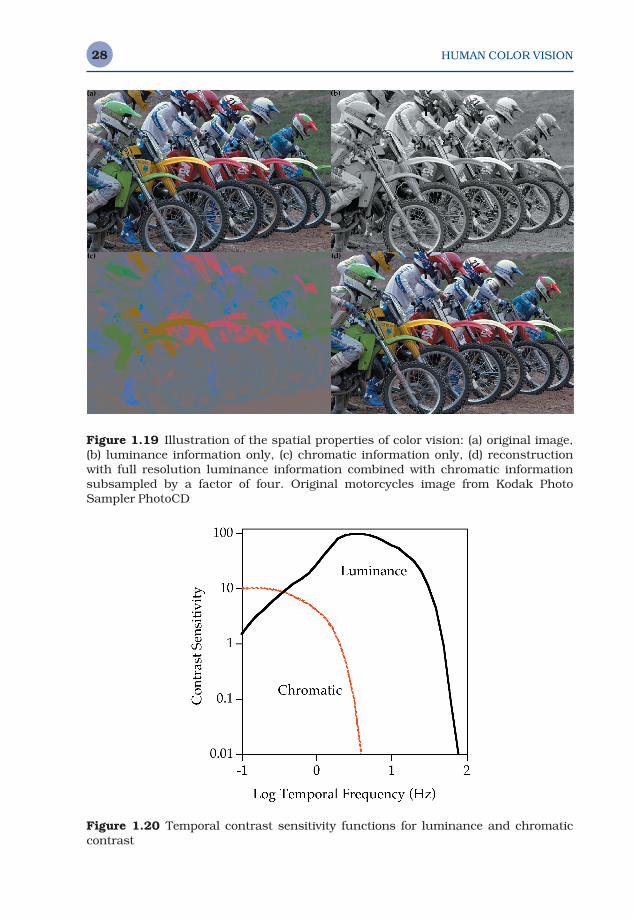
Figure 1.19 illustrates the spatial properties of color vision with a spatialanalysis of a typical image. Figure 1.19(a) shows the original image. Theluminance information is presented alone in Figure 1.19(b) and the residualchromatic information is presented alone in Figure 1.19(c). It is clear that farmore spatial detail can be visually obtained from the luminance image thanfrom the chromatic residual image. This is further illustrated in Figure1.19(d), in which the image has been reconstructed using the full-resolutionluminance image combined with the chromatic image after subsampling bya factor of four. This form of image compression produces no noticeabledegradation in perceived resolution or color.
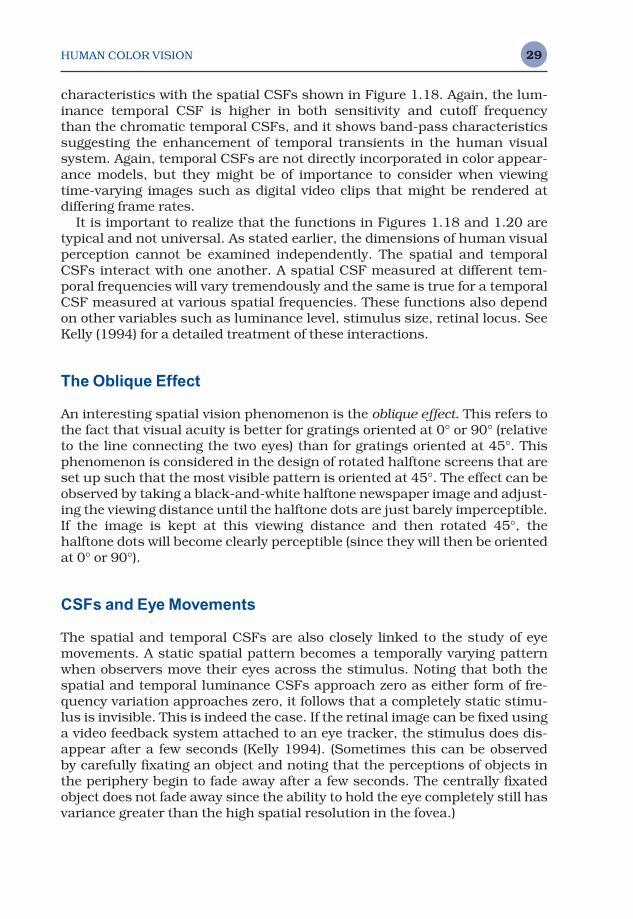
Figure 1.20 conceptually illustrates typical temporal contrast sensitiv-ity functions for luminance and chromatic contrast. They share many
Figure 1.18 Spatial contrast sensitivity functions for luminance and chromatic contrast
CAMC01 9/30/04 3:13 PM Page 27
HUMAN COLOR VISION28
Figure 1.20 Temporal contrast sensitivity functions for luminance and chromaticcontrast
Figure 1.19 Illustration of the spatial properties of color vision: (a) original image, (b) luminance information only, (c) chromatic information only, (d) reconstructionwith full resolution luminance information combined with chromatic informationsubsampled by a factor of four. Original motorcycles image from Kodak PhotoSampler PhotoCD
CAMC01 9/30/04 3:13 PM Page 28
HUMAN COLOR VISION 29
characteristics with the spatial CSFs shown in Figure 1.18. Again, the lum-inance temporal CSF is higher in both sensitivity and cutoff frequency than the chromatic temporal CSFs, and it shows band-pass characteristics suggesting the enhancement of temporal transients in the human visualsystem. Again, temporal CSFs are not directly incorporated in color appear-ance models, but they might be of importance to consider when viewingtime-varying images such as digital video clips that might be rendered at differing frame rates.
It is important to realize that the functions in Figures 1.18 and 1.20 aretypical and not universal. As stated earlier, the dimensions of human visualperception cannot be examined independently. The spatial and temporalCSFs interact with one another. A spatial CSF measured at different tem-poral frequencies will vary tremendously and the same is true for a temporalCSF measured at various spatial frequencies. These functions also dependon other variables such as luminance level, stimulus size, retinal locus. SeeKelly (1994) for a detailed treatment of these interactions.
The Oblique Effect
An interesting spatial vision phenomenon is the oblique effect. This refers tothe fact that visual acuity is better for gratings oriented at 0° or 90° (relativeto the line connecting the two eyes) than for gratings oriented at 45°. Thisphenomenon is considered in the design of rotated halftone screens that areset up such that the most visible pattern is oriented at 45°. The effect can beobserved by taking a black-and-white halftone newspaper image and adjust-ing the viewing distance until the halftone dots are just barely imperceptible.If the image is kept at this viewing distance and then rotated 45°, thehalftone dots will become clearly perceptible (since they will then be orientedat 0° or 90°).
CSFs and Eye Movements
The spatial and temporal CSFs are also closely linked to the study of eyemovements. A static spatial pattern becomes a temporally varying patternwhen observers move their eyes across the stimulus. Noting that both thespatial and temporal luminance CSFs approach zero as either form of fre-quency variation approaches zero, it follows that a completely static stimu-lus is invisible. This is indeed the case. If the retinal image can be fixed usinga video feedback system attached to an eye tracker, the stimulus does dis-appear after a few seconds (Kelly 1994). (Sometimes this can be observed by carefully fixating an object and noting that the perceptions of objects inthe periphery begin to fade away after a few seconds. The centrally fixatedobject does not fade away since the ability to hold the eye completely still hasvariance greater than the high spatial resolution in the fovea.)
CAMC01 9/30/04 3:13 PM Page 29
HUMAN COLOR VISION30
To avoid this rather unpleasant phenomenon in typical viewing, our eyesare constantly moving. Large eye movements take place to allow viewing ofdifferent areas of the visual field with the high-resolution fovea. Also, thereare small constant eye movements that serve to keep the visual world nicelyvisible. This also explains why the shadows of retinal cells and blood vesselsare generally not visible since they do not move on the retina, but rathermove with the retina. The history of eye movements has significant impacton adaptation and appearance through integrated exposure of various ret-inal areas and the need for movements to preserve apparent contrast. Recenttechnological advances have allowed psychophysical investigation of theseeffects (e.g., Babcock et al. 2003).
1.6 COLOR VISION DEFICIENCIES
There are various types of inherited and acquired color vision deficiencies.Kaiser and Boynton (1996) provide a current and comprehensive overview of the topic. This section concentrates on the most common inheriteddeficiencies.
Protanopia, Deuteranopia, and Tritanopia
Some color vision deficiencies are caused by the lack of a particular type ofcone photopigment. Since there are three types of cone photopigments,there are three general classes of these color vision deficiencies, namely pro-tanopia, deuteranopia, and tritanopia. An observer with protanopia, knownas a protanope, is missing the L-cone photopigment and therefore is unableto discriminate reddish and greenish hues since the red–green opponentmechanism cannot be constructed. A deuteranope is missing the M-conephotopigment and therefore also cannot distinguish reddish and greenishhues due to the lack of a viable red–green opponent mechanism. Protanopesand deuteranopes can be distinguished by their relative luminous sensitiv-ity since it is constructed from the summation of different cone types. Theprotanopic luminous sensitivity function is shifted toward shorter wave-lengths. A tritanope is missing the S-cone photopigment and therefore cannotdiscriminate yellowish and bluish hues due to the lack of a yellow–blueopponent mechanism.
Anomalous Trichromacy
There are also anomalous trichromats who have trichromatic vision, but the ability to discriminate particular hues is reduced either due to shifts in the spectral sensitivities of the photopigments or contamination of photo-pigments (e.g., some L-cone photopigment in the M-cones). Among theanomalous trichromats are those with any of the following:
CAMC01 9/30/04 3:13 PM Page 30
HUMAN COLOR VISION 31
• Protanomaly (weak in L-cone photopigment or L-cone absorption shiftedtoward shorter wavelengths)
• Deuteranomaly (weak in M-cone photopigment or M-cone absorptionshifted toward longer wavelengths)
• Tritanomaly (weak in S-cone photopigment or S-cone absorption shiftedtoward longer wavelengths).
There are also some cases of cone monochromatism (effectively only onecone type) and rod monochromatism (no cone responses).
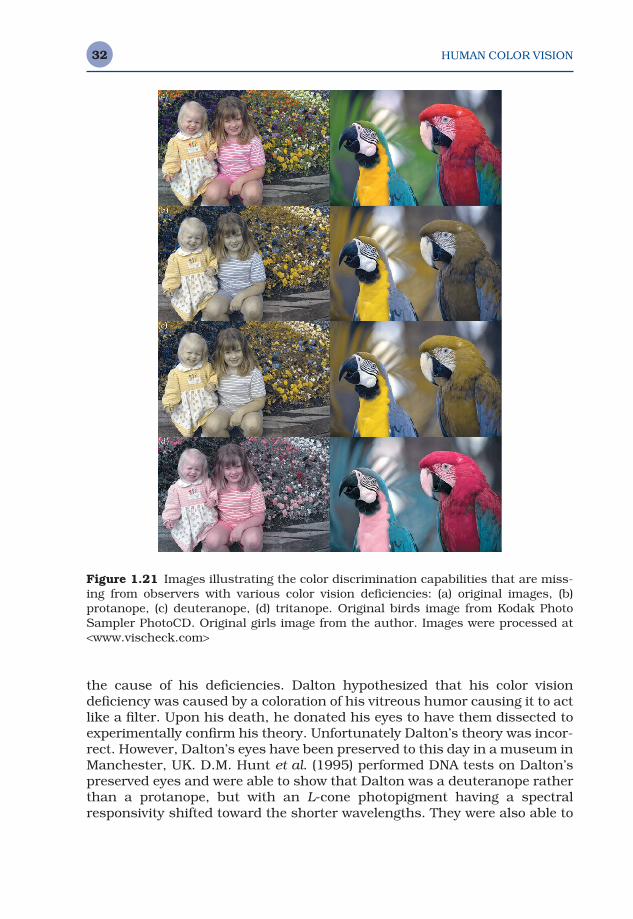
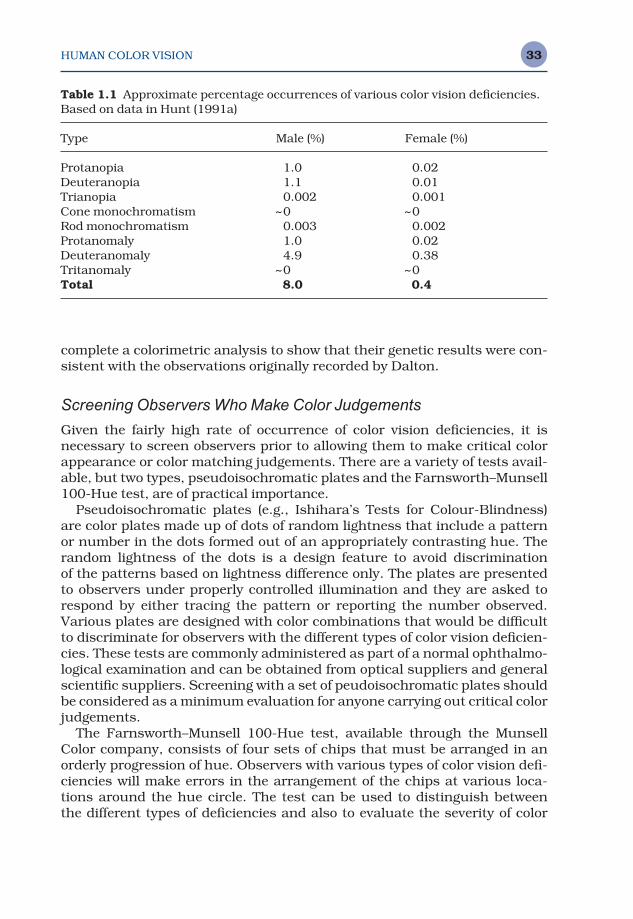
While it is impossible for a person with normal color vision to experiencewhat the visual world looks like to a person with a color vision deficiency, itis possible to illustrate the hues that become indistinguishable. Figure 1.21provides such a demonstration. To produce Figure 1.21, the two color-normalimages (Figure 1.21a) processed according to a simulation algorithm pub-lished by Brettel et al. (1997) as implemented at <www.vischeck.com> togenerate the images. This allows an illustration of the various colors thatwould be confused by protanopes, deuteranopes, and tritanopes. The studyof color vision deficiencies is of more than academic interest in the field ofcolor appearance modeling and color reproduction. This is illustrated inTable 1.1 showing the approximate percentages of the population with vari-ous types of color vision deficiencies.
It is clear from Table 1.1 that color deficiencies are not extremely rare, par-ticularly in the male population (about 8%) and that it might be important toaccount for the possibility of color deficient observers in many applications.
Color Vision Deficiencies and Gender
Why the disparity between the occurrence of color vision deficiencies inmales and females? This can be traced back to the genetic basis of colorvision deficiencies. It turns out that the most common forms of color visiondeficiencies are sex-linked genetic traits.
The genes for photopigments are present on the X chromosome. Femalesinherit one X chromosome from their mother and one from their father. Onlyone of these need have the genes for the normal photopigments in order toproduce normal color vision. On the other hand, males inherit an X chromo-some from their mother and a Y chromosome from their father. If the single Xchromosome does not include the genes for the photopigments, the son willhave a color vision deficiency. If a female is color deficient, it means she hastwo deficient X chromosomes and all male children are destined to have acolor vision deficiency. It is clear that the genetic ‘deck of cards’ is stackedagainst males when it comes to inheriting deficient color vision.
Knowledge regarding the genetic basis of color vision has grown tremend-ously in recent years. John Dalton was an early investigator of deficient colorvision. He studied his own vision, which to was formerly thought to havebeen protanopic based on his observations, and came up with a theory as to
CAMC01 9/30/04 3:13 PM Page 31
HUMAN COLOR VISION32
the cause of his deficiencies. Dalton hypothesized that his color visiondeficiency was caused by a coloration of his vitreous humor causing it to actlike a filter. Upon his death, he donated his eyes to have them dissected toexperimentally confirm his theory. Unfortunately Dalton’s theory was incor-rect. However, Dalton’s eyes have been preserved to this day in a museum inManchester, UK. D.M. Hunt et al. (1995) performed DNA tests on Dalton’spreserved eyes and were able to show that Dalton was a deuteranope ratherthan a protanope, but with an L-cone photopigment having a spectralresponsivity shifted toward the shorter wavelengths. They were also able to
Figure 1.21 Images illustrating the color discrimination capabilities that are miss-ing from observers with various color vision deficiencies: (a) original images, (b)protanope, (c) deuteranope, (d) tritanope. Original birds image from Kodak PhotoSampler PhotoCD. Original girls image from the author. Images were processed at<www.vischeck.com>
CAMC01 9/30/04 3:13 PM Page 32
HUMAN COLOR VISION 33
complete a colorimetric analysis to show that their genetic results were con-sistent with the observations originally recorded by Dalton.
Screening Observers Who Make Color Judgements
Given the fairly high rate of occurrence of color vision deficiencies, it is necessary to screen observers prior to allowing them to make critical colorappearance or color matching judgements. There are a variety of tests avail-able, but two types, pseudoisochromatic plates and the Farnsworth–Munsell100-Hue test, are of practical importance.
Pseudoisochromatic plates (e.g., Ishihara’s Tests for Colour-Blindness)are color plates made up of dots of random lightness that include a patternor number in the dots formed out of an appropriately contrasting hue. Therandom lightness of the dots is a design feature to avoid discrimination of the patterns based on lightness difference only. The plates are presentedto observers under properly controlled illumination and they are asked torespond by either tracing the pattern or reporting the number observed.Various plates are designed with color combinations that would be difficultto discriminate for observers with the different types of color vision deficien-cies. These tests are commonly administered as part of a normal ophthalmo-logical examination and can be obtained from optical suppliers and generalscientific suppliers. Screening with a set of peudoisochromatic plates shouldbe considered as a minimum evaluation for anyone carrying out critical colorjudgements.
The Farnsworth–Munsell 100-Hue test, available through the MunsellColor company, consists of four sets of chips that must be arranged in anorderly progression of hue. Observers with various types of color vision defi-ciencies will make errors in the arrangement of the chips at various loca-tions around the hue circle. The test can be used to distinguish between the different types of deficiencies and also to evaluate the severity of color
Table 1.1 Approximate percentage occurrences of various color vision deficiencies.Based on data in Hunt (1991a)
Type Male (%) Female (%)
Protanopia 1.0 0.02Deuteranopia 1.1 0.01Trianopia 0.002 0.001Cone monochromatism ~0 ~0Rod monochromatism 0.003 0.002Protanomaly 1.0 0.02Deuteranomaly 4.9 0.38Tritanomaly ~0 ~0Total 8.0 0.4
CAMC01 9/30/04 3:13 PM Page 33
HUMAN COLOR VISION34
discrimination problems. This test can also be used to identify observerswith normal color vision, but poor color discrimination for all colors.
1.7 KEY FEATURES FOR COLOR APPEARANCE MODELING
This chapter provides a necessarily brief overview of the form and function ofthe human visual system, concentrating on the features that are importantin the study, modeling, and prediction of color appearance phenomena.What follows is a short review of the key features.
Important features in the optics of the eye include the lens, macula, andcone photoreceptors. The lens and macula impact color matching throughtheir action as yellow filters. They impact inter-observer variability sincetheir optical density varies significantly from person to person. The conesserve as the first stage of color vision, transforming the spectral power distri-bution on the retina into a three-dimensional signal that defines what isavailable for processing at higher levels in the visual system. This is thebasis of metamerism, the fundamental governing principle of colorimetry.
The numerical distribution of the cones (L:M:S of about 12:6:1) is import-ant in constructing the opponent signals present in the visual system.Proper modeling of these steps requires the ratios to be accounted for appro-priately. The spatial distribution of rods and cones and their lateral inter-actions are critical in the specification of stimulus size and retinal locus. Acolor appearance model for stimuli viewed in the fovea would be differentfrom one for peripheral stimuli. The spatial interaction in the retina, repres-ented by horizontal and amacrine cells, is critical for mechanisms that pro-duce color appearance effects due to changes in background, surround, andlevel of adaptation.
The encoding of color information through the opponent channels alongwith the adaptation mechanisms before, during, and after this stage are per-haps the most important feature of the human visual system that must beincorporated into color appearance models. Each such model incorporates achromatic adaptation stage, an opponent processing stage, and nonlinearresponse functions. Some models also incorporate light and dark adaptationeffects and interactions between the rod and cone systems.
Lastly, the cognitive mechanisms of vision such as memory color and dis-counting the illuminant have a profound impact on color appearance. Theseand other color appearance phenomena are described in greater detail inChapters 6–8.
CAMC01 9/30/04 3:13 PM Page 34