Embed Size (px)
Citation preview

1
GEPCOGEPCO
2nd WORKSHOP ONPOWER SECTOR REFORMS
November 11 & 12, 2010

22
Dist.Sargodha
3
MULTAN
MULTAN
M/GARH
ROUSCH P/H
500KV G/S
GATTI
500KV G/S
LAHORE (SHEIKHUPRA)
500KV G/S
NEW GHAKHAR (NOKHAR)
500KV G/S
RAWAT
GHAZIBROTHA P/HOUSE
TARBELA P/HOUSE
500KV G/S
SH: MOHAMMADI PESHAWAR
500KV GRIDS & TRANSMISSION LINES
4
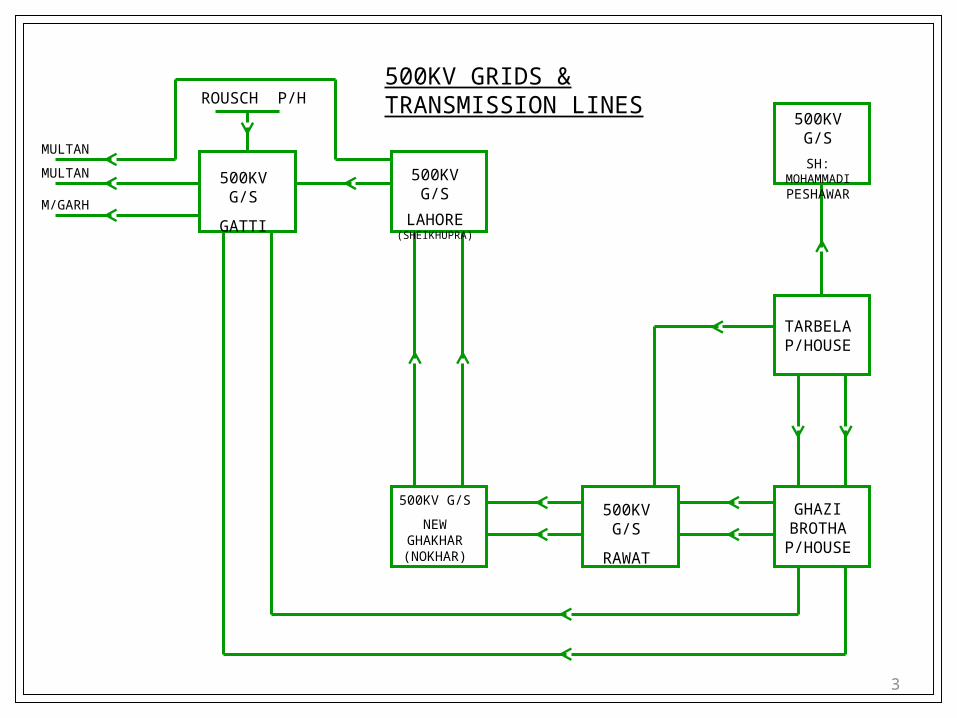
REWAT-1
GEPCO NTDC SOURCES
500KV GSS GHAKHAR(NOKHAR)
03 No. 600MVA, 500/220KV POWER T/Fs
03 No. 160MVA (EACH) 220/132KV POWER T/Fs
LAHORE (Shp)
LAHORE (Shp)
500K
V C
IRC
UIT
S
HAFIZABAD 220KV GSS GHAKHAR 04 No. 160MVA,
220/132KV POWER T/Fs
132KV GSS FATEHPUR
MANGLA GHAKHAR220KV CIRCUITS
132KV CIRCUITS
FU
TU
RE
SHAHEENABAD-1
SHAHEENABAD-2
HAFIZABAD AROOP-1
AROOP-2
GRW CANTT
AWAN CHOWK GRW
Q.D. SINGH
MANGLA
220K
V C
IRC
UIT
S
220KV GSS SAHUWALA(SIALKOT)
03 No. 160MVA, 220/132KV POWER T/Fs
220KV CIRCUITS
NEW SIALKOT
132KV GSS DASKA IND.
GUJRAT-1
132KV GSS WAZIRABAD
132KV GSS SAMBRIAL
220KV GSS K.S KAKU 03 No. 160MVA,
220/132KV POWER T/Fs
GHUINKI
KOLI LOHARAN
KOLI LOHARAN
P/ROAD SIALKOT
THERI SANSI
KAMOKI
BADHOMALHI VIA NARANG
MANGLA
MANGLA
RAVI
RAVI
GATT-1
GATT-1
BAND ROAD
REWAT-2
MA
NG
LA
MA
NG
LA
MA
NG
LA
132KV
CIR
CU
ITS
RAWATMANGLA
MANGLA
Note:-•225 MW HUBCO (Narowal) Power House is expected in circuit during Nov-2010 to Mar-2011. It will give relief to 220KV Sahuwala & 220KV Kala Shah Kaku G/Stations.•425 MW Nandipur Power House is expected circuit during Dec-2010 to Mar-2011. It will give relief to 220KV Ghakhar G/Station•Hence there will be no constraint on 220/132 KV system in GEPCO.
5
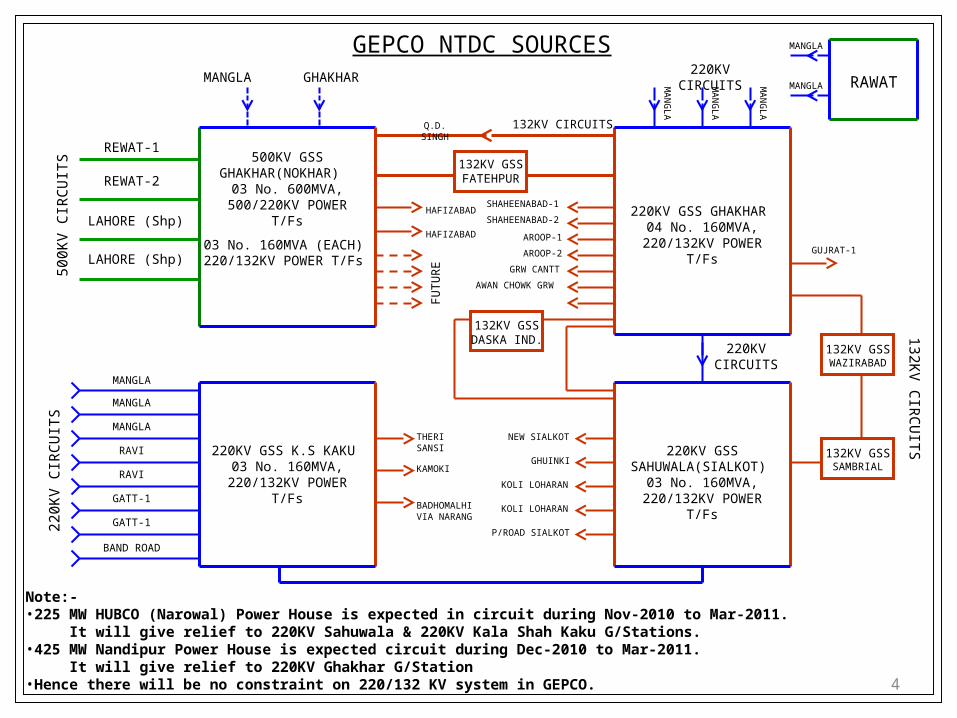
As on30-09-2010
Grid Stations• 500/220/132/11KV Grid 01 No• 220/132/11KV Grids 02 Nos• 132/11 KV Grids 41 Nos• 66/11 KV Grids 08 Nos
Total 52 Nos
Power Transformers *124(2870 MVA)
* 4 No P.T/Fs 132/66 KV not included Secondary Transmission Lines
• 132 KV Lines (Circuit Wise) 1669 KM• 66 KV Lines (Circuit Wise) 335 KM
Total 2004 KM Distribution Lines
• 11 KV or HT Feeders 625 Nos• Length of HT Lines 19870 KM•Length of LT Lines 16801 KM
Distribution Transformers 48799 Nos(3027 MVA)
GEPCO SECONDARY TRANSMISSION AND
DISTRIBUTION SYSTEM
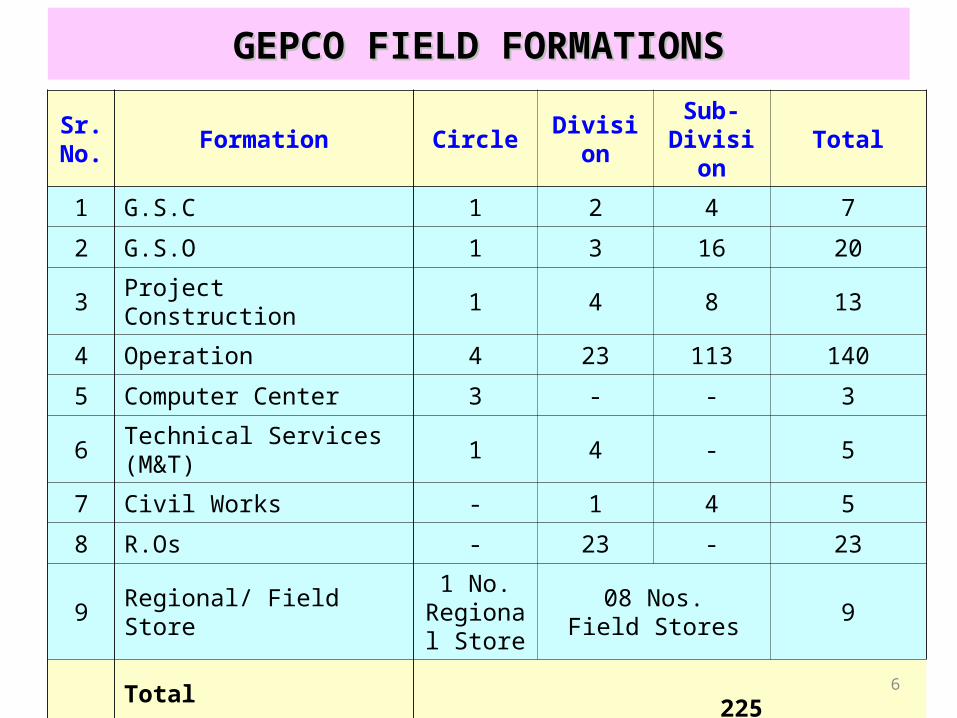
GEPCO FIELD FORMATIONSGEPCO FIELD FORMATIONS
Sr.No.
Formation CircleDivisio
n
Sub-Divisio
nTotal
1 G.S.C 1 2 4 7
2 G.S.O 1 3 16 20
3 Project Construction 1 4 8 13
4 Operation 4 23 113 140
5 Computer Center 3 - - 3
6Technical Services (M&T)
1 4 - 5
7 Civil Works - 1 4 5
8 R.Os - 23 - 23
9 Regional/ Field Store1 No.
Regional Store
08 Nos.Field Stores
9
Total 225
10 Officers Sanctioned-399/Actual-303
11 Officials Sanctioned-15,921/Actual-13,4006
7
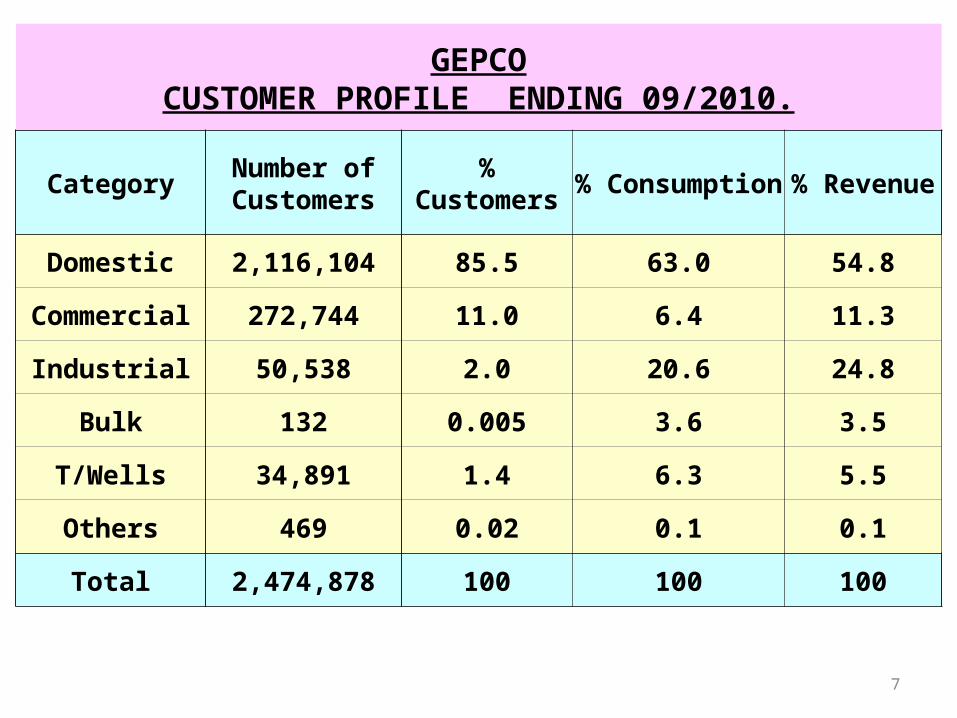
GEPCOCUSTOMER PROFILE ENDING 09/2010.
CategoryNumber of Customers
% Customers
% Consumption
% Revenue
Domestic 2,116,104 85.5 63.0 54.8
Commercial 272,744 11.0 6.4 11.3
Industrial 50,538 2.0 20.6 24.8
Bulk 132 0.005 3.6 3.5
T/Wells 34,891 1.4 6.3 5.5
Others 469 0.02 0.1 0.1
Total 2,474,878 100 100 100
8
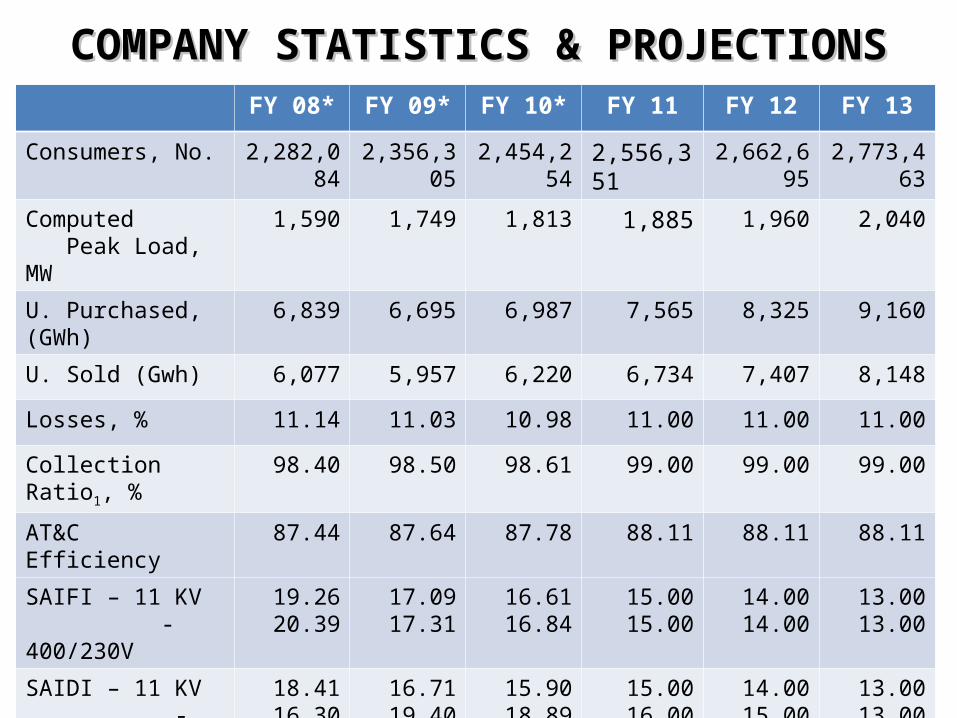
COMPANY STATISTICS & PROJECTIONSCOMPANY STATISTICS & PROJECTIONSFY 08* FY 09* FY 10* FY 11 FY 12 FY 13
Consumers, No. 2,282,084 2,356,305 2,454,254 2,556,351 2,662,695 2,773,463
Computed Peak Load, MW
1,590 1,749 1,813 1,885 1,960 2,040
U. Purchased, (GWh) 6,839 6,695 6,987 7,565 8,325 9,160
U. Sold (Gwh) 6,077 5,957 6,220 6,734 7,407 8,148
Losses, % 11.14 11.03 10.98 11.00 11.00 11.00
Collection Ratio1, % 98.40 98.50 98.61 99.00 99.00 99.00
AT&C Efficiency 87.44 87.64 87.78 88.11 88.11 88.11
SAIFI – 11 KV - 400/230V
19.2620.39
17.0917.31
16.6116.84
15.0015.00
14.0014.00
13.0013.00
SAIDI – 11 KV - 400/230V
18.4116.30
16.7119.40
15.9018.89
15.0016.00
14.0015.00
13.0013.00
9
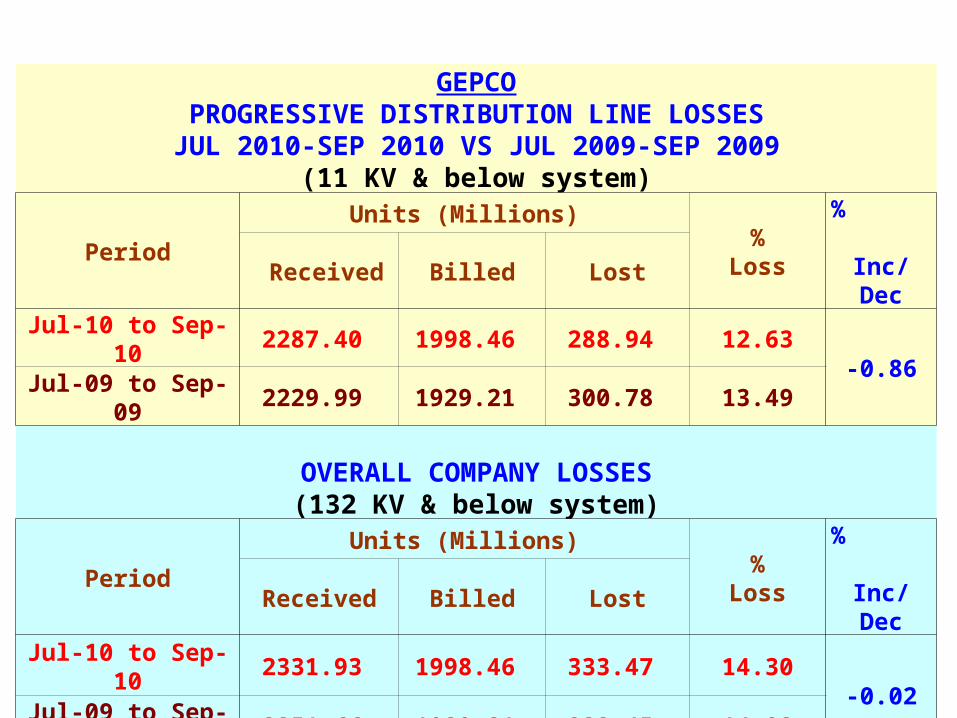
GEPCOPROGRESSIVE DISTRIBUTION LINE LOSSESJUL 2010-SEP 2010 VS JUL 2009-SEP 2009
(11 KV & below system)
PeriodUnits (Millions) %
Loss
% Inc/Dec Received Billed Lost
Jul-10 to Sep-10 2287.40 1998.46 288.94 12.63-0.86
Jul-09 to Sep-09 2229.99 1929.21 300.78 13.49
OVERALL COMPANY LOSSES(132 KV & below system)
PeriodUnits (Millions) %
Loss
% Inc/DecReceived Billed Lost
Jul-10 to Sep-10 2331.93 1998.46 333.47 14.30-0.02
Jul-09 to Sep-09 2251.66 1929.21 322.45 14.32
10
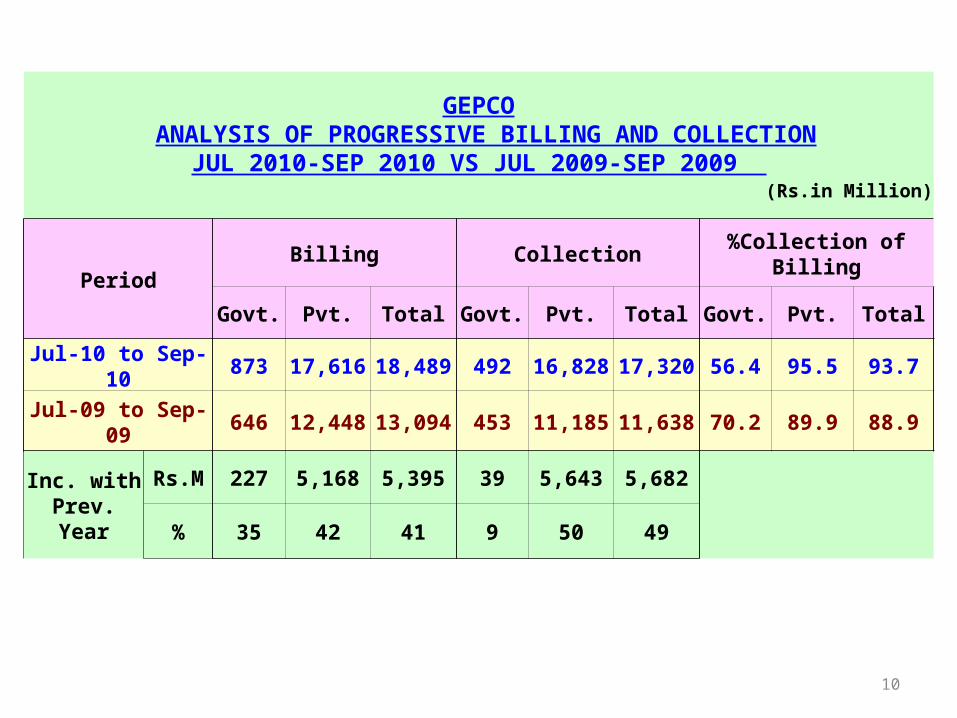
GEPCO ANALYSIS OF PROGRESSIVE BILLING AND COLLECTION
JUL 2010-SEP 2010 VS JUL 2009-SEP 2009 (Rs.in Million)
PeriodBilling Collection
%Collection of Billing
Govt. Pvt. Total Govt. Pvt. Total Govt. Pvt. Total
Jul-10 to Sep-10
873 17,61618,489 492 16,82817,320 56.4 95.5 93.7
Jul-09 to Sep-09
646 12,44813,094 453 11,18511,638 70.2 89.9 88.9
Inc. with Prev. Year
Rs.M 227 5,168 5,395 39 5,643 5,682
% 35 42 41 9 50 49
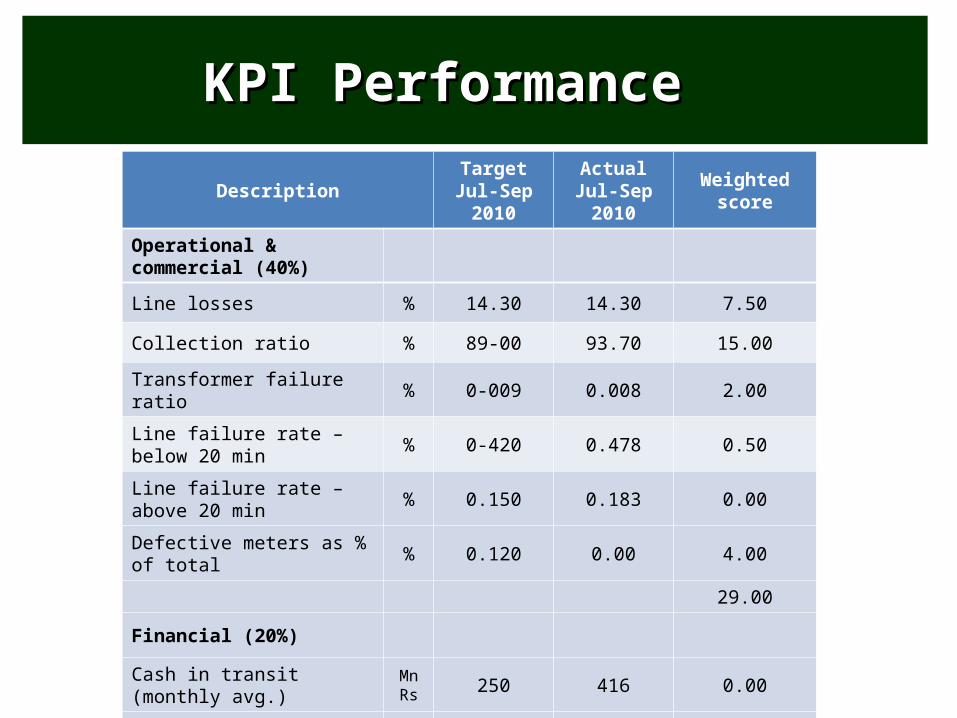
KPI Performance KPI Performance
Description TargetJul-Sep 2010
ActualJul-Sep 2010 Weighted score
Operational & commercial (40%)
Line losses % 14.30 14.30 7.50
Collection ratio % 89-00 93.70 15.00
Transformer failure ratio % 0-009 0.008 2.00
Line failure rate – below 20 min % 0-420 0.478 0.50
Line failure rate – above 20 min % 0.150 0.183 0.00
Defective meters as % of total % 0.120 0.00 4.00
29.00
Financial (20%)
Cash in transit (monthly avg.) Mn Rs 250 416 0.00
O&M expenses Rs./Kwh Rs 0.503 0.453 8.00
8.00
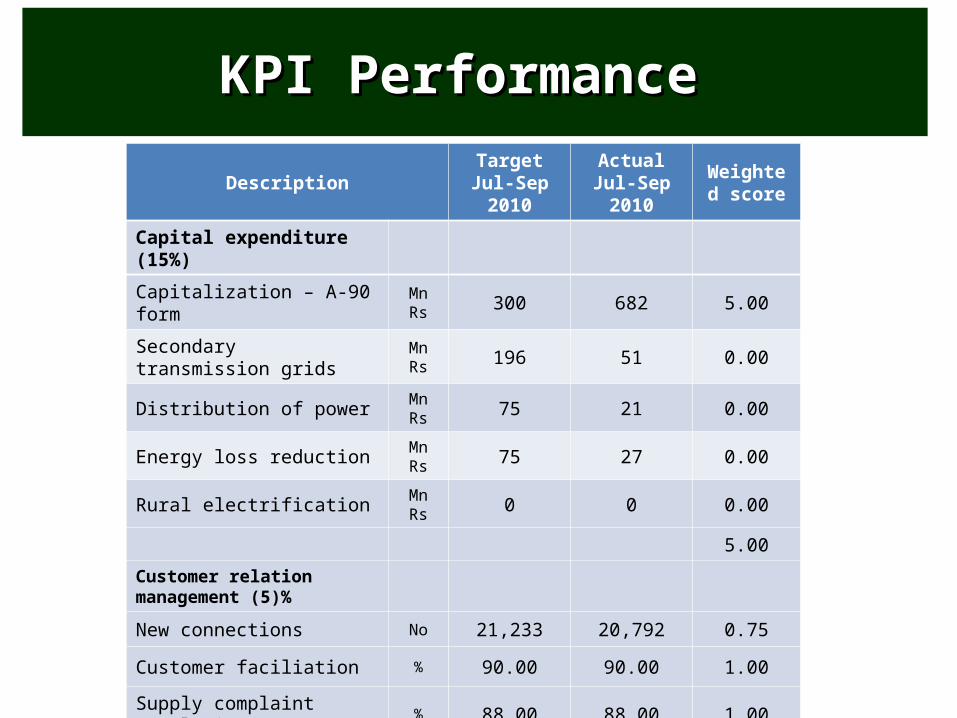
KPI Performance KPI Performance
Description TargetJul-Sep 2010
ActualJul-Sep 2010
Weighted score
Capital expenditure (15%)
Capitalization – A-90 form Mn Rs 300 682 5.00
Secondary transmission grids Mn Rs 196 51 0.00
Distribution of power Mn Rs 75 21 0.00
Energy loss reduction Mn Rs 75 27 0.00
Rural electrification Mn Rs 0 0 0.00
5.00
Customer relation management (5)%
New connections No 21,233 20,792 0.75
Customer faciliation % 90.00 90.00 1.00
Supply complaint resolution % 88.00 88.00 1.00
Billing complaint resolution % 8900 89.00 2.00
4.75
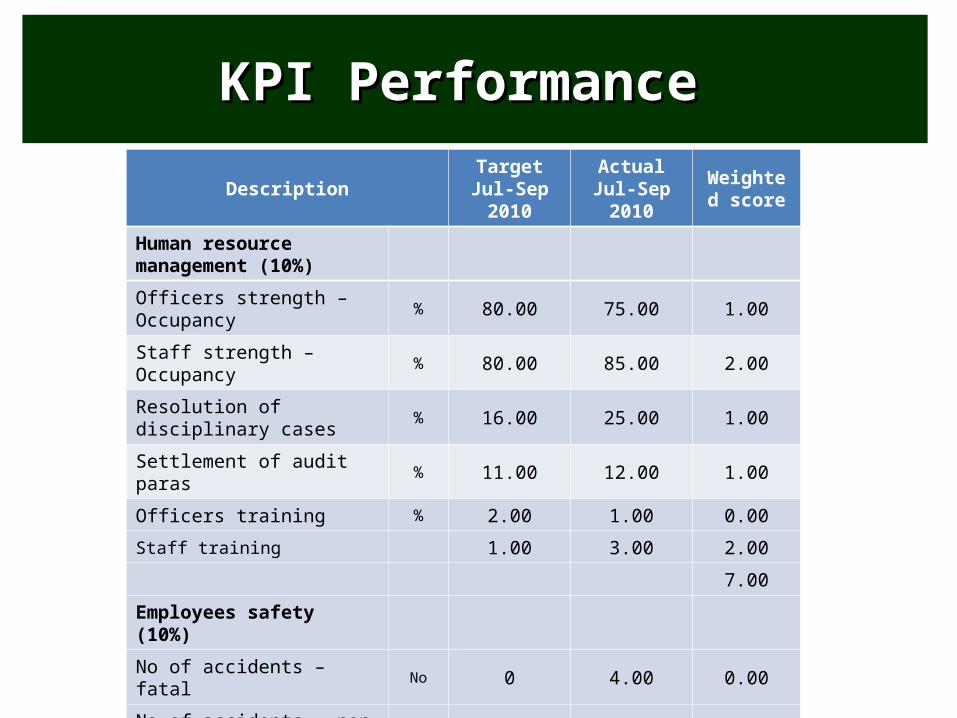
KPI Performance KPI Performance
Description TargetJul-Sep 2010
ActualJul-Sep 2010
Weighted score
Human resource management (10%)
Officers strength – Occupancy % 80.00 75.00 1.00
Staff strength – Occupancy % 80.00 85.00 2.00
Resolution of disciplinary cases % 16.00 25.00 1.00
Settlement of audit paras % 11.00 12.00 1.00
Officers training % 2.00 1.00 0.00
Staff training 1.00 3.00 2.00
7.00
Employees safety (10%)
No of accidents – fatal No 0 4.00 0.00
No of accidents – non fatal No 8 1.00 4.00
4.00
TOTAL 57.75
14
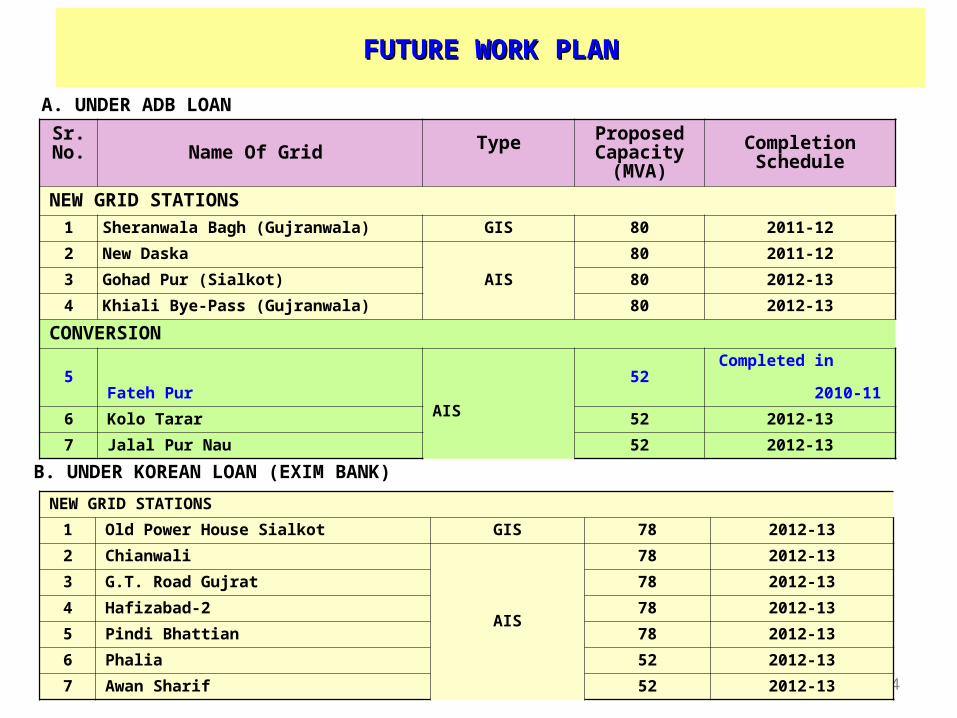
FUTURE WORK PLANFUTURE WORK PLAN
Sr.No. Name Of Grid Type Proposed
Capacity(MVA)
Completion Schedule
NEW GRID STATIONS1 Sheranwala Bagh (Gujranwala) GIS 80 2011-12
2 New Daska
AIS
80 2011-12
3 Gohad Pur (Sialkot) 80 2012-13
4 Khiali Bye-Pass (Gujranwala) 80 2012-13
CONVERSION
5Fateh Pur
AIS
52Completed in
2010-11
6 Kolo Tarar 52 2012-13
7 Jalal Pur Nau 52 2012-13
A. UNDER ADB LOAN
NEW GRID STATIONS
1 Old Power House Sialkot GIS 78 2012-13
2 Chianwali
AIS
78 2012-13
3 G.T. Road Gujrat 78 2012-13
4 Hafizabad-2 78 2012-13
5 Pindi Bhattian 78 2012-13
6 Phalia 52 2012-13
7 Awan Sharif 52 2012-13
B. UNDER KOREAN LOAN (EXIM BANK)
15
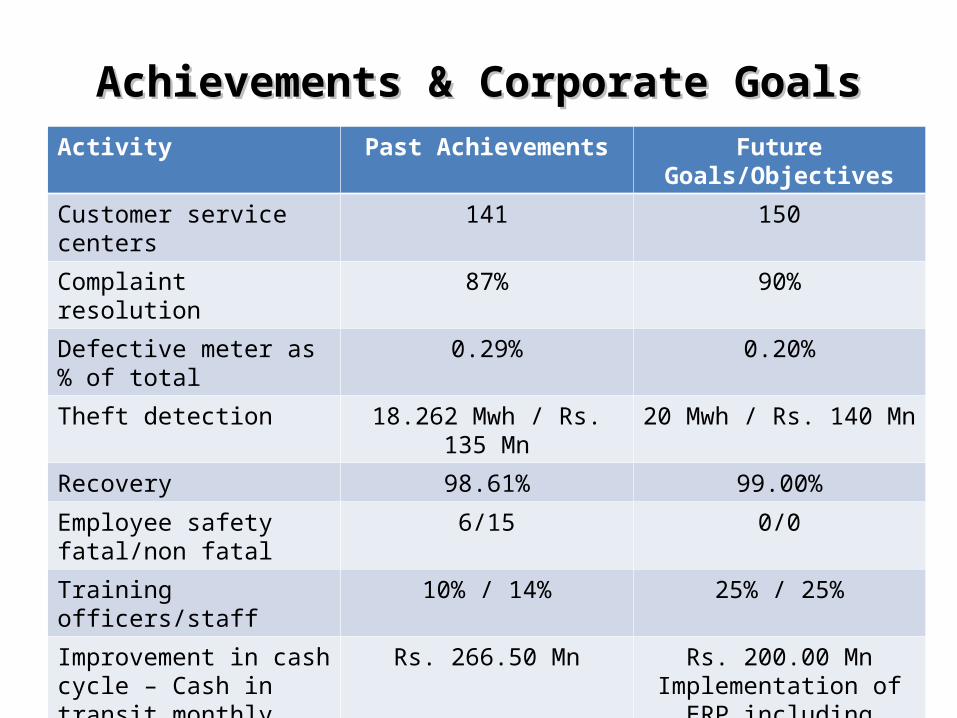
Achievements & Corporate GoalsAchievements & Corporate GoalsActivity Past Achievements Future Goals/Objectives
Customer service centers 141 150
Complaint resolution 87% 90%
Defective meter as % of total
0.29% 0.20%
Theft detection 18.262 Mwh / Rs. 135 Mn 20 Mwh / Rs. 140 Mn
Recovery 98.61% 99.00%
Employee safety fatal/non fatal
6/15 0/0
Training officers/staff 10% / 14% 25% / 25%
Improvement in cash cycle – Cash in transit monthly average
Rs. 266.50 Mn Rs. 200.00 MnImplementation of ERP including customer care
and billing solutions
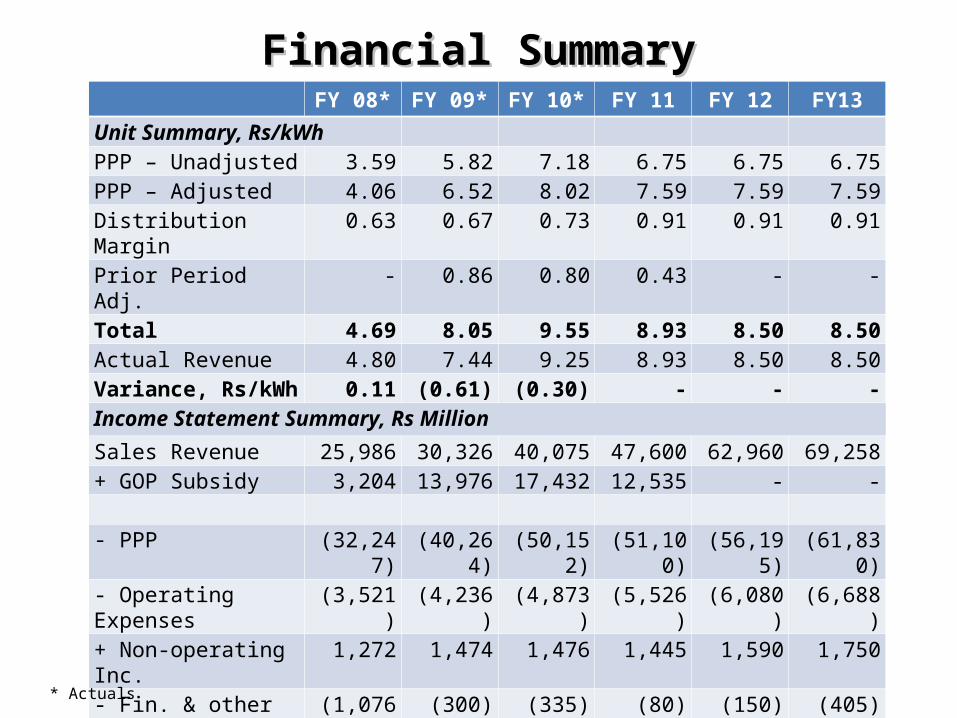
Financial SummaryFinancial SummaryFY 08* FY 09* FY 10* FY 11 FY 12 FY13
Unit Summary, Rs/kWhPPP – Unadjusted 3.59 5.82 7.18 6.75 6.75 6.75PPP – Adjusted 4.06 6.52 8.02 7.59 7.59 7.59Distribution Margin 0.63 0.67 0.73 0.91 0.91 0.91Prior Period Adj. - 0.86 0.80 0.43 - -Total 4.69 8.05 9.55 8.93 8.50 8.50Actual Revenue 4.80 7.44 9.25 8.93 8.50 8.50Variance, Rs/kWh 0.11 (0.61) (0.30) - - -Income Statement Summary, Rs MillionSales Revenue 25,986 30,326 40,075 47,600 62,960 69,258+ GOP Subsidy 3,204 13,976 17,432 12,535 - -
- PPP (32,247) (40,264) (50,152) (51,100) (56,195) (61,830)- Operating Expenses (3,521) (4,236) (4,873) (5,526) (6,080) (6,688)+ Non-operating Inc. 1,272 1,474 1,476 1,445 1,590 1,750- Fin. & other Exp. (1,076) (300) (335) (80) (150) (405)= EBT (6,382) 975 3,623 4,874 2,125 2,085-Taxes 42 (541) 523 - - -= Net Income (6,340) 434 4,146 4,874 2,125 2,085
* Actuals

17