Embed Size (px)
Citation preview
1
FOOD SOURCESFOOD SOURCES
NUTRIENT
DENSITY:
click here
2
There are 28 slidesIn this program. Click with your mouse, to move on the next slide.
Be sure to read and understand each slide before you move on….
3
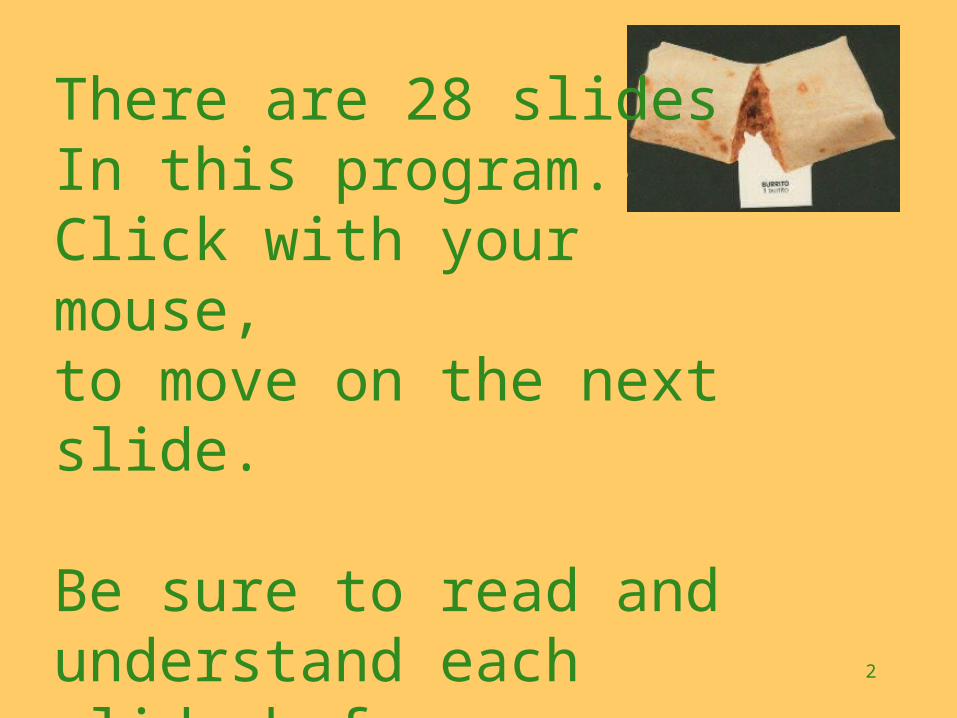
WHAT IS NUTRIENTDENSITY?
Simply said: Comparison of nutrient content to caloric content In other words, how much nutrient is present in
how many calories?
4
One way to evaluateNUTRIENTDENSITY
In this assignment You will compare % Daily Values
of nutrients to % Daily Value of calories
5
Remember: There is a LIMITATION TO
AM’T OF CALORIES To maintain weight, calories in
must equal calories out…..
6
WITH TOO MANY CALORIES
you gain weight….. SO you are limited on
calories.
7
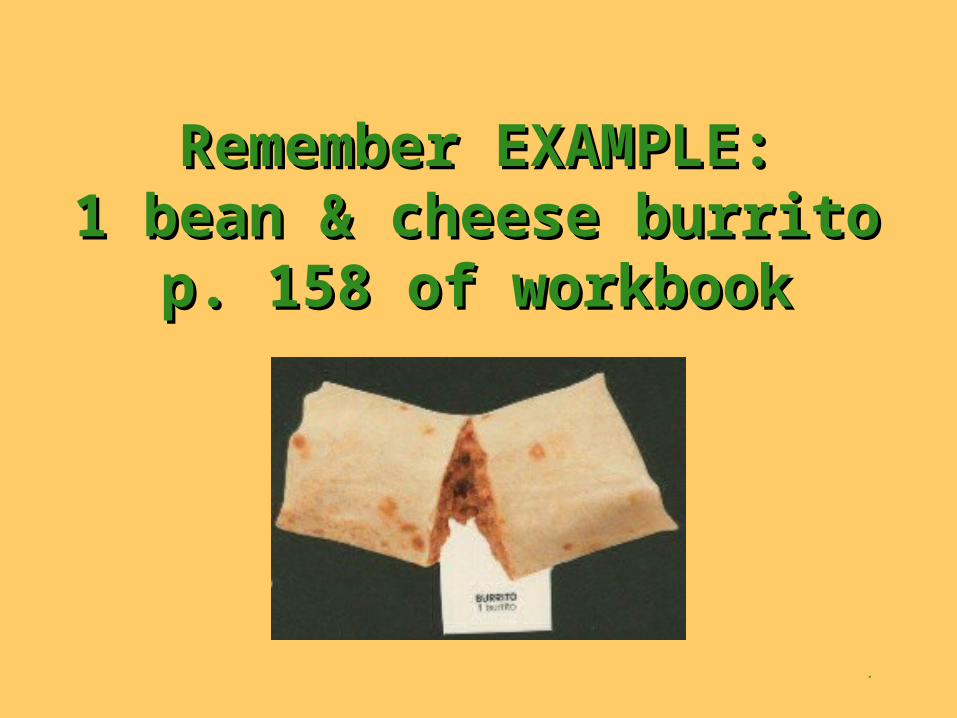
Remember EXAMPLE: Remember EXAMPLE: 1 bean & cheese burrito1 bean & cheese burrito
p. 158 of workbookp. 158 of workbook
8
You calculated % ofYou calculated % ofDAILY VALUES forDAILY VALUES for
vitamins & minerals for onevitamins & minerals for onefood.food.
EXAMPLE IN CLASS was EXAMPLE IN CLASS was 1 bean & cheese burrito1 bean & cheese burrito
p. 158 of workbookp. 158 of workbook
9
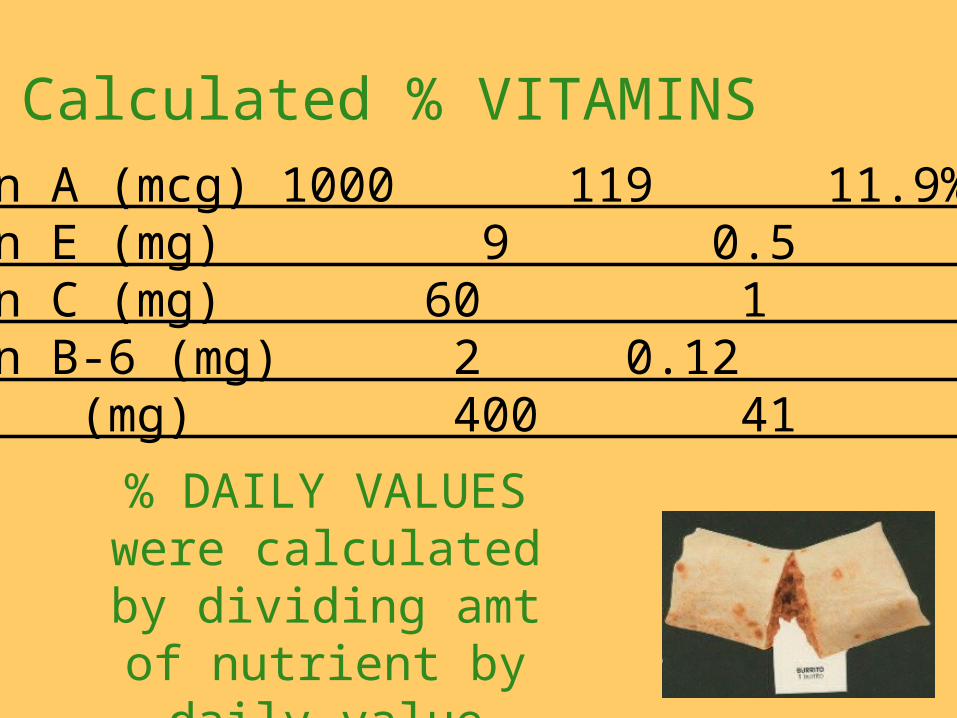
Vitamin A (mcg) 1000 119 11.9%Vitamin E (mg) 9 0.5 5.5%Vitamin C (mg) 60 1 1.7% Vitamin B-6 (mg) 2 0.12 6 % Folate (mg) 400 41 10.2%
Calculated % VITAMINS
% DAILY VALUESwere calculated by
dividing amt of nutrient by daily value
10
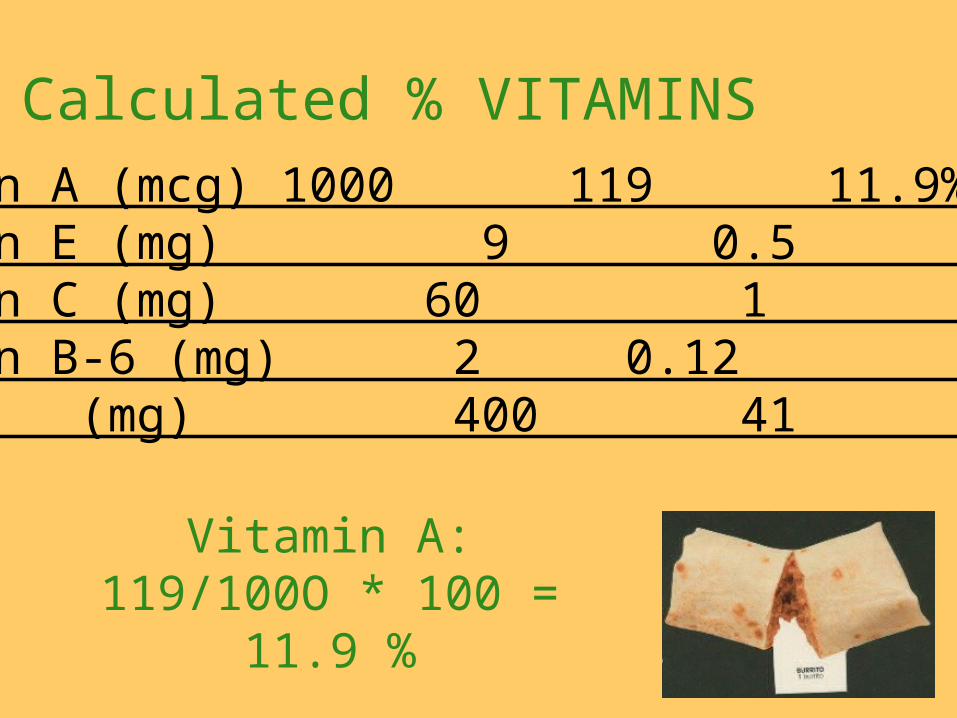
Vitamin A (mcg) 1000 119 11.9%Vitamin E (mg) 9 0.5 5.5%Vitamin C (mg) 60 1 1.7% Vitamin B-6 (mg) 2 0.12 6 % Folate (mg) 400 41 10.2%
Calculated % VITAMINS
Vitamin A:119/100O * 100 =
11.9 %

11
Vitamin A (mcg) 1000 119 11.9%Vitamin E (mg) 9 0.5 5.5%Vitamin C (mg) 60 1 1.7% Vitamin B-6 (mg) 2 0.12 6 % Folate (mg) 400 41 10.2%
Calculated % VITAMINS
Vitamin E:0.5 / 9 * 100 =
5.5 %
12
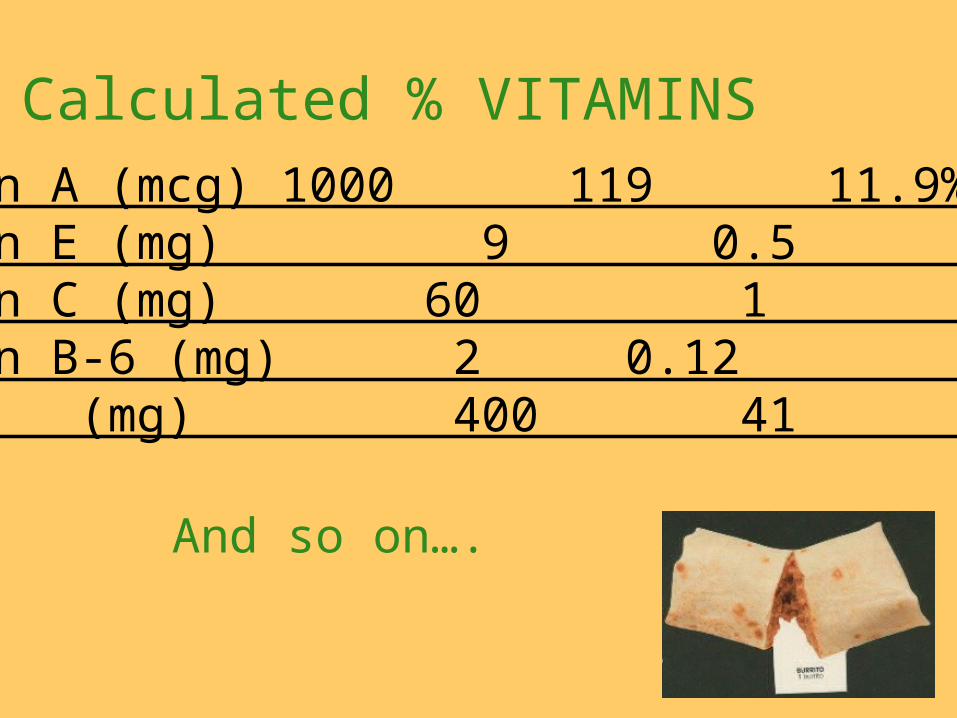
Vitamin A (mcg) 1000 119 11.9%Vitamin E (mg) 9 0.5 5.5%Vitamin C (mg) 60 1 1.7% Vitamin B-6 (mg) 2 0.12 6 % Folate (mg) 400 41 10.2%
Calculated % VITAMINS
And so on….
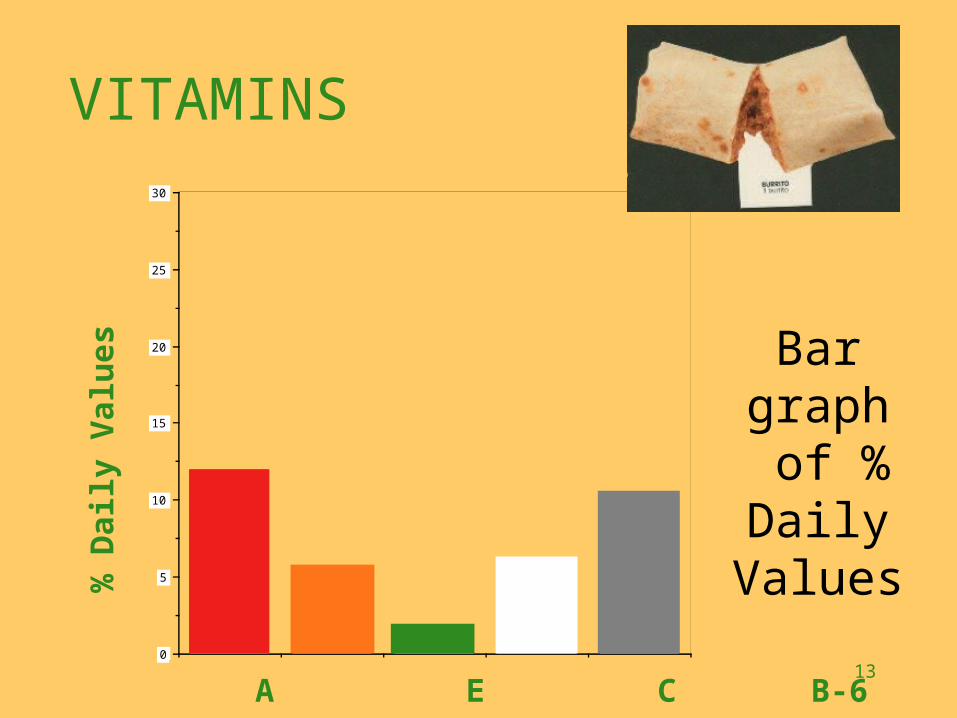
13A E C B-6 FOLATE0
5
10
15
20
25
30
VITAMINS
A E C B-6 FOLATE
% D
aily
Val
ues
Bar graph of % Daily
Values
14
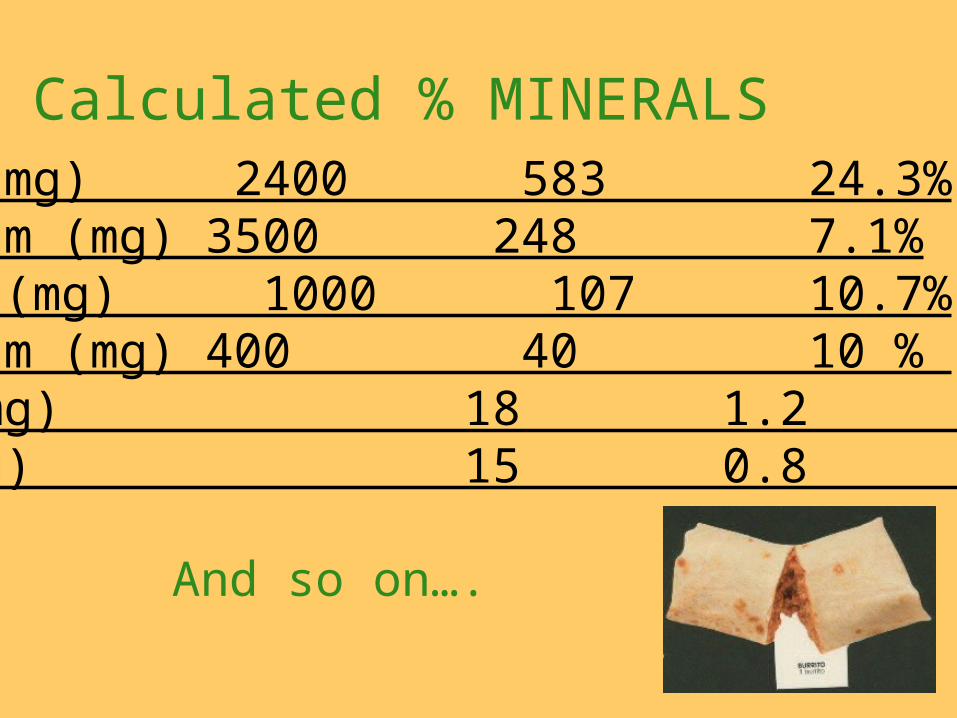
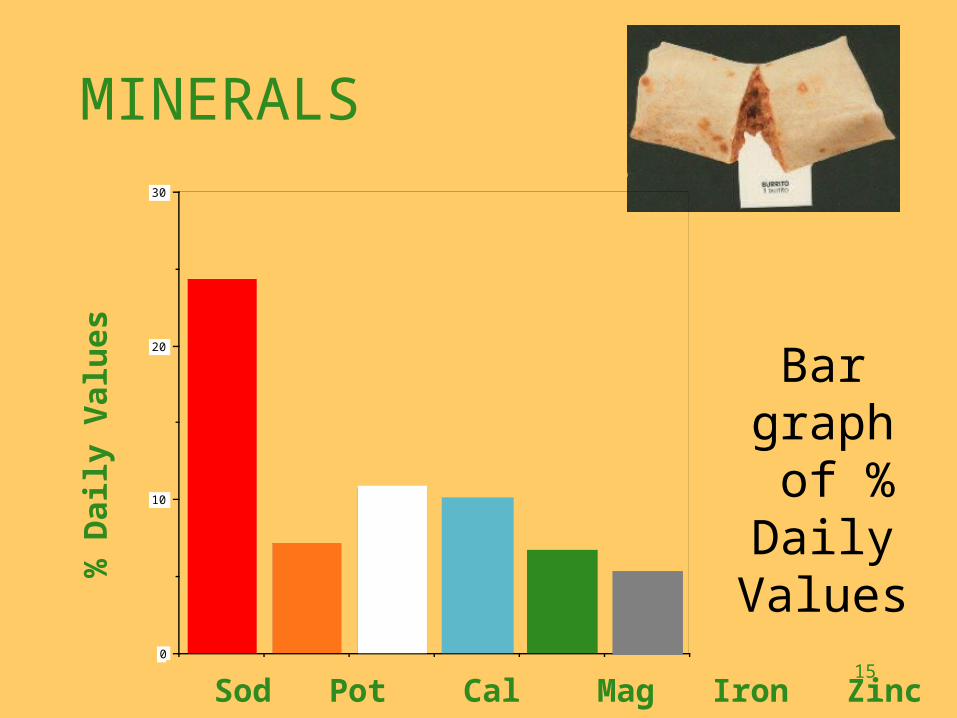
Sodium (mg) 2400 583 24.3%Potassium (mg) 3500 248 7.1%Calcium (mg) 1000 107 10.7%Magnesium (mg) 400 40 10 % Iron (mg) 18 1.2 6.7%Zinc (mg) 15 0.8 5.3%
Calculated % MINERALS
And so on….
15
MINERALS
Na K Ca Mg Fe Zn0
10
20
30
% Daily Values
Sod Pot Cal Mag Iron Zinc
% D
aily
Val
ues Bar
graph of % Daily
Values
16
One way would be to evaluate the number of
calories in the food.
NowConsiderthe question:“Are these amt of nutrients high or low?”
17
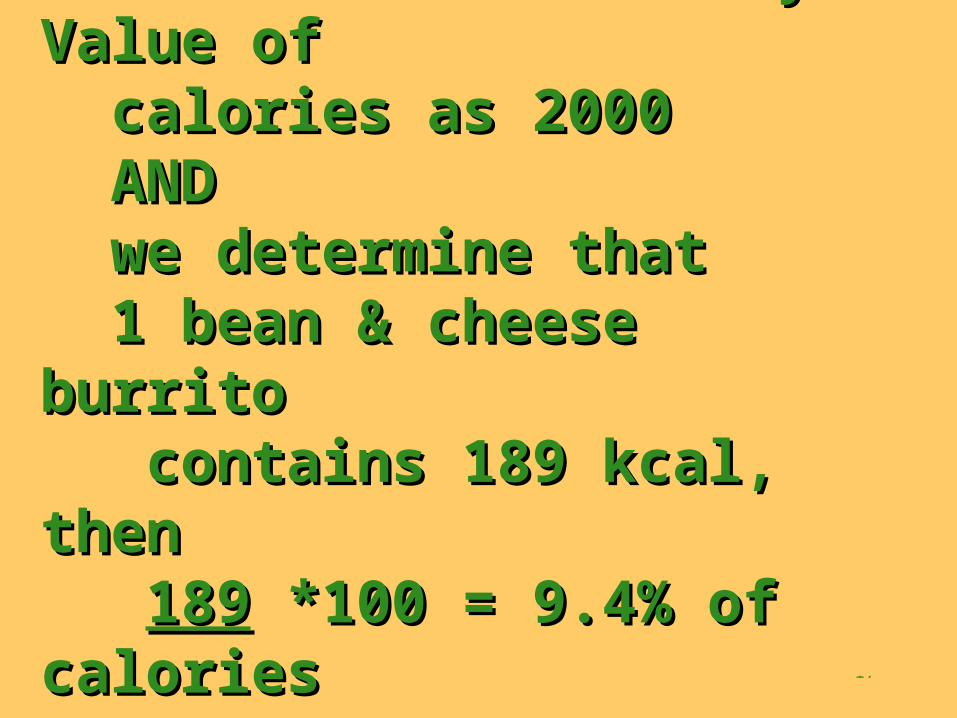
If we assume a Daily Value ofIf we assume a Daily Value of calories as 2000 calories as 2000 AND AND we determine that we determine that 1 bean & cheese burrito 1 bean & cheese burrito contains 189 kcal, then contains 189 kcal, then 189189 *100 = 9.4% of calories *100 = 9.4% of calories 2000 2000
18
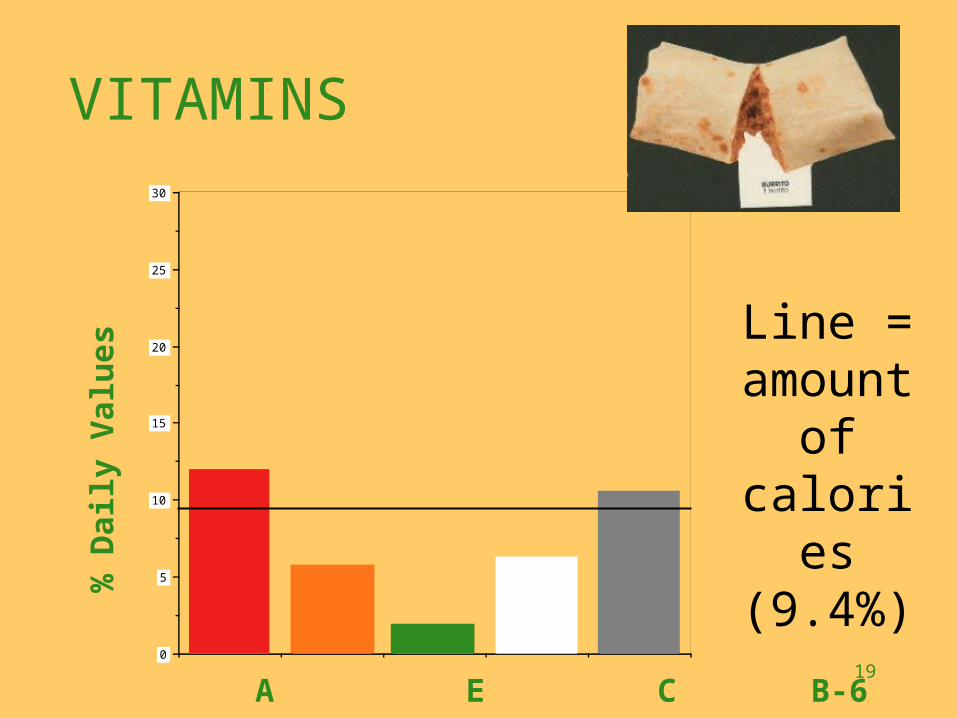
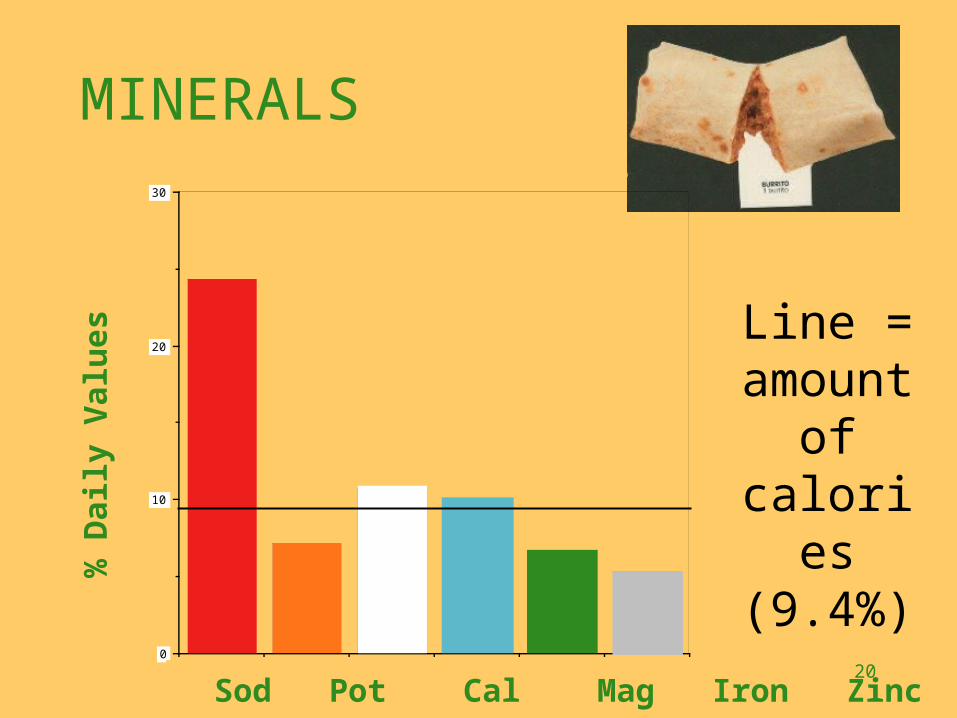
This means that This means that 1 bean & cheese burrito 1 bean & cheese burrito supplies 9.4% of calories supplies 9.4% of calories and this line can be drawn and this line can be drawn across the bar graphs across the bar graphs as shown in the next two as shown in the next two slides: slides:
19A E C B-6 FOLATE0
5
10
15
20
25
30
VITAMINS
A E C B-6 FOLATE
% D
aily
Val
ues
Line = amount
of calories(9.4%)
20
MINERALS
Na K Ca Mg Fe Zn0
10
20
30
% Daily Values
Sod Pot Cal Mag Iron Zinc
% D
aily
Val
ues
Line = amount
of calories(9.4%)
21
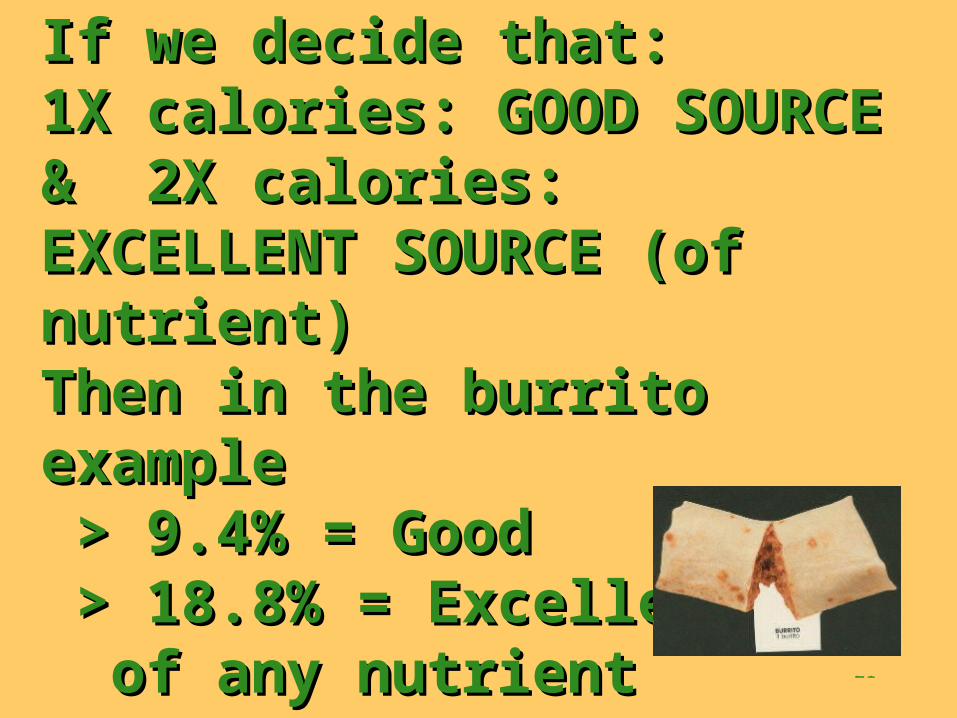
If we decide that: If we decide that: 1X calories: GOOD SOURCE1X calories: GOOD SOURCE& 2X calories: EXCELLENT & 2X calories: EXCELLENT SOURCE (of nutrient)SOURCE (of nutrient)Then in the burrito exampleThen in the burrito example > 9.4% = Good > 9.4% = Good > 18.8% = Excellent > 18.8% = Excellent of any nutrient of any nutrient
22
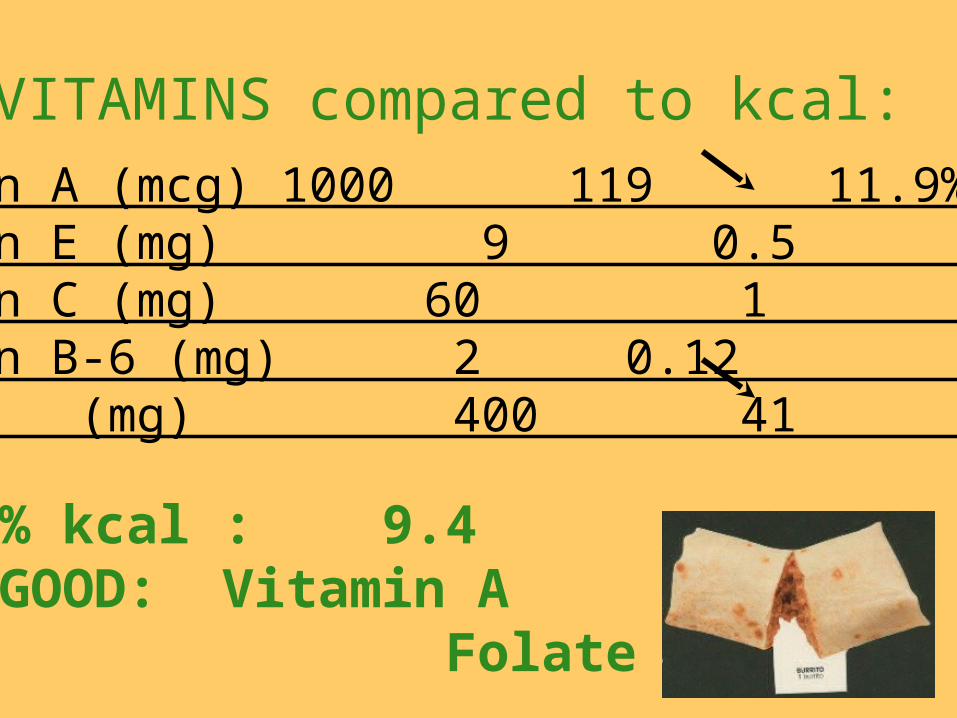
Vitamin A (mcg) 1000 119 11.9%Vitamin E (mg) 9 0.5 5.5%Vitamin C (mg) 60 1 1.7% Vitamin B-6 (mg) 2 0.12 6 % Folate (mg) 400 41 10.2%
VITAMINS compared to kcal:
% kcal : 9.4GOOD: Vitamin A Folate
23
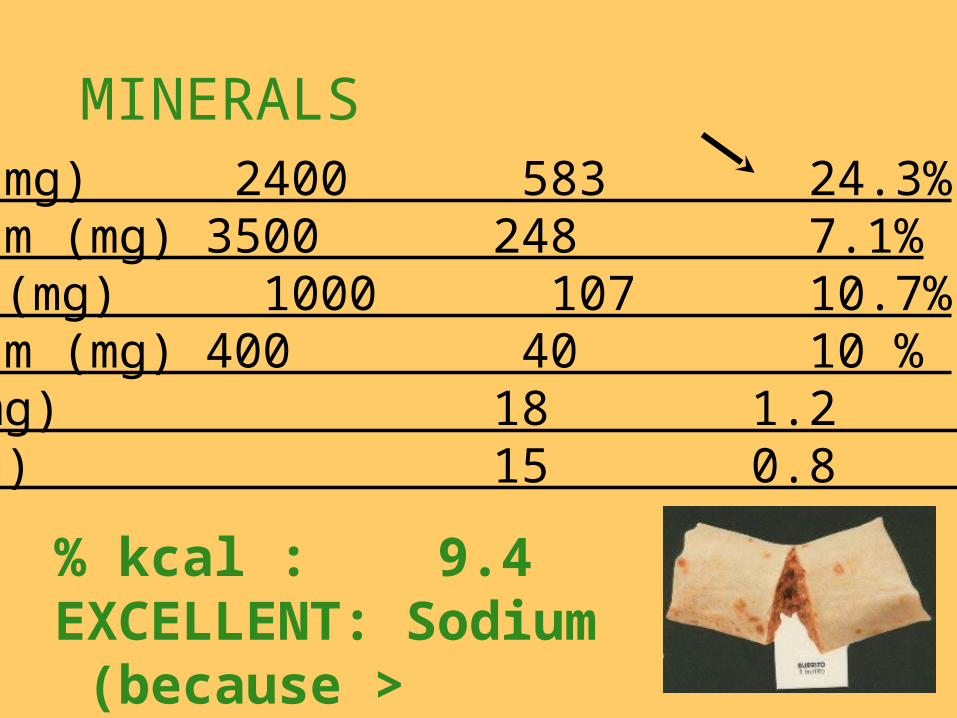
Sodium (mg) 2400 583 24.3%Potassium (mg) 3500 248 7.1%Calcium (mg) 1000 107 10.7%Magnesium (mg) 400 40 10 % Iron (mg) 18 1.2 6.7%Zinc (mg) 15 0.8 5.3%
MINERALS
% kcal : 9.4 EXCELLENT: Sodium (because > 18.8%)
24
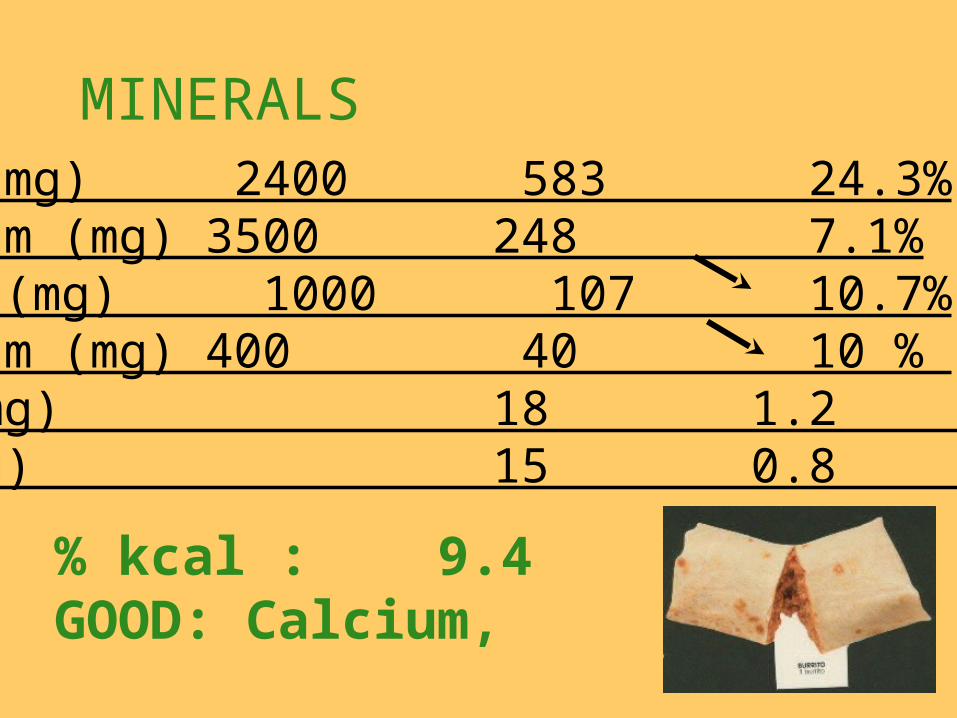
Sodium (mg) 2400 583 24.3%Potassium (mg) 3500 248 7.1%Calcium (mg) 1000 107 10.7%Magnesium (mg) 400 40 10 % Iron (mg) 18 1.2 6.7%Zinc (mg) 15 0.8 5.3%
MINERALS
% kcal : 9.4 GOOD: Calcium, Magnesium
25
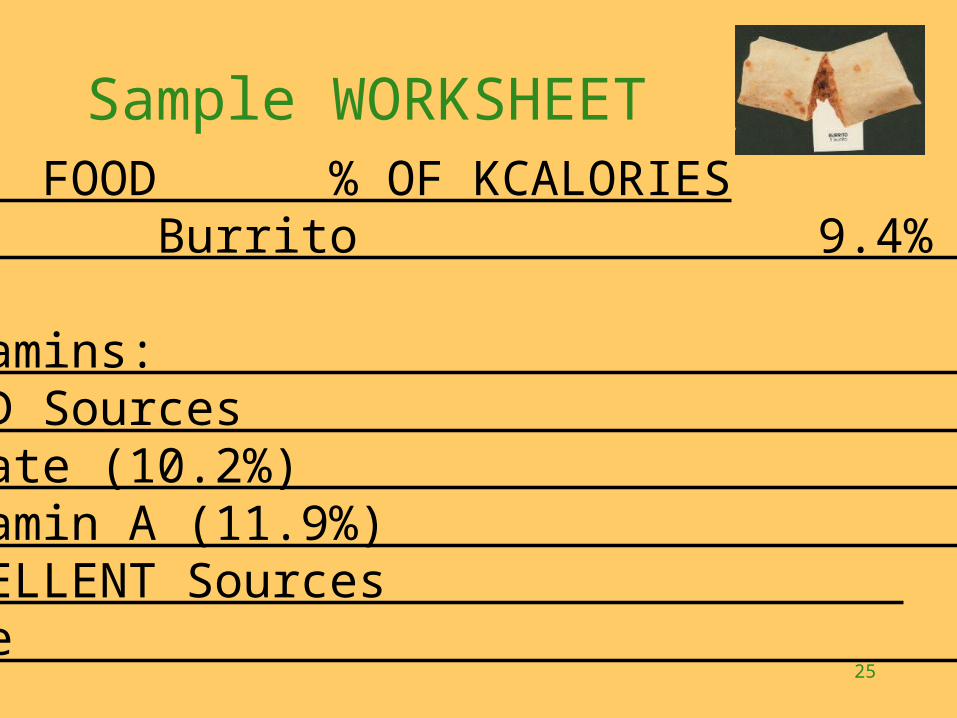
Amt of FOOD % OF KCALORIES 1 Burrito 9.4%
Vitamins: GOOD Sources Folate (10.2%) Vitamin A (11.9%) EXCELLENT Sources None
Sample WORKSHEET
26
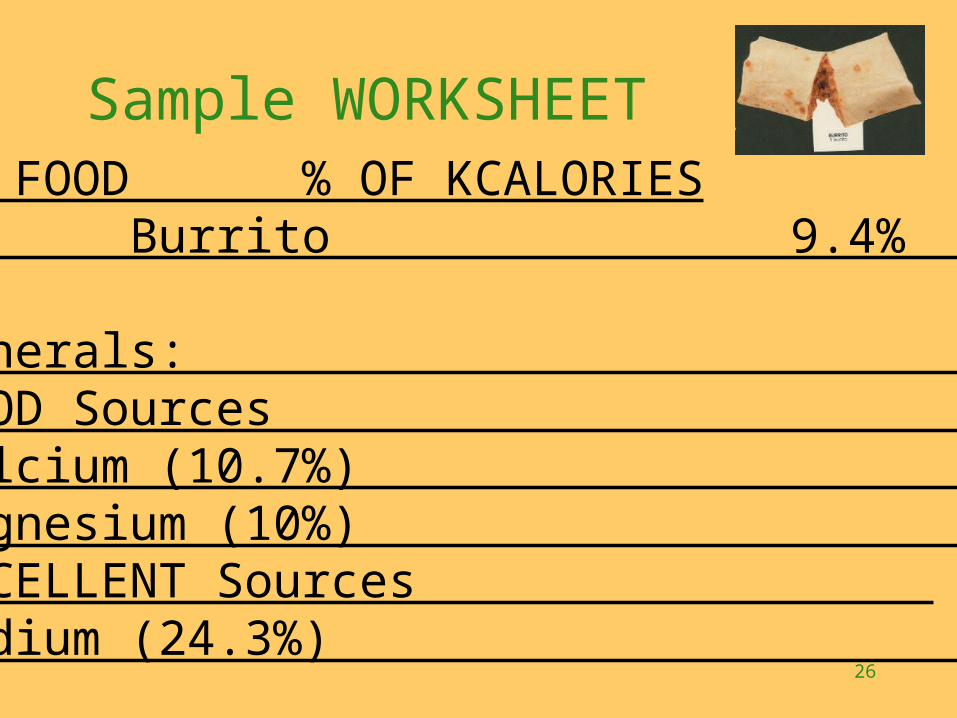
Amt of FOOD % OF KCALORIES 1 Burrito 9.4%
Minerals: GOOD Sources Calcium (10.7%) Magnesium (10%) EXCELLENT Sources Sodium (24.3%)
Sample WORKSHEET
27
Follow the directions on theFollow the directions on theextra credit assignment sheet.extra credit assignment sheet.
Remember late work willRemember late work willnot receive credit.not receive credit.
28
HINT: HINT:
You need only calculateYou need only calculatethe % of calories;the % of calories;
all other values are the all other values are the % DAILY VALUES!% DAILY VALUES!
Summer 2002