Embed Size (px)
Citation preview
1
alleles of patients with [p.Arg229Gln];[mut]
alleles of patients with [mut];[mut]
mutations n % of all (n=71) n % of all (n=494) p exon 1
p.Arg10Lysfs*60 0 1 0,2% 1
p.Arg36Profs*34 0 1 0,2% 1
p.Gln39Ser*31 0 2 0,4% 1
p.Pro45Argfs*54 0 4 0,8% 1
p.Ser46* 0 1 0,2% 1
p.Ser48Trpfs*53 0 1 0,2% 1
p.Glu56Glyfs*43 0 2 0,4% 1
p.Arg71* 0 1 0,2% 1
p.Glu87* 0 1 0,2% 1
p.Pro89Argfs*13 0 1 0,2% 1
p.Gly92Cys 0 3 0,6% 1
exon 2
c.275‐2A>C 0 1 0,2% 1
c.275G>A (splice+Gly92Asp) 0 1 0,2% 1
p.Glu102Lys 0 1 0,2% 1
p.Thr116Pro 0 2 0,4% 1
p.Pro118Leu 0 20 4,0% 0.16
p.Lys126Ilefs*7 1 1,4% 0 0.12
c.378G>T (p.Lys126Asn+splice) 0 3 0,6% 1
c.378+1G>A 0 1 0,2% 1
c.378+1G>C 0 1 0,2% 1
exon 3
c.379G>T (splice+p.Val127Phe) 0 2 0,4% 1
p.Val128del 0 3 0,6% 1
p.Arg133Serfs*33 0 1 0,2% 1
p.Arg138* 0 15 3,0% 0.24
p.Arg138Gln 5 7,0% 172 34,8% 3.9E‐07
p.Gly140Aspfs*41 0 21 4,3% 0.09
p.Arg146Glufs*35 0 2 0,4% 1
c.451+2T>A 0 1 0,2% 1
exon 4
c.452‐2A>C 0 1 0,2% 1
p.Leu156Phe*11 0 39 7,9% 0.01
p.Asp160Gly 0 2 0,4% 1
p.Arg168Cys 0 3 0,6% 1
p.Arg168Leufs*13 0 1 0,2% 1
p.Arg168His 0 22 4,5% 0.09
p.Leu169Pro 0 6 1,2% 1
p.Pro175Val 0 1 0,2% 1
c.534+1G>T 0 3 0,6% 1
exon 5
c.535‐1G>T 0 2 0,4% 1
p.Val180Met 0 23 4,7% 0.1
p.Phe185Leufs*2 0 1 0,2% 1
p.Glu188Asp 0 2 0,4% 1
p.Arg196* 0 2 0,4% 1
p.Arg196Pro 0 1 0,2% 1
p.Glu198Ala 0 4 0,8% 1
p.Ser211Thr 0 1 0,2% 1
p.Ala213Thr 0 4 0,8% 1
p.Gln215* 1 1,4% 6 1,2% 1
p.Val218Gly 0 1 0,2% 1
p.Arg229* 0 3 0,6% 1
p.Leu236_Arg238del 0 2 0,4% 1
p.Arg238Ser 1 1,4% 3 0,6% 0.42
exon 6
p.Gly257Glu 0 2 0,4% 1
p.Val260Glu 0 18 3,6% 0.15
p.Glu264* 0 1 0,2% 1
Supplementary Table 1. Allele frequency of NPHS2 exons 1–6 mutations in patients with
p.[Arg229Gln];[mut] and with [mut];[mut]
Nature Genetics: doi:10.1038/ng.2898

2
Supplementary Figure 1. Pedigree of the two individuals carrying p.[V290M];[R229Q] with no
proteinuria in adulthood
Nature Genetics: doi:10.1038/ng.2898
3
Nature Genetics: doi:10.1038/ng.2898

4
Nature Genetics: doi:10.1038/ng.2898

5
Nature Genetics: doi:10.1038/ng.2898

6
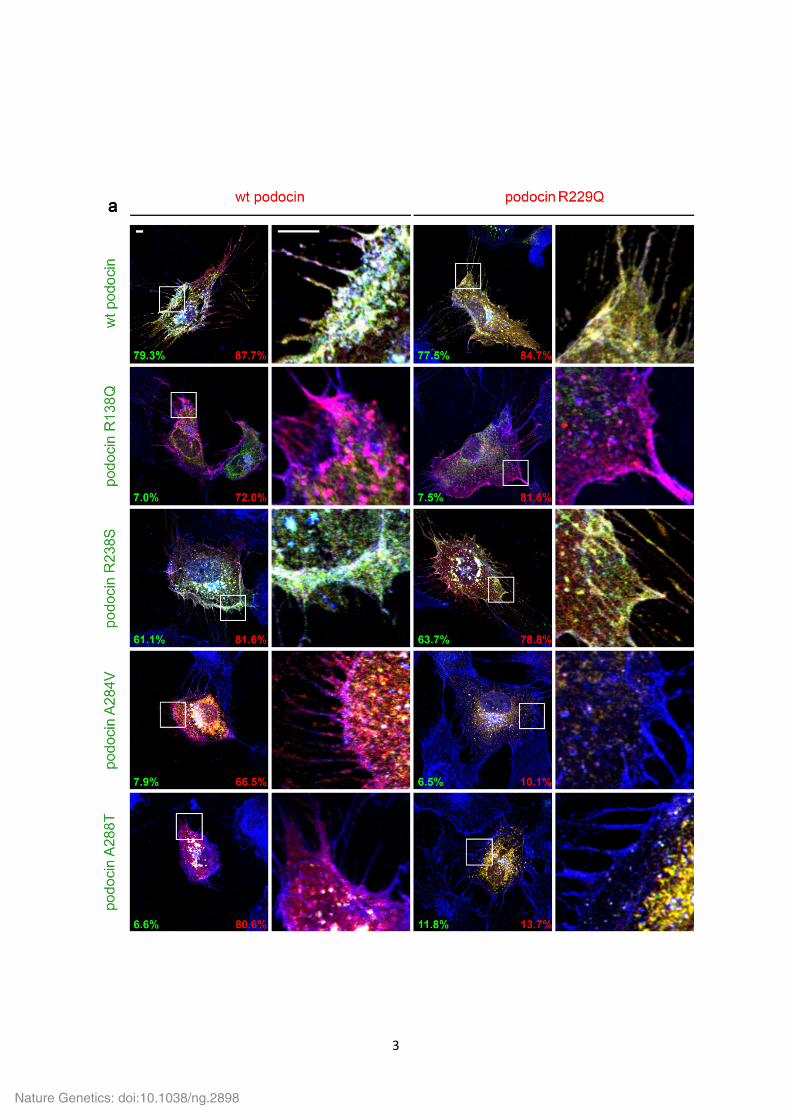
Supplementary Figure 2. Membrane‐targeting of wt podocin and podocin R299Q as a function of the
associated mutation in transiently transfected podocytes
a‐b) The wt podocin (columns 1–2) and podocin R229Q (columns 3–4) are shown in red, the
coexpressed GFP‐tagged podocin proteins (ordered according to the position of the mutation) in
green. The plasma membrane is labeled with WGA and shown in blue. Both wt podocin and podocin
R229Q are localized to the plasma membrane when coexpressed with either wt podocin, podocin
R238S (panel a, rows 1, 3) or podocin V290M (panel b, row 1) (white pixels correspond to the merge
of red, green and blue). Similarly, despite retention of podocin R138Q in the ER, both wt podocin and
podocin R229Q are localized to the plasma membrane (panel a, row 2, magenta pixels correspond to
red and blue). In contrast, while wt podocin reaches the plasma membrane (magenta pixels) in cells
coexpressing podocin A284V, podocin A288T (panel a, rows 4, 5) podocin R291W, podocin A297V or
podocin E310K (panel b, rows 2‐4), podocin R229Q is retained in cytoplasmic compartments. Panel b,
last row, 3rd column: The arrow indicates a cell which does not express podocin E310K but only
podocin R299Q, which is therefore well targeted to the plasma membrane. Percentages in green and
red indicate the proportion of the WGA‐labeled perimembranous area that colocalizes with GFP‐ or
HA‐tagged podocin proteins, respectively, within the presented cell. Similar results were found in 6‐7
cells per group (panels c, d). Scale bars = 5 μm.
c‐d) Membrane targeting of podocin proteins shown as the percentage of the plasma membrane
(WGA) that is positive for GFP‐ (c) or HA‐tagged podocin proteins (d), within 6‐7 cells per group. GFP‐
and HA‐tagged podocin proteins are indicated in green and red, respectively. The coexpressed
podocin proteins are indicated in subscript.
# P≤0.0027 vs. wtwt (wt‐GFP coexpressed with wt‐HA); * P≤0.0039 vs. R229Qwt (R229Q‐HA
coexpressed with wt‐GFP)
Nature Genetics: doi:10.1038/ng.2898

7
Supplementary Figure 3. Synaptopodin and podocin staining of urinary podocytes
Both synaptopodin and podocin staining confirm the presence of podocytes in the culture of urine
sediments. In contrast to control patients with non‐NPHS2 associated glomerulopathies (C1‐C3),
podocin is not targeted to the plasma membrane in the patient with p.[R229Q];[A284V] (Pt), as also
shown in Figure 2. Scale bar = 20 μm.
Nature Genetics: doi:10.1038/ng.2898

8
a) Examples for a transmission rate of 50% for two unaffected parents
A284V wt A284V wt
R229Q A284V
R229Q
wt
R229Q R138Q A284V
R138Q
wt
R138Q
R229Q A284V
R229Q
wt
R229Q R229Q A284V
R229Q
wt
R229Q
b) Examples for a transmission rate of 25% for an affected and an unaffected parent
A284V R229Q A284V R229Q
R229Q A284V
R229Q
R229Q
R229Q R138Q A284V
R138Q
R229Q
R138Q
wt
A284V
wt
R229Q
wt wt
A284V
wt
R229Q
wt
c) Example for a transmission rate of 75% for an affected and an unaffected parent
A284V R138Q
R138Q A284V
R138Q
R138Q
R138Q
R229Q A284V
R229Q
R138Q
R229Q
d) Examples for a transmission rate of 100% for an affected and an unaffected parent
A284V A284V A284V A284V
R229Q A284V
R229Q
A284V
R229Q R138Q A284V
R138Q
A284V
R138Q
R229Q A284V
R229Q
A284V
R229Q R229Q A284V
R229Q
A284V
R229Q
Supplementary Figure 4. Punnett squares illustrating non‐Mendelian transmission rates in
theoretical couples with R229Q and the ’associated mutations’
Individuals with expected early‐ or late‐onset SRNS are in dark and light gray, respectively.
Nature Genetics: doi:10.1038/ng.2898

9
Supplementary Figure 5. Sequence alignment for human podocin and Pyrococcus horikoshii stomatin
There is a 35% identity and 65% homology for the modeled region (podocin residues 161‐332):
colored boxes show identities. Arrows above the sequence indicate the domain structure – cyan
corresponds to the N‐terminal cytosolic fragment, magenta to the intra‐membrane fragment and
green to the C‐terminal cytosolic fragment of podocin.
Nature Genetics: doi:10.1038/ng.2898