Embed Size (px)
Citation preview

1
Evaluating the efficacy of trawl exclusion zones for Steller sea lions foraging on Atka 1
mackerel. II. Site-specific estimates to evaluate availability of Atka mackerel production 2
for sea lion consumption 3
Ivonne Ortiz1,2
and Elizabeth Logerwell1 4
1Alaska Fisheries Science Center, NOAA, NMFS 5
7600 Sand Point Way NE. 6
Seattle, WA 98115 7
USA 8
2 School of Aquatic and Fishery Sciences 9
University of Washington 10
Seattle, WA 98195-5020 11
USA 12
13

2
Abstract 14
Site-specific estimates were developed to examine whether Atka mackerel 15
(Pleurogrammus monopterygius) production inside 5 trawl exclusion zones (TEZs) in the 16
Aleutian Islands was sufficient to support resident Steller sea lions (Eumetopias jubatus). 17
The TEZs studied were Seguam Pass and Tanaga, Amchitka (North/ South) and Kiska 18
islands. Consumption estimates of Atka mackerel were developed for sea lions and other 19
main fish predators: Pacific cod (Gadus macrocephalus), Pacific halibut (Hippoglossus 20
stenolepis), arrowtooth flounder (Atheresthes stomias), walleye pollock (Theragra 21
chalcogramma), and skates (Bathyraja aleutica, B. parmifera, B.maculata). These 22
estimates were compared to Atka mackerel production calculated from mark-recapture 23
model estimates of local Atka mackerel biomass. Results showed geographic variation in 24
the amount of Atka mackerel consumed by predators, yet Pacific cod and arrowtooth 25
flounder jointly accounted for at least 50% of the Atka mackerel consumed regardless of 26
location. The differences across sites and years in predator biomass and Atka mackerel 27
production showed great variability in the degree to which the amount of Atka mackerel 28
protected within TEZs could be expected to meet the energetic demands of Steller sea 29
lions, given the demands of other (fish) predators. In summary, Atka mackerel 30
production in the Seguam Pass TEZ greatly exceeded the demands of Steller sea lion 31
consumption. In contrast, the production of Atka mackerel in the Amchitka North TEZ 32
probably could not support current or historical foraging needs of Steller sea lions. These 33
results suggest that a “one-size-fits-all” approach to designating protection measures for 34
Steller sea lions may not be effective and factors such as local biomass of prey and 35
competing predators need to be taken into consideration when designing TEZs and other 36
marine protected areas. 37

3
Introduction 38
Steller sea lion (Eumetopias jubatus) populations in Alaska have declined by more than 39
80% over the past 30 years (Loughlin, 1998; Loughlin et al., 1992; National Research 40
Council 2003). The western stock (west of longitude 144° W) was listed as endangered in 41
1997 under the U.S. Endangered Species Act. The eastern stock, although increasing in 42
size, remains listed as threatened. 43
44
Recognizing various direct and indirect interactions between Steller sea lions and 45
fisheries, fishing effort has been spatially and temporally redistributed since 1991 to 46
avoid important sea lion habitat. Most notably, 10-20 nautical mile (nmi) trawl exclusion 47
zones (TEZs) were established around many rookeries and haulouts to minimize 48
incidental take of sea lions in fisheries, minimize fish removals, and lower the risk of 49
localized depletion of Steller sea lions prey species so as to foster the population’s 50
recovery (Angliss and Outlaw 2007; Fritz et al. 1995). 51
52
Spatially explicit studies to evaluate fisheries impacts have focused on the effect of local 53
fishing activities around haulouts and rookeries on Steller sea lion population trends 54
(Dillingham et al. 2006; Hennen, 2006). Other studies have examined multiple factors in 55
addition to fisheries activities that affect Steller sea lion populations (Wolf and Mangel, 56
2008) inside and outside of TEZs. Potential indirect effects were suggested by Sinclair 57
and Zeppelin (2002), who conducted a study of regional and seasonal dietary differences 58
of Steller sea lions and their overlap with species caught by commercial groundfish 59
fisheries, specifically, walleye pollock (Theragra chalcogramma), Atka mackerel 60
(Pleurogrammus monopterygius) and Pacific cod (Gadus macrocephalus). Sinclair and 61
Zeppelin (2002) noted that in the central and western Aleutian Islands, Steller sea lions 62
rely primarily on Atka mackerel year-round. These studies, however, were not designed 63
to evaluate the adequacy of TEZs to fulfill the objectives for which they were 64
implemented. To fill this gap, McDermott et al. (this volume) estimated local abundance 65
and movement of Atka mackerel inside and outside of TEZs in the Aleutian Islands. 66

4
Atka mackerel is not only the major commercially caught species in this region, it is also 67
an important prey species for several groundfish. Based on a food web model developed 68
by Aydin et al. (2007) for the Aleutians Islands, Atka mackerel are consumed primarily 69
by Steller sea lions, Pacific cod, walleye pollock, arrowtooth flounder (Atheresthes 70
stomias), Pacific halibut (Hippoglossus stenolepis), and skates (Bathyraja spp.) in 71
addition to being fished by commercial fisheries (Figure 1). Other studies have shown 72
that there are longitudinal gradients both in biomass and feeding habits along the 73
Aleutian Islands that result in distinct food-webs (Logerwell et al. 2005 and Ortiz 2007). 74
This study incorporates the local population estimates by McDermott et al. (this volume) 75
and the estimated predation on Atka mackerel at those specific TEZs by the five main 76
Atka mackerel groundfish predators and Steller sea lions. These estimates were then 77
used to evaluate whether there is enough Atka mackerel production inside (TEZs) to 78
support Steller sea lion energy needs for the current population if production was enough 79
to support historic population levels before the Steller sea lion population decline. 80
Methods 81
Study site 82
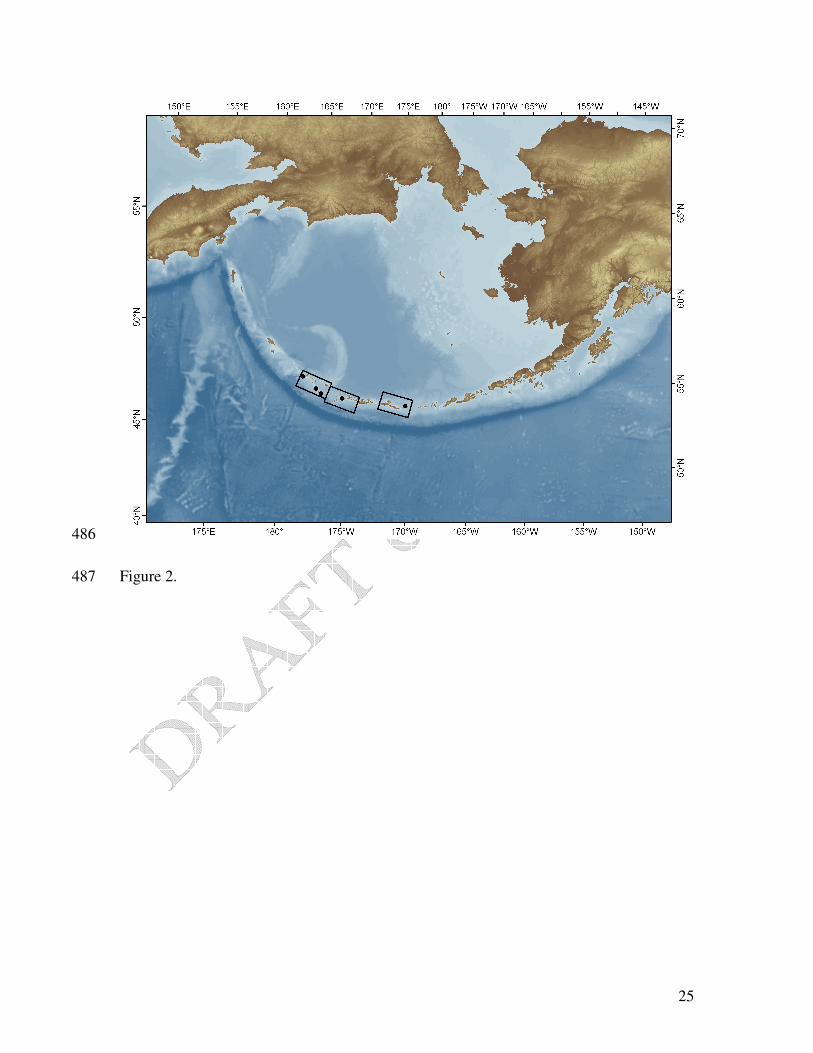
We estimated predation on Atka mackerel at five study sites in the Aleutian Islands 83
Archipelago; each site included one or more TEZs (Figure 2). The study sites correspond 84
to the tag, release, and recovery locations for Atka mackerel from McDermott et al. (this 85
volume) and are year-specific based on the year of tagging (Figure 3). To estimate 86
predator density and diet the sites are each enclosed in an area of 3 degrees of longitude 87
(see details below): 88
Seguam Pass 2002: encompasses one TEZ within 172ºW and 175ºW. 89
Tanaga Pass 2002: includes three TEZs within 177ºW and 180ºW 90
Amchitka Island, north site 2003: includes two TEZs within 177ºE and 180ºW 91
Amchitka Island, south site 2003: includes three TEZs within 177ºE and 180ºW 92

5
Kiska Island 2006: covers two overlapping TEZs within 177ºE and 180ºW 93
Data 94
Table 1 summarizes the data used, the sample size and data sources 95
. Annual production and consumption rates were calculated for the specific year for 96
which Atka mackerel biomass was calculated. 97
Atka mackerel 98
Atka mackerel biomass inside the TEZs at each site was taken from McDermott et al. 99
(this volume) who used a mark-recapture model to estimate biomass both inside and 100
outside the TEZs at each site. 101
The production per unit of biomass (P/B) of Atka mackerel for any given year y can be 102
approximated as: 103
( )
∑
∑=
=
=
=
∆
=11
3
,
11
0
,
ˆ*ˆ
ˆ*ˆ
/a
a
aya
a
a
aya
y
WN
WN
BP , (1) 104
where yaN ,ˆ
are the year-specific estimated number at age, aW is the estimated weight at 105
age, 106
We used Atka mackerel weight-at-age data specific for the Aleutian Islands; year-specific 107
number-at-age estimates used to scale individual weights to population level were taken 108
from the 2008 stock assessment for Atka mackerel (Lowe et al. 2008). Because the stock 109
assessment has estimated numbers starting at age 1, we estimated the predation mortality 110
of age 0 and age 1 fish. 111
Steller sea lions 112
Abundance: Year-specific numbers-at-age of Steller sea lions at each study site were 113
estimated using a state-space model based on the Kalman filter. The model allowed for 114
movement across rookeries (G. Fay, CSIRO, personal communication). 115

6
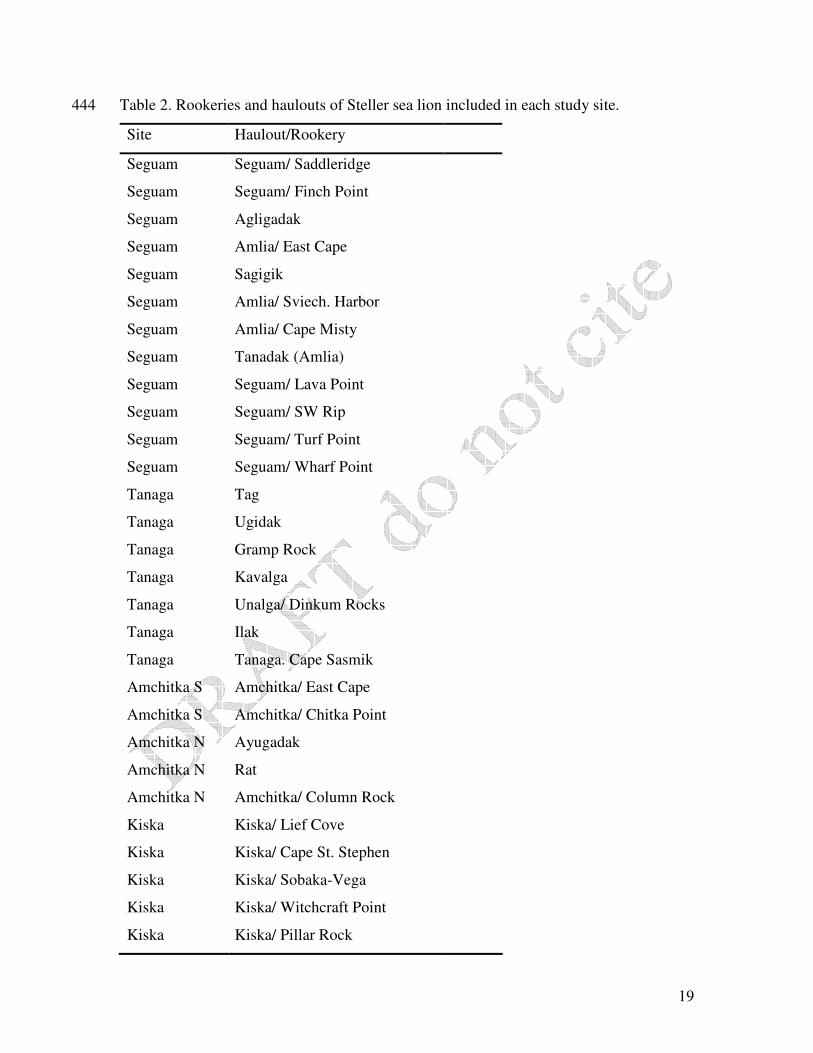
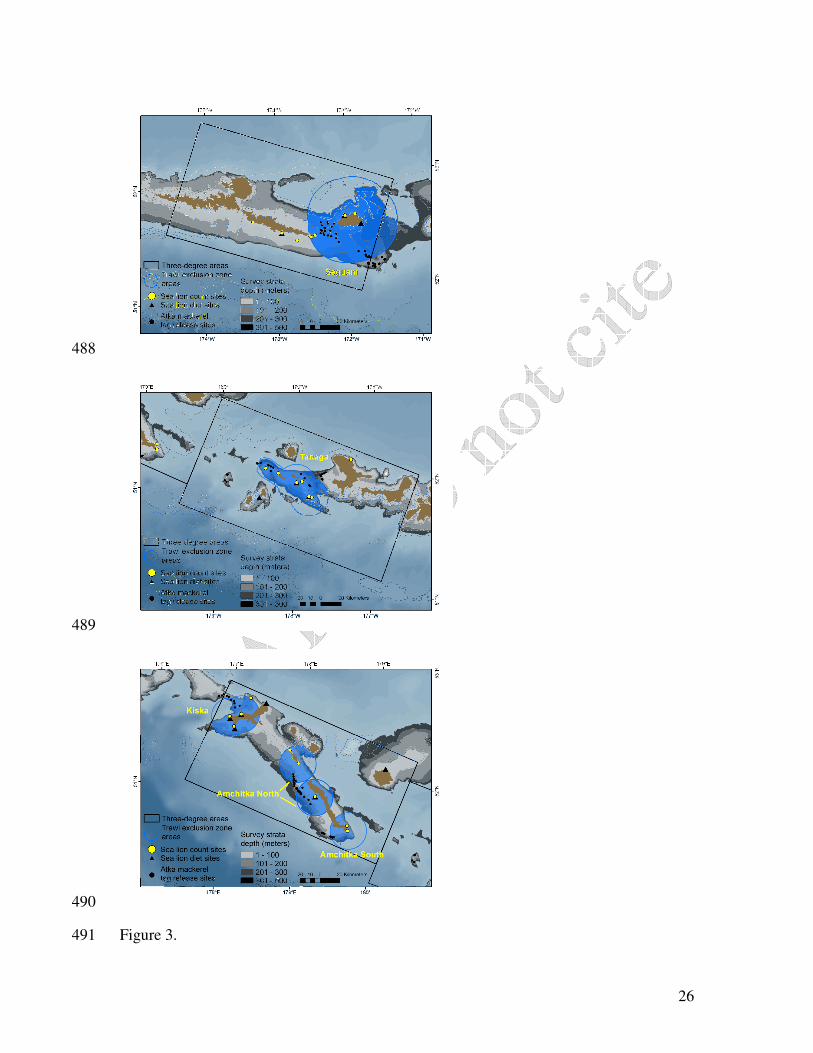
The rookeries and haulouts selected for this study were approximately 50% of the total 116
population in the central Aleutian Islands. Table 2 and Figure 3 present the specific 117
rookeries/ haulouts included in each site. 118
Biomass: Age-structure of the population was considered to be the same at all sites and 119
years and was calculated by updating York’s (1994) age structure with Holmes et al. 120
(2007) scaling factor. The sex ratio of the populations was also considered the same at 121
all sites and years and was calculated using sex-age specific survival rates derived from a 122
study at Marmot Island (Gulf of Alaska) using mark-recapture data (Lowell Fritz, AFSC, 123
personal communication). Average weight-at-age for combined sexes was calculated by 124
averaging non-pregnant female, pregnant female, and male weight-at-age, weighted by 125
sex ratio, birth proportion at age and age structure. The year-specific biomass at each site 126
was estimated by multiplying the numbers at age by the weighted average weight-at-age 127
for males and females combined. 128
Diet composition was based on site-specific scat collections during 1990-1999 taken 129
from the Alaska Fisheries Science Center’s National Marine Mammal Laboratory 130
(AFSC-NMML) diet database for Steller sea lions. We used scats collected at rookeries 131
or haulouts near the population count locations at each study site to estimate frequency of 132
occurrence of Atka mackerel in the diet of Steller sea lions (Figure 4). 133
Consumption rate (Q/B) was taken from Aydin et al. (2007) who scaled the average 134
individual Steller sea lion body weights and daily caloric requirements listed in Hunt et 135
al. (2000) to an annual rate. 136
Historical comparison: Steller sea lion biomass at each site was also estimated for 1977, 137
when sea lion numbers were still relatively high. The purpose of this “historical” 138
estimate of sea lion abundance (and consumption) was to examine whether Atka 139
mackerel production in TEZs would be sufficient to maintain sea lions at historically 140
higher levels. Because no sea lion diet data from the central Aleutians were collected 141
during the 1970s or 1980s, the same diet and consumption rate estimates were used to 142
calculate “historical” as well as year-specific sea lion consumption of Atka mackerel. 143

7
Fish predators 144
Fish predators include Pacific cod, walleye pollock, arrowtooth flounder, Pacific halibut, 145
and skates. The Alaska Fisheries Science Center (AFSC) of the National Marine 146
Fisheries Service (NMFS) conducts biennial standardized bottom trawl surveys to collect 147
data on the distribution, abundance, population structure, and feeding habits of Alaska 148
groundfish stocks. The surveys in the Aleutian Islands cover depths down to 500 m and 149
employ a stratified random sampling. There are 50 strata covering the Aleutian Island 150
region which are both geographically (Eastern, Western, Central north/south) and depth 151
defined (<100 m, 100-200 m, 200-300 m, 300-500 m). Both haul-by-haul catch-per-unit-152
effort (CPUE) and biomass estimates by survey strata are available from the AFSC’s 153
Resource Assessment and Conservation Engineering (RACE) Division’s RACEBASE 154
database. The data was available for AFSC surveys conducted in 1980, 1983, 1986, 1991, 155
1994, 1997, 2000, 2002, 2004, and 2006. 156
157
Biomass estimates at each site were based on survey estimates for the corresponding year 158
for which Atka mackerel biomass was estimated, except for 2003 when there was no 159
survey and we used 2004 data. In order to downscale survey strata biomass estimates to 160
biomass within each TEZ, we first proportioned the corresponding individual stratum 161
biomass to the 3 degree areas of each study site based on the CPUE of hauls falling 162
within the 3 degree areas. We then assumed a homogeneous density for each stratum 163
within the 3 degree area and applied it to the stratum area in the TEZs at each study site. 164
We summed across strata to get the biomass estimates within the TEZs: 165
166
∑∑
=ystratum
ystratumarea
ystratumystratumareaCPUE
CPUEBB
,
,,deg3
,,,deg3 * (2) 167
168
∑=strata stratumarea
ystratumarea
stratumTEZyTEZArea
BAreaB
,deg3
,,deg3
,, * . (3) 169
170
171
172

8
We did not proportion the survey strata biomass directly to the TEZs because areas along 173
the passes are hard to trawl, potentially underestimating the biomass based directly on 174
proportioning CPUEs of hauls inside the TEZs. Figure 3 shows the survey strata and the 175
TEZ areas to which the biomass estimates were downscaled. 176
177
Diets: for all the fish predators that we selected stomach samples falling within the 3 178
degree areas of each study site to allow for suitable sample sizes for all predators. From 179
these samples we calculated the proportion by weight of Atka mackerel with respect to all 180
other prey items. Diets for fish were based on prey found in stomachs collected between 181
2000 and 2006, except for skates for which we used samples from 1997 to 2006 to 182
increase the sample size. We did not weight the diet estimates by prey age structure as 183
there were not enough stomach samples per year to allow for analysis of age-specific 184
diets. 185
Consumption rates were estimated as ( ) d
tWAH ⋅/ where A is assimilation efficiency, H 186
is an assimilation constant and weight-at-age was calculated as: 187
(( )( )( ) dttdk
t eWW −−−−
∞ −•= 1
11 01 , (4) 188
where ∞W (asymptotic body mass) is ( ) dkH −1
1
/ , k is an energy loss constant, d is the 189
allometric slope of consumption, 0t is the age when W=0 weight at time zero; respiration 190
linearly proportional to body weight (Essington et al. 2001). 191
Equation 4 was fitted to species-specific weight-at-age data for pollock in the Aleutian 192
Islands. For Pacific cod in the Aleutian Islands/Bering Sea and for arrowtooth flounder in 193
the Gulf of Alaska. Detailed methods for estimating consumption rate are described in 194
Essington et al. (2001). Individual consumption was scaled to population-level 195
consumption using the available year-specific numbers-at-age data from the 2008 stock 196
assessments for walleye pollock, Pacific cod and arrowtooth flounder (Barbeaux et al. 197
2008, Thompson et al. 2008, Wilderbuer et al. 2008). For skates and halibut we assumed 198
a consumption rate of 2.0 and 1.1, respectively, as estimated by Aydin et al. (2007). 199

9
Estimates of Atka mackerel consumed 200
We estimated the amount of Atka mackerel consumed at each study site from the shelf 201
area down to 500 m in depth. The estimates are considered annual as both consumption 202
and production rates were scaled to yearly totals. Although we used year-round samples 203
to estimate the proportion of Atka mackerel in the predator’s diets, sampling occurred 204
mainly in the summer (May-September) –when it is assumed that most of the 205
consumption takes place. Fish and Steller sea lion biomass estimates are based on 206
summer surveys as well. 207
The total year-specific consumption of Atka mackerel by predators was estimated as: 208
Total Atka mackerel consumed y = ∑
j
sjelAtkamac
yj
syj DCB
QB ,,ker
,
,, ** , (5) 209
where y is the year 2002, 2003 or 2006 depending on the site, Bj,y,s is predator j biomass 210
in tons during year y at site s, QBj,y is the annual consumption rate of predator j in year y, 211
and DCAtka mackerel,j,s is the percent by weight of Atka mackerel in predator (j)’s diet at site 212
s. 213
Total production is the product of the year-specific production rate and year/site specific 214
biomass of Atka mackerel: 215
Production y,s = sysy BPB ,, * . (6) 216
We used the production estimate only to evaluate whether the estimated consumption by 217
all predators inside the TEZs could be satisfied by the local production. We used the 218
median, 5th
and 95th
quantiles of the biomass estimates to provide a range of production 219
estimates. 220
221
Results 222

10
The parameters used in the von Bertalanffy equation to estimate PB and QB are presented 223
in Table 3. The resulting biomass, production and consumption estimates used to estimate 224
the amount of Atka mackerel consumed at each site are presented in Table 4. 225
Consumption of Atka mackerel 226
The contribution of Atka mackerel to fish and Steller sea lion diets is shown in Figure 4. 227
Figure 5 shows estimated predator biomass and total Atka mackerel consumed at each 228
site. Atka mackerel is a primary prey of arrowtooth flounder, skates and Pacific cod (up 229
to 88% of their diet). However, depending on their biomass, the amount of Atka mackerel 230
these predators consume may only account for a small proportion of the total Atka 231
mackerel biomass consumed at a given site. Such is the case for skates, whose 232
consumption of Atka mackerel makes up less than 10% of the total Atka mackerel 233
consumed at any study site, despite Atka mackerel making up 75% (by weight) of their 234
diet. Conversely, predators whose diet may include only a small proportion of Atka 235
mackerel may account for a large portion of the total Atka mackerel consumed if their 236
biomass is high, as is the case for pollock. 237
The largest biomass of Atka mackerel predators was estimated at the Tanaga and Seguam 238
study sites. These sites had the largest biomasses of both Steller sea lions, walleye 239
pollock and arrowtooth flounder. Across all sites, Pacific cod and arrowtooth flounder 240
predation accounts for at least 50% of the Atka mackerel consumed. 241
Atka mackerel production 242
Production estimates of Atka mackerel seem to satisfy local consumption in most sites, 243
except for Amchitka North where the estimated consumption exceeded production 244
(Figure 6). Substituting the current Steller sea lion biomass with their biomass in 1977 245
when the populations were healthy shows consumption would almost match production 246
at Kiska, Amchitka South and Tanaga while considerably exceeding production at 247
Amchitka North. 248
249
11
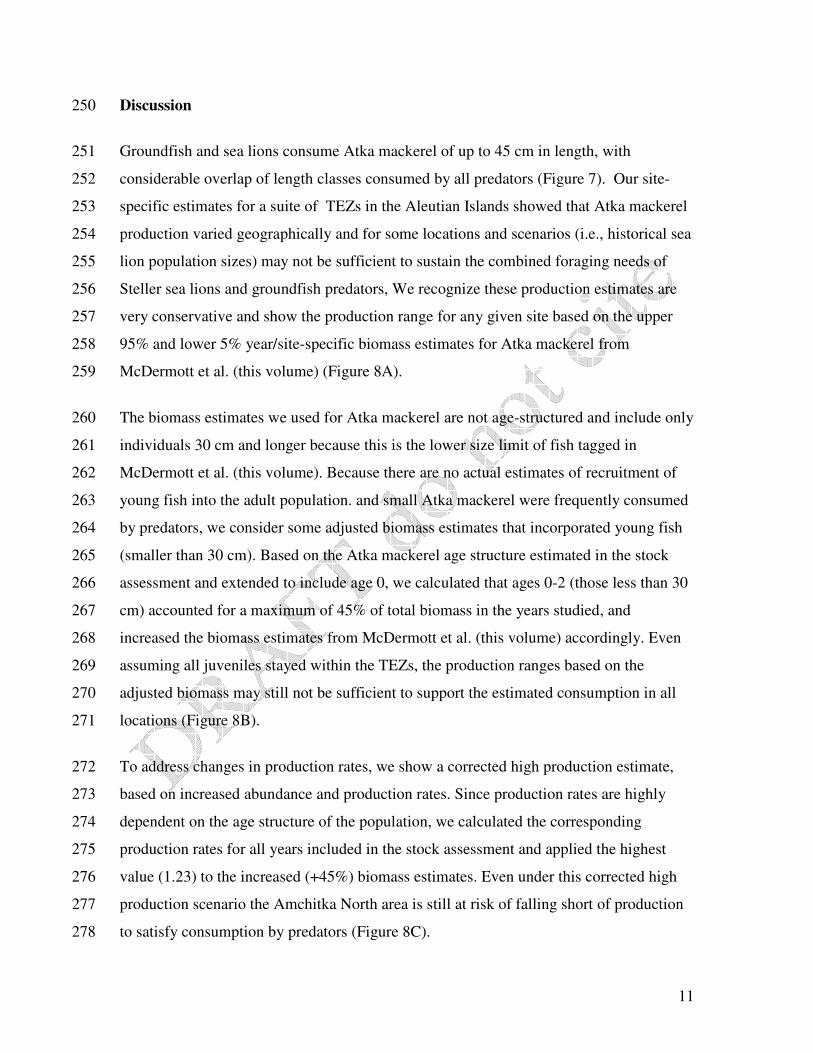
Discussion 250
Groundfish and sea lions consume Atka mackerel of up to 45 cm in length, with 251
considerable overlap of length classes consumed by all predators (Figure 7). Our site-252
specific estimates for a suite of TEZs in the Aleutian Islands showed that Atka mackerel 253
production varied geographically and for some locations and scenarios (i.e., historical sea 254
lion population sizes) may not be sufficient to sustain the combined foraging needs of 255
Steller sea lions and groundfish predators, We recognize these production estimates are 256
very conservative and show the production range for any given site based on the upper 257
95% and lower 5% year/site-specific biomass estimates for Atka mackerel from 258
McDermott et al. (this volume) (Figure 8A). 259
The biomass estimates we used for Atka mackerel are not age-structured and include only 260
individuals 30 cm and longer because this is the lower size limit of fish tagged in 261
McDermott et al. (this volume). Because there are no actual estimates of recruitment of 262
young fish into the adult population. and small Atka mackerel were frequently consumed 263
by predators, we consider some adjusted biomass estimates that incorporated young fish 264
(smaller than 30 cm). Based on the Atka mackerel age structure estimated in the stock 265
assessment and extended to include age 0, we calculated that ages 0-2 (those less than 30 266
cm) accounted for a maximum of 45% of total biomass in the years studied, and 267
increased the biomass estimates from McDermott et al. (this volume) accordingly. Even 268
assuming all juveniles stayed within the TEZs, the production ranges based on the 269
adjusted biomass may still not be sufficient to support the estimated consumption in all 270
locations (Figure 8B). 271
To address changes in production rates, we show a corrected high production estimate, 272
based on increased abundance and production rates. Since production rates are highly 273
dependent on the age structure of the population, we calculated the corresponding 274
production rates for all years included in the stock assessment and applied the highest 275
value (1.23) to the increased (+45%) biomass estimates. Even under this corrected high 276
production scenario the Amchitka North area is still at risk of falling short of production 277
to satisfy consumption by predators (Figure 8C). 278

12
The best estimates for Steller sea lion vital rates are based on data collected in the central 279
Gulf of Alaska (York 1994; Holmes et al. 2007). Vital rate information from Aleutian 280
Islands sea lions was not available for the construction of this model so we used data 281
from the central Gulf of Alaska. Aerial survey photographs taken in 2004 indicated 282
similar age structures of Steller sea lions between the central Gulf of Alaska and the 283
Aleutian Islands (L. Fritz, AFSC-NMML, personal communication), supporting the use 284
of Gulf of Alaska vital rate estimates of Steller sea lions in our Aleutian Islands model. 285
An independent estimate of Steller sea lion consumption rates compared favorably with 286
ours. Winship et al. (2002 ) built a bioenergetic model to estimate food requirements of 287
Steller sea lions in Alaska. Using their estimates of daily food requirements applied to the 288
age structure and number of individuals in our study sites yielded consumption estimates 289
similar to ours (Table 5). 290
We constructed annual food web models to examine the geographic patterns in Atka 291
mackerel production and consumption by predators by scaling both growth and 292
consumption rates to yearly totals. Much of the field data used to build the model were 293
collected during the summer, however it was assumed that most of the consumption 294
occurs during the summer. The summer estimates of Atka mackerel biomass are 295
expected to be a fair representation of local biomass throughout the year. Tag release and 296
recovery data over multiple years indicate that there was little movement of fish among 297
our study sites (McDermott, AFSC, personal communication) 298
299
The TEZs were established with the aim of ensuring availability of adequate food 300
resources to Steller sea lions, decreasing competition with fisheries and promoting their 301
recovery. This study determined that the estimates of total consumption by groundfish 302
and sea lions can both exceed the estimated local production of Atka mackerel, or be well 303
below it, depending on the site. Leaving other prey items aside, the mismatch between 304
production and consumption can be interpreted as a mismatch in adequate size of the 305
TEZ surrounding rookeries and haulouts. In the case of Amchitka North, the TEZ would 306

13
either have to be extended or combined with other measures in the vicinity of the TEZ to 307
ensure enough Atka mackerel are available to sea lions without competition from 308
fisheries. Conversely, some TEZs and the management measures in their vicinity could 309
be revised to allow larger catches. This would seem to be the case of the Seguam TEZ, 310
where estimated production exceeds consumption even at high population levels of 311
Steller sea lions. In revising management measures and TEZs, we note that ensuring 312
production is not the only or ultimate goal of a TEZ. Reduced competition with fisheries 313
as well as conservation of preferred foraging grounds are also important. Atka mackerel 314
spawning grounds may make up preferred foraging grounds for Steller sea lions (Lauth et 315
al., 2007) which degrade as a consequence of fishing impacts (Cooper et al. this volume). 316
We recognize establishing colony-specific sizes of TEZs and other management 317
measures may be a time-consuming process, and propose this as a tool to evaluate and 318
refine TEZ efficacy after they have been implemented. Matching TEZs or protected areas 319
along with other management measures to the local condition of endangered or 320
threatened populations can better serve both conservation goals and fisheries interests. 321
322
323
Acknowledgements 324
Lowell Fritz, National Marine Mammal Laboratory, provided valuable guidance in the 325
use of the Steller sea lion data. Gavin Fay, Commonwealth Scientific and Research 326
Organization, was kind enough to update his sea lion population model results for our 327
use. Andre Punt, University of Washington, provided helpful comments on previous 328
versions of the manuscript. 329

14
References 330
Angliss R. P., and R. B. Outlaw. 2007. Stock Assmement of Steller Sea Lion 331
(Eumetopias jubatus): Western U.S. stock. NOAA Technical Memorandum NOAA-TM-332
AFSC-180. 333
334
Atkinson, S., D. P. DeMaster, and D. G. Calkins. 2008. Anthropogenic causes of the 335
western Steller sea lion Eumetopias jubatus population decline and their threat to 336
recovery. Mammal Review 38:1-18. 337
338
Aydin, K., S. Gaichas, I. Ortiz, D. Kinzey, and N. Friday. 2007. A Comparison of the 339
Bering Sea, Gulf of Alaska, and Aleutian Islands large marine ecosystems through food 340
web modeling. NOAA Technical Memorandum NMFS-AFSC-178. 341
342
Barbeaux, S., J. Ianelli, S. Gaichas, and M. Wilkins. 2007. Chapter 1a Stock Assessment 343
of Aleutian Islands Region Pollock. In: Stock Assessment and Fishery Evaluation Report 344
for the Groundfish Resources of the Bering Sea and Aleutian Islands, November 2005, 345
Section 1, p. 139-196. North Pacific Fishery Management Council, 605 W 4th Avenue, 346
Suite 306, Anchorage, AK 99501. Available at 347
http://www.afsc.noaa.gov/refm/docs/2007/AIpollock.pdf. Accessed 2/10/2009. 348
349
Cooper et al. this volume 350
351
Dillingham, P. W., J. R. Skalski, and K. E. Ryding. 2006. Fine-scale geographic 352
interactions between Steller sea lion (Eumetopias jubatus) trends and local fisheries. 353
Canadian Journal of fisheries and Aquatic Sciences 63:107-119. 354
355
Essington, T. E., J. F. Kitchell, and C. J. Walters, 2001. The von Bertalanffy growth 356
function, bioenergetics, and the consumption rates of fish. Canadian Journal of Fisheries 357
and Aquatic Sciences 58: 2129-2138. 358
359
15
Fritz, L. W., and E. S. Brown. 2005. Survey-and fishery-derived estimates of Pacific cod 360
(Gadus macrocephalus) biomass: implications for strategies to reduce interactions 361
between groundfish fisheries and Steller sea lions (Eumetopias jubatus). U. S. National 362
Marine Fisheries Service Fishery Bulletin 103:501-515. 363
364
Fritz, L. W., R. C. Ferrero, and R. J. Berg. 1995. The threatened status of the Steller sea 365
lion, Eumetopias jubatus, under the Endangered Species Act: effects on Alaska 366
groundfish fisheries management. Marine Fisheries Review 57(2):14–27. 367
368
Fritz, L. W., and Ferrero, R. C. 1998. Options in Steller sea lion recovery and groundfish 369
fishery management. Biosphere Conservation 1: 7–19. 370
Hennen, D. 2006. Associations between the Alaska Steller sea lion decline and 371
commercial fisheries. Ecological Applications 16:704-717. 372
Holmes, E. E., L. W. Fritz, A. E. York and K. Sweeney. 2007. Age-structured modeling 373
reveals long-term declines in the natality of western Steller sea lions. Ecological 374
Applications 17: 2214–2232 375
Hunt, G. L., Jr., H. Kato, and S. M. McKinnell. 2000. Predation by Marine Birds and 376
Mammals in the Subarctic North Pacific Ocean. PICES Scientific Report: 165. Sidney, 377
British Columbia, Canada, North Pacific Marine Science Organization. 378
Lauth, R. R., McEntire, S. W., and H. H. Zenger Jr. 2007. Geographic distribution, depth 379
range, and description of Atka mackerel Pleurogrammus monopterygius nesting habitat 380
in Alaska. Alaska Fishery Research Bulletin 12:165-186. 381
382
Logerwell, E. A., Aydin, K., Barbeaux, S., Brown, E., Conners, M. E., Lowe, S., Orr, J. 383
W., Ortiz, I., Reuter, R. and P. Spencer. 2005. Geographic patterns in demersal 384
ichthyofauna of the Aleutian Islands. Fisheries Oceanography 14 (Suppl. 1):93-112. 385
386

16
Loughlin, T. R. 1998. The Steller sea lion: A declining species. Biosphere Conservation 387
1: 91-98. 388
389
Loughlin, T. R., Perlov, A. S., and V. V. Vladimirov. 1992. Range-wide survey and 390
estimation of total number Steller sea lions in 1989. Marine Mammal Science 83:220-391
239. 392
393
Lowe, S., J. Ianelli, M. Wilkins, K. Aydin, R. Lauth, and I. Spies. 2008. Stock assessment 394
of Bering Sea/ Aleutian Islands Atka mackerel. In: Stock Assessment and Fishery 395
Evaluation Report for the Groundfish Resources of the Bering Sea and Aleutian Islands, 396
November 2005, Section 1, p. 39-126. North Pacific Fishery Management Council, 605 397
W 4th Avenue, Suite 306, Anchorage, AK 99501. Available at 398
http://www.afsc.noaa.gov/refm/docs/2008/BSAIatka.pdf. Accessed 2/10/2009. 399
400
McDermott, S. et al. this volume 401
402
National Research Council. 2003. Decline of the Steller sea lion in Alaskan waters: 403
Untangling food webs and fishing nets. The National Academies Press, Washington DC. 404
405
Ortiz, I. 2007. Ecosystem Dynamics of the Aleutian Islands. Doctoral dissertation, 406
University of Washington, Seattle. 407
408
Sinclair, E. H. and Zepplin, T. K. 2002. Seasonal and spatial differences in diet in the 409
western stock of Steller sea lions (Eumetopias jubatus). Journal of Mammalogy 83:973–410
990. 411
412
Thompson, G., J. Ianelli, R. Lauth, S. Gaichas, and K. Aydin. 2008. Chapter 2: 413
Assessment of the Pacific Cod Stock in the Eastern Bering Sea and Aleutian Islands 414
Area. In: Stock Assessment and Fishery Evaluation Report for the Groundfish Resources 415
of the Bering Sea and Aleutian Islands, November 2005, Section 1, p. 221-402. North 416

17
Pacific Fishery Management Council, 605 W 4th Avenue, Suite 306, Anchorage, AK 417
99501. Available at 418
http://www.afsc.noaa.gov/refm/docs/2008/BSAIpcod.pdf. Accessed 2/10/2009. 419
420
Wilderbuer, T. K., D. G. Nichol, and K. Aydin. 2008. Chapter 6. Arrowtooth Flounder. 421
In: Stock Assessment and Fishery Evaluation Report for the Groundfish Resources of the 422
Bering Sea and Aleutian Islands, November 2005, Section 1, p. 643-706. North Pacific 423
Fishery Management Council, 605 W 4th Avenue, Suite 306, Anchorage, AK 99501. 424
Available at 425
http://www.afsc.noaa.gov/refm/docs/2008/BSAIatf.pdf. Accessed 2/10/2009. 426
427
Winship, A. J., A. W. Trites, and D.A.S. Rosen. 2002. A bioenergetic model for 428
estimating the food requirements of Steller sea lions Eumetopias jubatus in Alaska, USA. 429
Marine Ecology Progress Series 229:291-312. 430
431
Wolf, N. and M. Mangel. 2008. Multiple hypothesis testing and the declining-population 432
paradigm in Steller sea lions. Ecological Applications 18: 1932-1955. 433
434
York, A. 1994. The population dynamics of northern sea lions, 1975-1985. Marine 435
Mammal Science 10:38-51. 436
437
Zeppelin, T. K., J. T. Tollit, K. A. Call, and C. J. Gudmundson. 2005. Sizes of walleye 438
pollock (Theragra chalcogramma) and Atka mackerel (Pleurogrammus monopterygius) 439
consumed by the western stock of Steller sea lions (Eumetopias jubatus) in Alaska from 440
1998 to 2000. U. S. National Marine Fisheries Service Fishery Bulletin 102:509-521. 441

18
Table 1. Summary of year-specific sample sizes and data sources for each site. 442
Data Sample size Source
Survey strata biomass 94 – 147 hauls AFSC
3-degree area CPUE 60 – 87 hauls AFSC
Fish stomach samples at each
3-degree area pooled for
2000-2006 (1997-2006 for
skates)
Pollock 204-349
Arrowtooth flounder 163-391
Halibut 33-115
Pacific cod 204-393
Skates 26-78
AFSC
Atka mackerel biomass 7,918 – 24,999 tagged fish released
46 – 769 tagged fish recovered
McDermott et al. (this
volume)
Steller sea lion biomass 1 – 12 sites Gavin Fay, CSIRO, personal
communication, Holmes
2007, York 1994, Fritz
AFSC-NMML, personal
communication
Steller sea lion diet
(1990-1999)
220 – 297 scats NMML
443
19
Table 2. Rookeries and haulouts of Steller sea lion included in each study site. 444
Site Haulout/Rookery
Seguam Seguam/ Saddleridge
Seguam Seguam/ Finch Point
Seguam Agligadak
Seguam Amlia/ East Cape
Seguam Sagigik
Seguam Amlia/ Sviech. Harbor
Seguam Amlia/ Cape Misty
Seguam Tanadak (Amlia)
Seguam Seguam/ Lava Point
Seguam Seguam/ SW Rip
Seguam Seguam/ Turf Point
Seguam Seguam/ Wharf Point
Tanaga Tag
Tanaga Ugidak
Tanaga Gramp Rock
Tanaga Kavalga
Tanaga Unalga/ Dinkum Rocks
Tanaga Ilak
Tanaga Tanaga. Cape Sasmik
Amchitka S Amchitka/ East Cape
Amchitka S Amchitka/ Chitka Point
Amchitka N Ayugadak
Amchitka N Rat
Amchitka N Amchitka/ Column Rock
Kiska Kiska/ Lief Cove
Kiska Kiska/ Cape St. Stephen
Kiska Kiska/ Sobaka-Vega
Kiska Kiska/ Witchcraft Point
Kiska Kiska/ Pillar Rock

20
Table 3. Parameters values used in von Bertalanffy equation 445
dt ttdkWW −
∞ −−−−= 1
1
0 ))))(1(exp(1(* with d set at 0.8. 446
W∞ k t0
Atka mackerel 800.29 3.17 -0.95
Walleye pollock 1038.9 2.41 -0.66
Pacific cod 16507.14 0.90 -0.99
Arrowtooth flounder 1209.52 1.34
-1.12

21
Table 4. Year/site-specific estimates used in model to calculate total amount of Atka 447
mackerel consumed. Biomass and amount eaten are in metric tons, QB, is shown for all 448
except Atka mackerel (Am) and is in metric tons consumed per metric ton of biomass, PB 449
is shown for Atka mackerel, metric tons produced per metric ton of biomass. 450
Skate
s
Arr
ow
too
th
flou
nder
P. C
od
P. H
alib
ut
W.
Pollo
ck
Ste
ller
se
a
lion
Atk
a
mackere
l
Seguam 2002
Biomass 4,336 7,941 2,742 2,593 24,207 284 273,452
Atka eaten 4 4,596 3,474 980 2,405 3,606
% Atka in diet 0.1 21.1 57.3 34.4 2.2 52.7
QB or PB 2.0 2.7 2.2 1.1 4.5 24.0 0.5
Tanaga 2002
Biomass 908 2,839 3,147 972 20,812 254 73,702
Atka eaten 1,361 6,852 5,358 597 6,273 3,291
% Atka in diet 75.0 88.0 77.0 55.8 6.7 53.8
QB or PB 2.0 2.7 2.2 1.1 4.5 24.0 0.5
Amchitka N 2003
Biomass 307 2,718 2,861 527 822 81 14,695
Atka eaten 334 6,092 4,255 111 0 792
% Atka in diet 54.3 81.9 68.2 19.2 0.0 40.7
QB or PB 2.0 2.7 2.2 1.1 4.5 24.0 0.5
Amchitka S 2003
Biomass 68 526 749 140 137 31 10,099
Atka eaten 74 1,179 1,113 30 0 305
% Atka in diet 54.3 81.9 68.2 19.2 0.0 40.7
QB or PB 2.0 2.7 2.2 1.1 4.5 24.0 0.5
Kiska 2006
Biomass 618 499 2,142 521 1,169 119 59,658
Atka eaten 671 1,090 3,068 110 0 1,162
% Atka in diet 54.3 81.9 68.2 19.2 0.0 40.7
QB or PB 2.0 2.7 2.1 1.1 4.5 24.0 0.6

22
Table 5. Annual consumption (metric tons/year) estimates for Steller sea lions from our 451
small-scale food web model and derived from Winship et al. (2002) daily estimates by 452
age. 453
Study site Food web model (this paper)
(t/y)
Winship et al. (2002)
(t/y)
Kiska 1162 1304
Amchitka North 792 888
Amchitka South 305 342
Tanaga 3291 3692
Seguam 3606 4046
454

23
Figure 1. Consumption of Atka mackerel by predators in the Aleutian Islands during the 455
early 1990s as estimated by Aydin et al. (2007). 456
Figure 2. Location of study sites in the Aleutian Islands Archipelago. 457
Figure 3. Individual study sites: top panel Seguam Pass, middle Tanaga Pass, bottom 458
Kiska, Amchitka North, and Amchitka South. 459
Figure 4. Contribution of Atka mackerel to fish diets (in percent by weight) and Steller 460
sea lions (SSL) diets in frequency of occurrence (FO). 461
Figure 5. Estimated biomass of each predator (circle area proportional to biomass with 462
largest circle representing 24,207 mt of walleye pollock in Seguam; smallest 31 mt of 463
Steller sea lions in Amchitka S) and estimated consumption (bars) by predator at each 464
study site. Results are year -specific: Kiska, 2006; Amchitka North and South, 2003; 465
Tanaga and Seguam, 2002. 466
Figure 6. Year-specific local production of Atka mackerel versus consumption of Atka 467
mackerel by main predators top panel: Kiska, 2006; Amchitka, 2003; Tanaga, 2002; 468
Seguam, 2002. Bottom panel shows total local consumption as estimated when using the 469
consumption by Steller sea lions biomass levels of 1977. Atka mackerel production at 470
Seguam was off the chart at 136,726 metric tons. 471
Figure 7. Mean length (mm) and 99% CI of Atka mackerel eaten by predators and 472
included in the biomass estimates at each study site (data for fish from AFSC feeding 473
habits database, length at size Susanne McDermott (AFSC, pers. comm.), prey size for 474
Steller sea lions from Zeppelin et al. 2005). 475
Figures 8a, b and c. Range of estimated production based on biomass estimates. Bars 476
denote consumption, Lines show Atka mackerel production estimated using the year-477
specific age structure applied to the upper 95%, lower 5% and median biomass. Top plot 478
(A) shows production estimate based on abundance of fish >30 cm. Middle plot (B) 479
shows production estimates based on adjusted biomass (+45%) to account for fish <30 480

24
cm. Bottom plot (C) shows production estimate based on the highest production rate 481
estimated from all years in stock assessment (1977-2008) and adjusted biomass. 482
483
Steller sea lions,
30.4%
Cod, 25.9%Pollock, 8.6%
Skates, 6.2%
Halibut, 3.1%
Arrowtooth, 1.3%
Fisheries, 20.9%
Other, 3.5%
484
Figure 1. 485
25
486
Figure 2. 487
26
488
489
490
Figure 3. 491

27
0%
25%
50%
75%
100%
Kiska/Amchitka Tanaga Seguam
% w
eig
ht in
fis
h d
iet, F
O in
SS
L d
iet
Skates
Arrowtooth
P. Cod
P. Halibut
W. Pollock
Steller sea lions
492
Figure 4. 493

28
pre
da
tor
bio
ma
ss
0
10
20
30
Kiska Amchitka N Amchitka S Tanaga Seguam
Atk
a m
ackere
l consum
ed (
thousand m
tons)
Steller SL
Pollock
Halibut
Cod
Arrowtooth
Skates
494
Figure 5. 495

29
496
0
10,000
20,000
30,000
40,000
50,000
2006 2003 2003 2002 2002
Kiska Amchitka N Amchitka S Tanaga Seguam
me
tric
to
ns
Atka Production
Consumption by
Steller SL
Pollock
Halibut
Cod
Arrowtooth
Skates
126,976
0
10,000
20,000
30,000
40,000
50,000
Kiska Amchitka N Amchitka S Tanaga Seguam
me
tric
to
ns
Atka Production
Consumption by
1977 Steller SL
Pollock
Halibut
Cod
Arrowtooth
Skates
126,976
497
Figure 6. 498
499
500

30
501
0
100
200
300
400
500
600
P. C
od
W. P
ollo
ck
Ska
tes
Arr
ow
too
th
flou
nd
er
P. H
alib
ut
SS
L
Kis
ka
Am
chitk
a
Ta
nag
a
Seg
ua
m
Le
ng
th (
mm
)
UPPER 99%
LOWER 99%
MEAN
502
Figure 7. 503

31
Atka consumed
vs Atka production
1
10
100
1000
10000
100000
1000000
Kiska Amchitka N Amchitka S Tanaga Seguam
Consumption
Production
(90% CI)
Atka consumed
vs Atka production
1
10
100
1000
10000
100000
1000000
Kiska Amchitka N Amchitka S Tanaga Seguam
Consumption
Production
(90% CI)
Atka consumed
vs Atka production
1
10
100
1000
10000
100000
1000000
Kiska Amchitka N Amchitka S Tanaga Seguam
Consumption
Production
(90% CI)
A 504
505
506
507
508
509
B 510
511
512
513
514
515
C 516
517
518
519
520
Figure 8. 521