Embed Size (px)
Citation preview
1
Ee
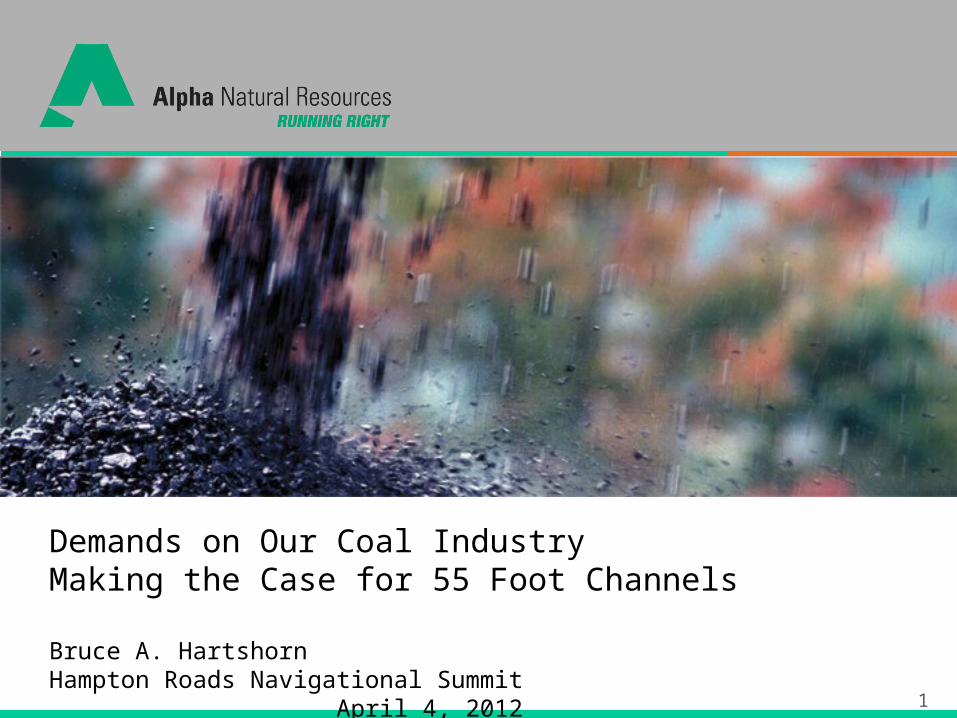
Demands on Our Coal IndustryMaking the Case for 55 Foot Channels
Bruce A. HartshornHampton Roads Navigational Summit April 4, 2012
2
Forward-Looking Statements
Statements in this presentation which are not statements of historical fact are “forward-looking statements” within the Safe
Harbor provision of the Private Securities Litigation Reform Act of 1995. Such statements are not guarantees of future
performance. Many factors could cause our actual results, performance or achievements, or industry results, to be materially
different from any future results, performance or achievements expressed or implied by such forward looking-statements.
These factors are discussed in detail in our Annual Report on Form 10-K, Quarterly Reports on Form 10-Q and in our other
filings with the SEC. We make forward-looking statements based on currently available information, and we assume no
obligation to update the statements made today or contained in our Annual Report or other filings due to changes in
underlying factors, new information, future developments, or otherwise, except as required by law.
Third Party Information
This presentation, including certain forward-looking statements herein, include information obtained from third party sources
that we believe to be reliable. However, we have not independently verified this third party information and cannot assure you
of its accuracy or completeness. While we are not aware of any misstatements regarding any third party data contained in
this presentation, such data involve risks and uncertainties and are subject to change based on various factors, including
those discussed detail in our Annual Report on Form 10-K, Quarterly Reports on Form 10-Q and in our other filings with the
SEC. We assume no obligation to revise or update this third party information to reflect future events or circumstances.
Legal Disclaimers

3
• DTA - owned by Alpha Natural Resources, Peabody Energy and Arch Coal
• Pier IX - owned by Kinder Morgan Terminals• CSX provides rail service to both
Dominion Terminal Associates and Pier IX Terminal, Newport News, VA Lambert’s Point Terminal, Norfolk, VA
• Norfolk Southern owns and provides rail service
Hampton Roads Coal
Terminals
Coal to Hampton Roads primarily originates in Central Appalachia - Virginia, West Virginia, and Kentucky

4
1936
1938
1940
1942
1944
1946
1948
1950
1952
1954
1956
1958
1960
1962
1964
1966
1968
1970
1972
1974
1976
1978
1980
1982
1984
1986
1988
1990
1992
1994
1996
1998
2000
2002
2004
2006
2008
2010
0.0
10.0
20.0
30.0
40.0
50.0
60.0
70.0
Historic Coal Exports in Hampton RoadsM
illio
n S
hort
Tons
1957: 52 million
1970: 48 million
1991: 59 million
2011:42.2 million
1980: 50 million
5
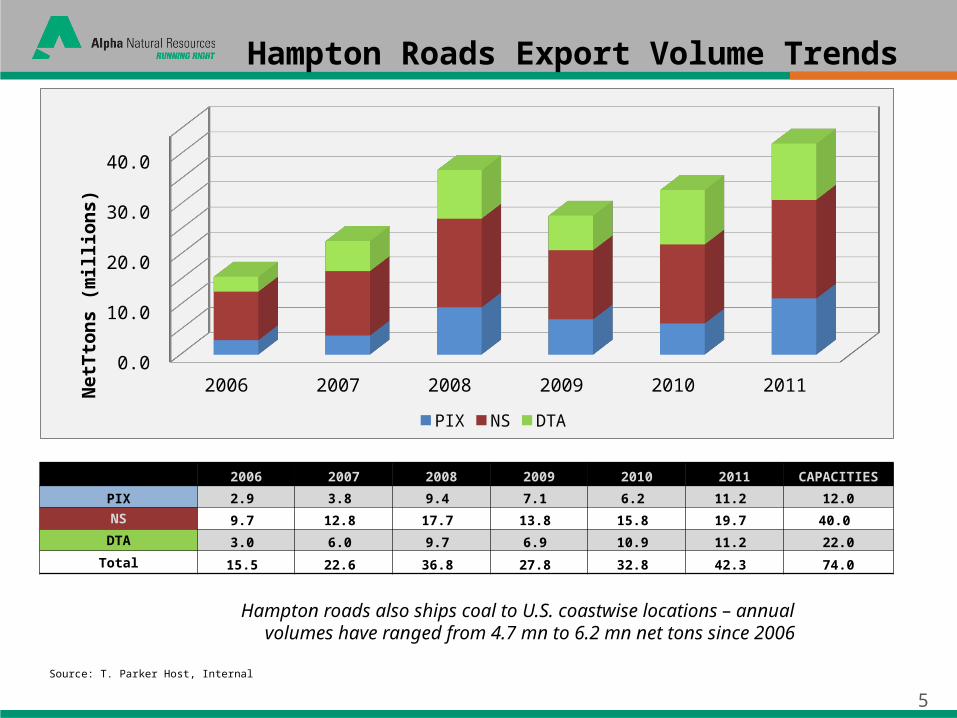
Hampton Roads Export Volume Trends
Hampton roads also ships coal to U.S. coastwise locations – annual volumes have ranged from 4.7 mn to 6.2 mn net tons since 2006
2006 2007 2008 2009 2010 2011 CAPACITIES
PIX 2.9 3.8 9.4 7.1 6.2 11.2 12.0NS 9.7 12.8 17.7 13.8 15.8 19.7 40.0
DTA 3.0 6.0 9.7 6.9 10.9 11.2 22.0
Total 15.5 22.6 36.8 27.8 32.8 42.3 74.0
Source: T. Parker Host, Internal
2006 2007 2008 2009 2010 20110.0 5.0 10.0 15.0 20.0 25.0 30.0 35.0 40.0 45.0
PIX NS DTA
NetTtons
(millions
)

6
Hampton Roads Exports by Coal Type
• Metallurgical volumes more than doubled from 2006, on strength in international steel markets and propelled by strong growth in Asia
• Steam volumes generally trending up on increasing world coal demand
2006 2007 2008 2009 2010 20110.0
5.0
10.0
15.0
20.0
25.0
30.0
35.0
40.0
0.0 2.1
8.7 6.6
4.5
8.5
15.5
20.5
28.1
21.1
28.4
33.6
Steam Metallurgical
Net
To
ns
(mill
ion
s)
Source: T. Parker Host, Internal

7
Hampton Roads Top Ten Export Countries - 2006 vs. 2011
2006 SHIPMENTS (mn net tons) ITALY 3.4 BRAZIL 2.5 BELGIUM 1.8 UNITED KINGDOM 1.7 FRANCE 1.1 INDIA .8 SPAIN .7 TURKEY .7 EGYPT .6 SWEDEN .4
Source: T. Parker Host, Internal
ITALY25%
BRAZIL19%
BELGIUM13%
UNITED KINGDOM12%
FRANCE8%
INDIA6%
SPAIN5%
TURKEY5%
EGYPT4%
SWEDEN3%
2006
2011 SHIPMENTS (mm net tons) ITALY 4.9 BRAZIL 4.8 NETHERLANDS 4.6 INDIA 2.9 FRANCE 2.8 UKRAINE 2.5 KOREA 2.3 JAPAN 2.2 U.K. 1.8 TURKEY 1.7
ITALY16%
BRAZIL16%
NETHERLANDS15%
INDIA10%
FRANCE9%
UKRAINE8%
KOREA7%
JAPAN7%
U.K.6%
TURKEY5% 2011
8
Sources: JT Boyd, Wood Mackenzie
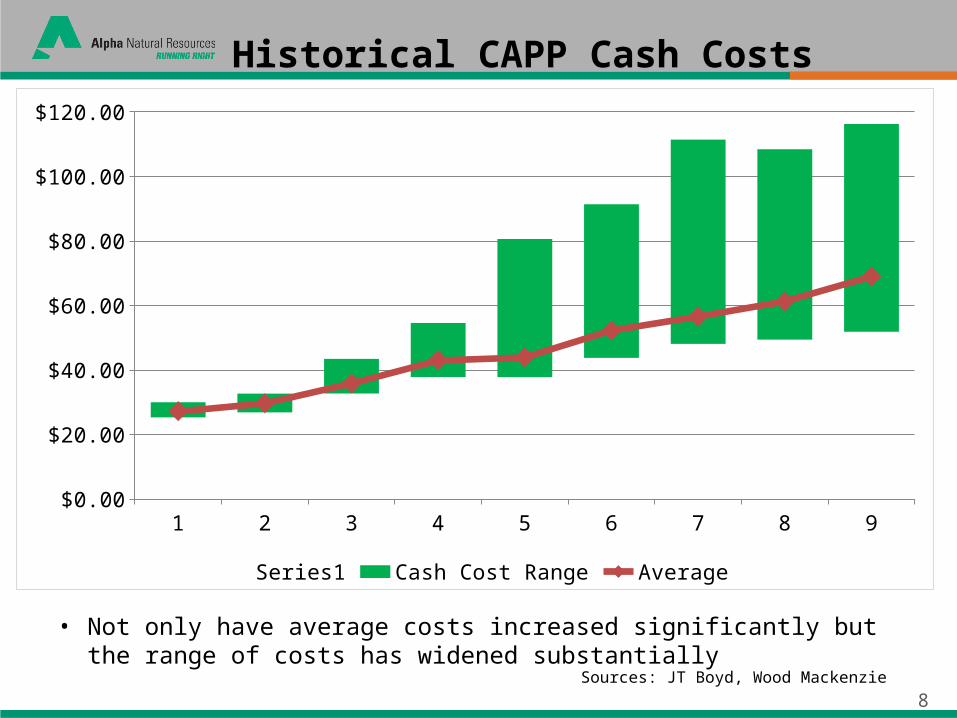
Historical CAPP Cash Costs
Sources: JT Boyd, Wood Mackenzie
1 2 3 4 5 6 7 8 9$0.00
$20.00
$40.00
$60.00
$80.00
$100.00
$120.00
Series1 Cash Cost Range Average
• Not only have average costs increased significantly but the range of costs has widened substantially

9 Source: SSY
Capesize Fleet (150-180,000 dwt) by Year of Build
April 2012
0.0
4.0
8.0
12.0
16.0
20.0
24.0P
re-8
51
98
51
98
61
98
71
98
81
98
91
99
01
99
11
99
21
99
31
99
41
99
51
99
61
99
71
99
81
99
92
00
02
00
12
00
22
00
32
00
42
00
52
00
62
00
72
00
82
00
92
01
02
01
12
01
22
01
32
01
42
01
5
Millio
n D
wt
150-159,999 160-169,999 170-180,000

10
M/V CAPE DOVER
Capesize VesselYear Built: 2006
LOA: 290 mBeam: 47m
185,805 MT DWT
11
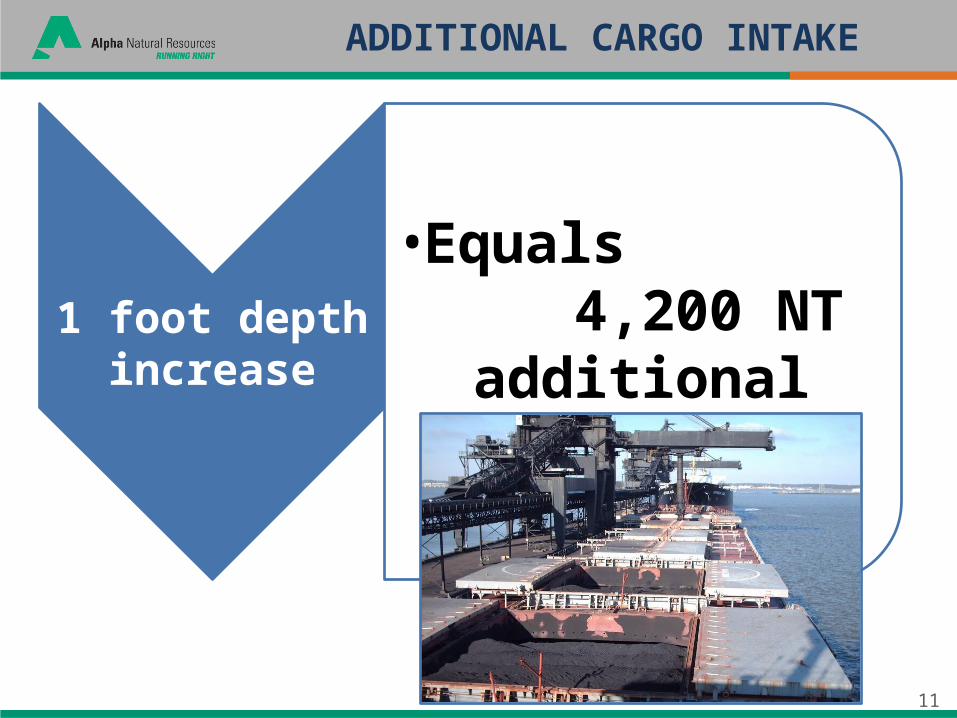
1 foot depth increase
•Equals 4,200 NT additional
cargo intake
ADDITIONAL CARGO INTAKE

12
CARGO INTAKE: M/V CAPE DOVER
55 ft: 172,017 NT
(+13.91%)
50 ft: 151,017
NT
13
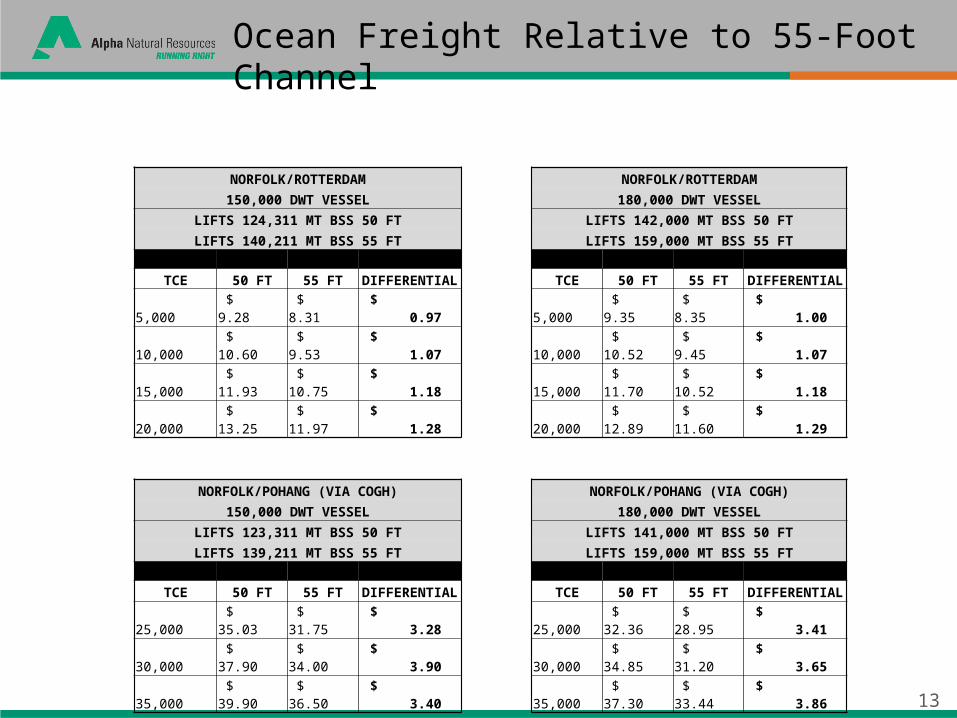
NORFOLK/ROTTERDAM NORFOLK/ROTTERDAM
150,000 DWT VESSEL 180,000 DWT VESSEL
LIFTS 124,311 MT BSS 50 FT LIFTS 142,000 MT BSS 50 FT
LIFTS 140,211 MT BSS 55 FT LIFTS 159,000 MT BSS 55 FT
TCE 50 FT 55 FT DIFFERENTIAL TCE 50 FT 55 FT DIFFERENTIAL
5,000 $ 9.28 $ 8.31 $ 0.97 5,000 $ 9.35 $ 8.35 $ 1.00
10,000 $ 10.60 $ 9.53 $ 1.07 10,000 $ 10.52 $ 9.45 $ 1.07
15,000 $ 11.93 $ 10.75 $ 1.18 15,000 $ 11.70 $ 10.52 $ 1.18
20,000 $ 13.25 $ 11.97 $ 1.28 20,000 $ 12.89 $ 11.60 $ 1.29
NORFOLK/POHANG (VIA COGH) NORFOLK/POHANG (VIA COGH)
150,000 DWT VESSEL 180,000 DWT VESSEL
LIFTS 123,311 MT BSS 50 FT LIFTS 141,000 MT BSS 50 FT
LIFTS 139,211 MT BSS 55 FT LIFTS 159,000 MT BSS 55 FT
TCE 50 FT 55 FT DIFFERENTIAL TCE 50 FT 55 FT DIFFERENTIAL
25,000 $ 35.03 $ 31.75 $ 3.28 25,000 $ 32.36 $ 28.95 $ 3.41
30,000 $ 37.90 $ 34.00 $ 3.90 30,000 $ 34.85 $ 31.20 $ 3.65
35,000 $ 39.90 $ 36.50 $ 3.40 35,000 $ 37.30 $ 33.44 $ 3.86
Ocean Freight Relative to 55-Foot Channel
14
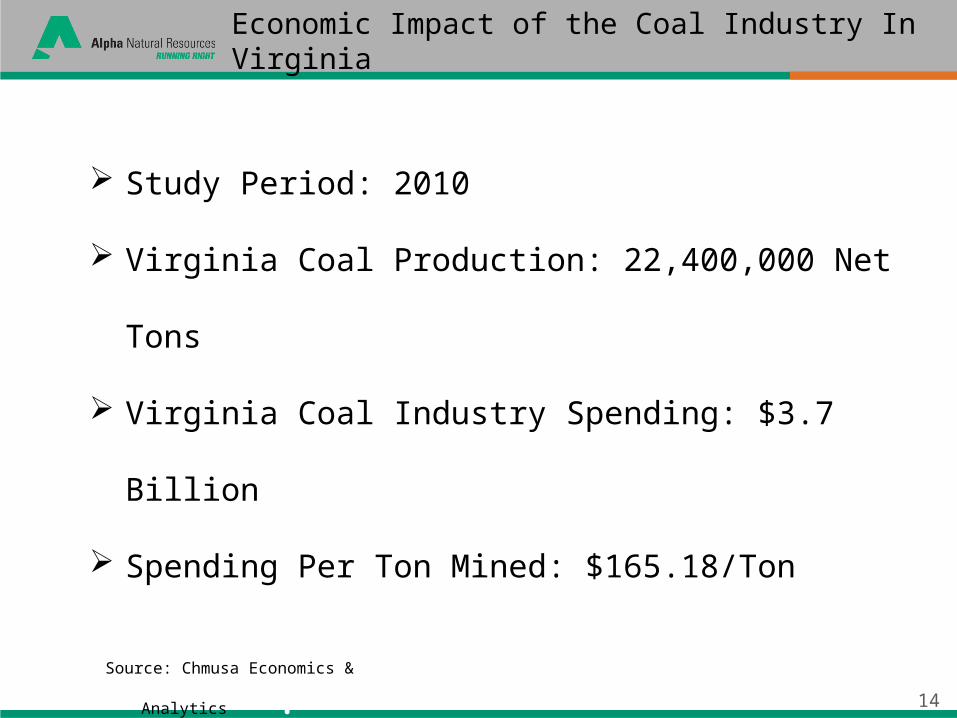
Economic Impact of the Coal Industry In Virginia
Source: Chmusa Economics & Analytics**.
*8222
Study Period: 2010
Virginia Coal Production: 22,400,000 Net Tons
Virginia Coal Industry Spending: $3.7 Billion
Spending Per Ton Mined: $165.18/Ton

15
Cost of Dredging
to 55 feet:$150,000,00
0
Potential Annual
Economic Benefit /
Destruction: $1,650,000,
000*
55-FOOT DREDGE PROJECT
*Basis 10.0 million tons
1616
www.alphanr.com