Embed Size (px)
Citation preview

1
EDUCATION IN KENYA: CHALLENGES AND POLICY
RESPONSES
Paper Prepared for Presentation at Paper Prepared for Presentation at the Council on Foreign Relationsthe Council on Foreign Relations
Washington DCWashington DC
ByByProf George SaitotiProf George Saitoti
Minister for Education, Science and Technology,Minister for Education, Science and Technology,
Government of KenyaGovernment of Kenya
April 2004April 2004

2
1. Introduction
This presentation is organized as follows:This presentation is organized as follows:
(a) A brief overview of Kenya and challenges that (a) A brief overview of Kenya and challenges that the country is faced with;the country is faced with;
(b) A broad overview of Kenya’s education system (b) A broad overview of Kenya’s education system and the challenges facing the sector; and the challenges facing the sector;
(c) Policy responses with an emphasis on the (c) Policy responses with an emphasis on the implementation of free primary education; andimplementation of free primary education; and
(d) Concluding remarks(d) Concluding remarks

3
1.1 Kenya Basic Facts and Indicators Population 32 million with 57% between ages 0-19 years—Population 32 million with 57% between ages 0-19 years—
meaning high dependency rates;meaning high dependency rates; Economic performance-strong during 1960s and early 1970s; Economic performance-strong during 1960s and early 1970s;
slowed in 1980s and 1990s;slowed in 1980s and 1990s; The poor performance of the economy attributed to a The poor performance of the economy attributed to a
combination of factors including drought, poor donor relations, combination of factors including drought, poor donor relations, ethnic conflict associated with transition to multiparty ethnic conflict associated with transition to multiparty democracy, advent of HIV/AIDS, weak institutions and democracy, advent of HIV/AIDS, weak institutions and governance;governance;
Economy largely dependent on rain-fed agriculture, but Economy largely dependent on rain-fed agriculture, but increasingly diversifying into services and horticultureincreasingly diversifying into services and horticulture
Government spending is about 22% of GDP, education takes Government spending is about 22% of GDP, education takes largest share of government spending.largest share of government spending.

4
Indicator 1997 1998 1999 2000 2001 2002
Real Gross Domestic Product (%)
2.4 1.8 1.4 -0.3 1.2 1.1
Real GDP per capita (%)
-0.6 -1.1 -1.5 -2.6 -0.6 -1.1
Real agricultural output
1.0 1.5 1.2 -2.4 2.0 0.7
Real manufacturing output
1.9 1.4 1.0 -1.5 0.8 1.2
Source: Economic Commission for Africa, 2003; World Bank, 2000; Economic Survey 2003
Key economic indicators’ annual growth rate (1997-2002)(Table 1)
5
1997/98
1998/99
1999/00
2000/01
2001/02
2002/03
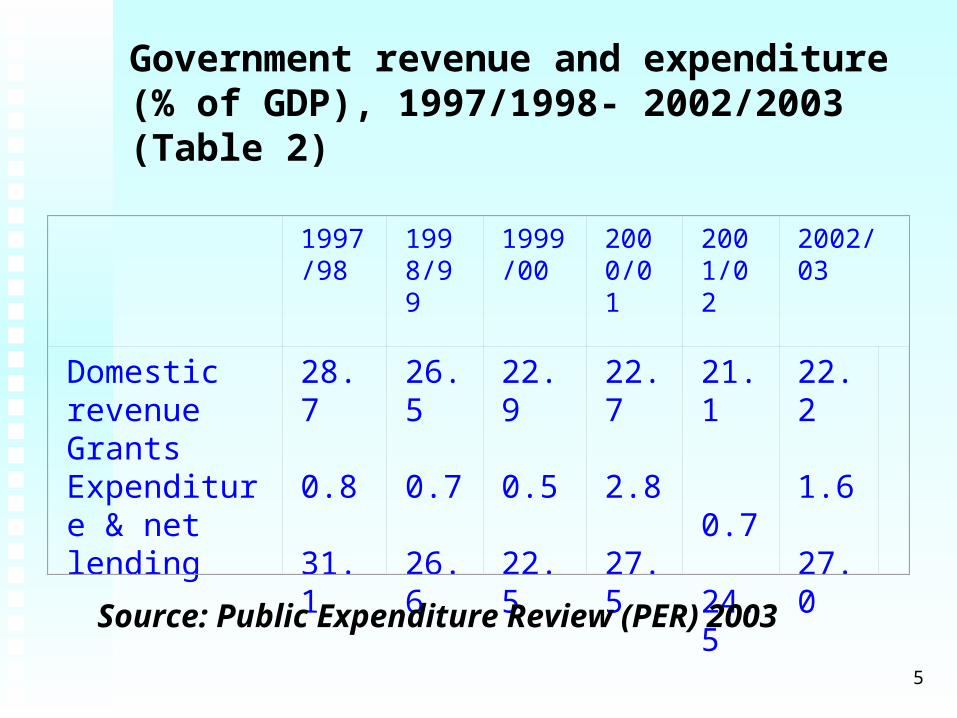
Domestic revenueGrantsExpenditure & net lending
28.7 0.8
31.1
26.5 0.7
26.6
22.9 0.5
22.5
22.7 2.8
27.5
21.1
0.7
24.5
22.2 1.6
27.0
Source: Public Expenditure Review (PER) 2003
Government revenue and expenditure (% of GDP), 1997/1998- 2002/2003 (Table 2)

6
1.2 Sectors’ Share in public expenditure
Education takes one of the largest share of Education takes one of the largest share of resources allocated to a single function.resources allocated to a single function.
The figure below provides details of the The figure below provides details of the share of public expenditure by sector for share of public expenditure by sector for 2002/2003 financial year.2002/2003 financial year.
At about 20%, education sector is one of the At about 20%, education sector is one of the priority sectors in government expenditure.priority sectors in government expenditure.

7
Defense and public
administration29%
Education20%
Health6%
Housing1%
Economic services
13%
Other services14%
Debt service17%
Share of the Public expenditure by sector, 2002/03 financial year

8
1.3 Kenya: Key Challenges Poverty – 57% of the population live in poverty Poverty – 57% of the population live in poverty
(Table 6(Table 6))
HIV/AIDS – prevalence- 9.4% (Table 5)HIV/AIDS – prevalence- 9.4% (Table 5) Malaria – costly and reduces productivityMalaria – costly and reduces productivity income distribution – inequality very highincome distribution – inequality very high Limited access to development goods-health, Limited access to development goods-health,
education, clean water, etc.education, clean water, etc. Poor infrastructure (hence cost of doing business), Poor infrastructure (hence cost of doing business),
crimecrime Entrenching democracy, constitutional reform.Entrenching democracy, constitutional reform.

9
Headcount poverty indices in Kenya: 1994-2000(Table 6)
1994 1997 2000
Rural 46.75 52.93 52.56
Urban 28.95 49.20 51.48
National 43.84 52.32 56.78

10
1.4 HIV/AIDS HIV/AIDS impacts on social economic development. HIV/AIDS impacts on social economic development. HIV/AIDS causes:HIV/AIDS causes:
a reduction in size and quality of the labour a reduction in size and quality of the labour force, force,
increases healthcare expenditure, increases healthcare expenditure, raises the cost of labour andraises the cost of labour and reduces savings and investment. reduces savings and investment.
Figure 2 shows HIV prevalence from 1990 to 1998. Figure 2 shows HIV prevalence from 1990 to 1998. In 2000 the HIV prevalence was 13.4% In 2000 the HIV prevalence was 13.4% Declining to 9.4% in 2003.Declining to 9.4% in 2003.

11
0.02.04.06.08.010.012.014.016.018.020.0
19901991199219931994199519961997199819992000200120022003
Years
HIV
Pre
vale
nce(
%)
NationalUrban
Rural
HIV Prevalence in Kenya, 1990-2003 (Figure 2)

12
2.0 Structure of Kenya’s Education System
The education and training sector contains :The education and training sector contains : Early Childhood Development and Pre-school Early Childhood Development and Pre-school
EducationEducation Primary EducationPrimary Education Secondary EducationSecondary Education University EducationUniversity Education Technical and Vocational Education and TrainingTechnical and Vocational Education and Training Teacher Education and TrainingTeacher Education and Training Non-formal Education and Adult EducationNon-formal Education and Adult Education Special EducationSpecial Education

13
UNIVERSITY EDUCATION(4 to 6 years)
SECONDARY EDUCATION(4 years)
MIDDLE LEVEL COLLEGES(Maximum of 3 years)
These include:•NATIONAL POLYTECHNICS• TEACHER TRAINING COLLEGES•VOCATIONAL AND TECHNICAL EDUCATION AND TRAINING(These include; Technical Training Institutes, Institutes of Technology, and National Polytechnics).
YOUTH/VILLAGEPOLYTECHNIC
KEY Indicates a strong link (formalized). Indicates weak link (if there is any link). Some links are in the process of being strengthened *This structure was implemented in 1985, to replace 7-4-2-3 i.e 7 years primary, 4 years at ordinary level, 2 years at advance level and 3 years at the university
THE STRUCTURE OF KENYA’S EDUCATION SYSTEM
PRIMARY EDUCATION(8 years)

14
2.1 Primary Education
Is first phase of formal education system. Is first phase of formal education system. The start age is 6 years and runs for 8 years.The start age is 6 years and runs for 8 years. Promotes growth, imparts literacy and Promotes growth, imparts literacy and
numeracy skills.numeracy skills. Lays a firm foundation for further formal Lays a firm foundation for further formal
education and training and life-long learning.education and training and life-long learning.

15
Challenges in primary education
Declining enrollments in primary school (before Declining enrollments in primary school (before 2003)2003)
- Cost- Cost
- Low access, retention and completion rates- Low access, retention and completion rates
- Poverty- Poverty
-HIV/AIDS-HIV/AIDS
- Distance and poor facilities- Distance and poor facilities
- Books- Books
- Low private returns to primary education- Low private returns to primary education
16
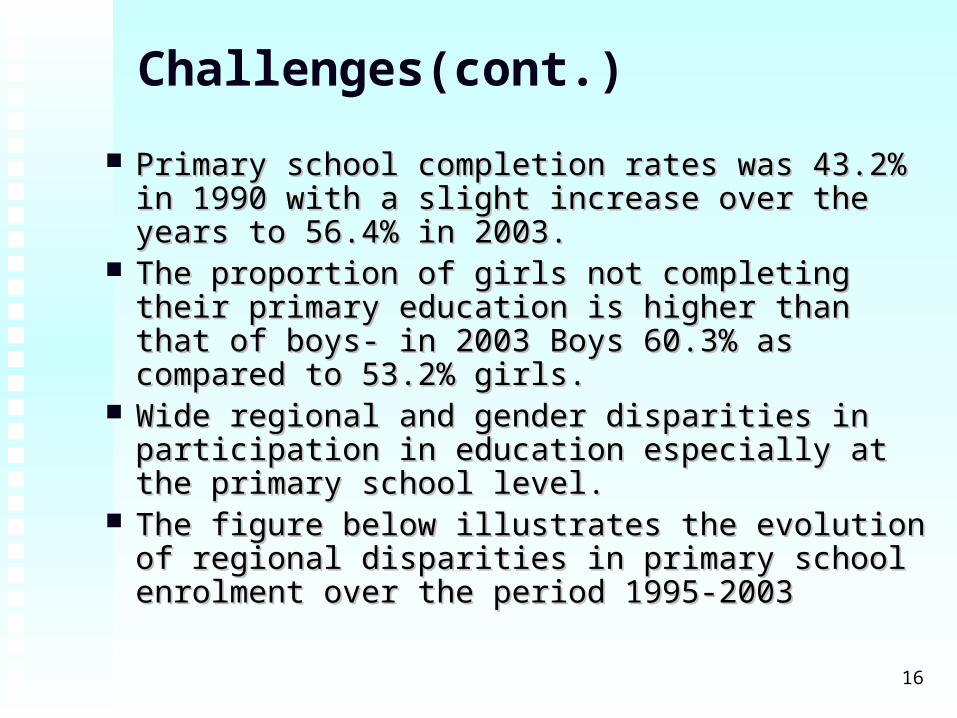
Challenges(cont.)
Primary school completion rates was 43.2% in 1990 Primary school completion rates was 43.2% in 1990 with a slight increase over the years to 56.4% in with a slight increase over the years to 56.4% in 2003.2003.
The proportion of girls not completing their primary The proportion of girls not completing their primary education is higher than that of boys- in 2003 Boys education is higher than that of boys- in 2003 Boys 60.3% as compared to 53.2% girls.60.3% as compared to 53.2% girls.
Wide regional and gender disparities in participation Wide regional and gender disparities in participation in education especially at the primary school level. in education especially at the primary school level.
The figure below illustrates the evolution of regional The figure below illustrates the evolution of regional disparities in primary school enrolment over the disparities in primary school enrolment over the period 1995-2003 period 1995-2003

17
Primary school enrollment by province, 1994-2003
0
20
40
60
80
100
120
1995 1996 1997 1998 1999 2000 2001 2002 2003
Year
% o
f Sch
ool g
oing
age p
opul
ation
Central
Coast
Eastern
NAIROBI
North Eastern
Nyanza
Rift Valley
Western

18
2.2 Secondary Education
Secondary education caters for primary Secondary education caters for primary school leavers in the 14-17 years age group. school leavers in the 14-17 years age group.
There are about 3,500 public and 500 private There are about 3,500 public and 500 private secondary schools secondary schools
The net enrolment is about 22% of the The net enrolment is about 22% of the eligible age group.eligible age group.

19
Enrolment and Completion rates
The enrollment rates for both males (24.0%) The enrollment rates for both males (24.0%) and females are very low(21.4%). and females are very low(21.4%).
There are wide disparities across There are wide disparities across administrative regions of the countryadministrative regions of the country . .
About 79% of students joining secondary About 79% of students joining secondary school complete their secondary education. school complete their secondary education.

20
Transition from primary to secondary education
Transition rate from primary to secondary Transition rate from primary to secondary schools is low, with only less than 50% of schools is low, with only less than 50% of primary school graduates entering secondary primary school graduates entering secondary school.school.
The low transition rates are due to several The low transition rates are due to several factors:factors:
Low quality of some of the existing Low quality of some of the existing secondary schools,secondary schools,
High cost of secondary education, High cost of secondary education, Lack of perceived incentives to continue Lack of perceived incentives to continue
education.education.

21
Challenges in secondary education- High drop out rates(21% do not complete)High drop out rates(21% do not complete)- poor performancepoor performance- limited spaces in secondary schoolslimited spaces in secondary schools- cost of secondary educationcost of secondary education- rigidity of academic programsrigidity of academic programs- poverty and impact of HIV/AIDSpoverty and impact of HIV/AIDS

22
Challenges cont...
student/teacher ratio high student/teacher ratio high textbooks and other complements inadequatetextbooks and other complements inadequate
equipment-especially science laboratories inadequateequipment-especially science laboratories inadequate InequalitiesInequalities
- regional and gender disparities- regional and gender disparities- gender gender - limited opportunities for handicapped populationlimited opportunities for handicapped population

23
2.3 University Education Kenya hasKenya has
6 public universities 6 public universities 17 private universities.17 private universities.
Undergraduate education takes a minimum Undergraduate education takes a minimum of 4 academic years.of 4 academic years.
Enrollment is about 63,000 students.Enrollment is about 63,000 students. Annual intake into public universities is Annual intake into public universities is
about 10,000 and Private universities , about 10,000 and Private universities , 6,000.6,000.

24
University Education(cont)
University education in public universities University education in public universities in Kenya is mainly financed by the in Kenya is mainly financed by the government.government.
The government (through the Higher The government (through the Higher Education Loans Board) provides loans to Education Loans Board) provides loans to needy students. needy students.

25
Challenges in university education
Limited physical facilities leading to low Limited physical facilities leading to low access and participation rates(10%)access and participation rates(10%)
Poorly equipped (Lecture theatres, Poorly equipped (Lecture theatres, laboratories, workshops etc.)laboratories, workshops etc.)
Cost – unaffordable to majority of KenyansCost – unaffordable to majority of Kenyans Mismatch of training programmes with the Mismatch of training programmes with the
labour market.labour market.

26
2.4 Tertiary Education
Tertiary education covers, Technical Tertiary education covers, Technical training Institutes, Institutes of Technology training Institutes, Institutes of Technology and National Polytechnics.and National Polytechnics.
Other middle level colleges including Other middle level colleges including Youth polytechnics.Youth polytechnics.
They form Technical Vocational and They form Technical Vocational and Education Training(TVET)Education Training(TVET)

27
Challenges in Tertiary Education Under utilization of the capacity of Under utilization of the capacity of
TVET institutions and the non-TVET institutions and the non-relevance of some of their training relevance of some of their training programmesprogrammes
Poor management and governance of Poor management and governance of TVET institutions.TVET institutions.
Lack of enough trained Lack of enough trained teachers/instructorsteachers/instructors
Lack of facilities/equipment.Lack of facilities/equipment.

28
3.0 POLICY RESPONSES
Universal Free Primary EducationUniversal Free Primary Education Targeted subsidies to those in secondary Targeted subsidies to those in secondary
and post-secondary institutionsand post-secondary institutions Loan schemes for higher educationLoan schemes for higher education Involvement of stakeholders in formulation Involvement of stakeholders in formulation
of education policyof education policy

29
Policy responses(cont)Private-public partnerships in education Private-public partnerships in education
financingfinancing
Strengthening inspectorate and school Strengthening inspectorate and school audits; accountability and transparency in audits; accountability and transparency in school managementschool management
Periodic review of curriculum to ensure Periodic review of curriculum to ensure relevance.relevance.
School feeding programme in ASAL and School feeding programme in ASAL and urban slums.urban slums.

30
4.0 Free Primary Education
The National Rainbow Coalition (NARC) The National Rainbow Coalition (NARC) government introduced Free Primary Education government introduced Free Primary Education (FPE) in January 2003.(FPE) in January 2003.
Primary school completion rates was 43.2% in Primary school completion rates was 43.2% in 1990 with a slight increase over the years to 56.4% 1990 with a slight increase over the years to 56.4% in 2003.in 2003.
The proportion of girls not completing their The proportion of girls not completing their primary education is higher than that of boys- in primary education is higher than that of boys- in 2003 boys 60.3% as compared to 53.2% girls.2003 boys 60.3% as compared to 53.2% girls.
Wide regional and gender disparities in Wide regional and gender disparities in participation in education especially at the primary participation in education especially at the primary school level. school level.

31
Free Primary Education (cont.)
Under the policy of FPE, all fees and levies for Under the policy of FPE, all fees and levies for primary education have been abolished.primary education have been abolished.
Besides meeting teachers’ salaries, the Besides meeting teachers’ salaries, the government committed to provide teaching and government committed to provide teaching and learning materials. learning materials.
Kshs. 650 is being disbursed for each pupil Kshs. 650 is being disbursed for each pupil annually towards teaching and learning materials annually towards teaching and learning materials
Another Kshs. 370 per pupil is to cover Another Kshs. 370 per pupil is to cover operational and other maintenance functions.operational and other maintenance functions.
32
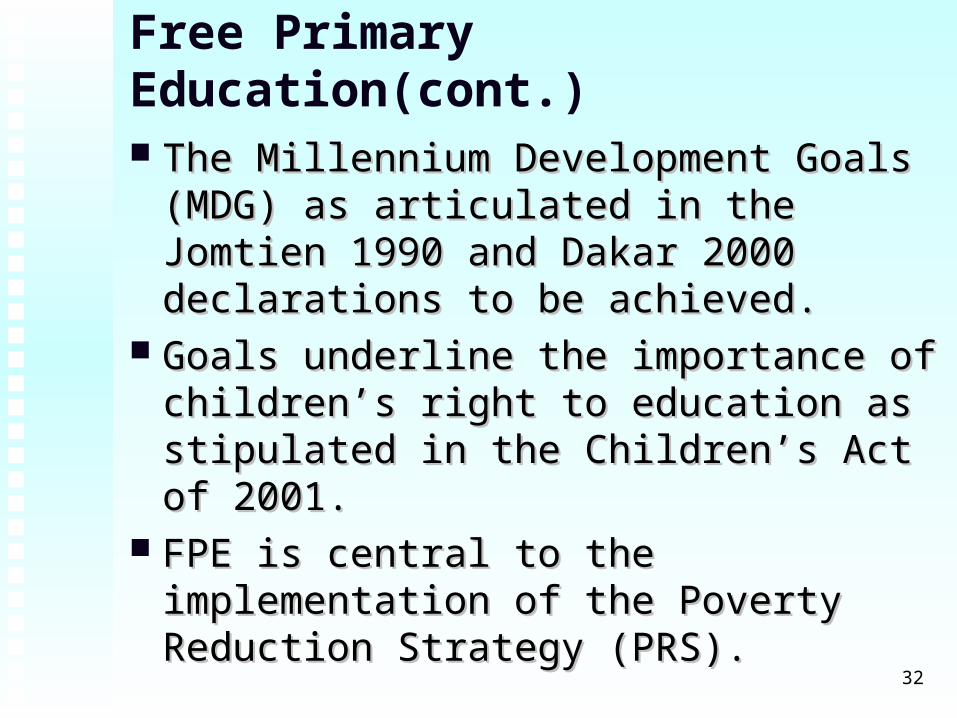
Free Primary Education(cont.)
The Millennium Development Goals (MDG) The Millennium Development Goals (MDG) as articulated in the Jomtien 1990 and Dakar as articulated in the Jomtien 1990 and Dakar 2000 declarations to be achieved.2000 declarations to be achieved.
Goals underline the importance of children’s Goals underline the importance of children’s right to education as stipulated in the right to education as stipulated in the Children’s Act of 2001. Children’s Act of 2001.
FPE is central to the implementation of the FPE is central to the implementation of the Poverty Reduction Strategy (PRS).Poverty Reduction Strategy (PRS).
33
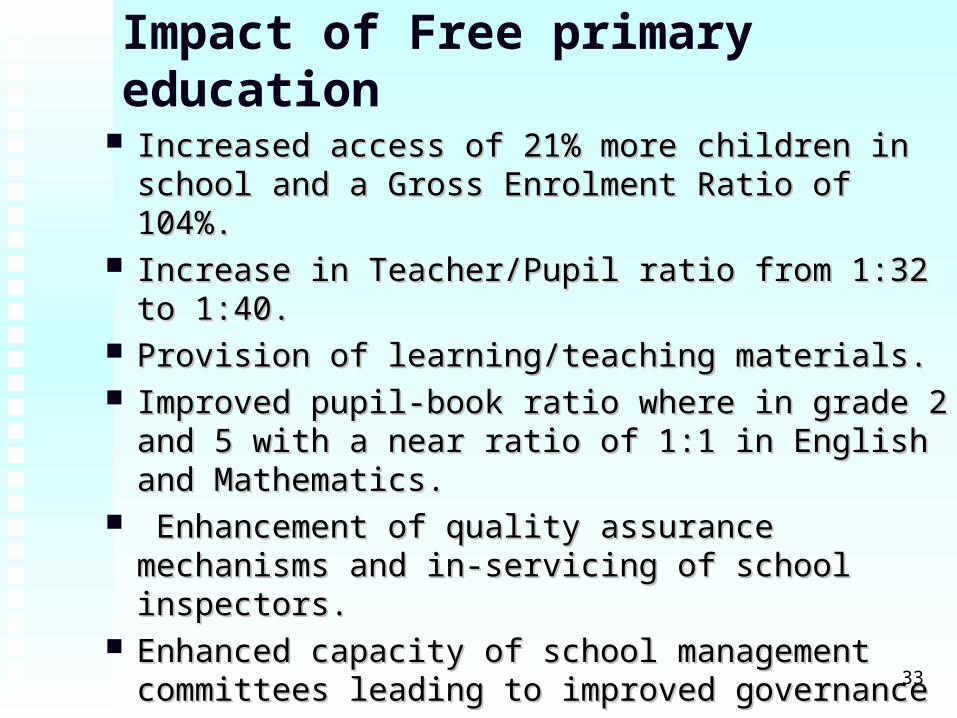
Impact of Free primary education
Increased access of 21% more children in school and Increased access of 21% more children in school and a Gross Enrolment Ratio of 104%.a Gross Enrolment Ratio of 104%.
Increase in Teacher/Pupil ratio from 1:32 to 1:40.Increase in Teacher/Pupil ratio from 1:32 to 1:40. Provision of learning/teaching materials.Provision of learning/teaching materials. Improved pupil-book ratio where in grade 2 and 5 Improved pupil-book ratio where in grade 2 and 5
with a near ratio of 1:1 in English and Mathematics.with a near ratio of 1:1 in English and Mathematics. Enhancement of quality assurance mechanisms and Enhancement of quality assurance mechanisms and
in-servicing of school inspectors.in-servicing of school inspectors. Enhanced capacity of school management committees Enhanced capacity of school management committees
leading to improved governanceleading to improved governance

34
80828486889092949698
100102104106108
Year
Per
cen
tage Boys
Girls
Total
Primary Schools Gross Enrolment Ratio, 1990-2003
35
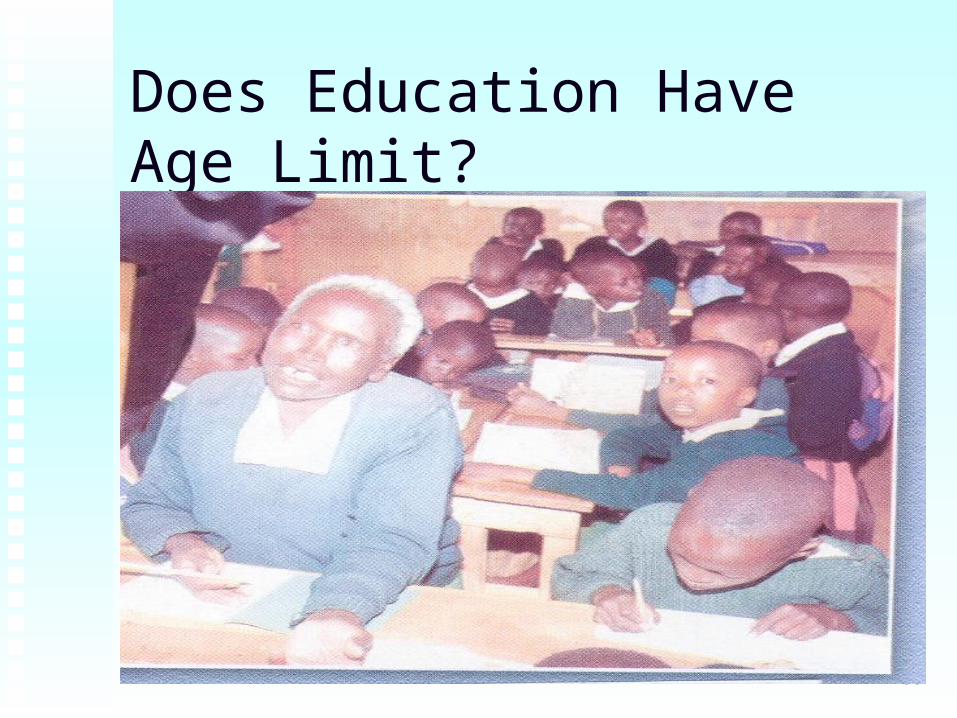
Does Education Have Age Limit?

36
Education for all

37
5.0. CONCLUSION Kenya is faced with many challenges in the Kenya is faced with many challenges in the
education sector- but government committed to education sector- but government committed to tackling them with the assistance from development tackling them with the assistance from development partners.partners.
In 2003 the new Government implemented its In 2003 the new Government implemented its campaign pledges by making primary school campaign pledges by making primary school education free (FPE) to all children. education free (FPE) to all children.

38
Conclusion cont..
The Government is determined to build The Government is determined to build strong partnership to address major strong partnership to address major challenges facing the education sector.challenges facing the education sector.
A National Conference on Education A National Conference on Education Training was convened between 27 and 29 Training was convened between 27 and 29 November 2003. November 2003.
The conference yielded a wide range of The conference yielded a wide range of policy recommendations across all levels of policy recommendations across all levels of the education sector.the education sector.
39
National Conference on Education and Training- charting the way forward
The key policy issues from the conference include:The key policy issues from the conference include: The need for review of teachers’ normsThe need for review of teachers’ norms Cost-effective expansion of secondary educationCost-effective expansion of secondary education Diversification of financingDiversification of financing Review of early childhood developmentReview of early childhood development Possible legislative changes, and Possible legislative changes, and Strengthening of information communication Strengthening of information communication
technologytechnology The Ministry of Education, Science and Technology The Ministry of Education, Science and Technology
is collating the recommendations and resolutions.is collating the recommendations and resolutions. A Sessional Paper will be prepared for presentation A Sessional Paper will be prepared for presentation
to Parliament.to Parliament.

40
Way Forward(cont.) The Government has formulated an The Government has formulated an Economic Economic
Recovery Plan Recovery Plan to reverse the general economic to reverse the general economic decline. decline.
The The planplan is to encourage private sector investments. is to encourage private sector investments. To create wealth and employment opportunities.To create wealth and employment opportunities. The Government is targeting improvement in The Government is targeting improvement in
governance.governance. Improving access to basic services is a priority.Improving access to basic services is a priority. Goal is to empower all Kenyans to acquire skills for Goal is to empower all Kenyans to acquire skills for
productive employment in the long runproductive employment in the long run. .

41
END
Thank youThank you


![[The Development of Public Relations in] Kenya](https://img.pdfslide.us/doc/110x75/61570288a097e25c76500caf/the-development-of-public-relations-in-kenya.jpg)