Embed Size (px)
Citation preview
1
CRP 834: Decision Analysis
Week Eight Notes
2
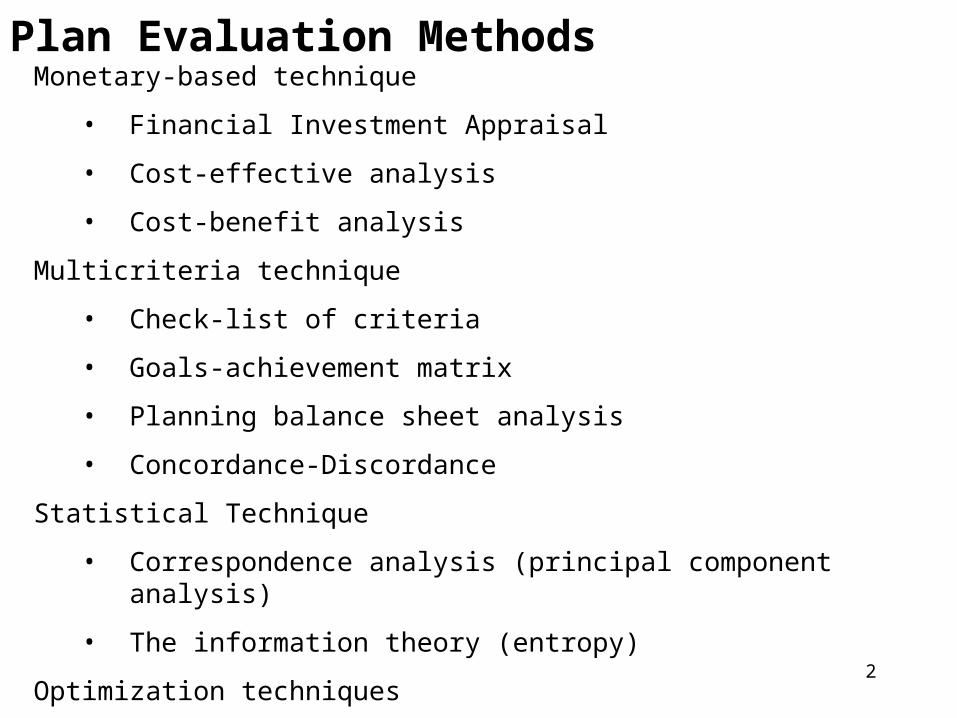
Plan Evaluation MethodsMonetary-based technique
• Financial Investment Appraisal
• Cost-effective analysis
• Cost-benefit analysis
Multicriteria technique
• Check-list of criteria
• Goals-achievement matrix
• Planning balance sheet analysis
• Concordance-Discordance
Statistical Technique
• Correspondence analysis (principal component analysis)
• The information theory (entropy)
Optimization techniques
• Multi-Objective Programming
3
Review of Cost-Benefit Analysis
– Monetary-based technique
– When evaluating over time, need to consider discount rate
– The concept of consumer surplus
4
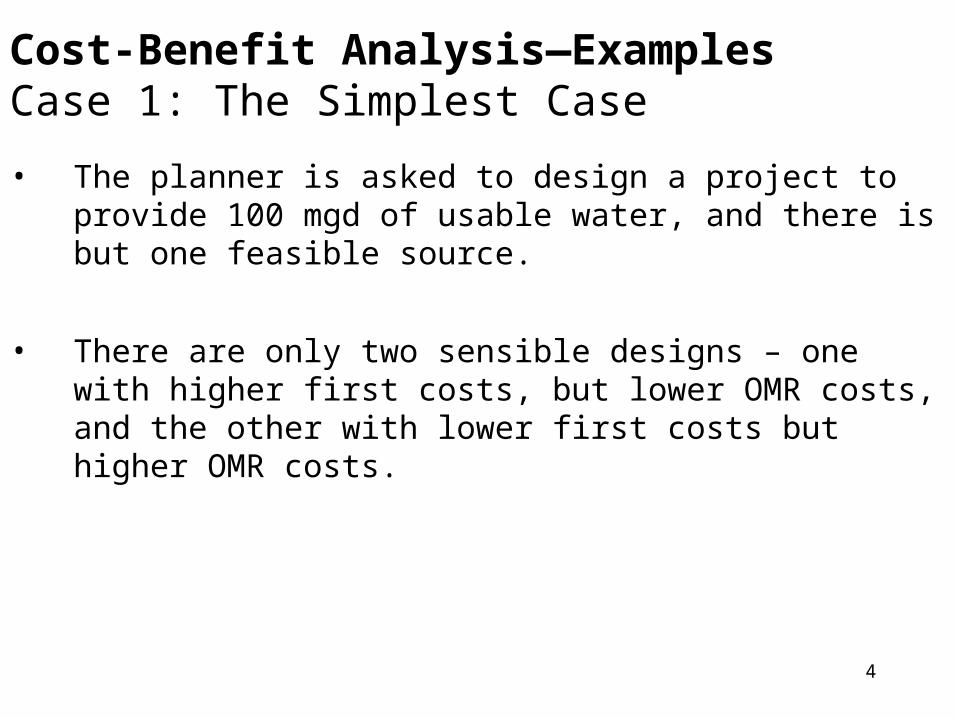
Cost-Benefit Analysis—Examples Case 1: The Simplest Case
• The planner is asked to design a project to provide 100 mgd of usable water, and there is but one feasible source.
• There are only two sensible designs – one with higher first costs, but lower OMR costs, and the other with lower first costs but higher OMR costs.
5
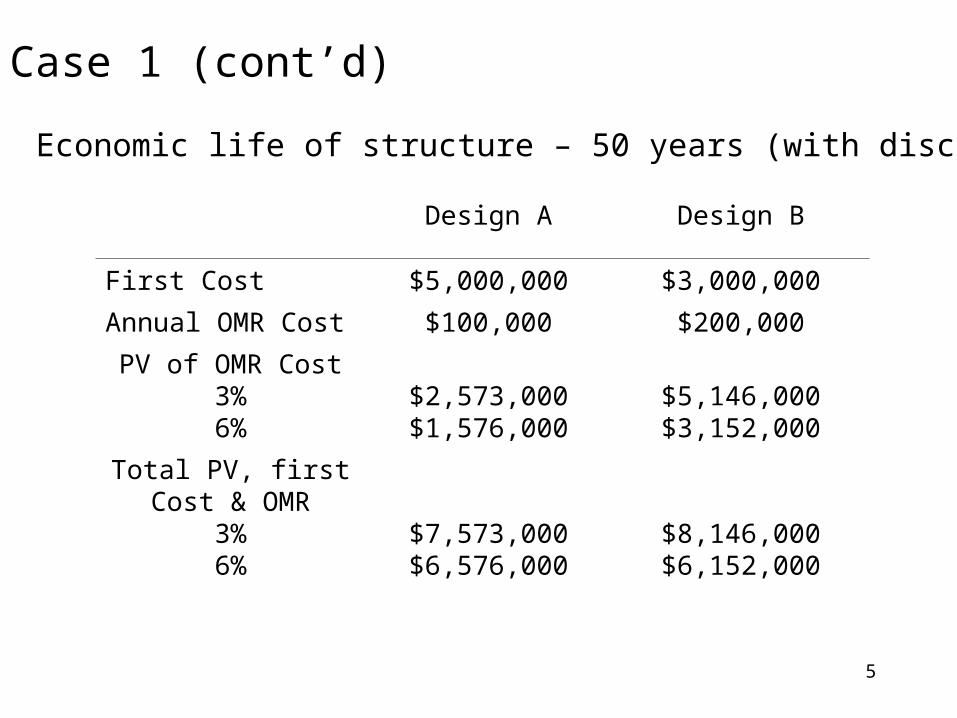
Case 1 (cont’d)
Example: Economic life of structure – 50 years (with discounting)
Design A Design B
First Cost $5,000,000 $3,000,000
Annual OMR Cost $100,000 $200,000
PV of OMR Cost3%6%
$2,573,000$1,576,000
$5,146,000$3,152,000
Total PV, first Cost & OMR3%6%
$7,573,000$6,576,000
$8,146,000$6,152,000
6
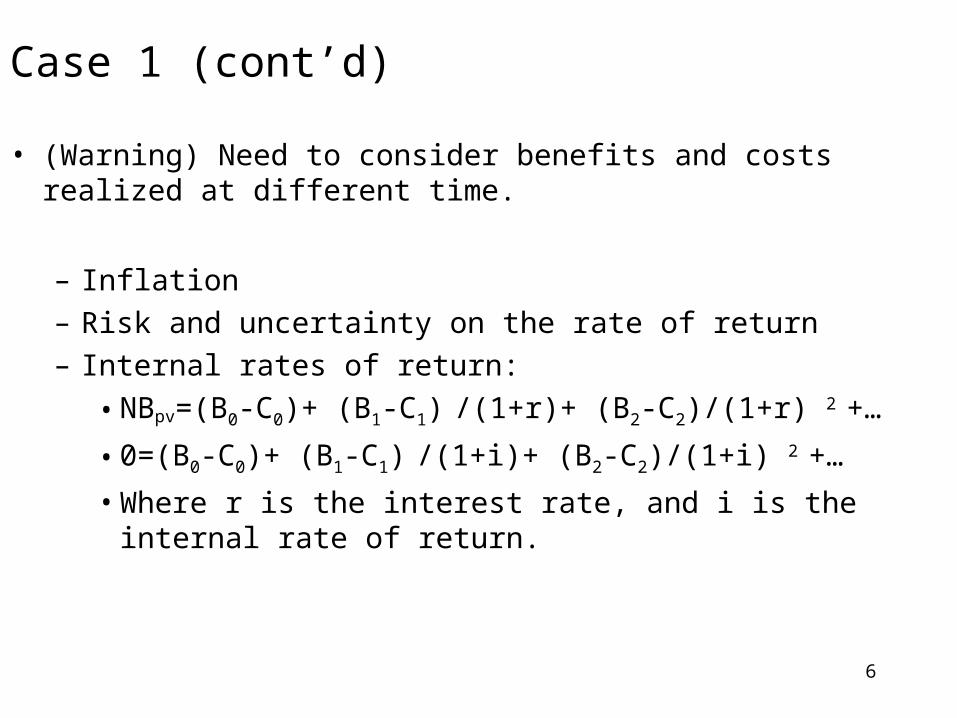
• (Warning) Need to consider benefits and costs realized at different time.
– Inflation
– Risk and uncertainty on the rate of return
– Internal rates of return:
• NBpv=(B0-C0)+ (B1-C1) /(1+r)+ (B2-C2)/(1+r) 2 +…
• 0=(B0-C0)+ (B1-C1) /(1+i)+ (B2-C2)/(1+i) 2 +…
• Where r is the interest rate, and i is the internal rate of return.
Case 1 (cont’d)
7
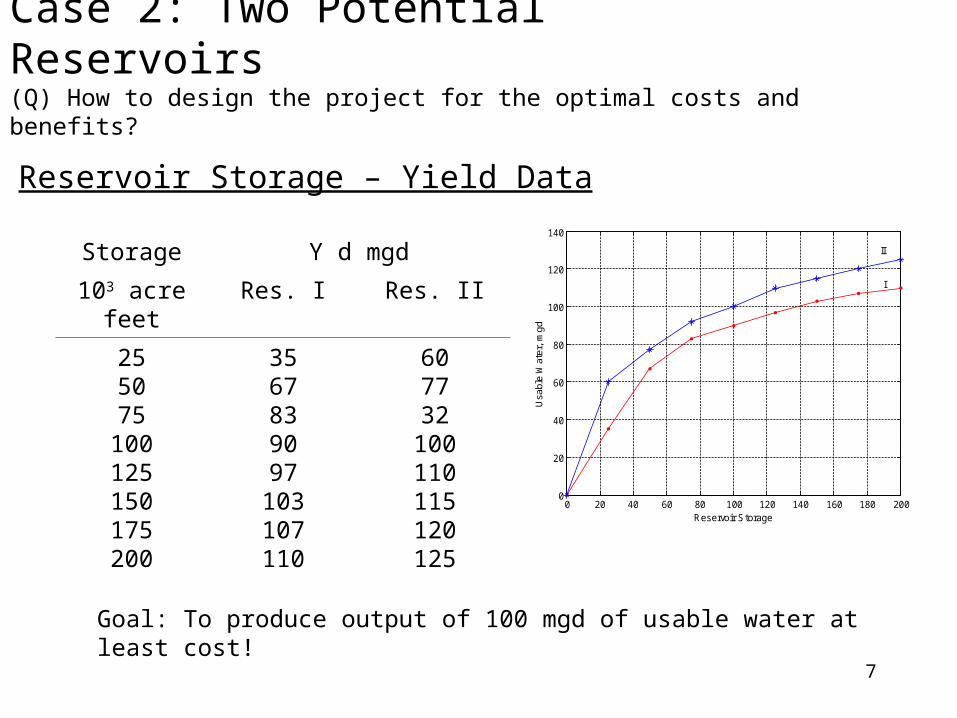
Case 2: Two Potential Reservoirs(Q) How to design the project for the optimal costs and benefits?
Reservoir Storage – Yield Data
Storage Y d mgd
103 acre feet Res. I Res. II
255075
100125150175200
3567839097
103107110
607732
100110115120125
0 20 40 60 80 100 120 140 160 180 2000
20
40
60
80
100
120
140
Reservoir Storage
Usa
ble
Wat
er,
mgd
II
I
Goal: To produce output of 100 mgd of usable water at least cost!
8
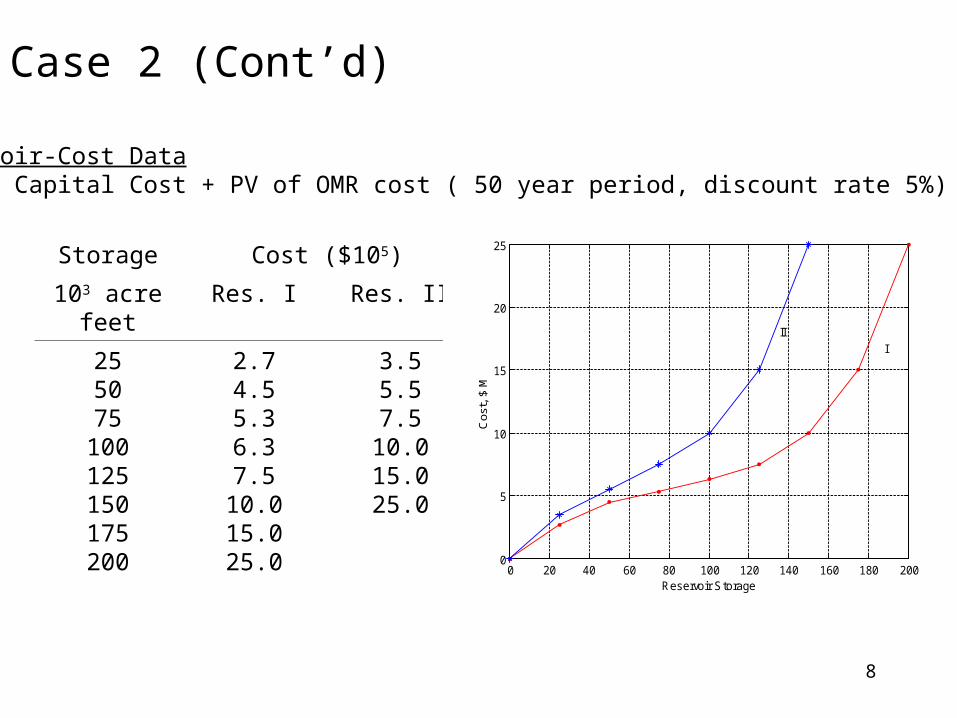
Case 2 (Cont’d)
Reservoir-Cost DataCost = Capital Cost + PV of OMR cost ( 50 year period, discount rate 5%)
Storage Cost ($105)
103 acre feet Res. I Res. II
255075
100125150175200
2.74.55.36.37.510.015.025.0
3.55.57.5
10.015.025.0
0 20 40 60 80 100 120 140 160 180 2000
5
10
15
20
25
Cos
t, $
M
Reservoir Storage
III
9
Case 2 (Cont’d)
• Step 1: Estimate cost function– Ci=f(xi), where Ci = cost, xi=reservoir capacity
• Step 2: Estimate Production (yield)– Yi=f(xi), where yi = yield, xi=reservoir capacity
• Step 3: Establish Iso-Output Function of combinations of Reservoirs I and II for 100 mgd usable water
• Step 4: Establish Iso-Output Function of combinations of Reservoirs I and II
• Step 5: Find the least cost combination of reservoirs using the point of tangency
10
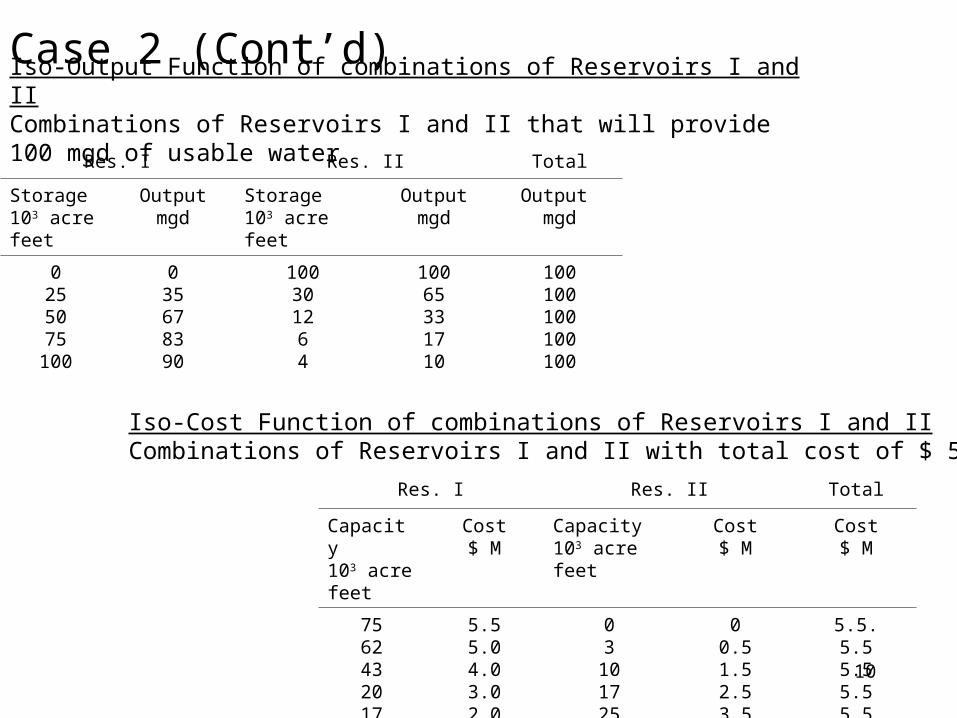
Case 2 (Cont’d)Iso-Output Function of combinations of Reservoirs I and IICombinations of Reservoirs I and II that will provide 100 mgd of usable water
Res. I Res. II Total
Storage103 acre feet
Outputmgd
Storage103 acre feet
Outputmgd
Output mgd
0255075
100
035678390
100301264
10065331710
100100100100100
Iso-Cost Function of combinations of Reservoirs I and IICombinations of Reservoirs I and II with total cost of $ 5.5 million.
Res. I Res. II Total
Capacity103 acre feet
Cost$ M
Capacity103 acre feet
Cost$ M
Cost$ M
7562432017
5.55.04.03.02.0
03
101725
00.51.52.53.5
5.5.5.55.55.55.5
11
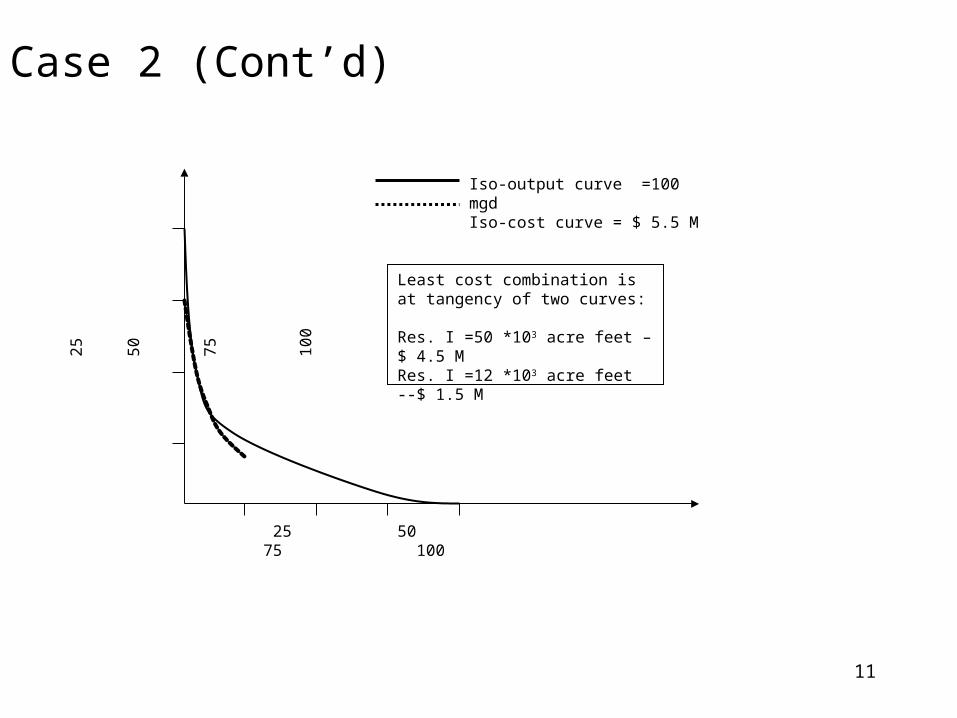
Case 2 (Cont’d)
Iso-output curve =100 mgdIso-cost curve = $ 5.5 M
Least cost combination is at tangency of two curves:
Res. I =50 *103 acre feet –$ 4.5 MRes. I =12 *103 acre feet --$ 1.5 M
25 50 75 100
25
50
75
1
00
12
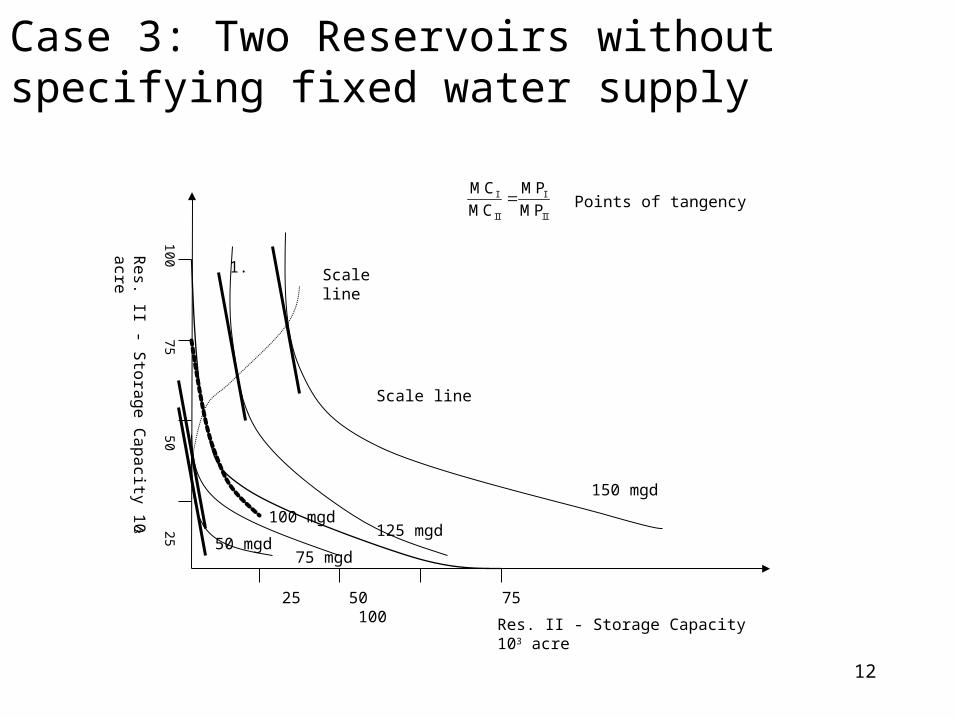
Case 3: Two Reservoirs without specifying fixed water supply
Res. II - Storage Capacity 103 acre
25 50 75 100
10075
5025
Re
s. II - Sto
rag
e C
ap
acity 1
03 a
cre
Scale line
Scale line
125 mgd
75 mgd50 mgd
150 mgd
100 mgd
1.
I I
II II
MC MP
MC MP Points of tangency
13
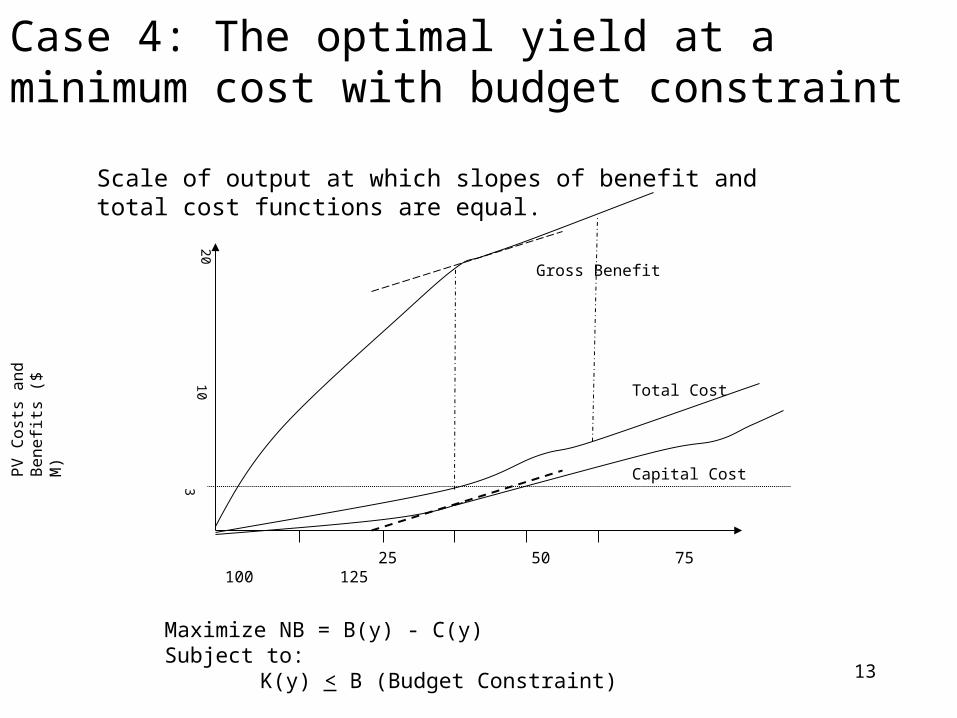
Case 4: The optimal yield at a minimum cost with budget constraint
Capital Cost
Total Cost
Gross Benefit
25 50 75 100 125
20
PV
Co
sts
an
d
Be
ne
fits
($ M
)
310
MC=MB Scale of output at which slopes of benefit and total cost functions are equal.
Maximize NB = B(y) - C(y)Subject to:
K(y) < B (Budget Constraint)
14
Multicriteria - Basic Problem
Definition: a multicrtieria decision problem is a situation in which, having defined a set of actions (A) and a consistent family (F) of criteria on A, one wishes
– to determine a subset of actions considered to be the best with respect to F
– to divide A into subsets according to some norms (sorting problems)
– to rank the actions of A from best to worst (ranking problems)
15
Balance Sheet of Project Evaluation
•Can be viewed as a particular application of the social cost-benefit approach to evaluation
• Developed by Lichfield and widely used in England
• Considers all benefits and all costs with respect to all community goals in one enumeration
• Presents a complete set of social accounts, with respect to different goals, and for consumers and producers
• The costs and benefits are recorded as capital (once for all) items or annual (continuing) items. Types of evaluation considered: monetary, quantitative but non-monetary, intangible, and time.
16
Check List Criteria
•Ranks appropriate alternative proposals on an ordinal basis in relation to a number of specific criteria.
• Widely used by professional land-use planners
17
Goals-Achievement Matrix
•Developed by Hill (1965)– M Hill. 1965. A Goals-Achievement Matrix for Evaluating Alternative Plans.
Application to Transportation Plans. Journal of the American Institute of Planners , Vol. 34, No. 1, 19-29.
•This method attempts to determine the extent to which alternative plans will achieve a predetermined set of goals or objectives
•Costs and benefits are always defined in terms of achievement.– Benefits represent progress toward the defined objectives, while costs represent
retrogression from defined objectives.– The basic difference between PBSA and GAM is that GAM only considers
costs and benefits with reference to well stated objectives, and to well defined incidence groups.
18
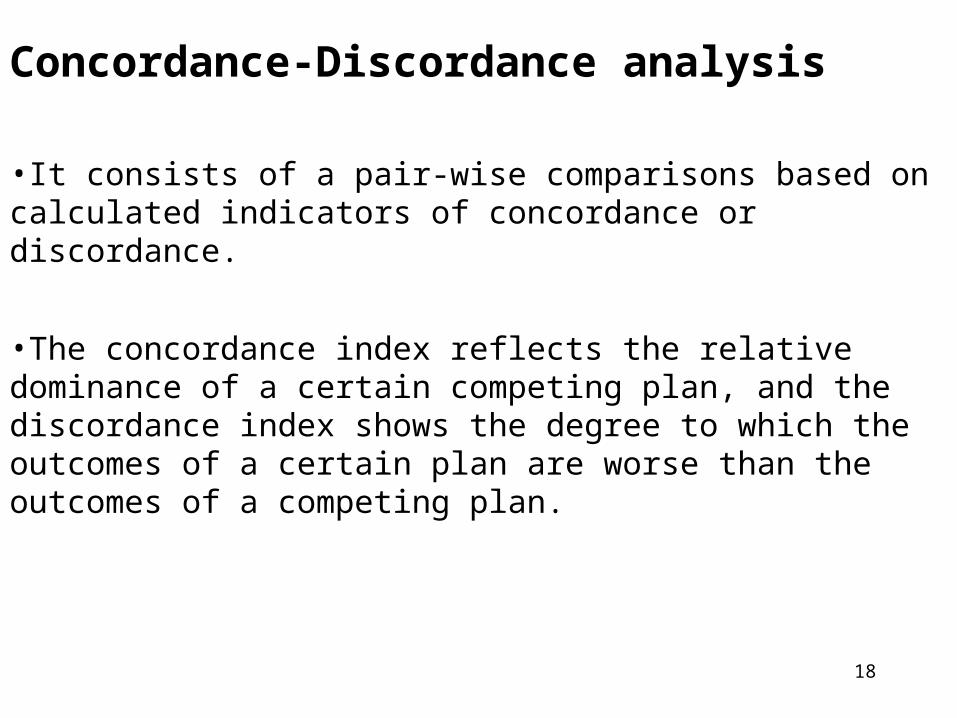
Concordance-Discordance analysis
•It consists of a pair-wise comparisons based on calculated indicators of concordance or discordance.
•The concordance index reflects the relative dominance of a certain competing plan, and the discordance index shows the degree to which the outcomes of a certain plan are worse than the outcomes of a competing plan.
19
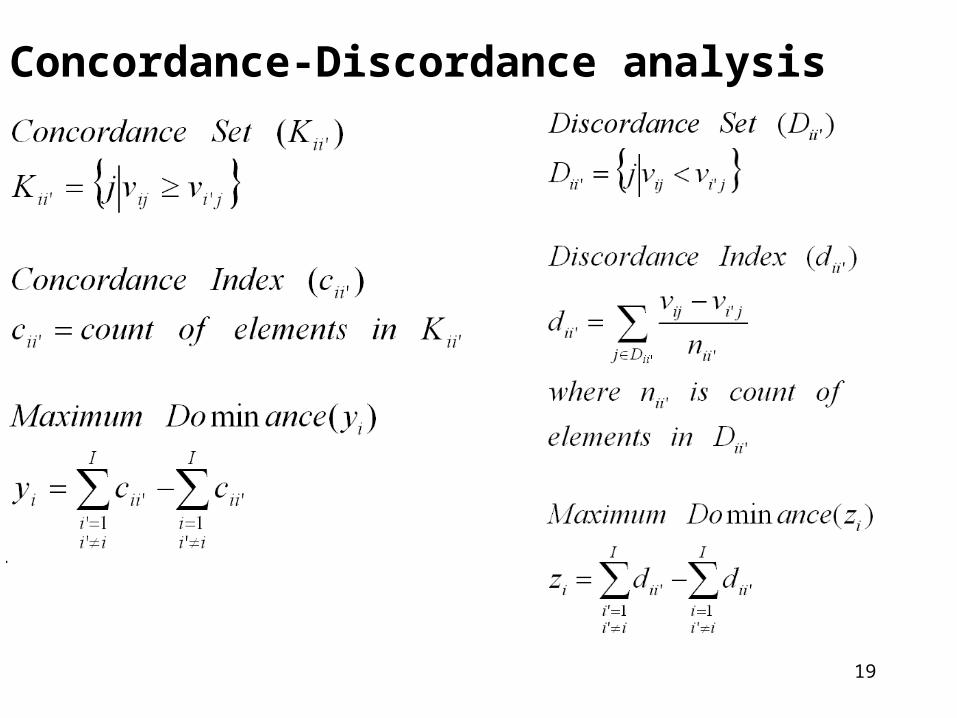
Concordance-Discordance analysis
20
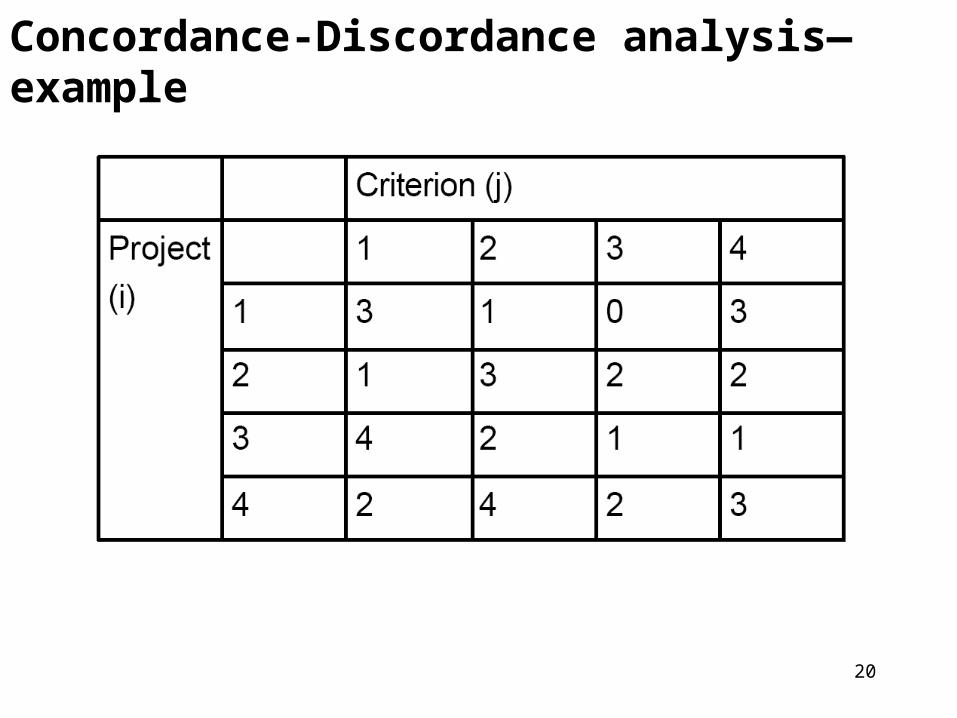
Concordance-Discordance analysis—example
21
Multi Objective Programming (MOP)
• Basic Concepts and Definition of MOP
• Non-Dominated Solutions
• Generating/Incorporating Methods– Weight Method– Constraint method
• MOP under uncertainty
22
Why MOP?
• Multiple decision makers
• Multiple evaluating criteria
• Wider range of alternativesMore realistic analysis of problems
* In fact, any optimization is (or should be) multiobjective!!!!
23
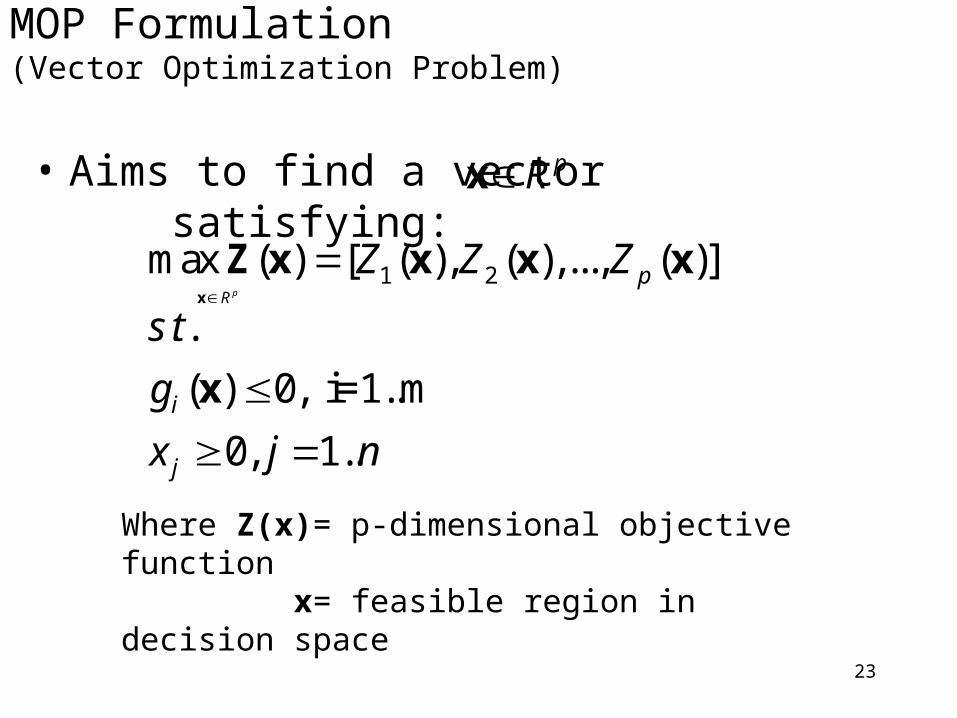
MOP Formulation(Vector Optimization Problem)
• Aims to find a vector satisfying:pRx
1 2max ( ) [ ( ), ( ),..., ( )]
. .
( ) 0, i=1..m
0, 1..
p
i
j
Z Z Z
s t
g
x j n
Z x x x x
x
Where Z(x)= p-dimensional objective function x= feasible region in decision space
pRx