Embed Size (px)
Citation preview
11
Cristian Larroulet Cristian Larroulet Executive Director Executive Director
Libertad y DesarrolloLibertad y Desarrollo
Beijing, September 2005Beijing, September 2005
Chile: A case Chile: A case of sustainable of sustainable developmentdevelopment
22
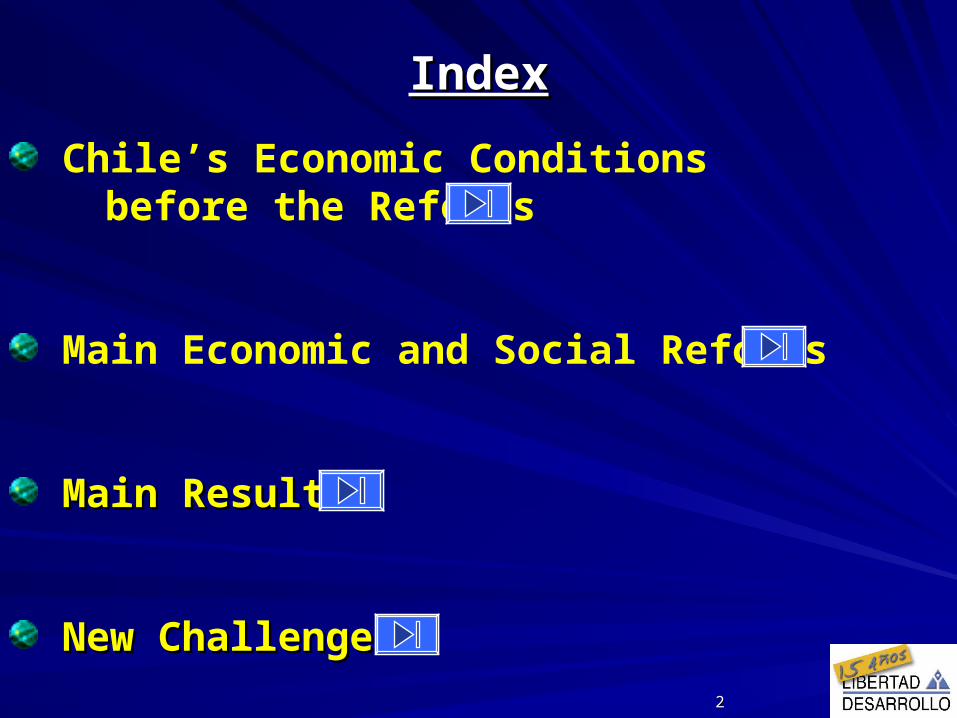
IndexIndex
Chile’s Economic Conditions before the Reforms
Main Economic and Social Reforms
Main Results Main Results
New ChallengesNew Challenges
33
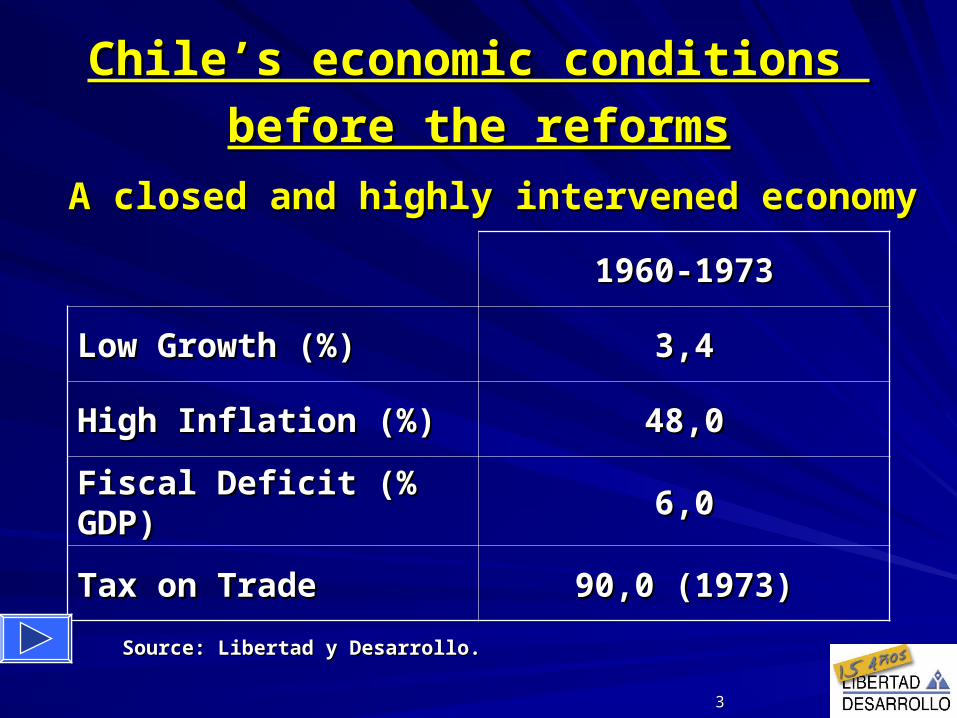
Chile’s economic conditions Chile’s economic conditions
before the reformsbefore the reforms
A closed and highly intervened economyA closed and highly intervened economy
1960-19731960-1973
Low Growth (%)Low Growth (%) 3,43,4
High Inflation (%)High Inflation (%) 48,048,0
Fiscal Deficit (% Fiscal Deficit (% GDP)GDP) 6,06,0
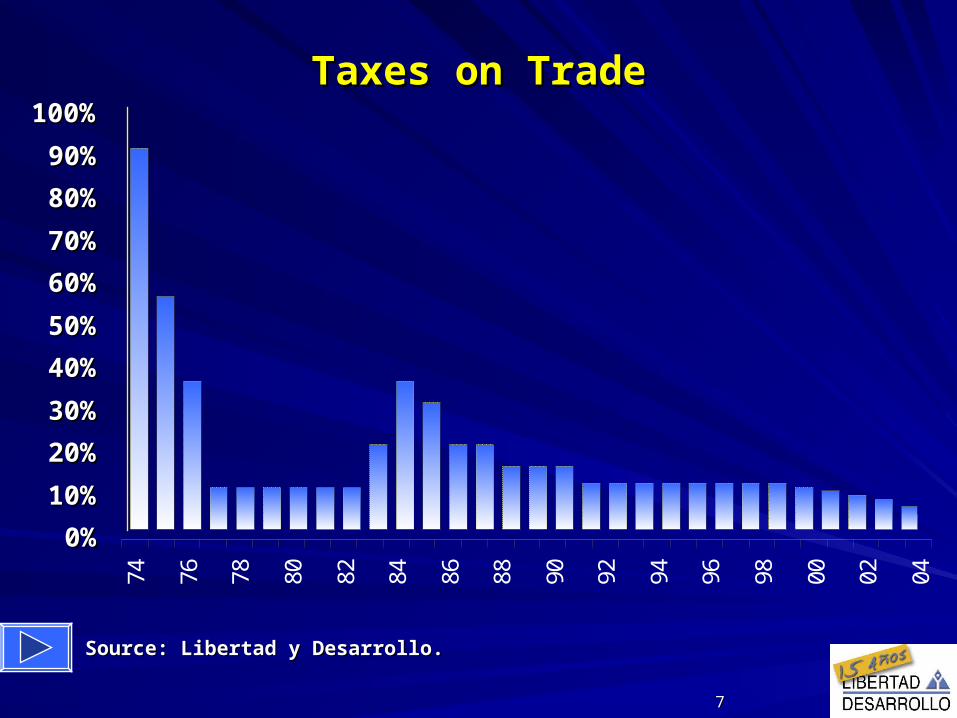
Tax on TradeTax on Trade 90,0 (1973)90,0 (1973)
Source: Libertad y Desarrollo. Source: Libertad y Desarrollo.
44
Free market economy Free market economy
Sound macroeconomic policies Sound macroeconomic policies
Free trade Free trade
Microeconomic reforms Microeconomic reforms - social security- social security- privatization- privatization- others- others
Environmental policies Environmental policies - Standards and “ whoever contaminates - Standards and “ whoever contaminates
must pay”must pay”
Social policiesSocial policies- Focus on extreme poverty groups- Focus on extreme poverty groups
Main economic and social reformsMain economic and social reforms
55
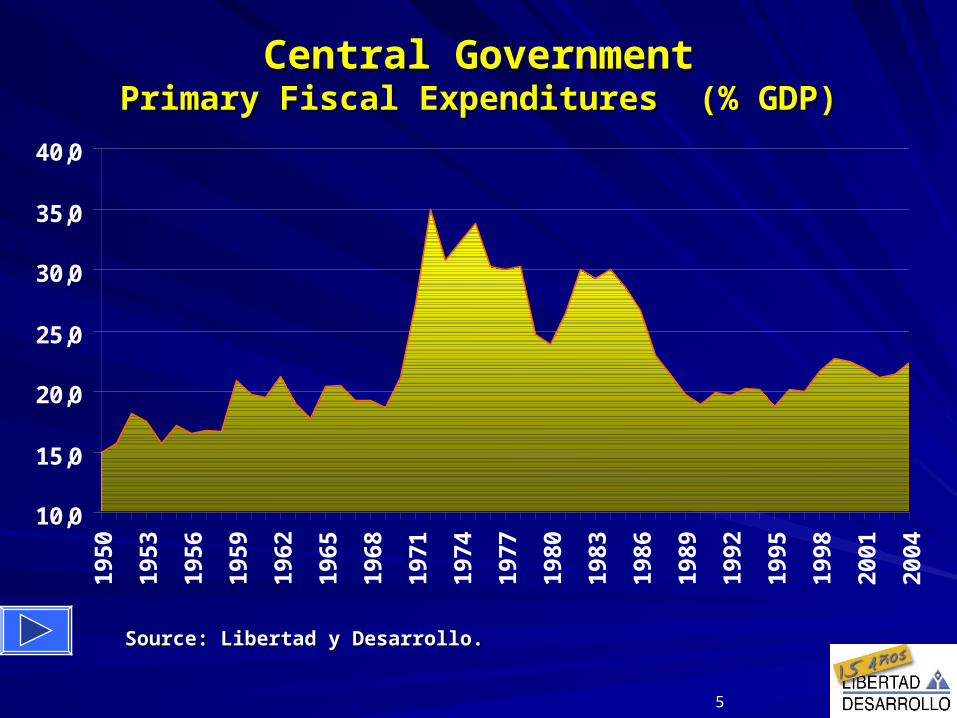
Central GovernmentCentral GovernmentPrimary Fiscal Expenditures (% GDP)Primary Fiscal Expenditures (% GDP)
10,0
15,0
20,0
25,0
30,0
35,0
40,0
19
50
19
53
19
56
19
59
19
62
19
65
19
68
19
71
19
74
19
77
19
80
19
83
19
86
19
89
19
92
19
95
19
98
20
01
20
04
Source: Libertad y Desarrollo.Source: Libertad y Desarrollo.
66
0
50
100
150
200
250
300
350
400
450
500
1973
1974
1975
1976
1977
1978
1979
1980
1981
1982
1983
1984
1985
1986
1987
1988
1989
1990
1991
1992
1993
1994
1995
1996
1997
1998
1999
2000
2001
2002
2003
2004
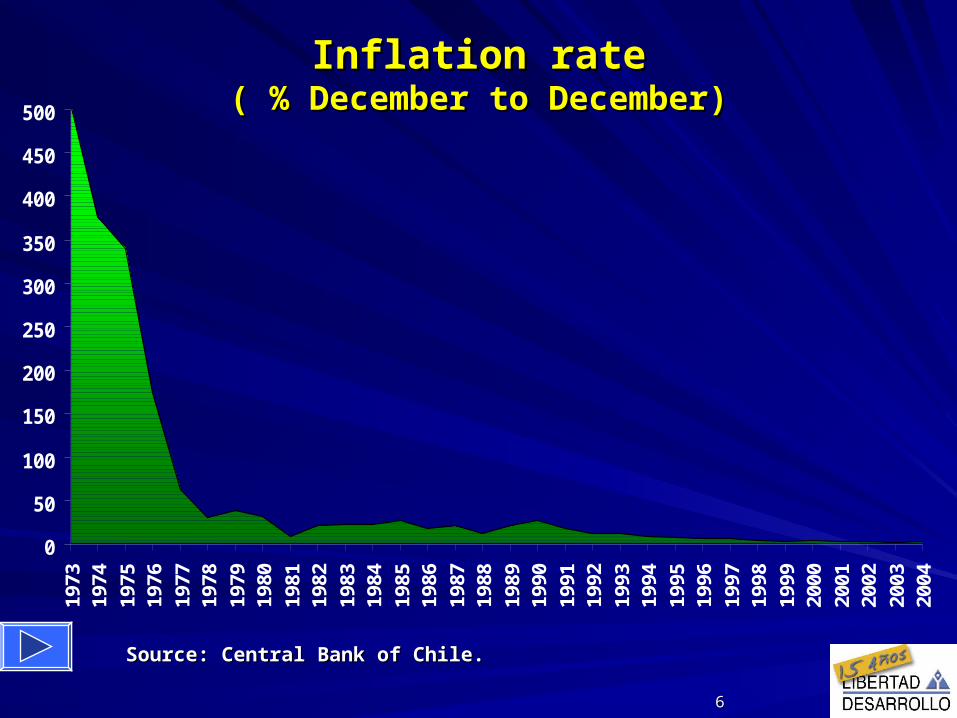
Inflation rateInflation rate( % December to December)( % December to December)
Source: Central Bank of Chile.Source: Central Bank of Chile.
77
74 76 78 80 82 84 86 88 90 92 94 96 98 00 02 04
0%0%
10%10%
20%20%
30%30%
40%40%
50%50%
60%60%
70%70%
80%80%
90%90%
100%100%Taxes on TradeTaxes on Trade
Source: Libertad y Desarrollo.Source: Libertad y Desarrollo.
88
High Rate of Growth High Rate of Growth
Diversification of Exports Diversification of Exports
Reduction in Poverty Reduction in Poverty
Better Health Better Health
Higher Coverage in Education Higher Coverage in Education
Less Contamination Less Contamination
Main ResultsMain Results
99
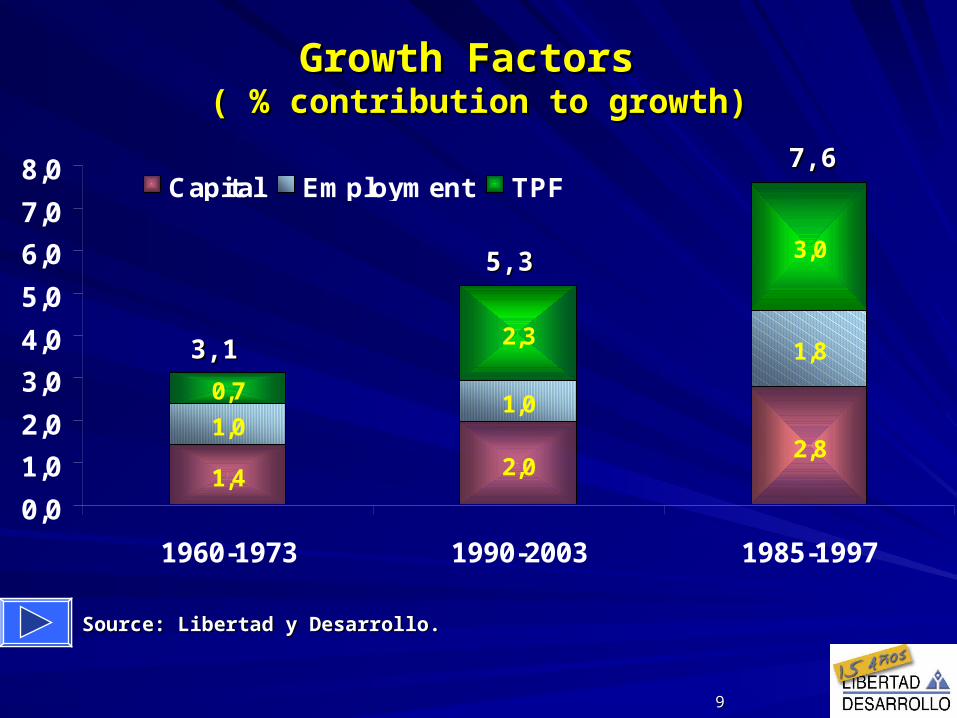
Growth Factors Growth Factors ( % contribution to growth)( % contribution to growth)
Source: Libertad y Desarrollo. Source: Libertad y Desarrollo.
1,4 2,02,8
1,01,0
1,8
0,7
2,3
3,0
0,0
1,0
2,0
3,0
4,0
5,0
6,0
7,0
8,0
1960-1973 1990-2003 1985-1997
Capital Employment TPF
3,13,1
5,35,3
7,67,6
1010
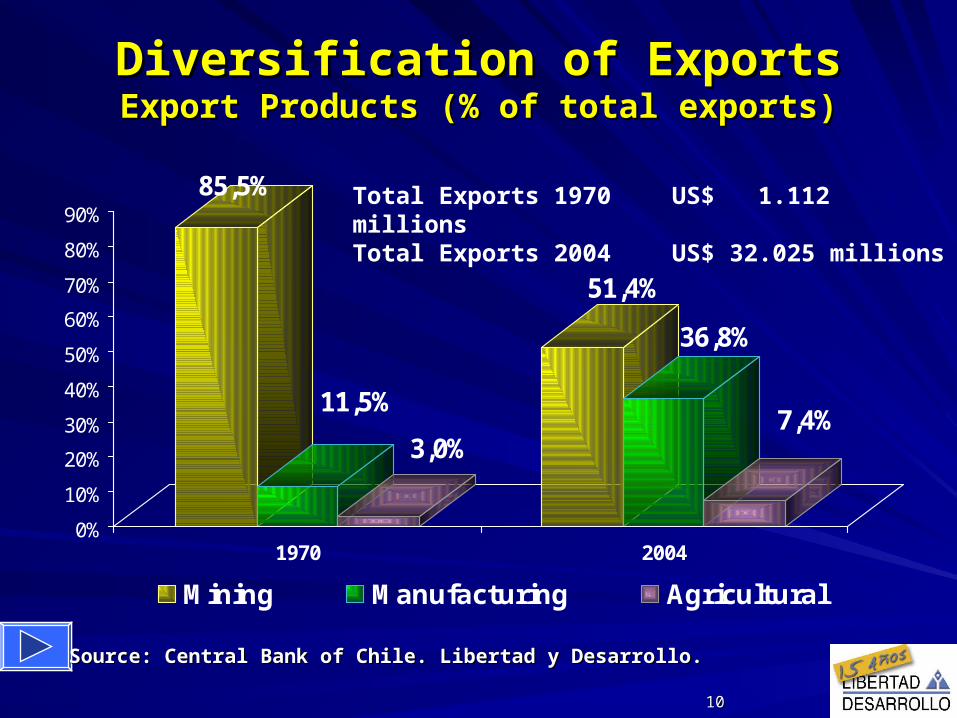
Total Exports 1970 US$ 1.112 millionsTotal Exports 2004 US$ 32.025 millions
85,5%
11,5%
3,0%
51,4%
36,8%
7,4%
0%
10%
20%
30%
40%
50%
60%
70%
80%
90%
1970 2004
Mining Manufacturing Agricultural
Diversification of ExportsDiversification of ExportsExport Products (% of total exports)Export Products (% of total exports)
Source: Central Bank of Chile. Libertad y Desarrollo. Source: Central Bank of Chile. Libertad y Desarrollo.
1111
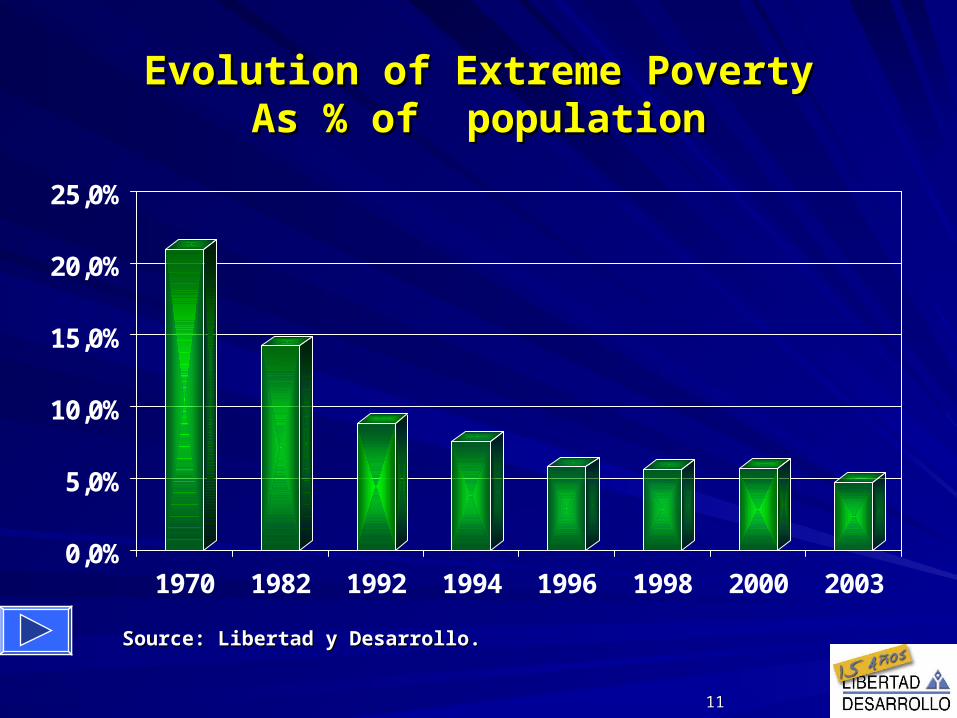
Evolution of Extreme PovertyEvolution of Extreme PovertyAs % of populationAs % of population
0,0%
5,0%
10,0%
15,0%
20,0%
25,0%
1970 1982 1992 1994 1996 1998 2000 2003
Source: Libertad y Desarrollo. Source: Libertad y Desarrollo.
1212
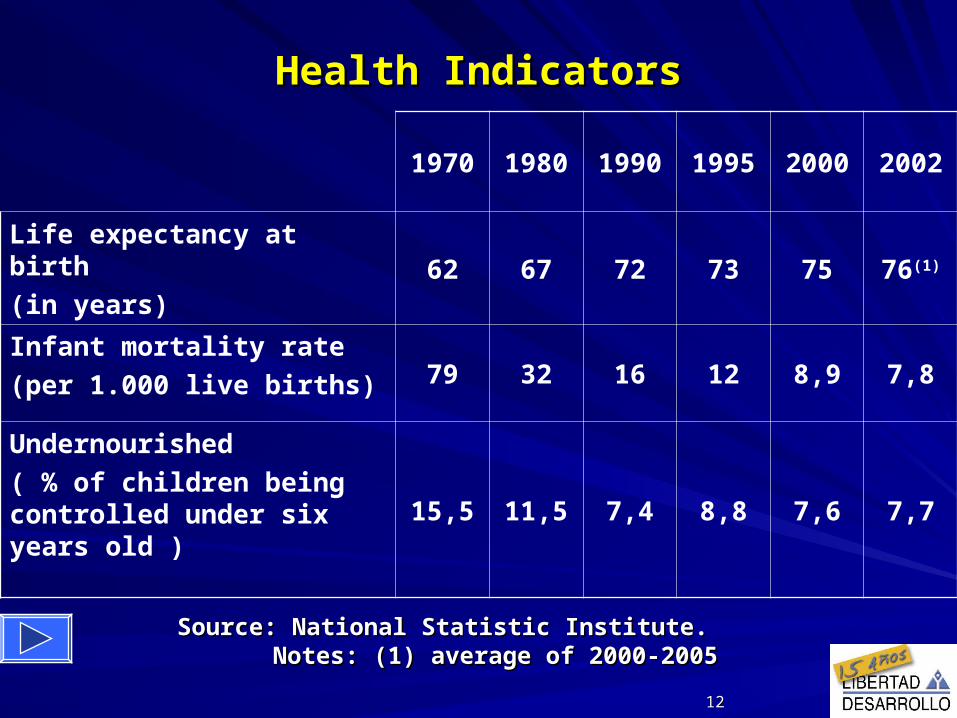
Health IndicatorsHealth Indicators
1970 1980 1990 1995 2000 2002
Life expectancy at birth (in years) 62 67 72 73 75 76(1)
Infant mortality rate (per 1.000 live births) 79 32 16 12 8,9 7,8
Undernourished( % of children being controlled under six years old )
15,5 11,5 7,4 8,8 7,6 7,7
Source: National Statistic Institute.Source: National Statistic Institute. Notes: (1) average of 2000-2005Notes: (1) average of 2000-2005
1313
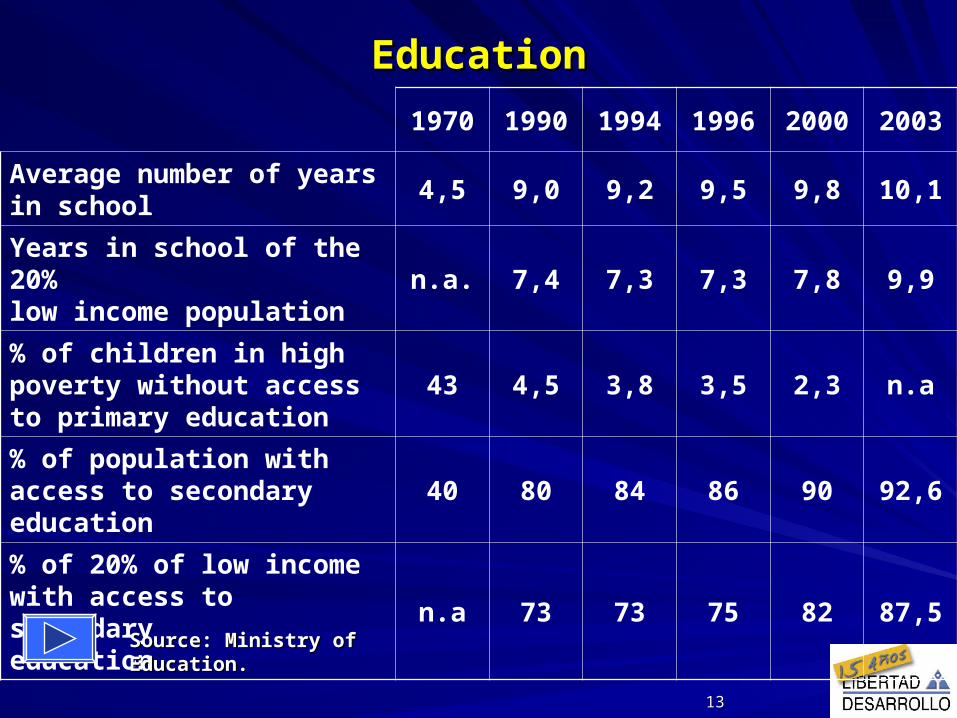
EducationEducation1970 1990 1994 1996 2000 2003
Average number of years in school
4,5 9,0 9,2 9,5 9,8 10,1
Years in school of the 20% low income population
n.a. 7,4 7,3 7,3 7,8 9,9
% of children in high poverty without access to primary education
43 4,5 3,8 3,5 2,3 n.a
% of population with access to secondary education
40 80 84 86 90 92,6
% of 20% of low income with access to secondary education
n.a 73 73 75 82 87,5
Source: Ministry of Source: Ministry of Education. Education.
1414
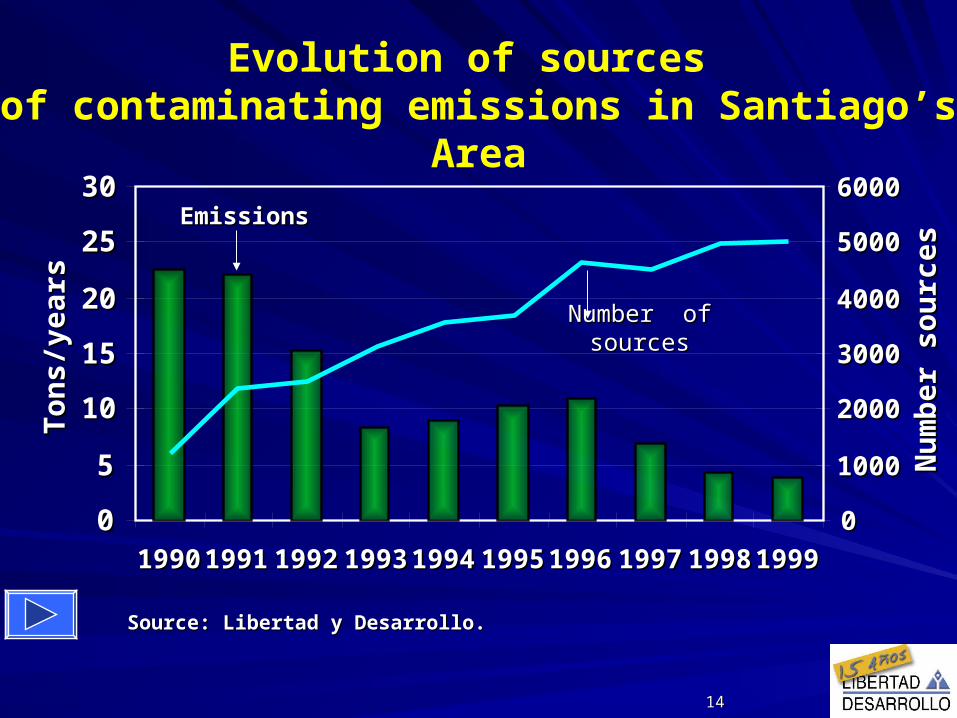
Evolution of sources of contaminating emissions in Santiago’s
Area
00
55
1010
1515
2020
2525
3030
19901990 19911991 19921992 19931993 19941994 19951995 19961996 19971997 19981998 19991999
Ton
s/ye
ars
Ton
s/ye
ars
00
10001000
20002000
30003000
40004000
50005000
60006000
Nu
mb
er s
ourc
es
Nu
mb
er s
ourc
es
Number of sourcesNumber of sources
EmissionsEmissions
Source: Libertad y Desarrollo. Source: Libertad y Desarrollo.
1515
New challengesNew challenges
Free Trade Agreements Free Trade Agreements
Quality in Education Quality in Education
Innovation, Research and Development Innovation, Research and Development
Better Environmental Policies Better Environmental Policies
1616
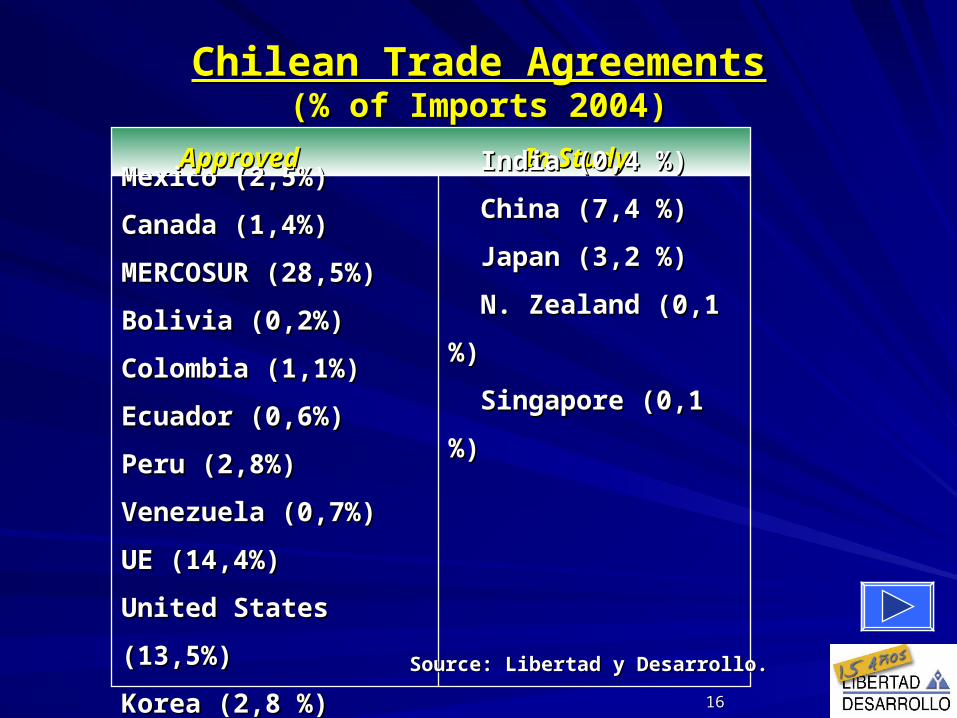
Chilean Trade AgreementsChilean Trade Agreements(% of Imports 2004)(% of Imports 2004)
Mexico (2,5%)Mexico (2,5%)
Canada (1,4%)Canada (1,4%)
MERCOSUR (28,5%)MERCOSUR (28,5%)
Bolivia (0,2%)Bolivia (0,2%)
Colombia (1,1%)Colombia (1,1%)
Ecuador (0,6%)Ecuador (0,6%)
Peru (2,8%)Peru (2,8%)
Venezuela (0,7%)Venezuela (0,7%)
UE (14,4%)UE (14,4%)
United States United States
(13,5%)(13,5%)
Korea (2,8 %)Korea (2,8 %)
ApprovedApproved In StudyIn Study India (0,4 %)India (0,4 %)
China (7,4 %)China (7,4 %)
Japan (3,2 %)Japan (3,2 %)
N. Zealand (0,1 N. Zealand (0,1
%)%)
Singapore (0,1 Singapore (0,1
%)%)
Source: Libertad y Desarrollo. Source: Libertad y Desarrollo.
1717
0
100
200
300
400
500
600
700
sin
ga
po
reC
hin
es
eK
ore
aH
on
g K
on
gJ
ap
an
Es
ton
iaH
un
ga
ryN
eth
erl
an
ds
Be
lgiu
nE
ng
lan
dA
us
tra
liaU
nit
ed
Sta
tes
Slo
va
k R
ep
ub
licS
we
de
nR
us
sia
nL
ith
ua
nia
La
tvia
Ma
lay
sia
Ne
w Z
ea
lan
dS
lov
en
iaS
co
tla
nd
Isra
el
Ita
lyN
orw
ay
Bu
lga
ria
Ro
ma
nia
Se
rbia
Inte
rna
tio
na
lA
rme
nia
Mo
ldo
va
Cy
pru
sJ
ord
an
Ma
ce
do
nia
Ira
nB
ah
rain
Ind
on
es
iaE
gy
pt
Le
ba
no
nP
ale
sti
nia
nT
un
isia
Ch
ileM
oro
cc
oP
hili
pp
ine
sB
ots
wa
na
Sa
ud
i Ara
bia
Gh
an
aS
ou
th A
fric
a
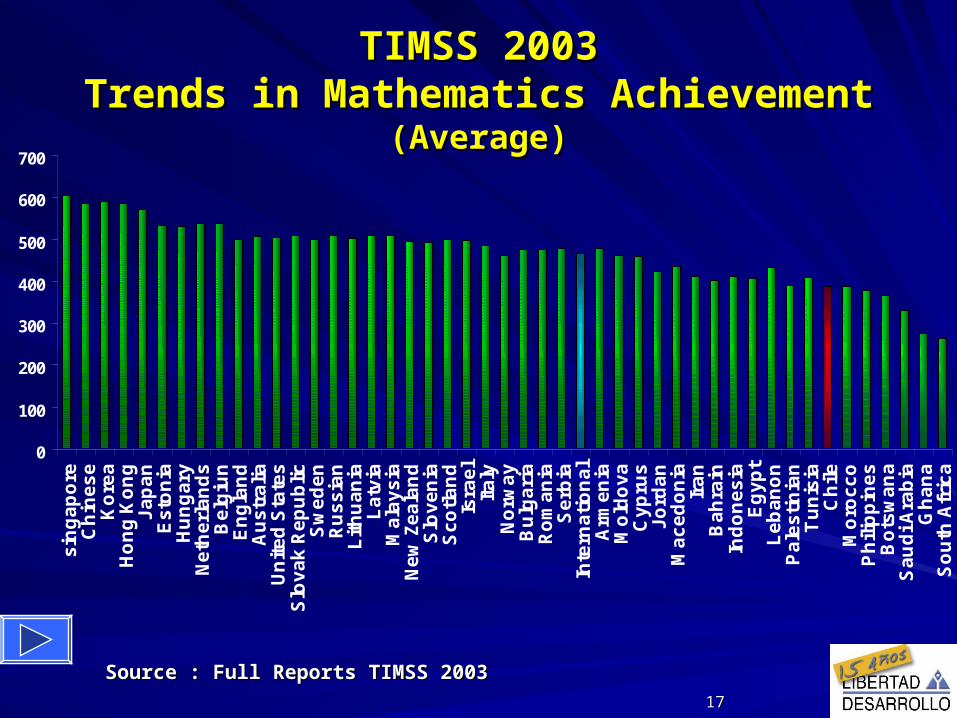
TIMSS 2003TIMSS 2003Trends in Mathematics AchievementTrends in Mathematics Achievement
(Average)(Average)
Source : Full Reports TIMSS 2003Source : Full Reports TIMSS 2003
1818
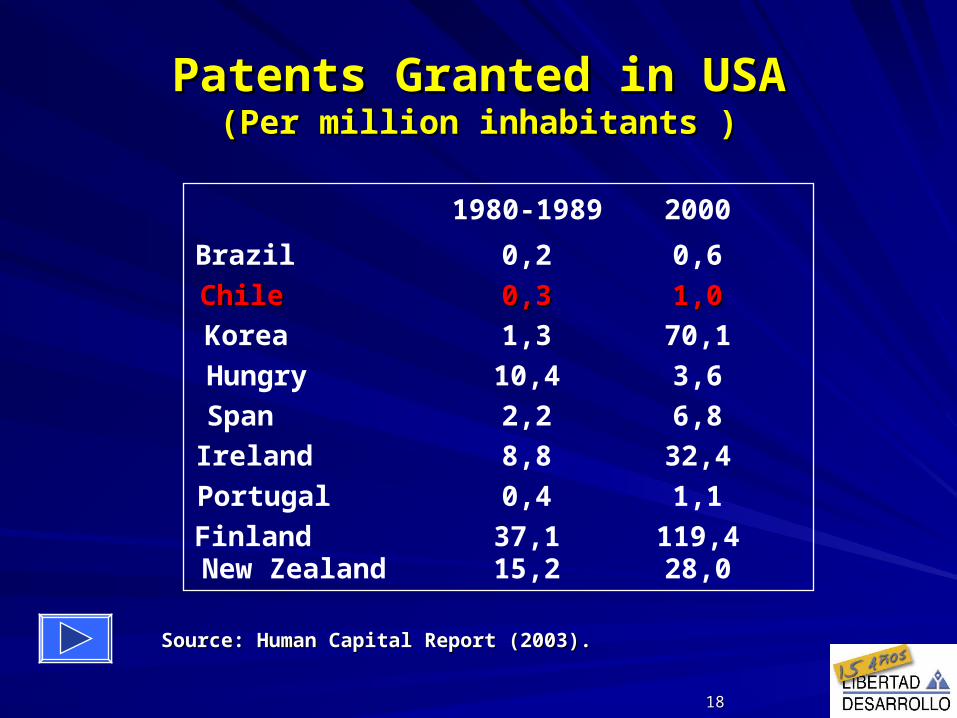
Source: Human Capital Report (2003).Source: Human Capital Report (2003).
1980-1989 2000
Brazil 0,2 0,6
ChileChile 0,30,3 1,01,0Korea 1,3 70,1Hungry 10,4 3,6Span 2,2 6,8Ireland 8,8 32,4Portugal 0,4 1,1Finland 37,1 119,4New Zealand 15,2 28,0
Patents Granted in USAPatents Granted in USA(Per million inhabitants )(Per million inhabitants )