Embed Size (px)
Citation preview

Fact Sheet for Online Control of Dosing Magnesium Hydroxide Control Methodology
SP5 (ARC Sewer Corrosion and Odour Research Project) 1
1. Control algorithm for dosing magnesium hydroxide in sewers
1.1 Background
Mg(OH)2 dosing in sewers prevents sulfide transfer from the liquid to the gas phase by
increasing the pH of the sewage. The maximum pH achievable by Mg(OH)2 dosing is
approximately 9.0-9.2. At such pH levels, the percentage of H2S in the liquid is less than 1%.
Long-term pH elevation to 8.6–9.0 reduces SRB activity by 30%-50%.
Further information can be obtained as follows:
• Effects of Mg(OH)2 dosing:
- Paper: Gutierrez, O., Park, D., Sharma, K.R. and Yuan, Z. (2009) Effects
of long-term pH elevation on the sulfate-reducing and methanogenic
activities of anaerobic sewer biofilms. Water Research 43(9), 2549-2557.
1.2 Control Strategy
The fundamentals for magnesium hydroxide dosing control design are discussed, focusing on
dosing location and dosing requirements. Additionally the prediction of future flow and the
use of a supervisory feedback loop are also discussed.
1.2.1 Dosing Location
The optimal dosing location will largely depend on specific conditions of each system. Some
aspects to be taken into consideration include:
• Dosing at the discharge point is simple in terms of control.
• Dosing at the beginning of the pipe minimizes sulfide transfer during the transport
(e.g. through air valves), preventing possible odour complaints.
• Dosing at the beginning of the pipe decrease sulfide production and stop methane
generation.
• For dosing at the beginning of the pipe, Biological activity (i.e. fermentation) may
drive pH down due to the proton production. However such high pH also minimises
sewage acidification due to fermentative processes, reducing the amount of
magnesium hydroxide to be dosed.

Fact Sheet for Online Control of Dosing Magnesium Hydroxide Control Methodology
SP5 (ARC Sewer Corrosion and Odour Research Project) 2
1.2.2 Dosing rate
The Mg(OH)2 dosing rate to achieve a desired set-point at the discharge mainly depends on
two factors: the buffer capacity of the sewage and the proton production along the pipe.
1.2.2.1 Buffer capacity
The amount of magnesium hydroxide required to achieve a certain pH is dependent on the
actual wastewater pH and the buffer capacity of the sewage. Sewage pH is very dynamic
throughout the day, but can be easily monitored on-line using common and inexpensive
sensors.
On the contrary, buffer capacity of the wastewater cannot be measured on-line, but needs to
be determined by titration as illustrated in Figure 1, which depicts titration curves of sewage
at different times of a day.
Figure 1. Examples of titration curves of sewage at different times of the day.
1.2.2.2 Proton production along the pipe
Protons are produced during the transport of sewage through a pipe, with the subsequent pH
decrease. An additional amount of magnesium hydroxide should be dosed to achieve the
desired pH at the end of the pipe. The amount of protons produced is estimated by a
mathematical model based on HRT and A/V ratio.
𝐻!production = 𝑟!"# ∗!!∗ 𝐻𝑅𝑇! (1)
Fact Sheet for Online Control of Dosing Magnesium Hydroxide Control Methodology
SP5 (ARC Sewer Corrosion and Odour Research Project) 3
Where 𝑟!"# is the maximum production rate and 𝑛 is a parameter of the power function.
1.2.3 Future flow prediction
Typical hydraulic retention time (HRT) profiles have been used for the online control. This
solution is not ideal because of the high variance in sewers. To achieve a better HRT
estimation, sewer future flow prediction is obtained through a multi-step auto-regressive
moving average (ARMA) models. The prediction during rain or storm events can be
enhanced with exogenous inputs (ARMAX) model.
The ARMA model is composed of both autoregressive (AR) and moving average (MA)
models. Equation 2 depicts a general expression to represent an ARMA model:
𝐴(𝑧!!)𝑦 𝑡 = 𝐶 𝑧!! 𝑣(𝑡) (2)
Where 𝑧 is the backshift operator, 𝑧!!𝑦 𝑡 = 𝑦 𝑡 − 1 , 𝑣 𝑡 is zero mean value Gaussian
white noise and 𝑦 𝑡 is the observed data.
𝐴 𝑧 = 1+ 𝑎!𝑧!! +⋯+ 𝑎!"𝑧!!" (3)
𝐶 𝑧 = 1+ 𝑐!𝑧!! +⋯+ 𝑐!"𝑧!!" (4)
Where na, nc are the order of 𝐴(𝑧!!), 𝐶 𝑧!! .
ARMA model allowed predicting future flow with reasonably good accuracy under different
weather conditions (Figure 2). The delay on the prediction under changing conditions, which
is accented at longer prediction times.
Further information can be obtained as follows:
• ARMA model for sewer flow prediction:
- Paper: Real-time Multistep Prediction of Sewer Flow for Online
Chemical Dosing Control
1.2.4 Feedback Loop
A feedback loop could help adjusting the dosing rate based on the long-term evolution of the
controllable variable, i.e. the pH at the discharge point.
1.2.4.1 Feedback signal
The average discharge pH (pHave) can be used to adjust the overall dosing.
pH!"#(n) = α ∗ pH! + 1− α ∗ pH!"#(n− 1) (5)
where pH!"# n is the weighted average pH of present time, pH!"#(n− 1) is the weighted
average pH of previous time, pH! is the present pH, and α is a weighting factor (0 < 𝛼 < 1).
Fact Sheet for Online Control of Dosing Magnesium Hydroxide Control Methodology
SP5 (ARC Sewer Corrosion and Odour Research Project) 4
Aiming to diminish the variation of pHave due to the durative variation of pH signal, a much
smaller α (α =0.00001) was chosen.
1.2.4.2 Control rule
Based on average pH calculation a proportional control rule is employed to adjust Mg(OH)2
dosing rate.
Rfb=k*(pHsp-pHave) (6)
Where Rfb is the control rule, k is a proportion constant that need to be evaluated, pHsp is set
point of pH, pHave is average pH calculated by eq. 5.
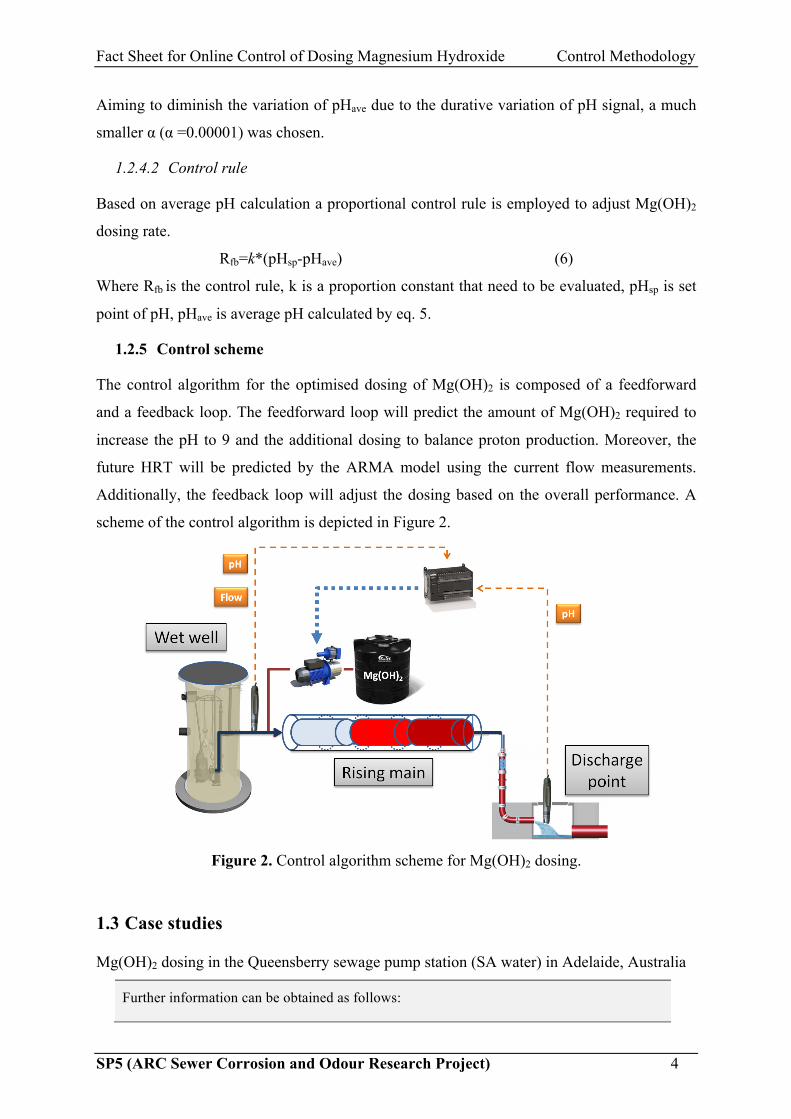
1.2.5 Control scheme
The control algorithm for the optimised dosing of Mg(OH)2 is composed of a feedforward
and a feedback loop. The feedforward loop will predict the amount of Mg(OH)2 required to
increase the pH to 9 and the additional dosing to balance proton production. Moreover, the
future HRT will be predicted by the ARMA model using the current flow measurements.
Additionally, the feedback loop will adjust the dosing based on the overall performance. A
scheme of the control algorithm is depicted in Figure 2.
Figure 2. Control algorithm scheme for Mg(OH)2 dosing.
1.3 Case studies
Mg(OH)2 dosing in the Queensberry sewage pump station (SA water) in Adelaide, Australia
Further information can be obtained as follows:

Fact Sheet for Online Control of Dosing Magnesium Hydroxide Control Methodology
SP5 (ARC Sewer Corrosion and Odour Research Project) 5
• Case studies of Mg(OH)2 dosing in sewers:
- Paper: On-line control of magnesium hydroxide dosing for sulfide
mitigation in sewers: Control development and field validation.